Zip Codes with the Highest Percentage of Population Employed in Agriculture, Fishing & Hunting in Jonesboro, GA
RELATED REPORTS & OPTIONS
Agriculture, Fishing & Hunting
Jonesboro
Compare Zip Codes
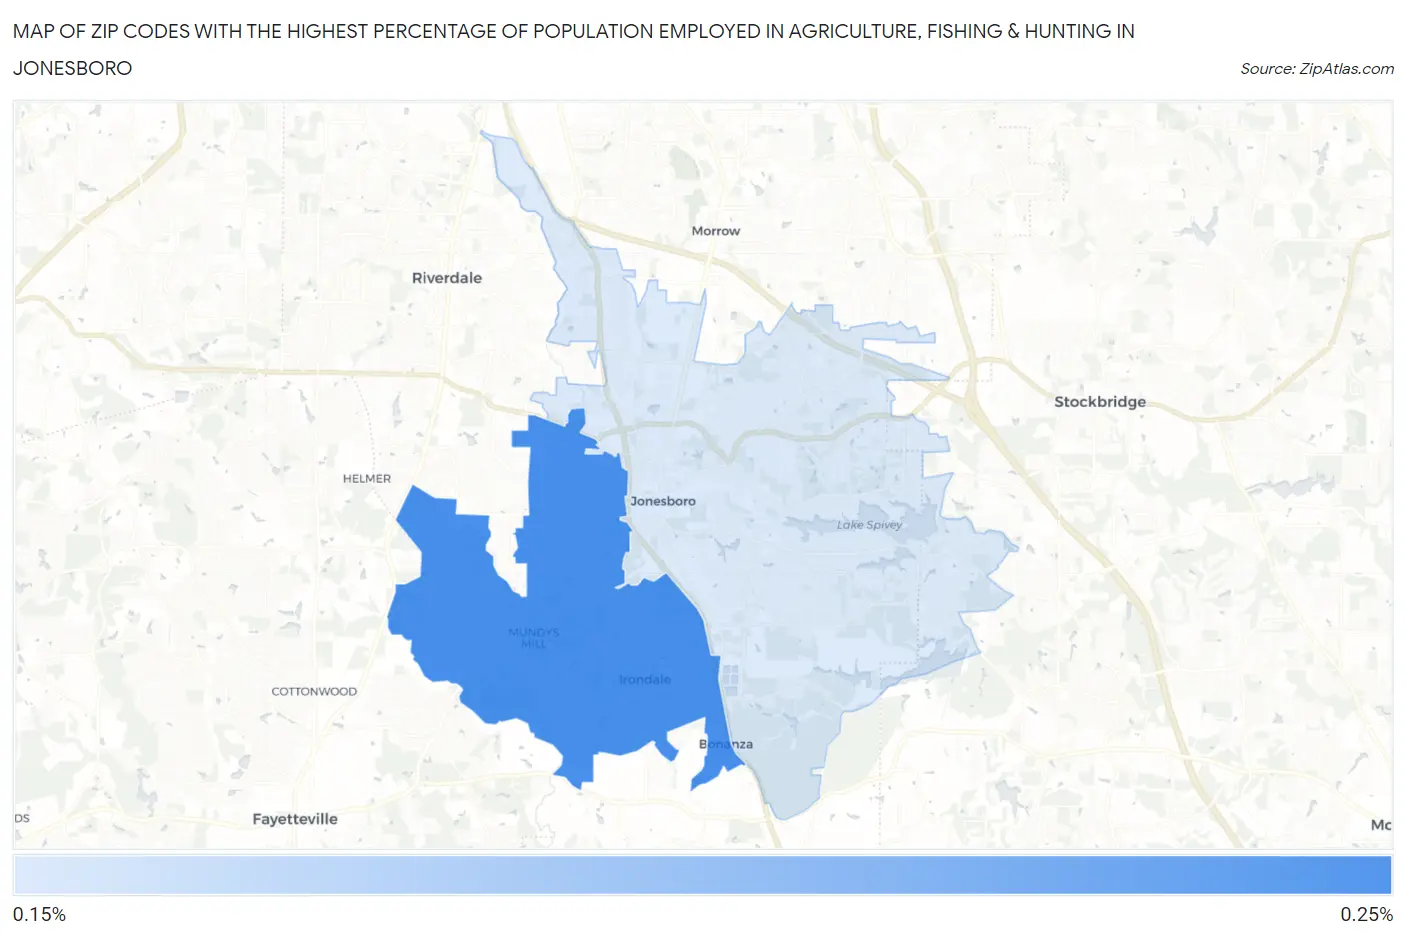
Map of Zip Codes with the Highest Percentage of Population Employed in Agriculture, Fishing & Hunting in Jonesboro
0.15%
0.24%
Zip Codes with the Highest Percentage of Population Employed in Agriculture, Fishing & Hunting in Jonesboro, GA
| Zip Code | % Employed | vs State | vs National | |
| 1. | 30238 | 0.24% | 0.91%(-0.669)#473 | 1.2%(-0.959)#21,877 |
| 2. | 30236 | 0.15% | 0.91%(-0.755)#505 | 1.2%(-1.04)#22,948 |
1
Common Questions
What are the Top Zip Codes with the Highest Percentage of Population Employed in Agriculture, Fishing & Hunting in Jonesboro, GA?
Top Zip Codes with the Highest Percentage of Population Employed in Agriculture, Fishing & Hunting in Jonesboro, GA are:
What zip code has the Highest Percentage of Population Employed in Agriculture, Fishing & Hunting in Jonesboro, GA?
30238 has the Highest Percentage of Population Employed in Agriculture, Fishing & Hunting in Jonesboro, GA with 0.24%.
What is the Percentage of Population Employed in Agriculture, Fishing & Hunting in Georgia?
Percentage of Population Employed in Agriculture, Fishing & Hunting in Georgia is 0.91%.
What is the Percentage of Population Employed in Agriculture, Fishing & Hunting in the United States?
Percentage of Population Employed in Agriculture, Fishing & Hunting in the United States is 1.2%.