Tarrytown, GA Map & Demographics
Tarrytown Map
Tarrytown Overview
$16,916
PER CAPITA INCOME
$46,528
AVG FAMILY INCOME
$40,313
AVG HOUSEHOLD INCOME
0.34
INEQUALITY / GINI INDEX
117
TOTAL POPULATION
64
MALE POPULATION
53
FEMALE POPULATION
120.75
MALES / 100 FEMALES
82.81
FEMALES / 100 MALES
44.4
MEDIAN AGE
3.4
AVG FAMILY SIZE
2.1
AVG HOUSEHOLD SIZE
32
LABOR FORCE [ PEOPLE ]
33.3%
PERCENT IN LABOR FORCE
12.5%
UNEMPLOYMENT RATE
Tarrytown Zip Codes
Tarrytown Area Codes
Income in Tarrytown
Income Overview in Tarrytown
Per Capita Income in Tarrytown is $16,916, while median incomes of families and households are $46,528 and $40,313 respectively.
| Characteristic | Number | Measure |
| Per Capita Income | 117 | $16,916 |
| Median Family Income | 26 | $46,528 |
| Mean Family Income | 26 | $56,027 |
| Median Household Income | 55 | $40,313 |
| Mean Household Income | 55 | $37,393 |
| Income Deficit | 26 | $0 |
| Wage / Income Gap (%) | 117 | 0.00% |
| Wage / Income Gap ($) | 117 | 100.00¢ per $1 |
| Gini / Inequality Index | 117 | 0.34 |
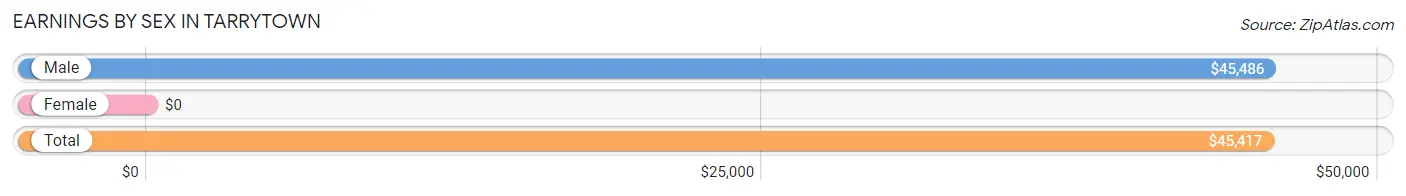
Earnings by Sex in Tarrytown
| Sex | Number | Average Earnings |
| Male | 31 (96.9%) | $45,486 |
| Female | 1 (3.1%) | $0 |
| Total | 32 (100.0%) | $45,417 |
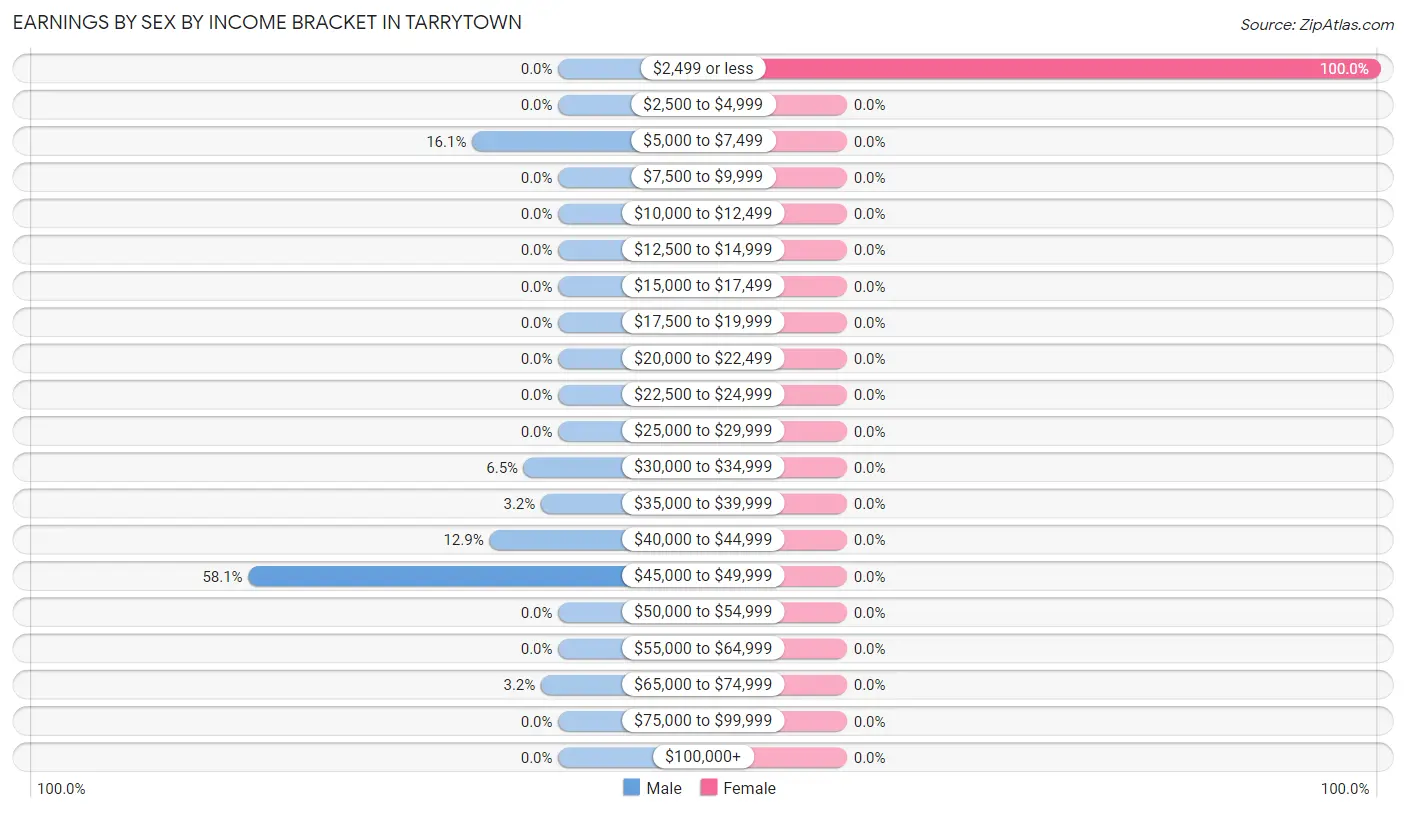
Earnings by Sex by Income Bracket in Tarrytown
The most common earnings brackets in Tarrytown are $45,000 to $49,999 for men (18 | 58.1%) and $2,499 or less for women (1 | 100.0%).
| Income | Male | Female |
| $2,499 or less | 0 (0.0%) | 1 (100.0%) |
| $2,500 to $4,999 | 0 (0.0%) | 0 (0.0%) |
| $5,000 to $7,499 | 5 (16.1%) | 0 (0.0%) |
| $7,500 to $9,999 | 0 (0.0%) | 0 (0.0%) |
| $10,000 to $12,499 | 0 (0.0%) | 0 (0.0%) |
| $12,500 to $14,999 | 0 (0.0%) | 0 (0.0%) |
| $15,000 to $17,499 | 0 (0.0%) | 0 (0.0%) |
| $17,500 to $19,999 | 0 (0.0%) | 0 (0.0%) |
| $20,000 to $22,499 | 0 (0.0%) | 0 (0.0%) |
| $22,500 to $24,999 | 0 (0.0%) | 0 (0.0%) |
| $25,000 to $29,999 | 0 (0.0%) | 0 (0.0%) |
| $30,000 to $34,999 | 2 (6.5%) | 0 (0.0%) |
| $35,000 to $39,999 | 1 (3.2%) | 0 (0.0%) |
| $40,000 to $44,999 | 4 (12.9%) | 0 (0.0%) |
| $45,000 to $49,999 | 18 (58.1%) | 0 (0.0%) |
| $50,000 to $54,999 | 0 (0.0%) | 0 (0.0%) |
| $55,000 to $64,999 | 0 (0.0%) | 0 (0.0%) |
| $65,000 to $74,999 | 1 (3.2%) | 0 (0.0%) |
| $75,000 to $99,999 | 0 (0.0%) | 0 (0.0%) |
| $100,000+ | 0 (0.0%) | 0 (0.0%) |
| Total | 31 (100.0%) | 1 (100.0%) |
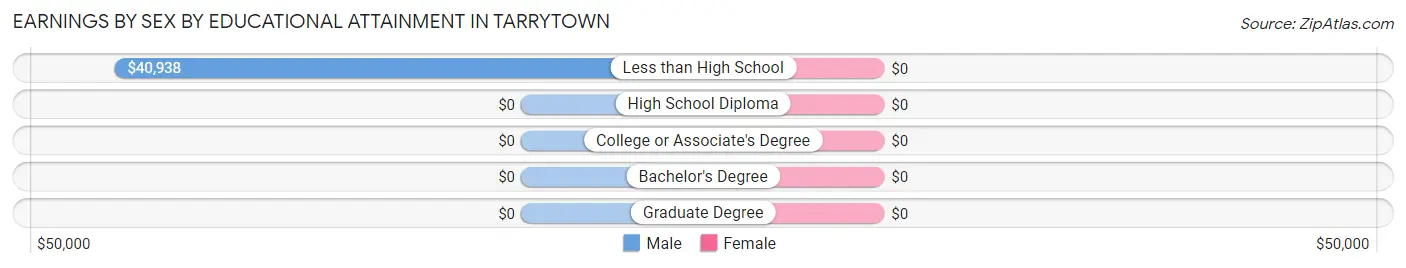
Earnings by Sex by Educational Attainment in Tarrytown
| Educational Attainment | Male Income | Female Income |
| Less than High School | $40,938 | $0 |
| High School Diploma | - | - |
| College or Associate's Degree | - | - |
| Bachelor's Degree | - | - |
| Graduate Degree | - | - |
| Total | $45,833 | $0 |
Family Income in Tarrytown
Family Income Brackets in Tarrytown
According to the Tarrytown family income data, there are 19 families falling into the $35,000 to $49,999 income range, which is the most common income bracket and makes up 73.1% of all families.
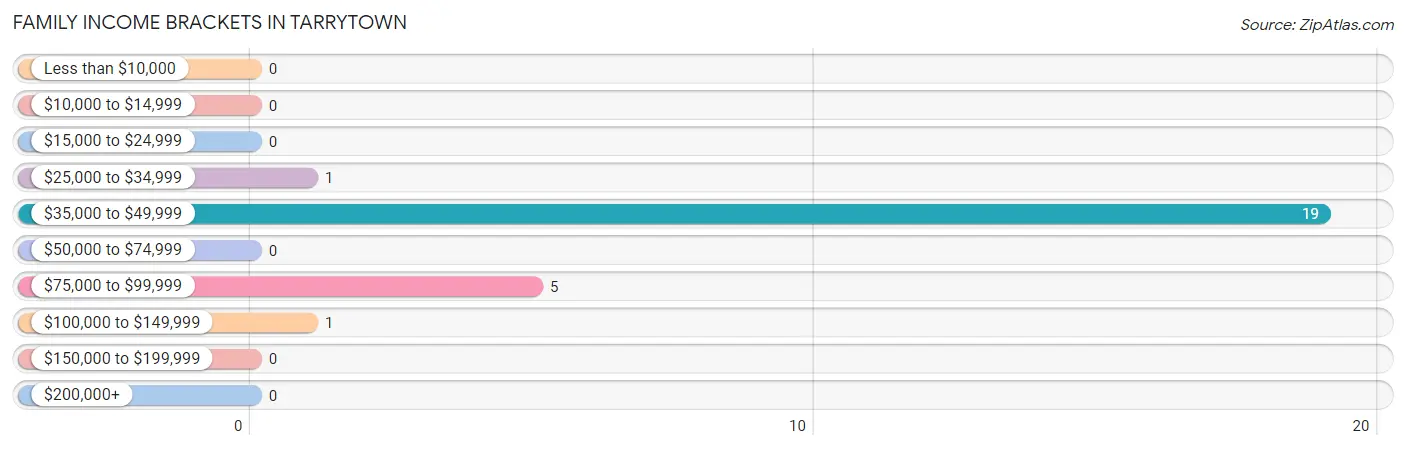
| Income Bracket | # Families | % Families |
| Less than $10,000 | 0 | 0.0% |
| $10,000 to $14,999 | 0 | 0.0% |
| $15,000 to $24,999 | 0 | 0.0% |
| $25,000 to $34,999 | 1 | 3.8% |
| $35,000 to $49,999 | 19 | 73.1% |
| $50,000 to $74,999 | 0 | 0.0% |
| $75,000 to $99,999 | 5 | 19.2% |
| $100,000 to $149,999 | 1 | 3.8% |
| $150,000 to $199,999 | 0 | 0.0% |
| $200,000+ | 0 | 0.0% |
Family Income by Famaliy Size in Tarrytown
2-person families (7 | 26.9%) account for the highest median family income in Tarrytown with $93,750 per family, while 2-person families (7 | 26.9%) have the highest median income of $46,875 per family member.
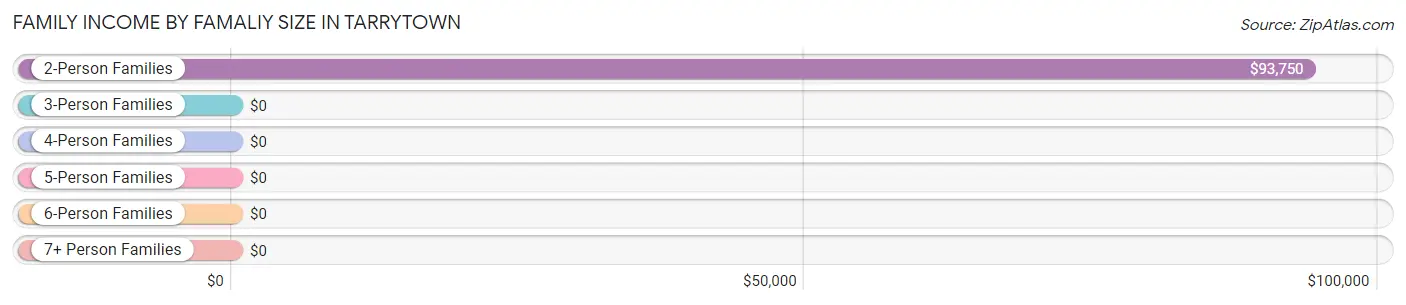
| Income Bracket | # Families | Median Income |
| 2-Person Families | 7 (26.9%) | $93,750 |
| 3-Person Families | 1 (3.8%) | $0 |
| 4-Person Families | 18 (69.2%) | $0 |
| 5-Person Families | 0 (0.0%) | $0 |
| 6-Person Families | 0 (0.0%) | $0 |
| 7+ Person Families | 0 (0.0%) | $0 |
| Total | 26 (100.0%) | $46,528 |
Family Income by Number of Earners in Tarrytown
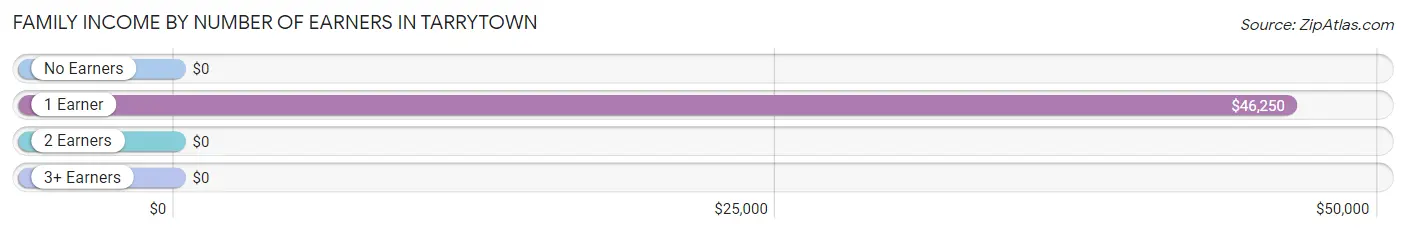
| Number of Earners | # Families | Median Income |
| No Earners | 5 (19.2%) | $0 |
| 1 Earner | 20 (76.9%) | $46,250 |
| 2 Earners | 1 (3.8%) | $0 |
| 3+ Earners | 0 (0.0%) | $0 |
| Total | 26 (100.0%) | $46,528 |
Household Income in Tarrytown
Household Income Brackets in Tarrytown
With 23 households falling in the category, the $35,000 to $49,999 income range is the most frequent in Tarrytown, accounting for 41.8% of all households.
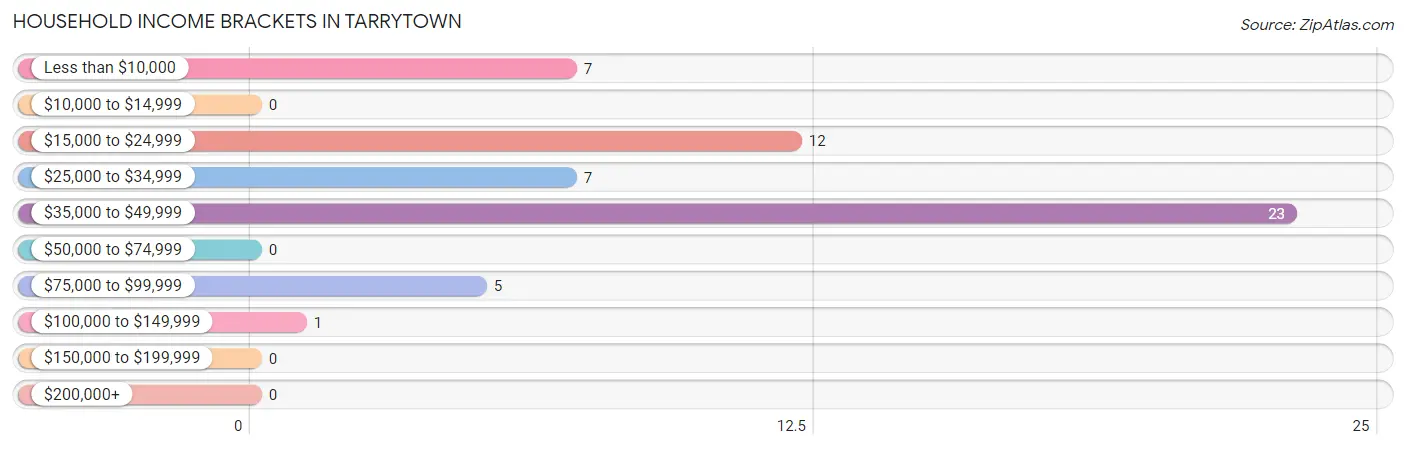
| Income Bracket | # Households | % Households |
| Less than $10,000 | 7 | 12.7% |
| $10,000 to $14,999 | 0 | 0.0% |
| $15,000 to $24,999 | 12 | 21.8% |
| $25,000 to $34,999 | 7 | 12.7% |
| $35,000 to $49,999 | 23 | 41.8% |
| $50,000 to $74,999 | 0 | 0.0% |
| $75,000 to $99,999 | 5 | 9.1% |
| $100,000 to $149,999 | 1 | 1.8% |
| $150,000 to $199,999 | 0 | 0.0% |
| $200,000+ | 0 | 0.0% |
Household Income by Householder Age in Tarrytown
The median household income in Tarrytown is $40,313, with the highest median household income of $46,111 found in the 25 to 44 years age bracket for the primary householder. A total of 20 households (36.4%) fall into this category. Meanwhile, the 15 to 24 years age bracket for the primary householder has the lowest median household income of $0, with 5 households (9.1%) in this group.
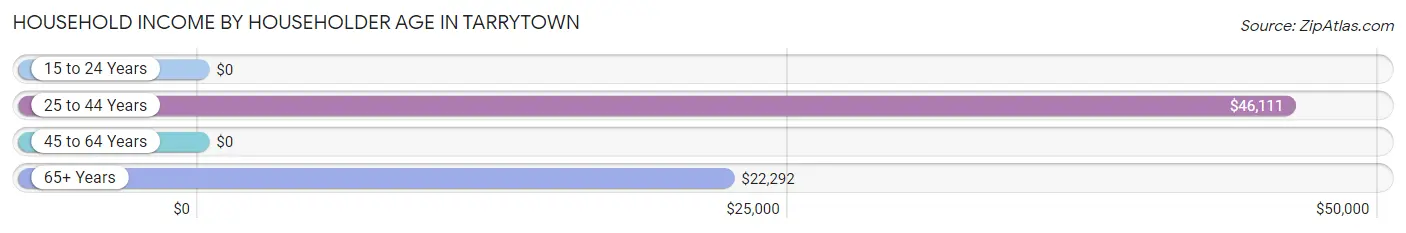
| Income Bracket | # Households | Median Income |
| 15 to 24 Years | 5 (9.1%) | $0 |
| 25 to 44 Years | 20 (36.4%) | $46,111 |
| 45 to 64 Years | 4 (7.3%) | $0 |
| 65+ Years | 26 (47.3%) | $22,292 |
| Total | 55 (100.0%) | $40,313 |
Poverty in Tarrytown
Income Below Poverty by Sex and Age in Tarrytown
With 7.8% poverty level for males and 3.8% for females among the residents of Tarrytown, 18 to 24 year old males and 75 year old and over females are the most vulnerable to poverty, with 5 males (100.0%) and 2 females (16.7%) in their respective age groups living below the poverty level.
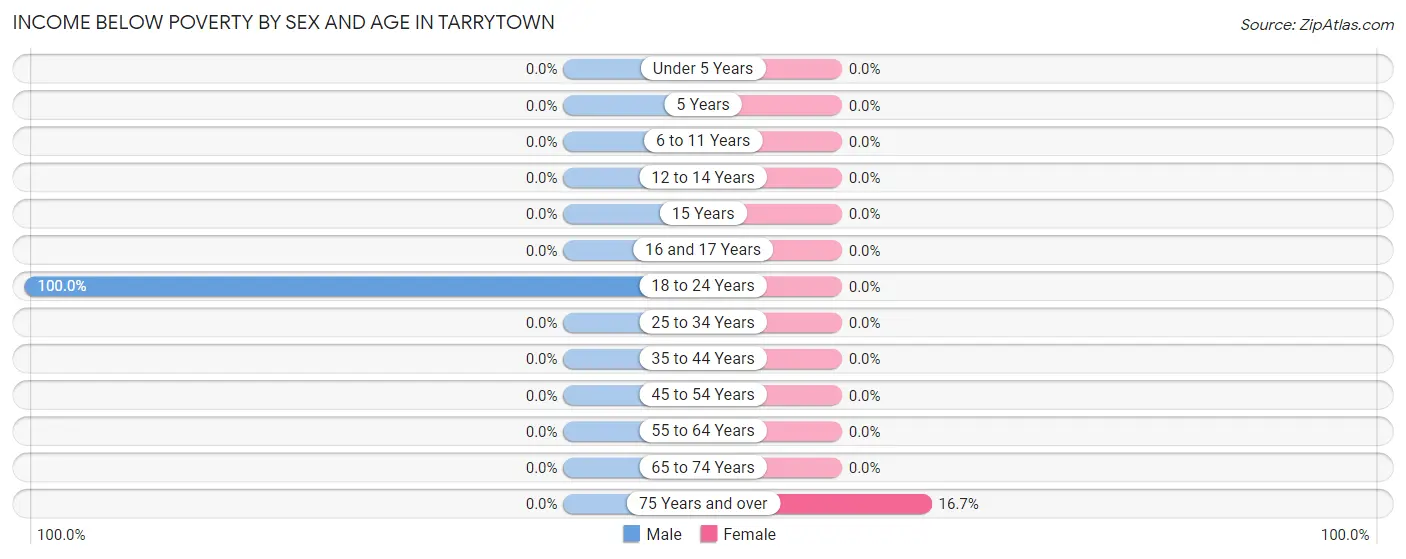
| Age Bracket | Male | Female |
| Under 5 Years | 0 (0.0%) | 0 (0.0%) |
| 5 Years | 0 (0.0%) | 0 (0.0%) |
| 6 to 11 Years | 0 (0.0%) | 0 (0.0%) |
| 12 to 14 Years | 0 (0.0%) | 0 (0.0%) |
| 15 Years | 0 (0.0%) | 0 (0.0%) |
| 16 and 17 Years | 0 (0.0%) | 0 (0.0%) |
| 18 to 24 Years | 5 (100.0%) | 0 (0.0%) |
| 25 to 34 Years | 0 (0.0%) | 0 (0.0%) |
| 35 to 44 Years | 0 (0.0%) | 0 (0.0%) |
| 45 to 54 Years | 0 (0.0%) | 0 (0.0%) |
| 55 to 64 Years | 0 (0.0%) | 0 (0.0%) |
| 65 to 74 Years | 0 (0.0%) | 0 (0.0%) |
| 75 Years and over | 0 (0.0%) | 2 (16.7%) |
| Total | 5 (7.8%) | 2 (3.8%) |
Income Above Poverty by Sex and Age in Tarrytown
According to the poverty statistics in Tarrytown, males aged 6 to 11 years and females aged 25 to 34 years are the age groups that are most secure financially, with 100.0% of males and 100.0% of females in these age groups living above the poverty line.
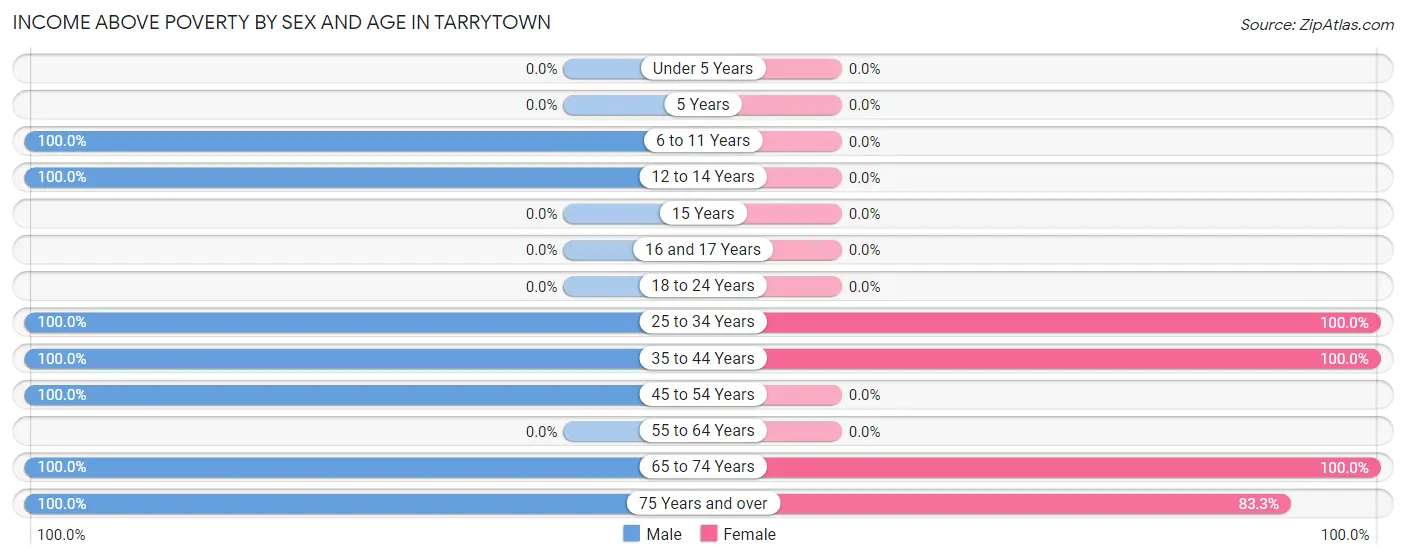
| Age Bracket | Male | Female |
| Under 5 Years | 0 (0.0%) | 0 (0.0%) |
| 5 Years | 0 (0.0%) | 0 (0.0%) |
| 6 to 11 Years | 10 (100.0%) | 0 (0.0%) |
| 12 to 14 Years | 11 (100.0%) | 0 (0.0%) |
| 15 Years | 0 (0.0%) | 0 (0.0%) |
| 16 and 17 Years | 0 (0.0%) | 0 (0.0%) |
| 18 to 24 Years | 0 (0.0%) | 0 (0.0%) |
| 25 to 34 Years | 2 (100.0%) | 1 (100.0%) |
| 35 to 44 Years | 19 (100.0%) | 27 (100.0%) |
| 45 to 54 Years | 4 (100.0%) | 0 (0.0%) |
| 55 to 64 Years | 0 (0.0%) | 0 (0.0%) |
| 65 to 74 Years | 7 (100.0%) | 13 (100.0%) |
| 75 Years and over | 6 (100.0%) | 10 (83.3%) |
| Total | 59 (92.2%) | 51 (96.2%) |
Income Below Poverty Among Married-Couple Families in Tarrytown
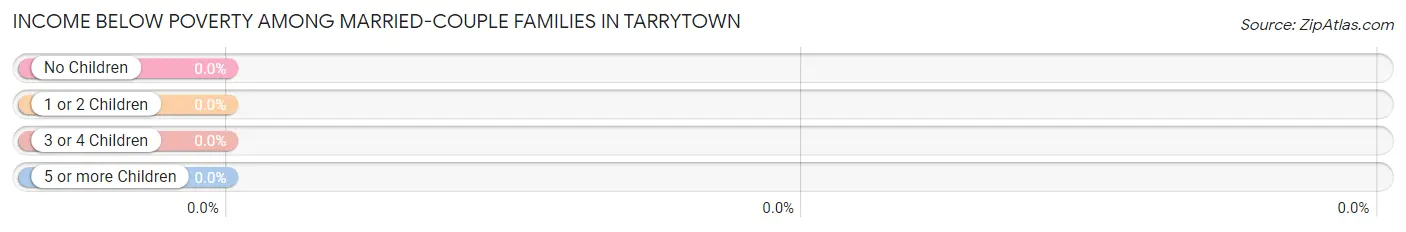
| Children | Above Poverty | Below Poverty |
| No Children | 7 (100.0%) | 0 (0.0%) |
| 1 or 2 Children | 18 (100.0%) | 0 (0.0%) |
| 3 or 4 Children | 0 (0.0%) | 0 (0.0%) |
| 5 or more Children | 0 (0.0%) | 0 (0.0%) |
| Total | 25 (100.0%) | 0 (0.0%) |
Income Below Poverty Among Single-Parent Households in Tarrytown
| Children | Single Father | Single Mother |
| No Children | 0 (0.0%) | 0 (0.0%) |
| 1 or 2 Children | 0 (0.0%) | 0 (0.0%) |
| 3 or 4 Children | 0 (0.0%) | 0 (0.0%) |
| 5 or more Children | 0 (0.0%) | 0 (0.0%) |
| Total | 0 (0.0%) | 0 (0.0%) |
Income Below Poverty Among Married-Couple vs Single-Parent Households in Tarrytown
| Children | Married-Couple Families | Single-Parent Households |
| No Children | 0 (0.0%) | 0 (0.0%) |
| 1 or 2 Children | 0 (0.0%) | 0 (0.0%) |
| 3 or 4 Children | 0 (0.0%) | 0 (0.0%) |
| 5 or more Children | 0 (0.0%) | 0 (0.0%) |
| Total | 0 (0.0%) | 0 (0.0%) |
Race in Tarrytown
The most populous races in Tarrytown are White / Caucasian (110 | 94.0%), Black / African American (7 | 6.0%), and Hispanic or Latino (5 | 4.3%).
| Race | # Population | % Population |
| Asian | 0 | 0.0% |
| Black / African American | 7 | 6.0% |
| Hawaiian / Pacific | 0 | 0.0% |
| Hispanic or Latino | 5 | 4.3% |
| Native / Alaskan | 0 | 0.0% |
| White / Caucasian | 110 | 94.0% |
| Two or more Races | 0 | 0.0% |
| Some other Race | 0 | 0.0% |
| Total | 117 | 100.0% |
Ancestry in Tarrytown
The most populous ancestries reported in Tarrytown are American (16 | 13.7%), Colombian (5 | 4.3%), Scandinavian (5 | 4.3%), South American (5 | 4.3%), and English (2 | 1.7%), together accounting for 28.2% of all Tarrytown residents.
| Ancestry | # Population | % Population |
| American | 16 | 13.7% |
| Colombian | 5 | 4.3% |
| English | 2 | 1.7% |
| Scandinavian | 5 | 4.3% |
| South American | 5 | 4.3% | View All 5 Rows |
Immigrants in Tarrytown

| Immigration Origin | # Population | % Population | View All 0 Rows |
Sex and Age in Tarrytown
Sex and Age in Tarrytown
The most populous age groups in Tarrytown are 10 to 14 Years (21 | 32.8%) for men and 40 to 44 Years (27 | 50.9%) for women.
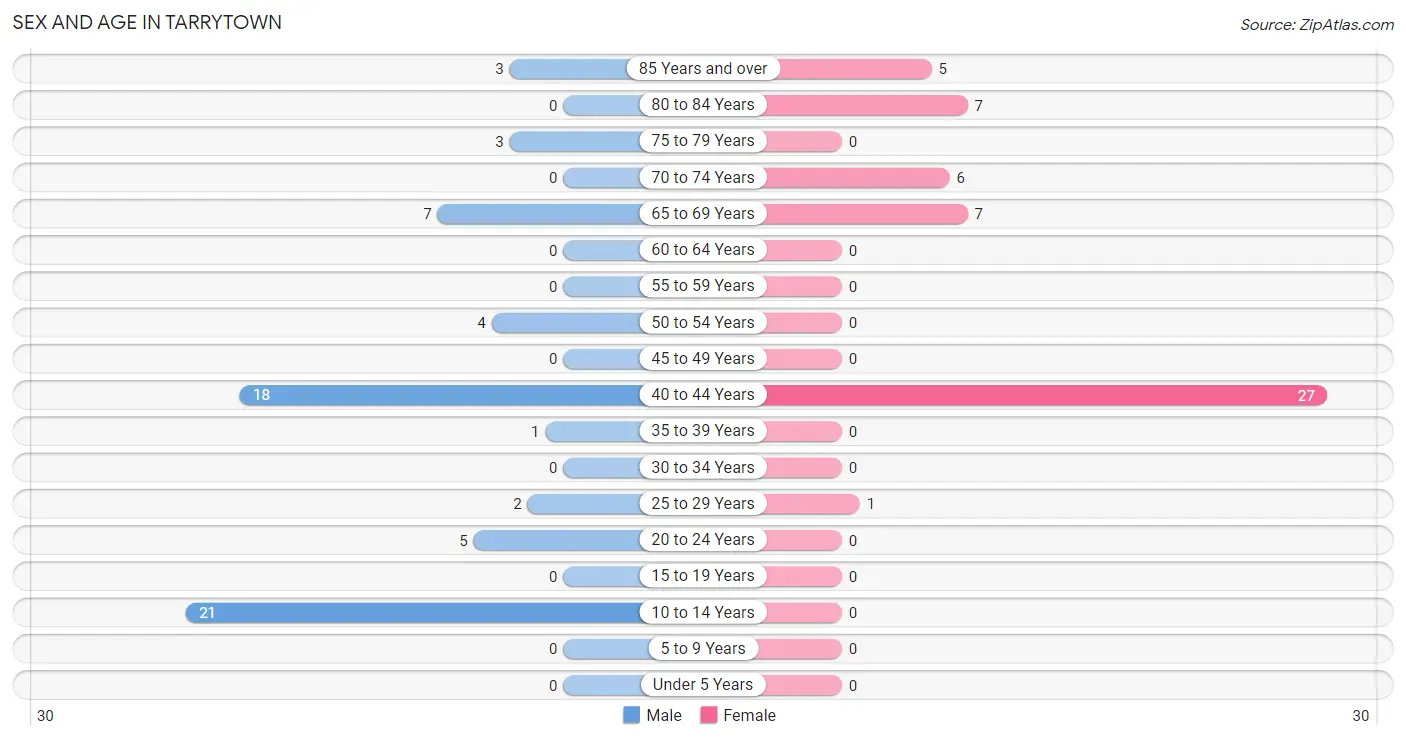
| Age Bracket | Male | Female |
| Under 5 Years | 0 (0.0%) | 0 (0.0%) |
| 5 to 9 Years | 0 (0.0%) | 0 (0.0%) |
| 10 to 14 Years | 21 (32.8%) | 0 (0.0%) |
| 15 to 19 Years | 0 (0.0%) | 0 (0.0%) |
| 20 to 24 Years | 5 (7.8%) | 0 (0.0%) |
| 25 to 29 Years | 2 (3.1%) | 1 (1.9%) |
| 30 to 34 Years | 0 (0.0%) | 0 (0.0%) |
| 35 to 39 Years | 1 (1.6%) | 0 (0.0%) |
| 40 to 44 Years | 18 (28.1%) | 27 (50.9%) |
| 45 to 49 Years | 0 (0.0%) | 0 (0.0%) |
| 50 to 54 Years | 4 (6.2%) | 0 (0.0%) |
| 55 to 59 Years | 0 (0.0%) | 0 (0.0%) |
| 60 to 64 Years | 0 (0.0%) | 0 (0.0%) |
| 65 to 69 Years | 7 (10.9%) | 7 (13.2%) |
| 70 to 74 Years | 0 (0.0%) | 6 (11.3%) |
| 75 to 79 Years | 3 (4.7%) | 0 (0.0%) |
| 80 to 84 Years | 0 (0.0%) | 7 (13.2%) |
| 85 Years and over | 3 (4.7%) | 5 (9.4%) |
| Total | 64 (100.0%) | 53 (100.0%) |
Families and Households in Tarrytown
Median Family Size in Tarrytown
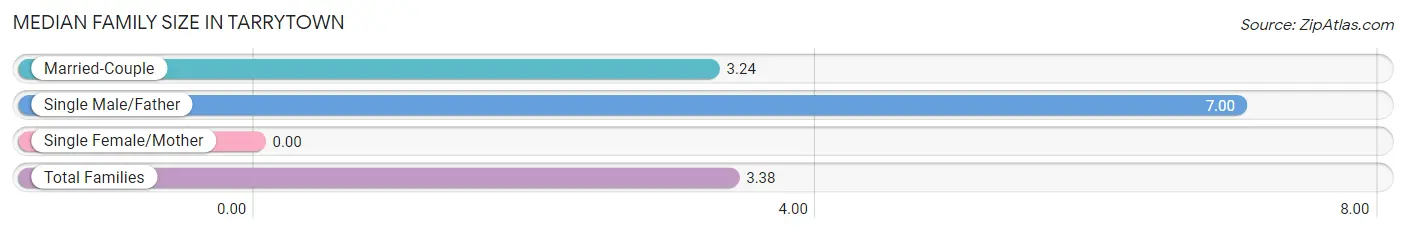
| Family Type | # Families | Family Size |
| Married-Couple | 25 (96.2%) | 3.24 |
| Single Male/Father | 1 (3.8%) | 7.00 |
| Single Female/Mother | 0 (0.0%) | - |
| Total Families | 26 (100.0%) | 3.38 |
Median Household Size in Tarrytown
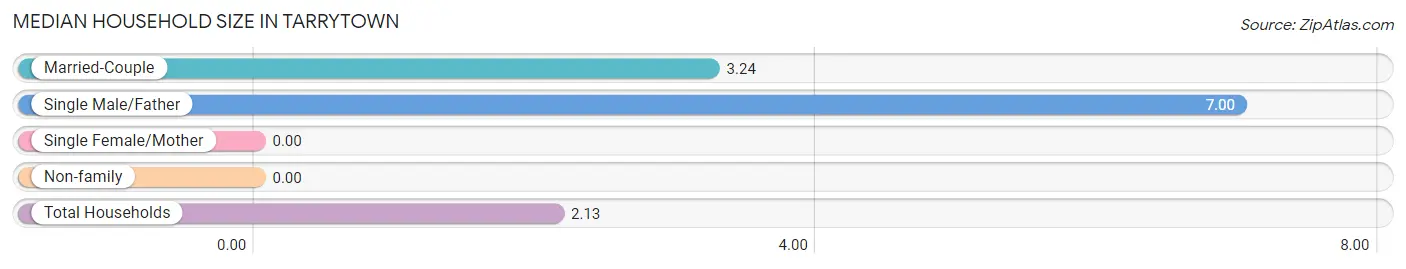
| Household Type | # Households | Household Size |
| Married-Couple | 25 (45.5%) | 3.24 |
| Single Male/Father | 1 (1.8%) | 7.00 |
| Single Female/Mother | 0 (0.0%) | - |
| Non-family | 29 (52.7%) | - |
| Total Households | 55 (100.0%) | 2.13 |
Household Size by Marriage Status in Tarrytown
Out of a total of 55 households in Tarrytown, 26 (47.3%) are family households, while 29 (52.7%) are nonfamily households. The most numerous type of family households are 4-person households, comprising 18, and the most common type of nonfamily households are 1-person households, comprising 29.
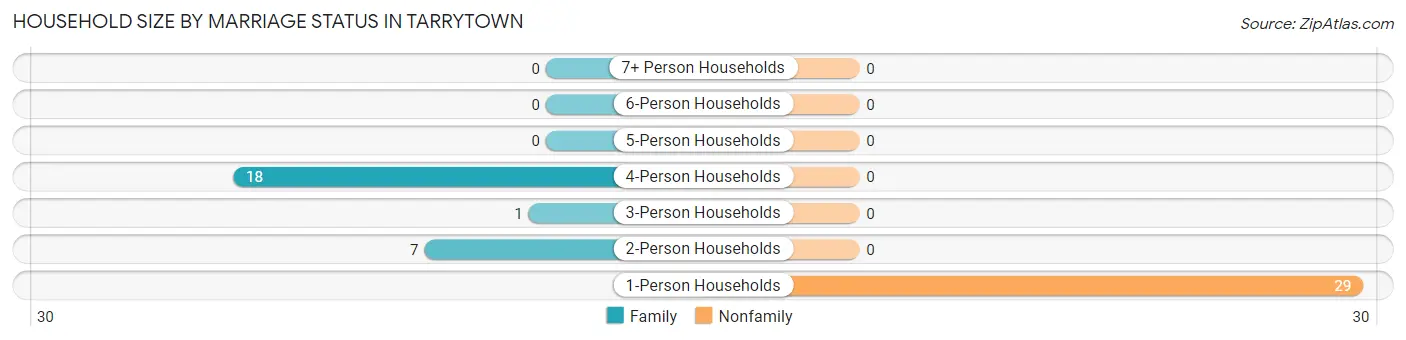
| Household Size | Family Households | Nonfamily Households |
| 1-Person Households | - | 29 (52.7%) |
| 2-Person Households | 7 (12.7%) | 0 (0.0%) |
| 3-Person Households | 1 (1.8%) | 0 (0.0%) |
| 4-Person Households | 18 (32.7%) | 0 (0.0%) |
| 5-Person Households | 0 (0.0%) | 0 (0.0%) |
| 6-Person Households | 0 (0.0%) | 0 (0.0%) |
| 7+ Person Households | 0 (0.0%) | 0 (0.0%) |
| Total | 26 (47.3%) | 29 (52.7%) |
Female Fertility in Tarrytown
Fertility by Age in Tarrytown
| Age Bracket | Women with Births | Births / 1,000 Women |
| 15 to 19 years | 0 (0.0%) | 0.0 |
| 20 to 34 years | 0 (0.0%) | 0.0 |
| 35 to 50 years | 0 (0.0%) | 0.0 |
| Total | 0 (0.0%) | 0.0 |
Fertility by Age by Marriage Status in Tarrytown
| Age Bracket | Married | Unmarried |
| 15 to 19 years | 0 (0.0%) | 0 (0.0%) |
| 20 to 34 years | 0 (0.0%) | 0 (0.0%) |
| 35 to 50 years | 0 (0.0%) | 0 (0.0%) |
| Total | 0 (0.0%) | 0 (0.0%) |
Fertility by Education in Tarrytown
| Educational Attainment | Women with Births | Births / 1,000 Women |
| Less than High School | 0 (0.0%) | 0.0 |
| High School Diploma | 0 (0.0%) | 0.0 |
| College or Associate's Degree | 0 (0.0%) | 0.0 |
| Bachelor's Degree | 0 (0.0%) | 0.0 |
| Graduate Degree | 0 (0.0%) | 0.0 |
| Total | 0 (0.0%) | 0.0 |
Fertility by Education by Marriage Status in Tarrytown
| Educational Attainment | Married | Unmarried |
| Less than High School | 0 (0.0%) | 0 (0.0%) |
| High School Diploma | 0 (0.0%) | 0 (0.0%) |
| College or Associate's Degree | 0 (0.0%) | 0 (0.0%) |
| Bachelor's Degree | 0 (0.0%) | 0 (0.0%) |
| Graduate Degree | 0 (0.0%) | 0 (0.0%) |
| Total | 0 (0.0%) | 0 (0.0%) |
Employment Characteristics in Tarrytown
Employment by Class of Employer in Tarrytown
Among the 28 employed individuals in Tarrytown, not-for-profit organizations (18 | 64.3%), private company employees (9 | 32.1%), and local government employees (1 | 3.6%) make up the most common classes of employment.
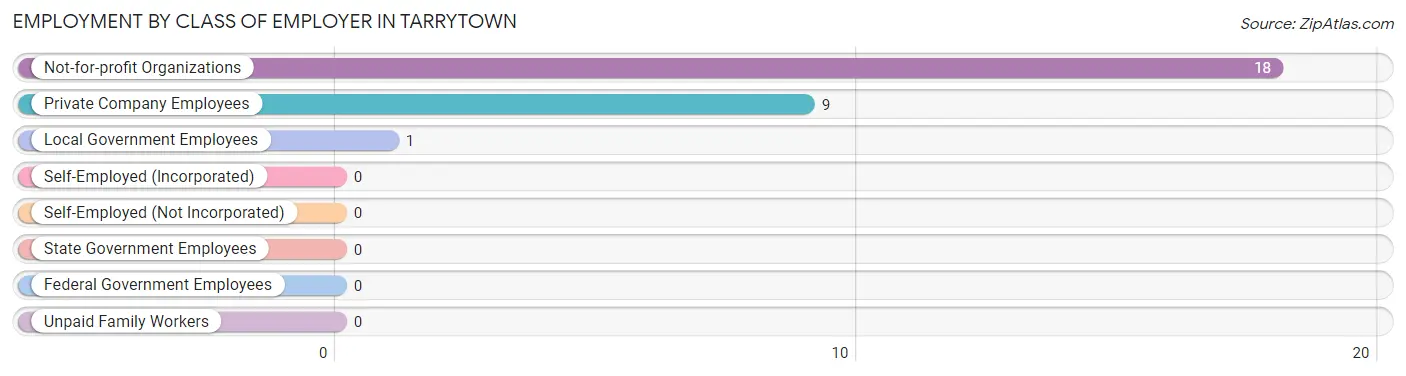
| Employer Class | # Employees | % Employees |
| Private Company Employees | 9 | 32.1% |
| Self-Employed (Incorporated) | 0 | 0.0% |
| Self-Employed (Not Incorporated) | 0 | 0.0% |
| Not-for-profit Organizations | 18 | 64.3% |
| Local Government Employees | 1 | 3.6% |
| State Government Employees | 0 | 0.0% |
| Federal Government Employees | 0 | 0.0% |
| Unpaid Family Workers | 0 | 0.0% |
| Total | 28 | 100.0% |
Employment Status by Age in Tarrytown
According to the labor force statistics for Tarrytown, out of the total population over 16 years of age (96), 33.3% or 32 individuals are in the labor force, with 12.5% or 4 of them unemployed. The age group with the highest labor force participation rate is 20 to 24 years, with 100.0% or 5 individuals in the labor force. Within the labor force, the 45 to 54 years age range has the highest percentage of unemployed individuals, with 100.0% or 4 of them being unemployed.
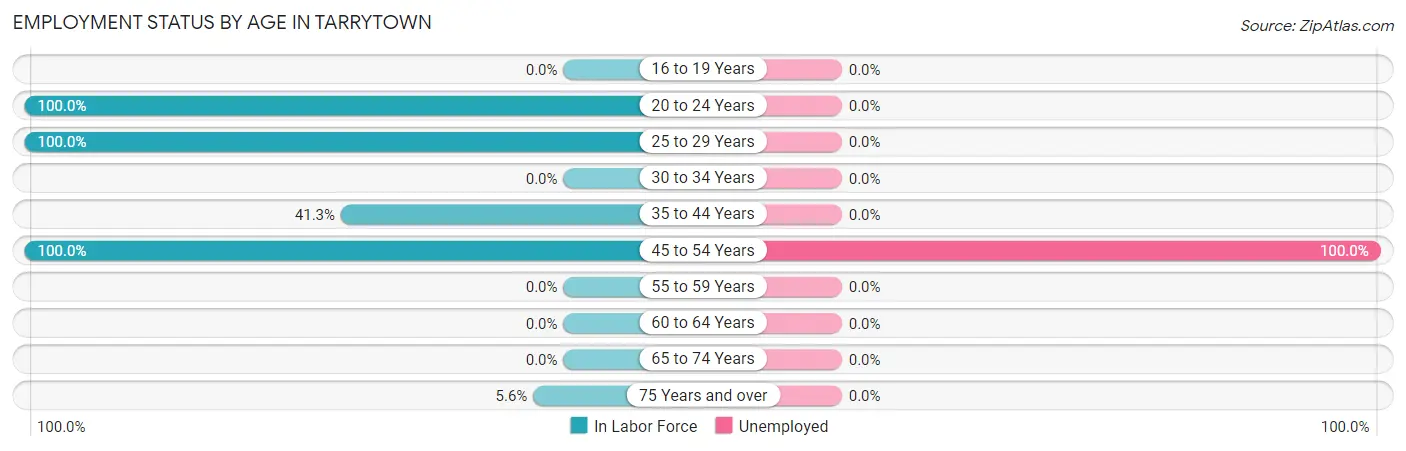
| Age Bracket | In Labor Force | Unemployed |
| 16 to 19 Years | 0 (0.0%) | 0 (0.0%) |
| 20 to 24 Years | 5 (100.0%) | 0 (0.0%) |
| 25 to 29 Years | 3 (100.0%) | 0 (0.0%) |
| 30 to 34 Years | 0 (0.0%) | 0 (0.0%) |
| 35 to 44 Years | 19 (41.3%) | 0 (0.0%) |
| 45 to 54 Years | 4 (100.0%) | 4 (100.0%) |
| 55 to 59 Years | 0 (0.0%) | 0 (0.0%) |
| 60 to 64 Years | 0 (0.0%) | 0 (0.0%) |
| 65 to 74 Years | 0 (0.0%) | 0 (0.0%) |
| 75 Years and over | 1 (5.6%) | 0 (0.0%) |
| Total | 32 (33.3%) | 4 (12.5%) |
Employment Status by Educational Attainment in Tarrytown
According to labor force statistics for Tarrytown, 49.1% of individuals (26) out of the total population between 25 and 64 years of age (53) are in the labor force, with 15.4% or 4 of them being unemployed. The group with the highest labor force participation rate are those with the educational attainment of less than high school, with 100.0% or 6 individuals in the labor force. Within the labor force, individuals with less than high school education have the highest percentage of unemployment, with 66.7% or 4 of them being unemployed.
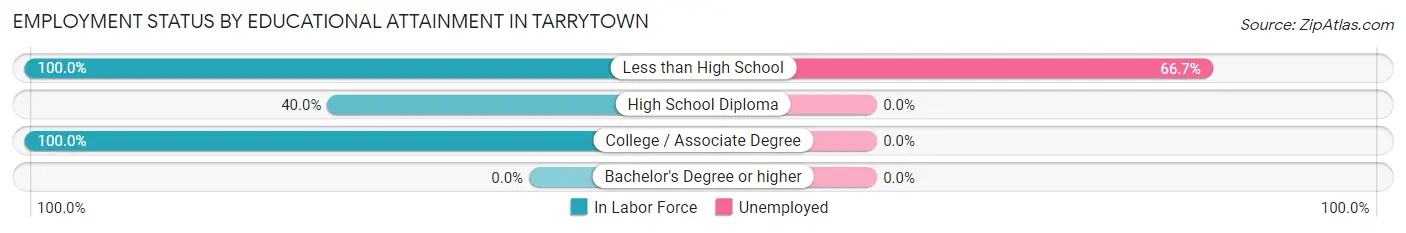
| Educational Attainment | In Labor Force | Unemployed |
| Less than High School | 6 (100.0%) | 4 (66.7%) |
| High School Diploma | 18 (40.0%) | 0 (0.0%) |
| College / Associate Degree | 2 (100.0%) | 0 (0.0%) |
| Bachelor's Degree or higher | 0 (0.0%) | 0 (0.0%) |
| Total | 26 (49.1%) | 8 (15.4%) |
Employment Occupations by Sex in Tarrytown
Management, Business, Science and Arts Occupations
The most common Management, Business, Science and Arts occupations in Tarrytown are Community & Social Service (7 | 25.0%), Education Instruction & Library (7 | 25.0%), and Management (2 | 7.1%).
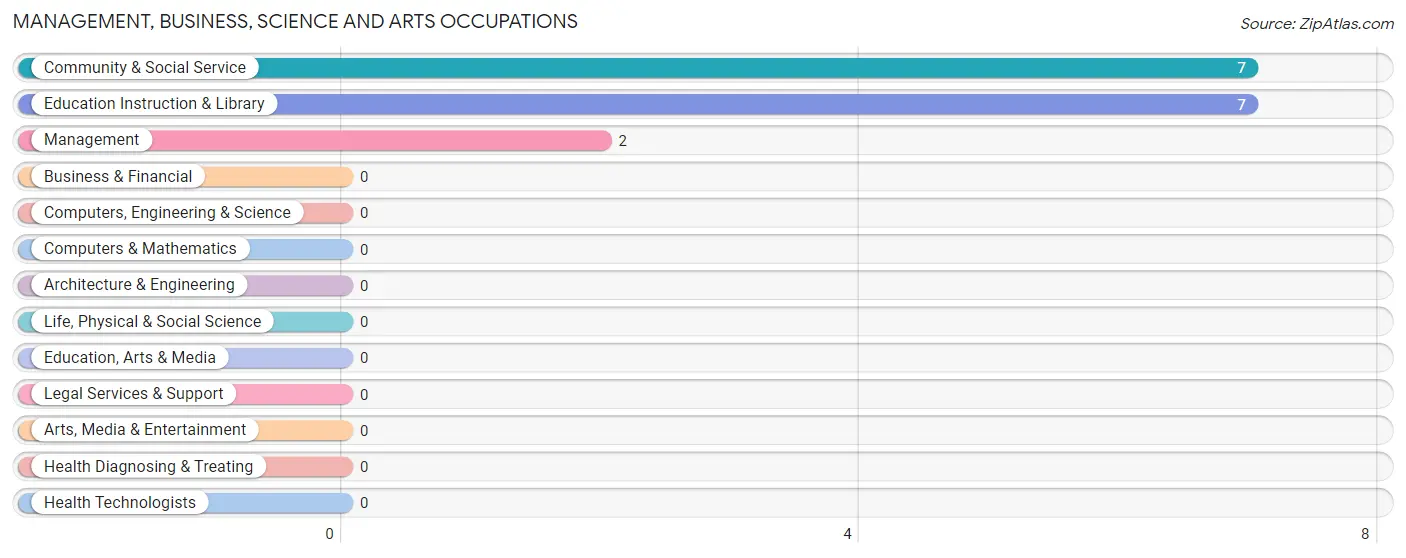
Management, Business, Science and Arts Occupations by Sex
Within the Management, Business, Science and Arts occupations in Tarrytown, the most male-oriented occupations are Management (100.0%), Community & Social Service (85.7%), and Education Instruction & Library (85.7%), while the most female-oriented occupations are Community & Social Service (14.3%), and Education Instruction & Library (14.3%).
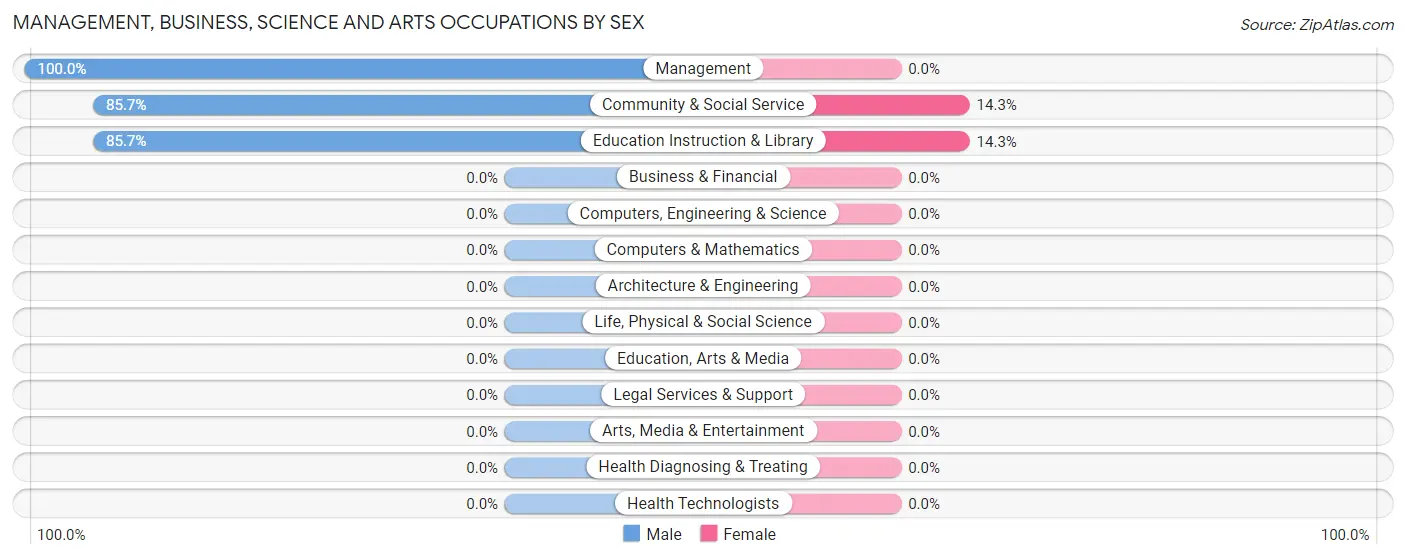
| Occupation | Male | Female |
| Management | 2 (100.0%) | 0 (0.0%) |
| Business & Financial | 0 (0.0%) | 0 (0.0%) |
| Computers, Engineering & Science | 0 (0.0%) | 0 (0.0%) |
| Computers & Mathematics | 0 (0.0%) | 0 (0.0%) |
| Architecture & Engineering | 0 (0.0%) | 0 (0.0%) |
| Life, Physical & Social Science | 0 (0.0%) | 0 (0.0%) |
| Community & Social Service | 6 (85.7%) | 1 (14.3%) |
| Education, Arts & Media | 0 (0.0%) | 0 (0.0%) |
| Legal Services & Support | 0 (0.0%) | 0 (0.0%) |
| Education Instruction & Library | 6 (85.7%) | 1 (14.3%) |
| Arts, Media & Entertainment | 0 (0.0%) | 0 (0.0%) |
| Health Diagnosing & Treating | 0 (0.0%) | 0 (0.0%) |
| Health Technologists | 0 (0.0%) | 0 (0.0%) |
| Total (Category) | 8 (88.9%) | 1 (11.1%) |
| Total (Overall) | 27 (96.4%) | 1 (3.6%) |
Services Occupations
Services Occupations by Sex
| Occupation | Male | Female |
| Healthcare Support | 0 (0.0%) | 0 (0.0%) |
| Security & Protection | 0 (0.0%) | 0 (0.0%) |
| Firefighting & Prevention | 0 (0.0%) | 0 (0.0%) |
| Law Enforcement | 0 (0.0%) | 0 (0.0%) |
| Food Preparation & Serving | 0 (0.0%) | 0 (0.0%) |
| Cleaning & Maintenance | 0 (0.0%) | 0 (0.0%) |
| Personal Care & Service | 0 (0.0%) | 0 (0.0%) |
| Total (Category) | 0 (0.0%) | 0 (0.0%) |
| Total (Overall) | 27 (96.4%) | 1 (3.6%) |
Sales and Office Occupations

Sales and Office Occupations by Sex

| Occupation | Male | Female |
| Sales & Related | 0 (0.0%) | 0 (0.0%) |
| Office & Administration | 0 (0.0%) | 0 (0.0%) |
| Total (Category) | 0 (0.0%) | 0 (0.0%) |
| Total (Overall) | 27 (96.4%) | 1 (3.6%) |
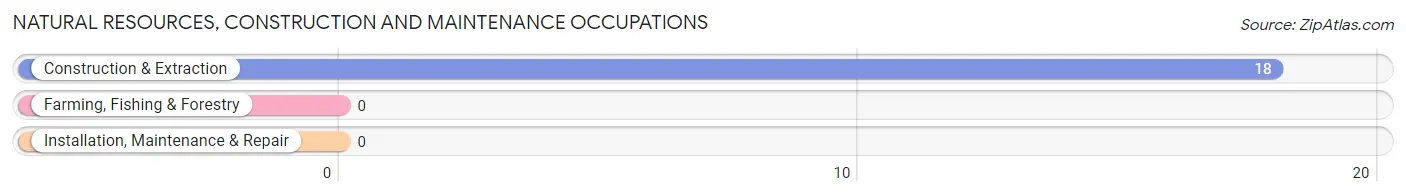
Natural Resources, Construction and Maintenance Occupations
The most common Natural Resources, Construction and Maintenance occupations in Tarrytown are , and Construction & Extraction (18 | 64.3%).
Natural Resources, Construction and Maintenance Occupations by Sex

| Occupation | Male | Female |
| Farming, Fishing & Forestry | 0 (0.0%) | 0 (0.0%) |
| Construction & Extraction | 18 (100.0%) | 0 (0.0%) |
| Installation, Maintenance & Repair | 0 (0.0%) | 0 (0.0%) |
| Total (Category) | 18 (100.0%) | 0 (0.0%) |
| Total (Overall) | 27 (96.4%) | 1 (3.6%) |
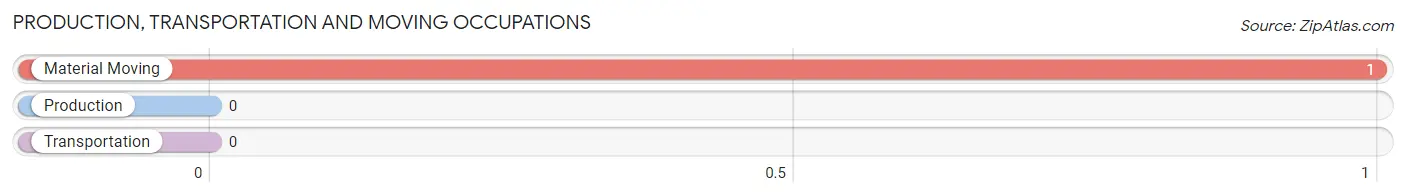
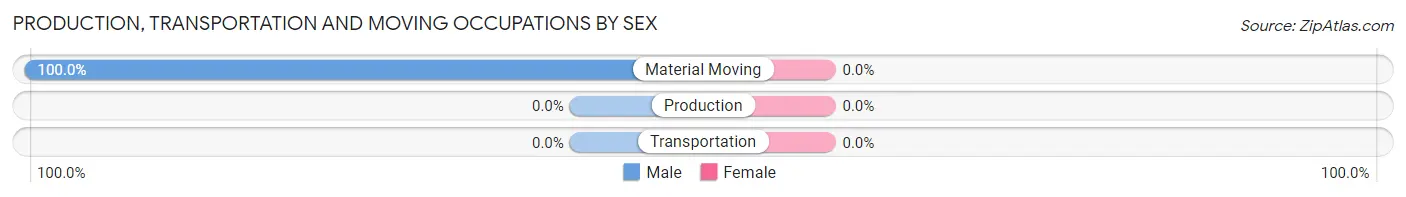
Production, Transportation and Moving Occupations
The most common Production, Transportation and Moving occupations in Tarrytown are , and Material Moving (1 | 3.6%).
Production, Transportation and Moving Occupations by Sex
| Occupation | Male | Female |
| Production | 0 (0.0%) | 0 (0.0%) |
| Transportation | 0 (0.0%) | 0 (0.0%) |
| Material Moving | 1 (100.0%) | 0 (0.0%) |
| Total (Category) | 1 (100.0%) | 0 (0.0%) |
| Total (Overall) | 27 (96.4%) | 1 (3.6%) |
Employment Industries by Sex in Tarrytown
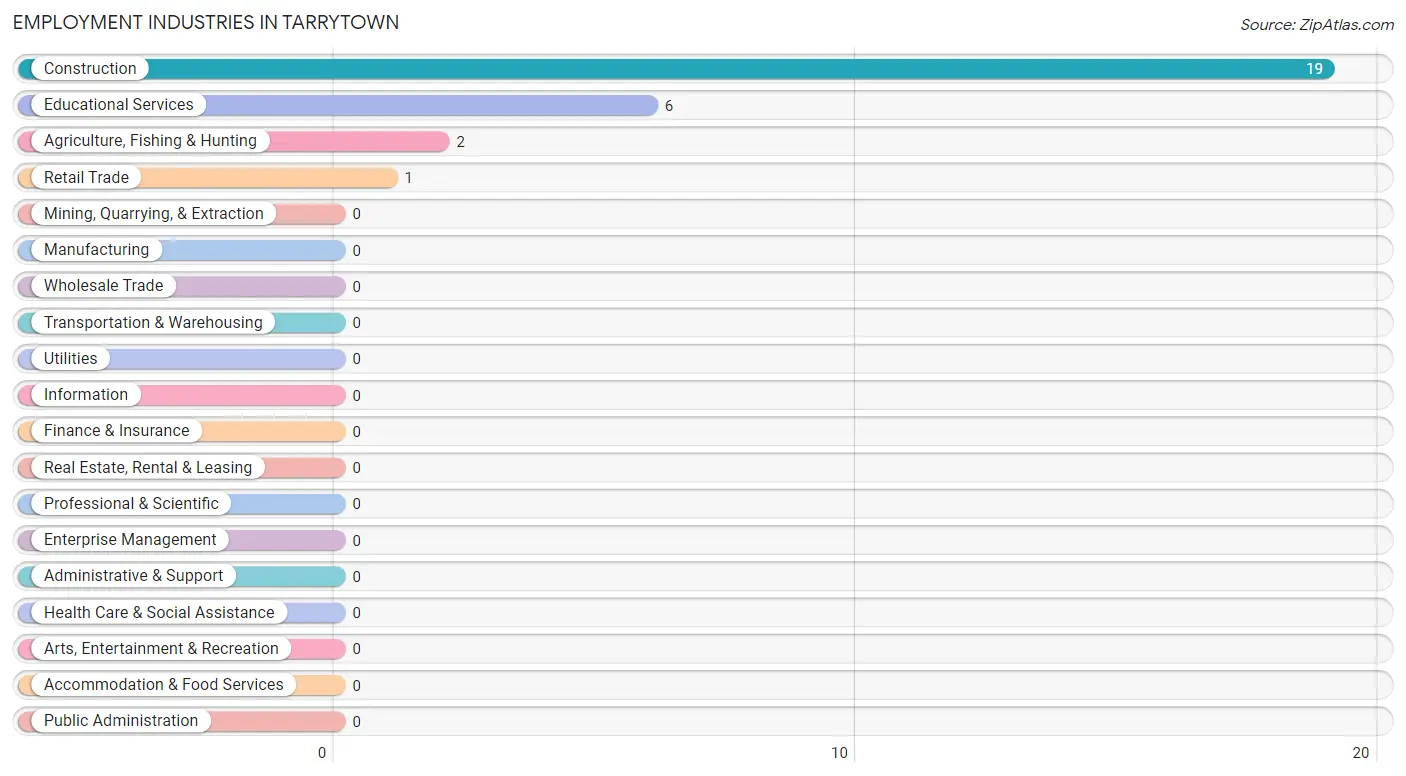
Employment Industries in Tarrytown
The major employment industries in Tarrytown include Construction (19 | 67.9%), Educational Services (6 | 21.4%), Agriculture, Fishing & Hunting (2 | 7.1%), and Retail Trade (1 | 3.6%).
Employment Industries by Sex in Tarrytown
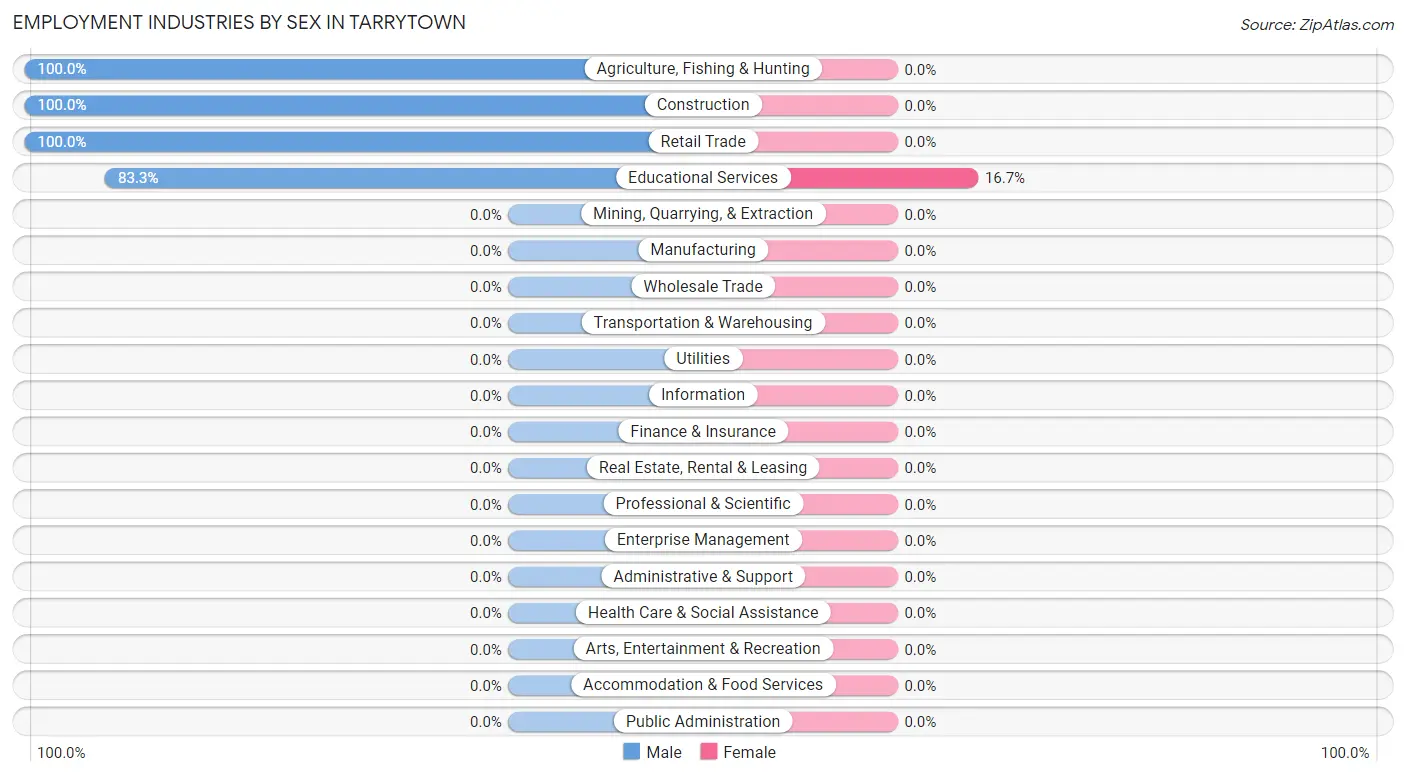
| Industry | Male | Female |
| Agriculture, Fishing & Hunting | 2 (100.0%) | 0 (0.0%) |
| Mining, Quarrying, & Extraction | 0 (0.0%) | 0 (0.0%) |
| Construction | 19 (100.0%) | 0 (0.0%) |
| Manufacturing | 0 (0.0%) | 0 (0.0%) |
| Wholesale Trade | 0 (0.0%) | 0 (0.0%) |
| Retail Trade | 1 (100.0%) | 0 (0.0%) |
| Transportation & Warehousing | 0 (0.0%) | 0 (0.0%) |
| Utilities | 0 (0.0%) | 0 (0.0%) |
| Information | 0 (0.0%) | 0 (0.0%) |
| Finance & Insurance | 0 (0.0%) | 0 (0.0%) |
| Real Estate, Rental & Leasing | 0 (0.0%) | 0 (0.0%) |
| Professional & Scientific | 0 (0.0%) | 0 (0.0%) |
| Enterprise Management | 0 (0.0%) | 0 (0.0%) |
| Administrative & Support | 0 (0.0%) | 0 (0.0%) |
| Educational Services | 5 (83.3%) | 1 (16.7%) |
| Health Care & Social Assistance | 0 (0.0%) | 0 (0.0%) |
| Arts, Entertainment & Recreation | 0 (0.0%) | 0 (0.0%) |
| Accommodation & Food Services | 0 (0.0%) | 0 (0.0%) |
| Public Administration | 0 (0.0%) | 0 (0.0%) |
| Total | 27 (96.4%) | 1 (3.6%) |
Education in Tarrytown
School Enrollment in Tarrytown
The most common levels of schooling among the 26 students in Tarrytown are middle school (21 | 80.8%), and graduate / professional (5 | 19.2%).
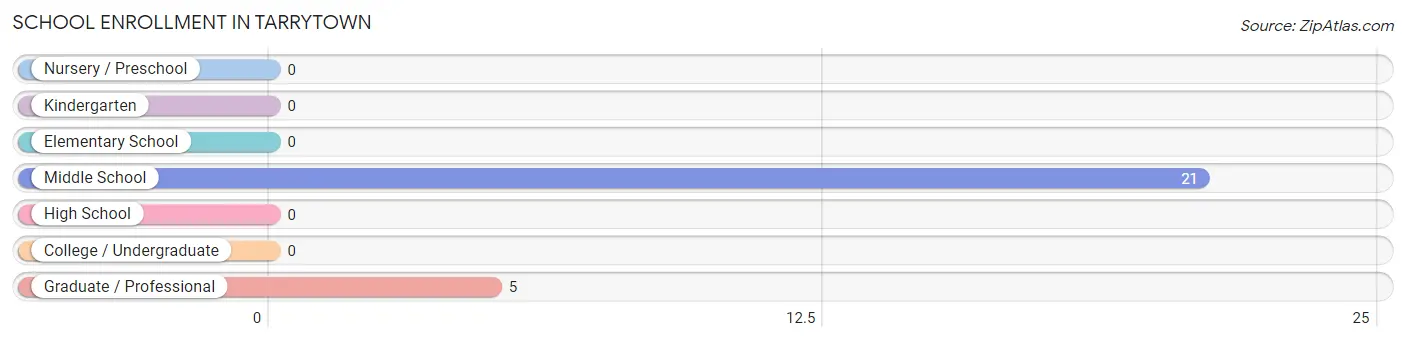
| School Level | # Students | % Students |
| Nursery / Preschool | 0 | 0.0% |
| Kindergarten | 0 | 0.0% |
| Elementary School | 0 | 0.0% |
| Middle School | 21 | 80.8% |
| High School | 0 | 0.0% |
| College / Undergraduate | 0 | 0.0% |
| Graduate / Professional | 5 | 19.2% |
| Total | 26 | 100.0% |
School Enrollment by Age by Funding Source in Tarrytown
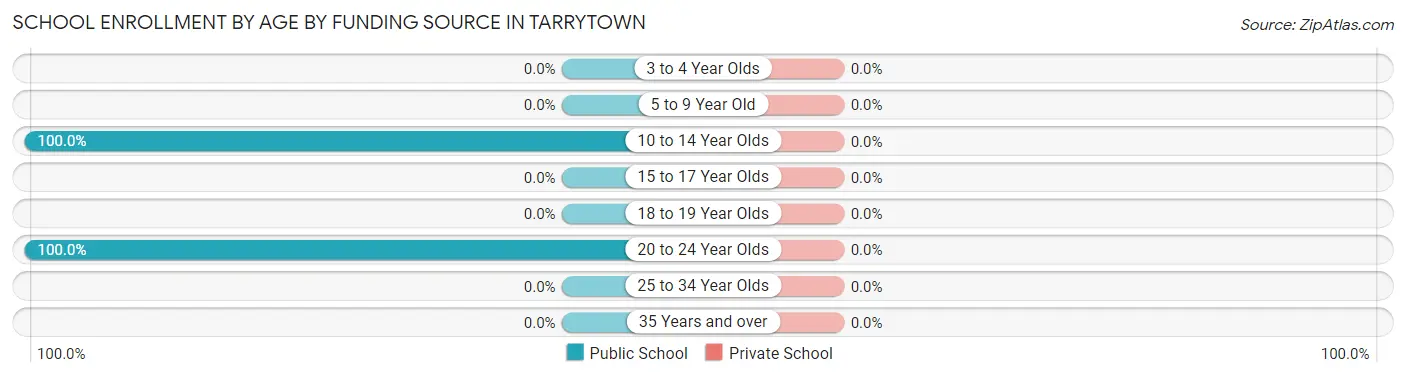
| Age Bracket | Public School | Private School |
| 3 to 4 Year Olds | 0 (0.0%) | 0 (0.0%) |
| 5 to 9 Year Old | 0 (0.0%) | 0 (0.0%) |
| 10 to 14 Year Olds | 21 (100.0%) | 0 (0.0%) |
| 15 to 17 Year Olds | 0 (0.0%) | 0 (0.0%) |
| 18 to 19 Year Olds | 0 (0.0%) | 0 (0.0%) |
| 20 to 24 Year Olds | 5 (100.0%) | 0 (0.0%) |
| 25 to 34 Year Olds | 0 (0.0%) | 0 (0.0%) |
| 35 Years and over | 0 (0.0%) | 0 (0.0%) |
| Total | 26 (100.0%) | 0 (0.0%) |
Educational Attainment by Field of Study in Tarrytown
, and education (2 | 100.0%) are the most common fields of study among 2 individuals in Tarrytown who have obtained a bachelor's degree or higher.
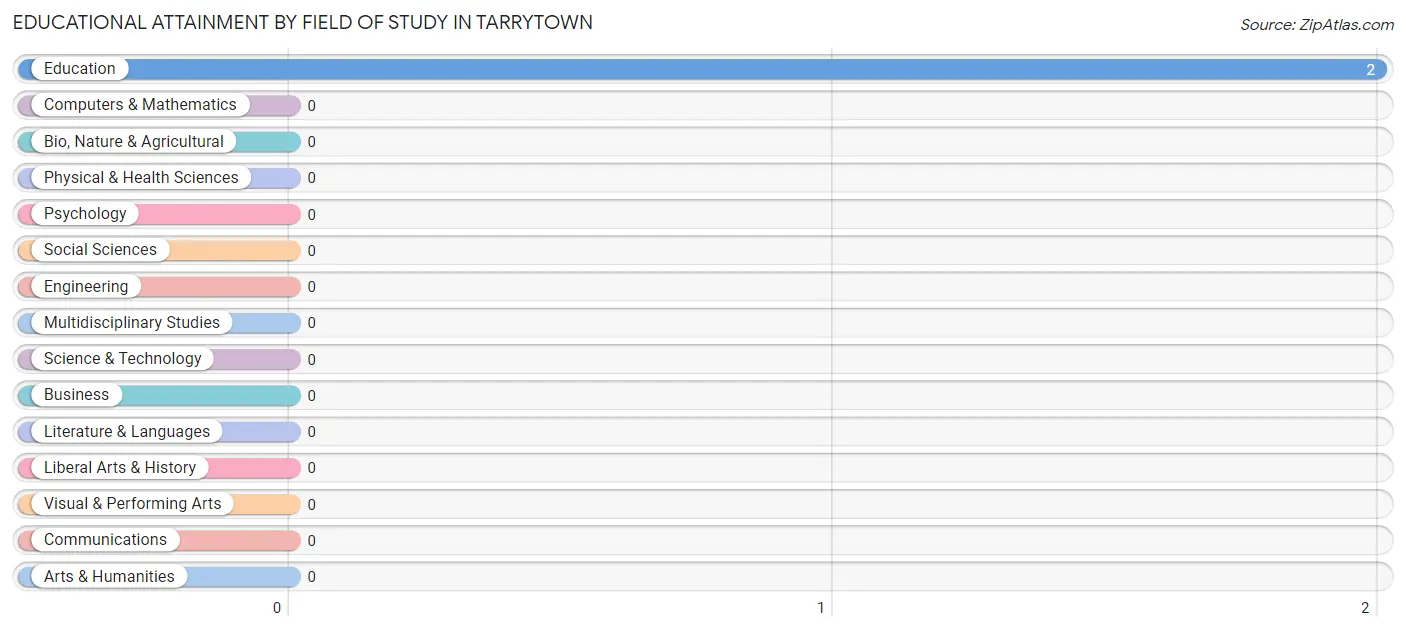
| Field of Study | # Graduates | % Graduates |
| Computers & Mathematics | 0 | 0.0% |
| Bio, Nature & Agricultural | 0 | 0.0% |
| Physical & Health Sciences | 0 | 0.0% |
| Psychology | 0 | 0.0% |
| Social Sciences | 0 | 0.0% |
| Engineering | 0 | 0.0% |
| Multidisciplinary Studies | 0 | 0.0% |
| Science & Technology | 0 | 0.0% |
| Business | 0 | 0.0% |
| Education | 2 | 100.0% |
| Literature & Languages | 0 | 0.0% |
| Liberal Arts & History | 0 | 0.0% |
| Visual & Performing Arts | 0 | 0.0% |
| Communications | 0 | 0.0% |
| Arts & Humanities | 0 | 0.0% |
| Total | 2 | 100.0% |
Transportation & Commute in Tarrytown
Vehicle Availability by Sex in Tarrytown
The most prevalent vehicle ownership categories in Tarrytown are males with 2 vehicles (18, accounting for 66.7%) and females with 2 vehicles (0, making up 1,800.0%).
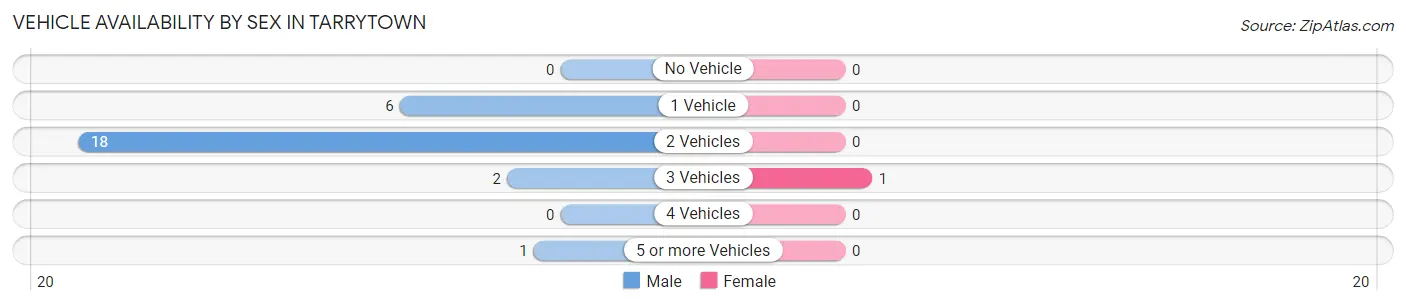
| Vehicles Available | Male | Female |
| No Vehicle | 0 (0.0%) | 0 (0.0%) |
| 1 Vehicle | 6 (22.2%) | 0 (0.0%) |
| 2 Vehicles | 18 (66.7%) | 0 (0.0%) |
| 3 Vehicles | 2 (7.4%) | 1 (100.0%) |
| 4 Vehicles | 0 (0.0%) | 0 (0.0%) |
| 5 or more Vehicles | 1 (3.7%) | 0 (0.0%) |
| Total | 27 (100.0%) | 1 (100.0%) |
Commute Time in Tarrytown
The most frequently occuring commute durations in Tarrytown are 30 to 34 minutes (18 commuters, 64.3%), 15 to 19 minutes (5 commuters, 17.9%), and 10 to 14 minutes (2 commuters, 7.1%).
| Commute Time | # Commuters | % Commuters |
| Less than 5 Minutes | 0 | 0.0% |
| 5 to 9 Minutes | 0 | 0.0% |
| 10 to 14 Minutes | 2 | 7.1% |
| 15 to 19 Minutes | 5 | 17.9% |
| 20 to 24 Minutes | 0 | 0.0% |
| 25 to 29 Minutes | 2 | 7.1% |
| 30 to 34 Minutes | 18 | 64.3% |
| 35 to 39 Minutes | 0 | 0.0% |
| 40 to 44 Minutes | 1 | 3.6% |
| 45 to 59 Minutes | 0 | 0.0% |
| 60 to 89 Minutes | 0 | 0.0% |
| 90 or more Minutes | 0 | 0.0% |
Commute Time by Sex in Tarrytown
The most common commute times in Tarrytown are 30 to 34 minutes (18 commuters, 66.7%) for males and 10 to 14 minutes (1 commuters, 100.0%) for females.
| Commute Time | Male | Female |
| Less than 5 Minutes | 0 (0.0%) | 0 (0.0%) |
| 5 to 9 Minutes | 0 (0.0%) | 0 (0.0%) |
| 10 to 14 Minutes | 1 (3.7%) | 1 (100.0%) |
| 15 to 19 Minutes | 5 (18.5%) | 0 (0.0%) |
| 20 to 24 Minutes | 0 (0.0%) | 0 (0.0%) |
| 25 to 29 Minutes | 2 (7.4%) | 0 (0.0%) |
| 30 to 34 Minutes | 18 (66.7%) | 0 (0.0%) |
| 35 to 39 Minutes | 0 (0.0%) | 0 (0.0%) |
| 40 to 44 Minutes | 1 (3.7%) | 0 (0.0%) |
| 45 to 59 Minutes | 0 (0.0%) | 0 (0.0%) |
| 60 to 89 Minutes | 0 (0.0%) | 0 (0.0%) |
| 90 or more Minutes | 0 (0.0%) | 0 (0.0%) |
Time of Departure to Work by Sex in Tarrytown
The most frequent times of departure to work in Tarrytown are 7:00 AM to 7:29 AM (23, 85.2%) for males and 9:00 AM to 9:59 AM (1, 100.0%) for females.
| Time of Departure | Male | Female |
| 12:00 AM to 4:59 AM | 0 (0.0%) | 0 (0.0%) |
| 5:00 AM to 5:29 AM | 0 (0.0%) | 0 (0.0%) |
| 5:30 AM to 5:59 AM | 0 (0.0%) | 0 (0.0%) |
| 6:00 AM to 6:29 AM | 0 (0.0%) | 0 (0.0%) |
| 6:30 AM to 6:59 AM | 0 (0.0%) | 0 (0.0%) |
| 7:00 AM to 7:29 AM | 23 (85.2%) | 0 (0.0%) |
| 7:30 AM to 7:59 AM | 2 (7.4%) | 0 (0.0%) |
| 8:00 AM to 8:29 AM | 1 (3.7%) | 0 (0.0%) |
| 8:30 AM to 8:59 AM | 0 (0.0%) | 0 (0.0%) |
| 9:00 AM to 9:59 AM | 0 (0.0%) | 1 (100.0%) |
| 10:00 AM to 10:59 AM | 0 (0.0%) | 0 (0.0%) |
| 11:00 AM to 11:59 AM | 0 (0.0%) | 0 (0.0%) |
| 12:00 PM to 3:59 PM | 1 (3.7%) | 0 (0.0%) |
| 4:00 PM to 11:59 PM | 0 (0.0%) | 0 (0.0%) |
| Total | 27 (100.0%) | 1 (100.0%) |
Housing Occupancy in Tarrytown
Occupancy by Ownership in Tarrytown
Of the total 55 dwellings in Tarrytown, owner-occupied units account for 39 (70.9%), while renter-occupied units make up 16 (29.1%).
| Occupancy | # Housing Units | % Housing Units |
| Owner Occupied Housing Units | 39 | 70.9% |
| Renter-Occupied Housing Units | 16 | 29.1% |
| Total Occupied Housing Units | 55 | 100.0% |
Occupancy by Household Size in Tarrytown
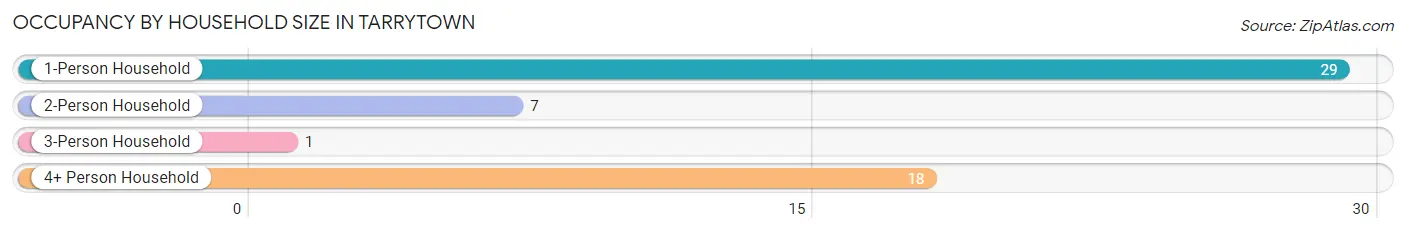
| Household Size | # Housing Units | % Housing Units |
| 1-Person Household | 29 | 52.7% |
| 2-Person Household | 7 | 12.7% |
| 3-Person Household | 1 | 1.8% |
| 4+ Person Household | 18 | 32.7% |
| Total Housing Units | 55 | 100.0% |
Occupancy by Ownership by Household Size in Tarrytown
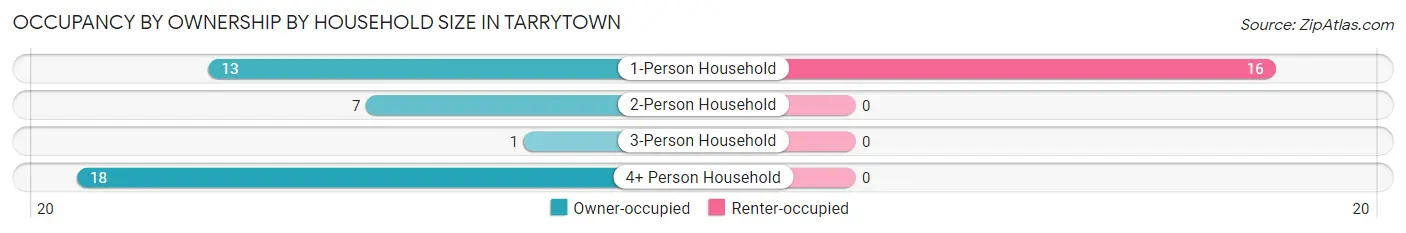
| Household Size | Owner-occupied | Renter-occupied |
| 1-Person Household | 13 (44.8%) | 16 (55.2%) |
| 2-Person Household | 7 (100.0%) | 0 (0.0%) |
| 3-Person Household | 1 (100.0%) | 0 (0.0%) |
| 4+ Person Household | 18 (100.0%) | 0 (0.0%) |
| Total Housing Units | 39 (70.9%) | 16 (29.1%) |
Occupancy by Educational Attainment in Tarrytown
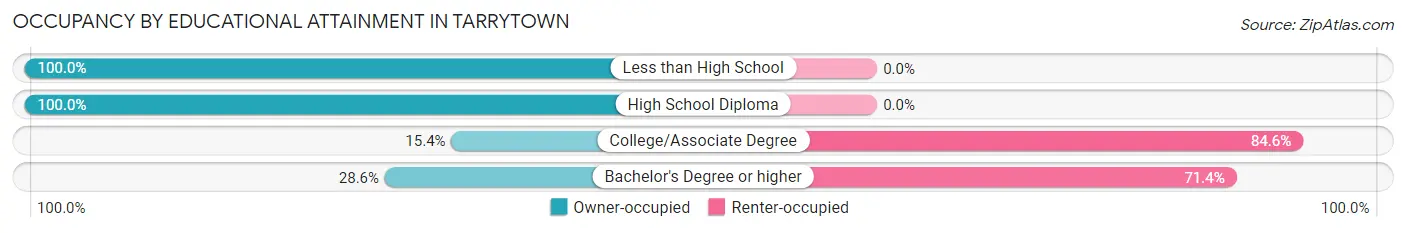
| Household Size | Owner-occupied | Renter-occupied |
| Less than High School | 5 (100.0%) | 0 (0.0%) |
| High School Diploma | 30 (100.0%) | 0 (0.0%) |
| College/Associate Degree | 2 (15.4%) | 11 (84.6%) |
| Bachelor's Degree or higher | 2 (28.6%) | 5 (71.4%) |
Occupancy by Age of Householder in Tarrytown
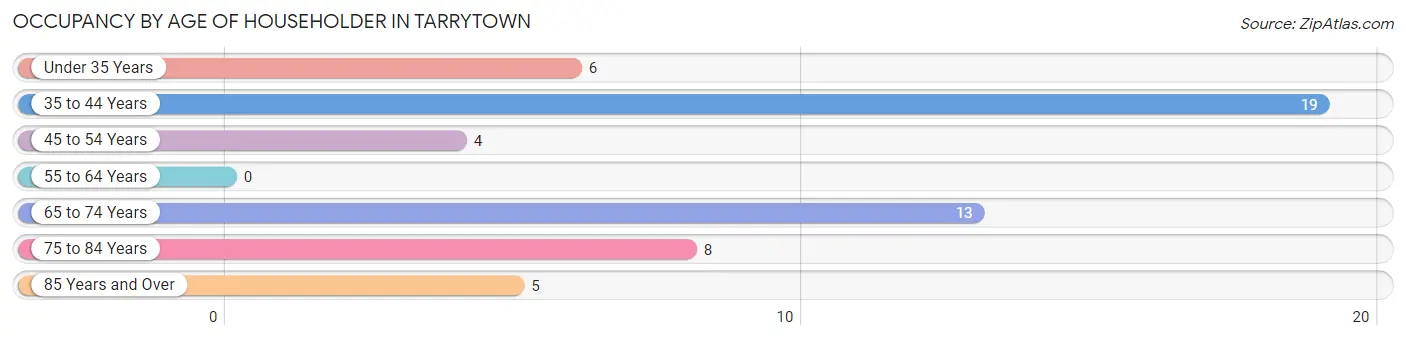
| Age Bracket | # Households | % Households |
| Under 35 Years | 6 | 10.9% |
| 35 to 44 Years | 19 | 34.5% |
| 45 to 54 Years | 4 | 7.3% |
| 55 to 64 Years | 0 | 0.0% |
| 65 to 74 Years | 13 | 23.6% |
| 75 to 84 Years | 8 | 14.5% |
| 85 Years and Over | 5 | 9.1% |
| Total | 55 | 100.0% |
Housing Finances in Tarrytown
Median Income by Occupancy in Tarrytown
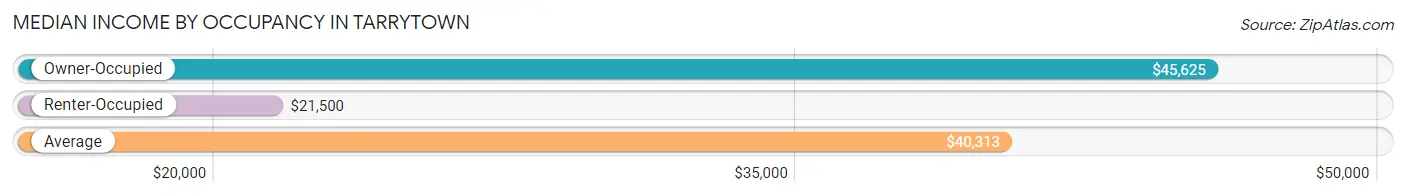
| Occupancy Type | # Households | Median Income |
| Owner-Occupied | 39 (70.9%) | $45,625 |
| Renter-Occupied | 16 (29.1%) | $21,500 |
| Average | 55 (100.0%) | $40,313 |
Occupancy by Householder Income Bracket in Tarrytown
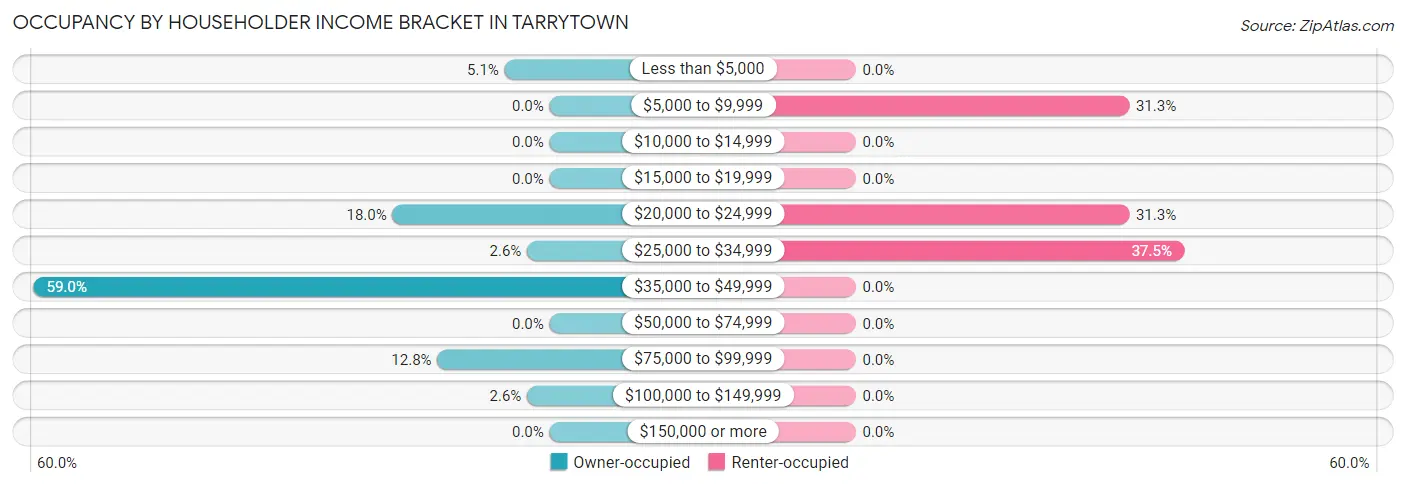
| Income Bracket | Owner-occupied | Renter-occupied |
| Less than $5,000 | 2 (5.1%) | 0 (0.0%) |
| $5,000 to $9,999 | 0 (0.0%) | 5 (31.2%) |
| $10,000 to $14,999 | 0 (0.0%) | 0 (0.0%) |
| $15,000 to $19,999 | 0 (0.0%) | 0 (0.0%) |
| $20,000 to $24,999 | 7 (17.9%) | 5 (31.2%) |
| $25,000 to $34,999 | 1 (2.6%) | 6 (37.5%) |
| $35,000 to $49,999 | 23 (59.0%) | 0 (0.0%) |
| $50,000 to $74,999 | 0 (0.0%) | 0 (0.0%) |
| $75,000 to $99,999 | 5 (12.8%) | 0 (0.0%) |
| $100,000 to $149,999 | 1 (2.6%) | 0 (0.0%) |
| $150,000 or more | 0 (0.0%) | 0 (0.0%) |
| Total | 39 (100.0%) | 16 (100.0%) |
Monthly Housing Cost Tiers in Tarrytown
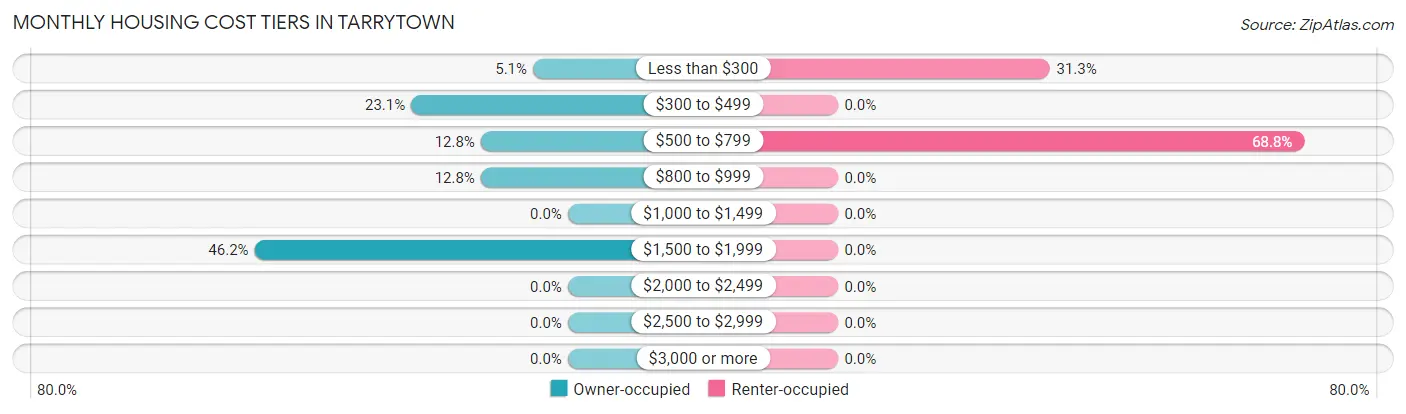
| Monthly Cost | Owner-occupied | Renter-occupied |
| Less than $300 | 2 (5.1%) | 5 (31.2%) |
| $300 to $499 | 9 (23.1%) | 0 (0.0%) |
| $500 to $799 | 5 (12.8%) | 11 (68.8%) |
| $800 to $999 | 5 (12.8%) | 0 (0.0%) |
| $1,000 to $1,499 | 0 (0.0%) | 0 (0.0%) |
| $1,500 to $1,999 | 18 (46.2%) | 0 (0.0%) |
| $2,000 to $2,499 | 0 (0.0%) | 0 (0.0%) |
| $2,500 to $2,999 | 0 (0.0%) | 0 (0.0%) |
| $3,000 or more | 0 (0.0%) | 0 (0.0%) |
| Total | 39 (100.0%) | 16 (100.0%) |
Physical Housing Characteristics in Tarrytown
Housing Structures in Tarrytown
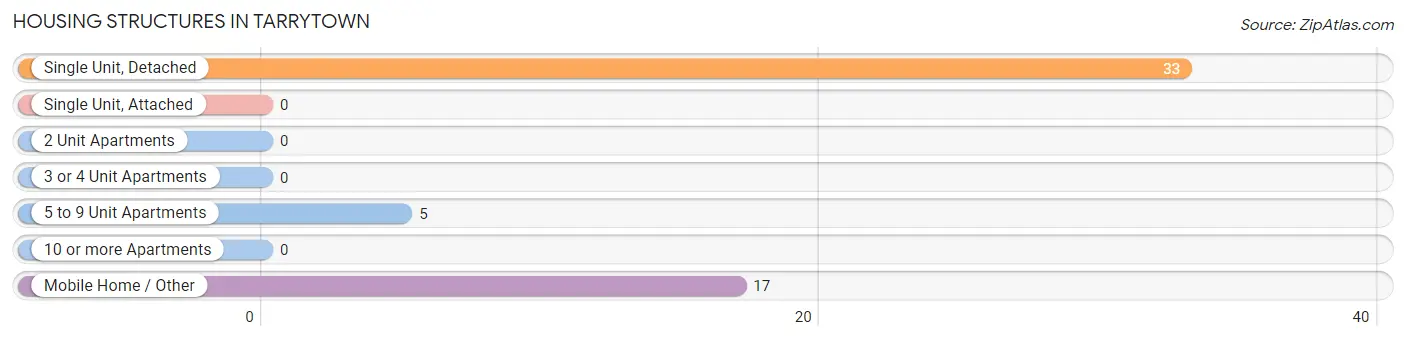
| Structure Type | # Housing Units | % Housing Units |
| Single Unit, Detached | 33 | 60.0% |
| Single Unit, Attached | 0 | 0.0% |
| 2 Unit Apartments | 0 | 0.0% |
| 3 or 4 Unit Apartments | 0 | 0.0% |
| 5 to 9 Unit Apartments | 5 | 9.1% |
| 10 or more Apartments | 0 | 0.0% |
| Mobile Home / Other | 17 | 30.9% |
| Total | 55 | 100.0% |
Housing Structures by Occupancy in Tarrytown
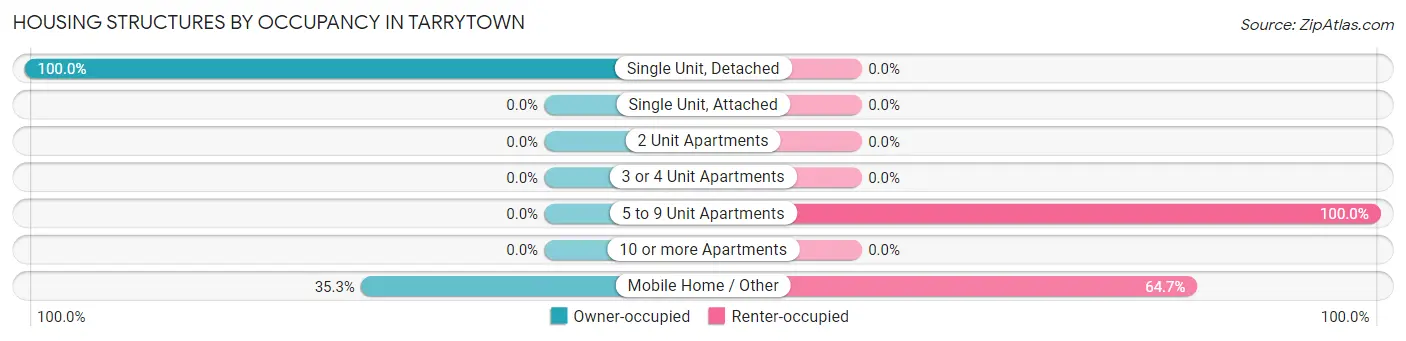
| Structure Type | Owner-occupied | Renter-occupied |
| Single Unit, Detached | 33 (100.0%) | 0 (0.0%) |
| Single Unit, Attached | 0 (0.0%) | 0 (0.0%) |
| 2 Unit Apartments | 0 (0.0%) | 0 (0.0%) |
| 3 or 4 Unit Apartments | 0 (0.0%) | 0 (0.0%) |
| 5 to 9 Unit Apartments | 0 (0.0%) | 5 (100.0%) |
| 10 or more Apartments | 0 (0.0%) | 0 (0.0%) |
| Mobile Home / Other | 6 (35.3%) | 11 (64.7%) |
| Total | 39 (70.9%) | 16 (29.1%) |
Housing Structures by Number of Rooms in Tarrytown
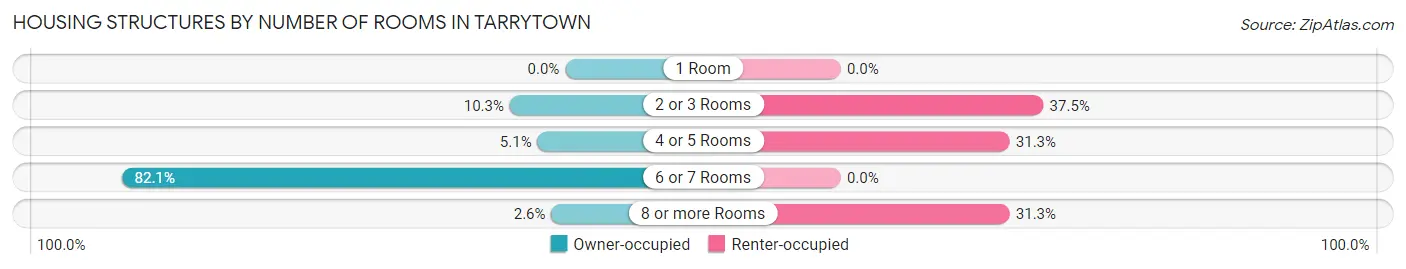
| Number of Rooms | Owner-occupied | Renter-occupied |
| 1 Room | 0 (0.0%) | 0 (0.0%) |
| 2 or 3 Rooms | 4 (10.3%) | 6 (37.5%) |
| 4 or 5 Rooms | 2 (5.1%) | 5 (31.2%) |
| 6 or 7 Rooms | 32 (82.1%) | 0 (0.0%) |
| 8 or more Rooms | 1 (2.6%) | 5 (31.2%) |
| Total | 39 (100.0%) | 16 (100.0%) |
Housing Structure by Heating Type in Tarrytown
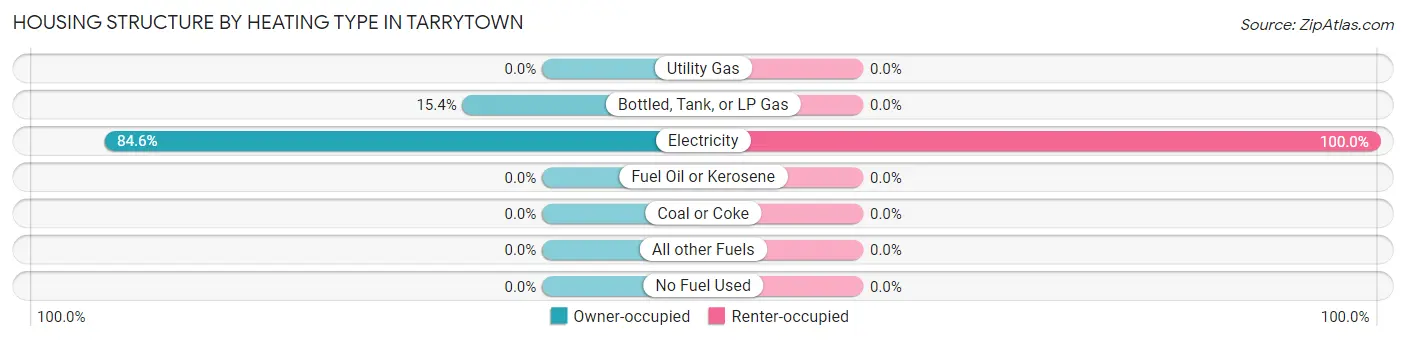
| Heating Type | Owner-occupied | Renter-occupied |
| Utility Gas | 0 (0.0%) | 0 (0.0%) |
| Bottled, Tank, or LP Gas | 6 (15.4%) | 0 (0.0%) |
| Electricity | 33 (84.6%) | 16 (100.0%) |
| Fuel Oil or Kerosene | 0 (0.0%) | 0 (0.0%) |
| Coal or Coke | 0 (0.0%) | 0 (0.0%) |
| All other Fuels | 0 (0.0%) | 0 (0.0%) |
| No Fuel Used | 0 (0.0%) | 0 (0.0%) |
| Total | 39 (100.0%) | 16 (100.0%) |
Household Vehicle Usage in Tarrytown
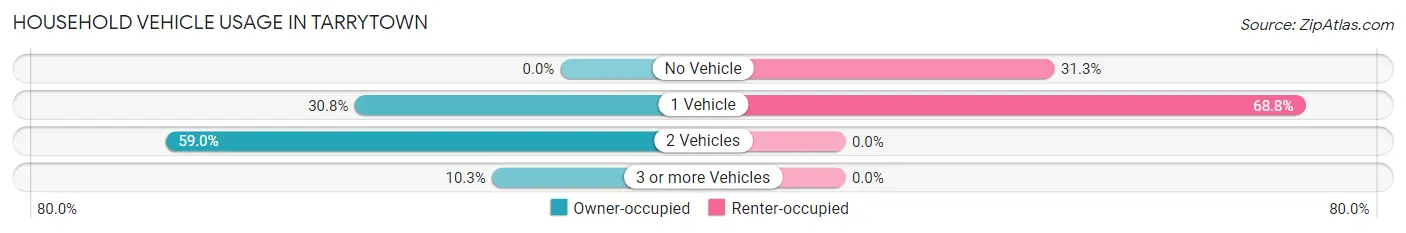
| Vehicles per Household | Owner-occupied | Renter-occupied |
| No Vehicle | 0 (0.0%) | 5 (31.2%) |
| 1 Vehicle | 12 (30.8%) | 11 (68.8%) |
| 2 Vehicles | 23 (59.0%) | 0 (0.0%) |
| 3 or more Vehicles | 4 (10.3%) | 0 (0.0%) |
| Total | 39 (100.0%) | 16 (100.0%) |
Real Estate & Mortgages in Tarrytown
Real Estate and Mortgage Overview in Tarrytown
| Characteristic | Without Mortgage | With Mortgage |
| Housing Units | 21 | 18 |
| Median Property Value | $65,400 | $0 |
| Median Household Income | $36,250 | $0 |
| Monthly Housing Costs | $493 | $0 |
| Real Estate Taxes | - | - |
Property Value by Mortgage Status in Tarrytown
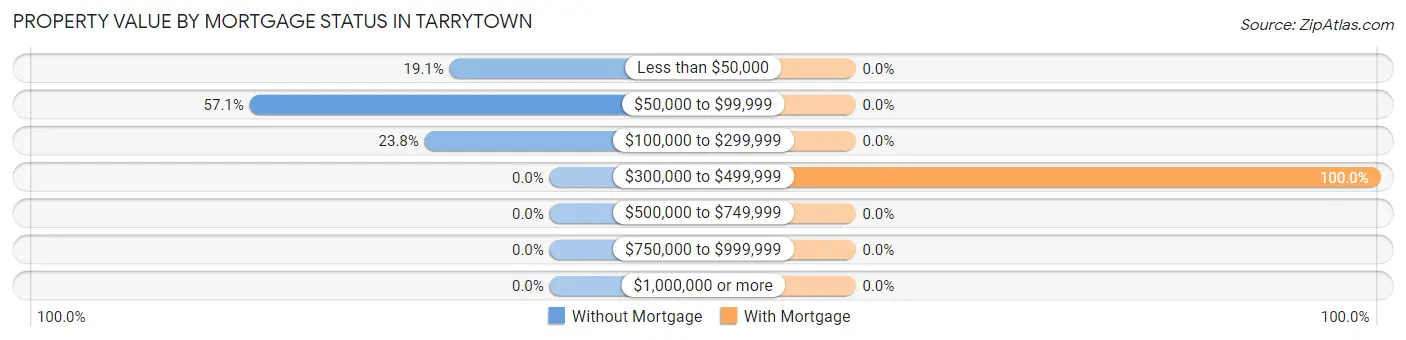
| Property Value | Without Mortgage | With Mortgage |
| Less than $50,000 | 4 (19.1%) | 0 (0.0%) |
| $50,000 to $99,999 | 12 (57.1%) | 0 (0.0%) |
| $100,000 to $299,999 | 5 (23.8%) | 0 (0.0%) |
| $300,000 to $499,999 | 0 (0.0%) | 18 (100.0%) |
| $500,000 to $749,999 | 0 (0.0%) | 0 (0.0%) |
| $750,000 to $999,999 | 0 (0.0%) | 0 (0.0%) |
| $1,000,000 or more | 0 (0.0%) | 0 (0.0%) |
| Total | 21 (100.0%) | 18 (100.0%) |
Household Income by Mortgage Status in Tarrytown
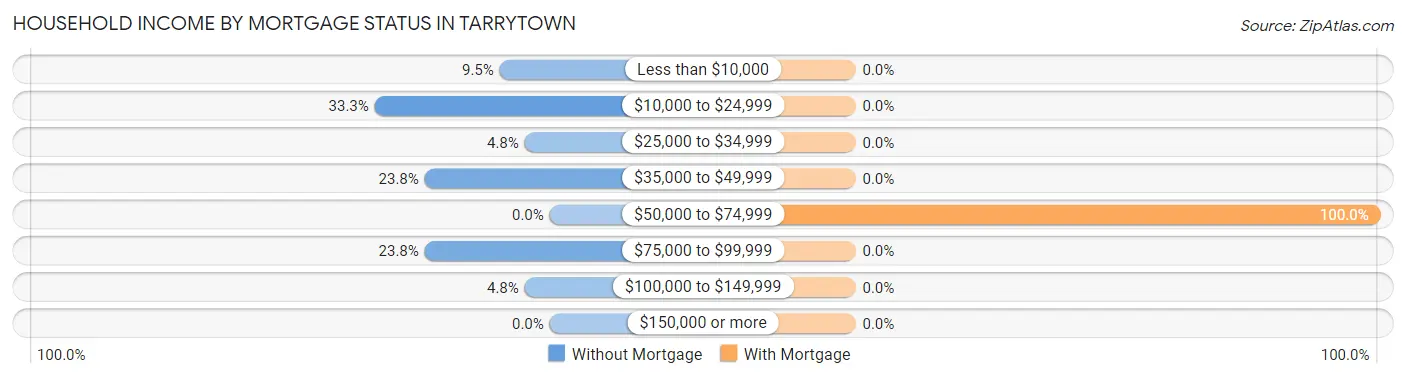
| Household Income | Without Mortgage | With Mortgage |
| Less than $10,000 | 2 (9.5%) | 0 (0.0%) |
| $10,000 to $24,999 | 7 (33.3%) | 0 (0.0%) |
| $25,000 to $34,999 | 1 (4.8%) | 0 (0.0%) |
| $35,000 to $49,999 | 5 (23.8%) | 0 (0.0%) |
| $50,000 to $74,999 | 0 (0.0%) | 18 (100.0%) |
| $75,000 to $99,999 | 5 (23.8%) | 0 (0.0%) |
| $100,000 to $149,999 | 1 (4.8%) | 0 (0.0%) |
| $150,000 or more | 0 (0.0%) | 0 (0.0%) |
| Total | 21 (100.0%) | 18 (100.0%) |
Property Value to Household Income Ratio in Tarrytown
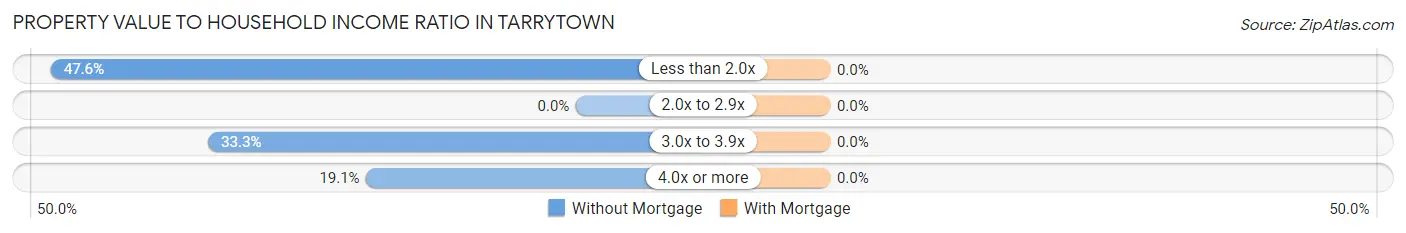
| Value-to-Income Ratio | Without Mortgage | With Mortgage |
| Less than 2.0x | 10 (47.6%) | 0 (0.0%) |
| 2.0x to 2.9x | 0 (0.0%) | 0 (0.0%) |
| 3.0x to 3.9x | 7 (33.3%) | 0 (0.0%) |
| 4.0x or more | 4 (19.1%) | 0 (0.0%) |
| Total | 21 (100.0%) | 18 (100.0%) |
Real Estate Taxes by Mortgage Status in Tarrytown
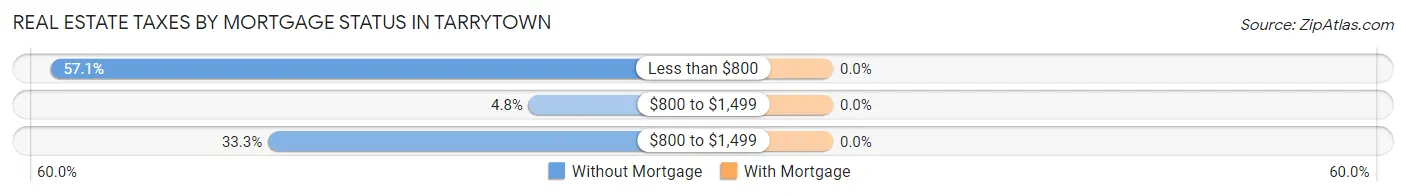
| Property Taxes | Without Mortgage | With Mortgage |
| Less than $800 | 12 (57.1%) | 0 (0.0%) |
| $800 to $1,499 | 1 (4.8%) | 0 (0.0%) |
| $800 to $1,499 | 7 (33.3%) | 0 (0.0%) |
| Total | 21 (100.0%) | 18 (100.0%) |
Health & Disability in Tarrytown
Health Insurance Coverage by Age in Tarrytown
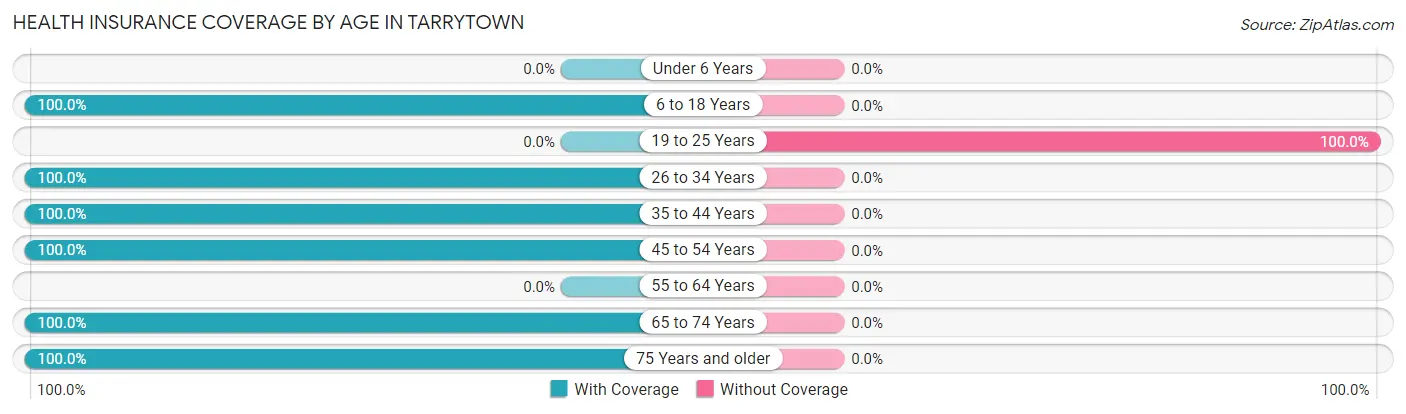
| Age Bracket | With Coverage | Without Coverage |
| Under 6 Years | 0 (0.0%) | 0 (0.0%) |
| 6 to 18 Years | 21 (100.0%) | 0 (0.0%) |
| 19 to 25 Years | 0 (0.0%) | 5 (100.0%) |
| 26 to 34 Years | 3 (100.0%) | 0 (0.0%) |
| 35 to 44 Years | 46 (100.0%) | 0 (0.0%) |
| 45 to 54 Years | 4 (100.0%) | 0 (0.0%) |
| 55 to 64 Years | 0 (0.0%) | 0 (0.0%) |
| 65 to 74 Years | 20 (100.0%) | 0 (0.0%) |
| 75 Years and older | 18 (100.0%) | 0 (0.0%) |
| Total | 112 (95.7%) | 5 (4.3%) |
Health Insurance Coverage by Citizenship Status in Tarrytown

| Citizenship Status | With Coverage | Without Coverage |
| Native Born | 0 (0.0%) | 0 (0.0%) |
| Foreign Born, Citizen | 21 (100.0%) | 0 (0.0%) |
| Foreign Born, not a Citizen | 0 (0.0%) | 5 (100.0%) |
Health Insurance Coverage by Household Income in Tarrytown
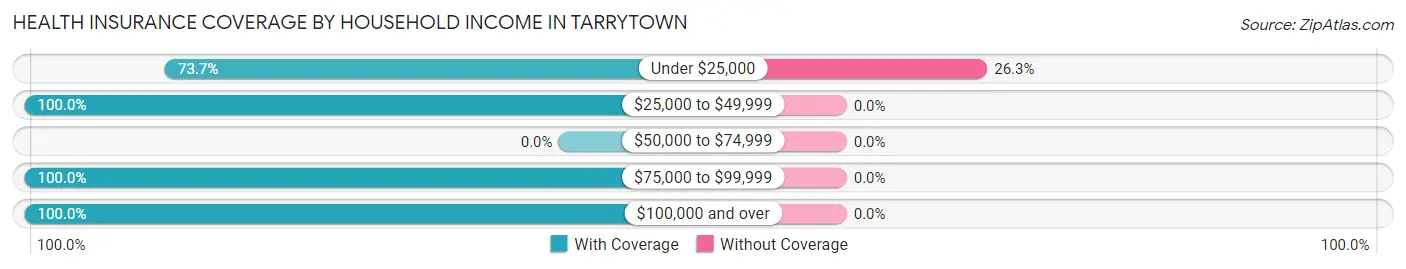
| Household Income | With Coverage | Without Coverage |
| Under $25,000 | 14 (73.7%) | 5 (26.3%) |
| $25,000 to $49,999 | 86 (100.0%) | 0 (0.0%) |
| $50,000 to $74,999 | 0 (0.0%) | 0 (0.0%) |
| $75,000 to $99,999 | 8 (100.0%) | 0 (0.0%) |
| $100,000 and over | 4 (100.0%) | 0 (0.0%) |
Public vs Private Health Insurance Coverage by Age in Tarrytown
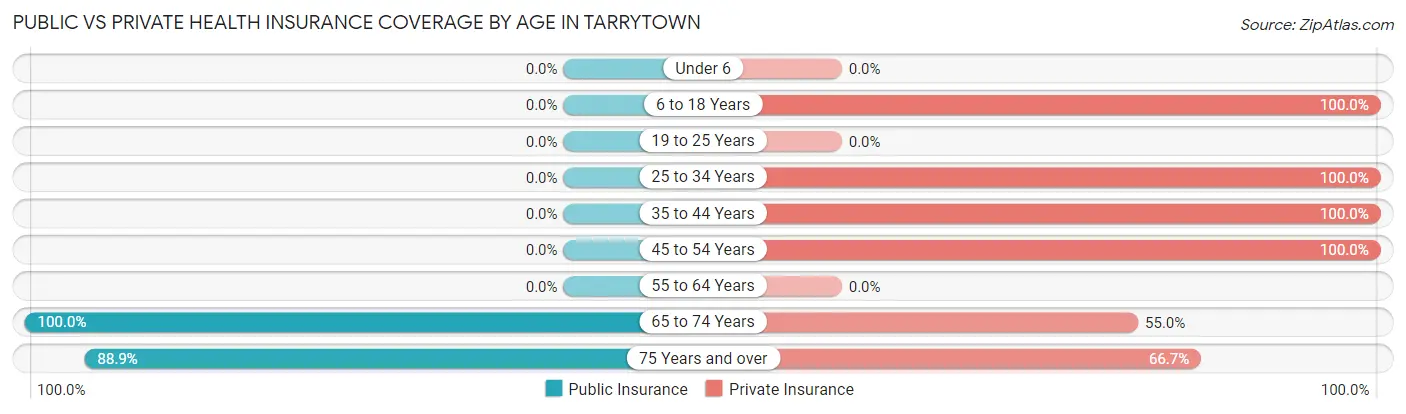
| Age Bracket | Public Insurance | Private Insurance |
| Under 6 | 0 (0.0%) | 0 (0.0%) |
| 6 to 18 Years | 0 (0.0%) | 21 (100.0%) |
| 19 to 25 Years | 0 (0.0%) | 0 (0.0%) |
| 25 to 34 Years | 0 (0.0%) | 3 (100.0%) |
| 35 to 44 Years | 0 (0.0%) | 46 (100.0%) |
| 45 to 54 Years | 0 (0.0%) | 4 (100.0%) |
| 55 to 64 Years | 0 (0.0%) | 0 (0.0%) |
| 65 to 74 Years | 20 (100.0%) | 11 (55.0%) |
| 75 Years and over | 16 (88.9%) | 12 (66.7%) |
| Total | 36 (30.8%) | 97 (82.9%) |
Disability Status by Sex by Age in Tarrytown
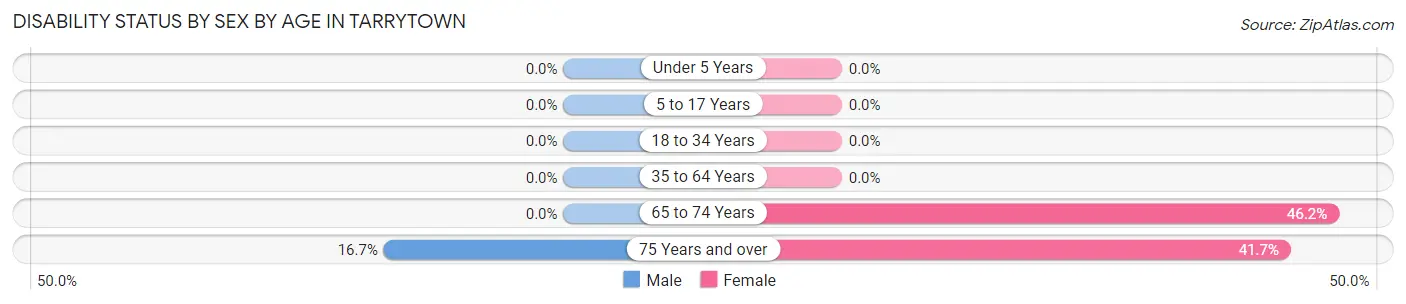
| Age Bracket | Male | Female |
| Under 5 Years | 0 (0.0%) | 0 (0.0%) |
| 5 to 17 Years | 0 (0.0%) | 0 (0.0%) |
| 18 to 34 Years | 0 (0.0%) | 0 (0.0%) |
| 35 to 64 Years | 0 (0.0%) | 0 (0.0%) |
| 65 to 74 Years | 0 (0.0%) | 6 (46.2%) |
| 75 Years and over | 1 (16.7%) | 5 (41.7%) |
Disability Class by Sex by Age in Tarrytown
Disability Class: Hearing Difficulty
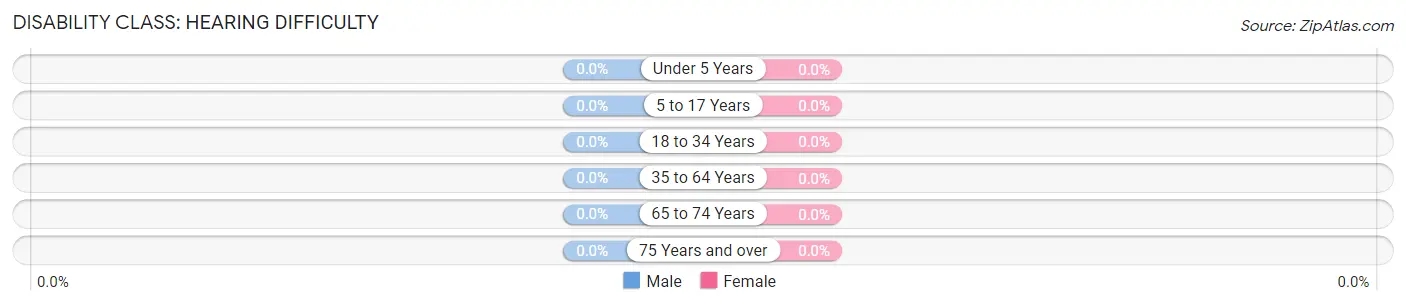
| Age Bracket | Male | Female |
| Under 5 Years | 0 (0.0%) | 0 (0.0%) |
| 5 to 17 Years | 0 (0.0%) | 0 (0.0%) |
| 18 to 34 Years | 0 (0.0%) | 0 (0.0%) |
| 35 to 64 Years | 0 (0.0%) | 0 (0.0%) |
| 65 to 74 Years | 0 (0.0%) | 0 (0.0%) |
| 75 Years and over | 0 (0.0%) | 0 (0.0%) |
Disability Class: Vision Difficulty
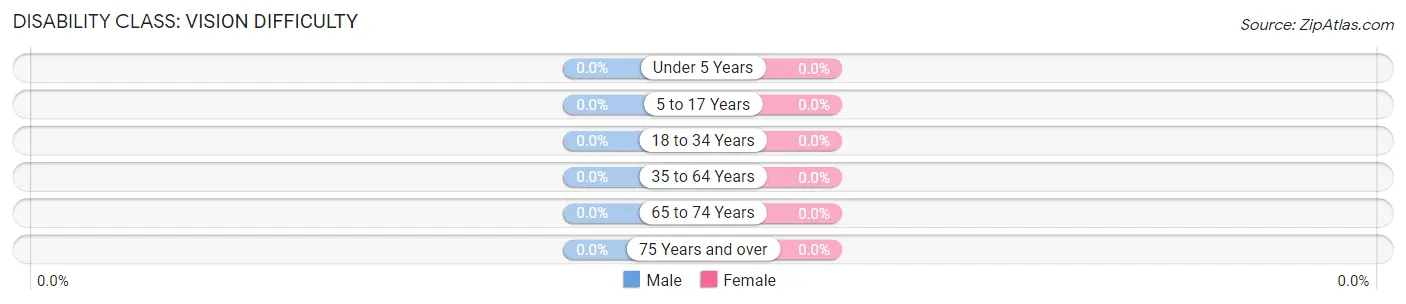
| Age Bracket | Male | Female |
| Under 5 Years | 0 (0.0%) | 0 (0.0%) |
| 5 to 17 Years | 0 (0.0%) | 0 (0.0%) |
| 18 to 34 Years | 0 (0.0%) | 0 (0.0%) |
| 35 to 64 Years | 0 (0.0%) | 0 (0.0%) |
| 65 to 74 Years | 0 (0.0%) | 0 (0.0%) |
| 75 Years and over | 0 (0.0%) | 0 (0.0%) |
Disability Class: Cognitive Difficulty
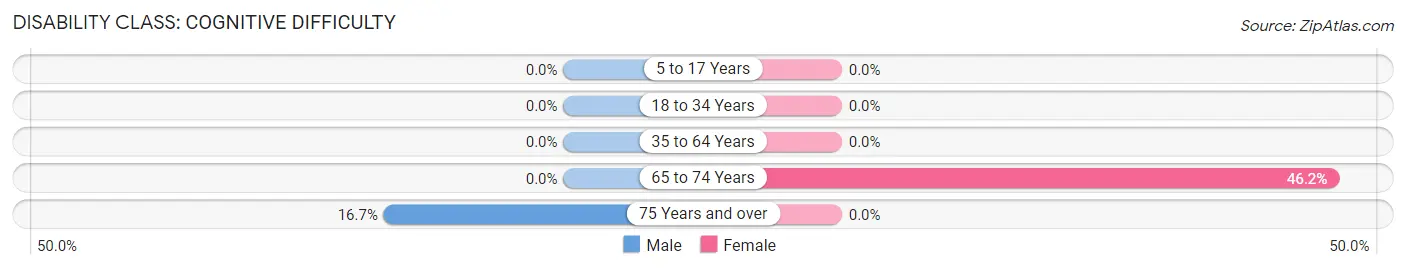
| Age Bracket | Male | Female |
| 5 to 17 Years | 0 (0.0%) | 0 (0.0%) |
| 18 to 34 Years | 0 (0.0%) | 0 (0.0%) |
| 35 to 64 Years | 0 (0.0%) | 0 (0.0%) |
| 65 to 74 Years | 0 (0.0%) | 6 (46.2%) |
| 75 Years and over | 1 (16.7%) | 0 (0.0%) |
Disability Class: Ambulatory Difficulty
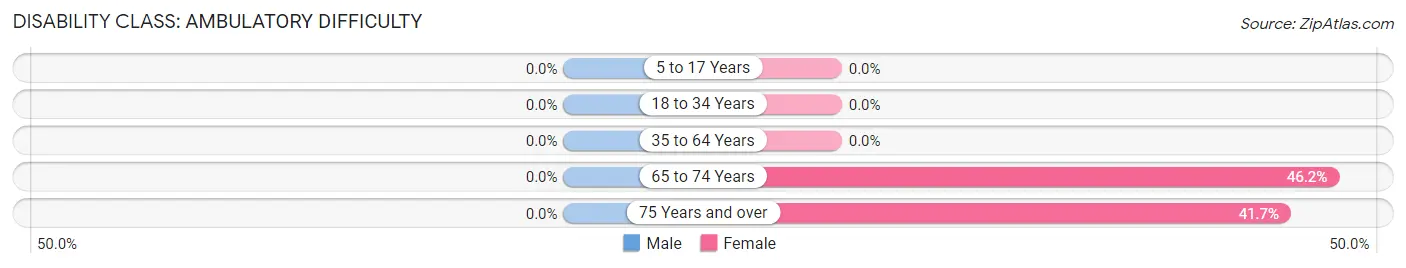
| Age Bracket | Male | Female |
| 5 to 17 Years | 0 (0.0%) | 0 (0.0%) |
| 18 to 34 Years | 0 (0.0%) | 0 (0.0%) |
| 35 to 64 Years | 0 (0.0%) | 0 (0.0%) |
| 65 to 74 Years | 0 (0.0%) | 6 (46.2%) |
| 75 Years and over | 0 (0.0%) | 5 (41.7%) |
Disability Class: Self-Care Difficulty
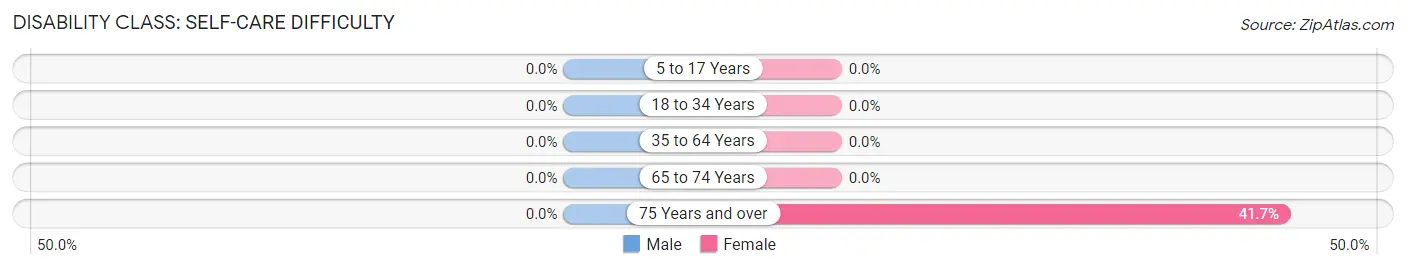
| Age Bracket | Male | Female |
| 5 to 17 Years | 0 (0.0%) | 0 (0.0%) |
| 18 to 34 Years | 0 (0.0%) | 0 (0.0%) |
| 35 to 64 Years | 0 (0.0%) | 0 (0.0%) |
| 65 to 74 Years | 0 (0.0%) | 0 (0.0%) |
| 75 Years and over | 0 (0.0%) | 5 (41.7%) |
Technology Access in Tarrytown
Computing Device Access in Tarrytown
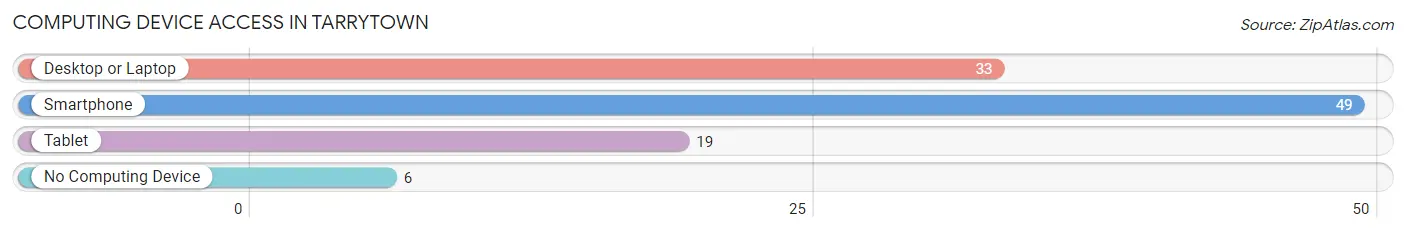
| Device Type | # Households | % Households |
| Desktop or Laptop | 33 | 60.0% |
| Smartphone | 49 | 89.1% |
| Tablet | 19 | 34.5% |
| No Computing Device | 6 | 10.9% |
| Total | 55 | 100.0% |
Internet Access in Tarrytown
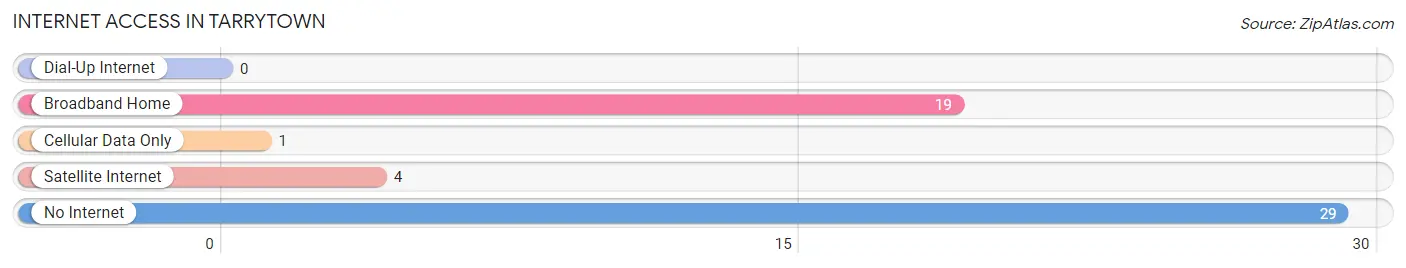
| Internet Type | # Households | % Households |
| Dial-Up Internet | 0 | 0.0% |
| Broadband Home | 19 | 34.5% |
| Cellular Data Only | 1 | 1.8% |
| Satellite Internet | 4 | 7.3% |
| No Internet | 29 | 52.7% |
| Total | 55 | 100.0% |
Tarrytown Summary
Tarrytown is a small unincorporated community located in the state of Georgia, United States. It is situated in the southwestern corner of the state, in the county of Troup. The community is located along the banks of the Chattahoochee River, and is bordered by the cities of LaGrange and West Point.
History
Tarrytown was first settled in the early 1800s by a group of settlers from North Carolina. The settlers were attracted to the area due to its fertile soil and abundant wildlife. The community was originally known as “Tarrytown” due to the fact that the settlers would often “tarry” or stay in the area for extended periods of time.
The community was officially incorporated in 1837, and the first post office was established in 1838. The town was named after the Troup County seat of LaGrange, which was named after the Marquis de LaFayette’s estate in France.
In the late 1800s, Tarrytown was a thriving agricultural community. The town was home to several cotton plantations, as well as a number of small businesses. The town also had a thriving lumber industry, and was home to several sawmills.
In the early 1900s, the town began to decline due to the decline of the cotton industry. The town’s population began to dwindle, and by the mid-1900s, the town was nearly abandoned.
In the late 1900s, the town began to experience a resurgence. The town was revitalized by the construction of a new bridge over the Chattahoochee River, which connected the town to the nearby cities of LaGrange and West Point. The bridge also provided access to the nearby interstate highway system, which allowed for increased economic development in the area.
Today, Tarrytown is a small, rural community with a population of just over 500 people. The town is home to several small businesses, including a grocery store, a gas station, and a few restaurants.
Geography
Tarrytown is located in the southwestern corner of the state of Georgia, in the county of Troup. The town is situated along the banks of the Chattahoochee River, and is bordered by the cities of LaGrange and West Point.
The town is located at an elevation of approximately 500 feet above sea level. The town is located in a humid subtropical climate zone, and experiences hot, humid summers and mild winters.
Economy
Tarrytown’s economy is largely based on agriculture and tourism. The town is home to several small farms, which produce a variety of crops, including cotton, corn, soybeans, and peanuts. The town is also home to several small businesses, including a grocery store, a gas station, and a few restaurants.
The town is also home to several tourist attractions, including the Troup County Historical Museum, the Troup County Courthouse, and the Troup County Fairgrounds. The town is also home to several parks, including the Troup County Park and the Troup County Nature Center.
Demographics
As of the 2010 census, the population of Tarrytown was 514. The racial makeup of the town was 94.3% White, 3.9% African American, 0.2% Native American, 0.2% Asian, 0.2% from other races, and 1.2% from two or more races. Hispanic or Latino of any race were 1.2% of the population.
The median household income in Tarrytown was $37,500, and the median family income was $45,000. The per capita income in the town was $17,000. About 11.2% of families and 14.2% of the population were below the poverty line, including 18.2% of those under age 18 and 8.3% of those age 65 or over.
Common Questions
What is Per Capita Income in Tarrytown?
Per Capita income in Tarrytown is $16,916.
What is the Median Family Income in Tarrytown?
Median Family Income in Tarrytown is $46,528.
What is the Median Household income in Tarrytown?
Median Household Income in Tarrytown is $40,313.
What is Inequality or Gini Index in Tarrytown?
Inequality or Gini Index in Tarrytown is 0.34.
What is the Total Population of Tarrytown?
Total Population of Tarrytown is 117.
What is the Total Male Population of Tarrytown?
Total Male Population of Tarrytown is 64.
What is the Total Female Population of Tarrytown?
Total Female Population of Tarrytown is 53.
What is the Ratio of Males per 100 Females in Tarrytown?
There are 120.75 Males per 100 Females in Tarrytown.
What is the Ratio of Females per 100 Males in Tarrytown?
There are 82.81 Females per 100 Males in Tarrytown.
What is the Median Population Age in Tarrytown?
Median Population Age in Tarrytown is 44.4 Years.
What is the Average Family Size in Tarrytown
Average Family Size in Tarrytown is 3.4 People.
What is the Average Household Size in Tarrytown
Average Household Size in Tarrytown is 2.1 People.
How Large is the Labor Force in Tarrytown?
There are 32 People in the Labor Forcein in Tarrytown.
What is the Percentage of People in the Labor Force in Tarrytown?
33.3% of People are in the Labor Force in Tarrytown.
What is the Unemployment Rate in Tarrytown?
Unemployment Rate in Tarrytown is 12.5%.