Zip Codes with the Highest Percentage of Population Employed in Agriculture, Fishing & Hunting in Griffin, GA
RELATED REPORTS & OPTIONS
Agriculture, Fishing & Hunting
Griffin
Compare Zip Codes
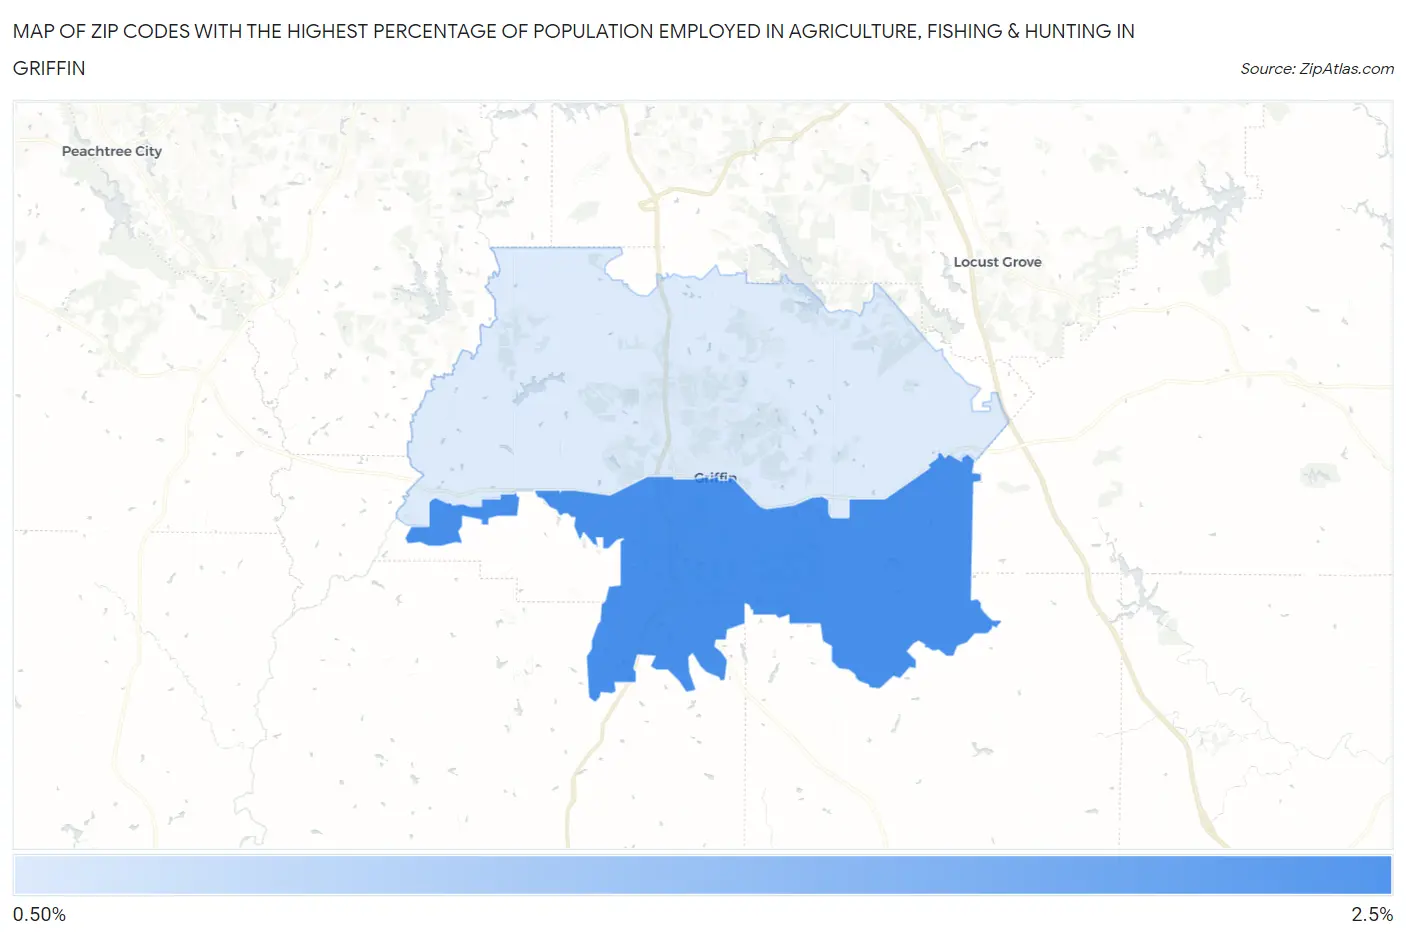
Map of Zip Codes with the Highest Percentage of Population Employed in Agriculture, Fishing & Hunting in Griffin
0.55%
2.1%
Zip Codes with the Highest Percentage of Population Employed in Agriculture, Fishing & Hunting in Griffin, GA
| Zip Code | % Employed | vs State | vs National | |
| 1. | 30224 | 2.1% | 0.91%(+1.22)#247 | 1.2%(+0.935)#12,417 |
| 2. | 30223 | 0.55% | 0.91%(-0.361)#407 | 1.2%(-0.651)#18,860 |
1
Common Questions
What are the Top Zip Codes with the Highest Percentage of Population Employed in Agriculture, Fishing & Hunting in Griffin, GA?
Top Zip Codes with the Highest Percentage of Population Employed in Agriculture, Fishing & Hunting in Griffin, GA are:
What zip code has the Highest Percentage of Population Employed in Agriculture, Fishing & Hunting in Griffin, GA?
30224 has the Highest Percentage of Population Employed in Agriculture, Fishing & Hunting in Griffin, GA with 2.1%.
What is the Percentage of Population Employed in Agriculture, Fishing & Hunting in Griffin, GA?
Percentage of Population Employed in Agriculture, Fishing & Hunting in Griffin is 0.58%.
What is the Percentage of Population Employed in Agriculture, Fishing & Hunting in Georgia?
Percentage of Population Employed in Agriculture, Fishing & Hunting in Georgia is 0.91%.
What is the Percentage of Population Employed in Agriculture, Fishing & Hunting in the United States?
Percentage of Population Employed in Agriculture, Fishing & Hunting in the United States is 1.2%.