Zip Codes with the Highest Percentage of Population Employed in Agriculture, Fishing & Hunting in Marietta, GA
RELATED REPORTS & OPTIONS
Agriculture, Fishing & Hunting
Marietta
Compare Zip Codes
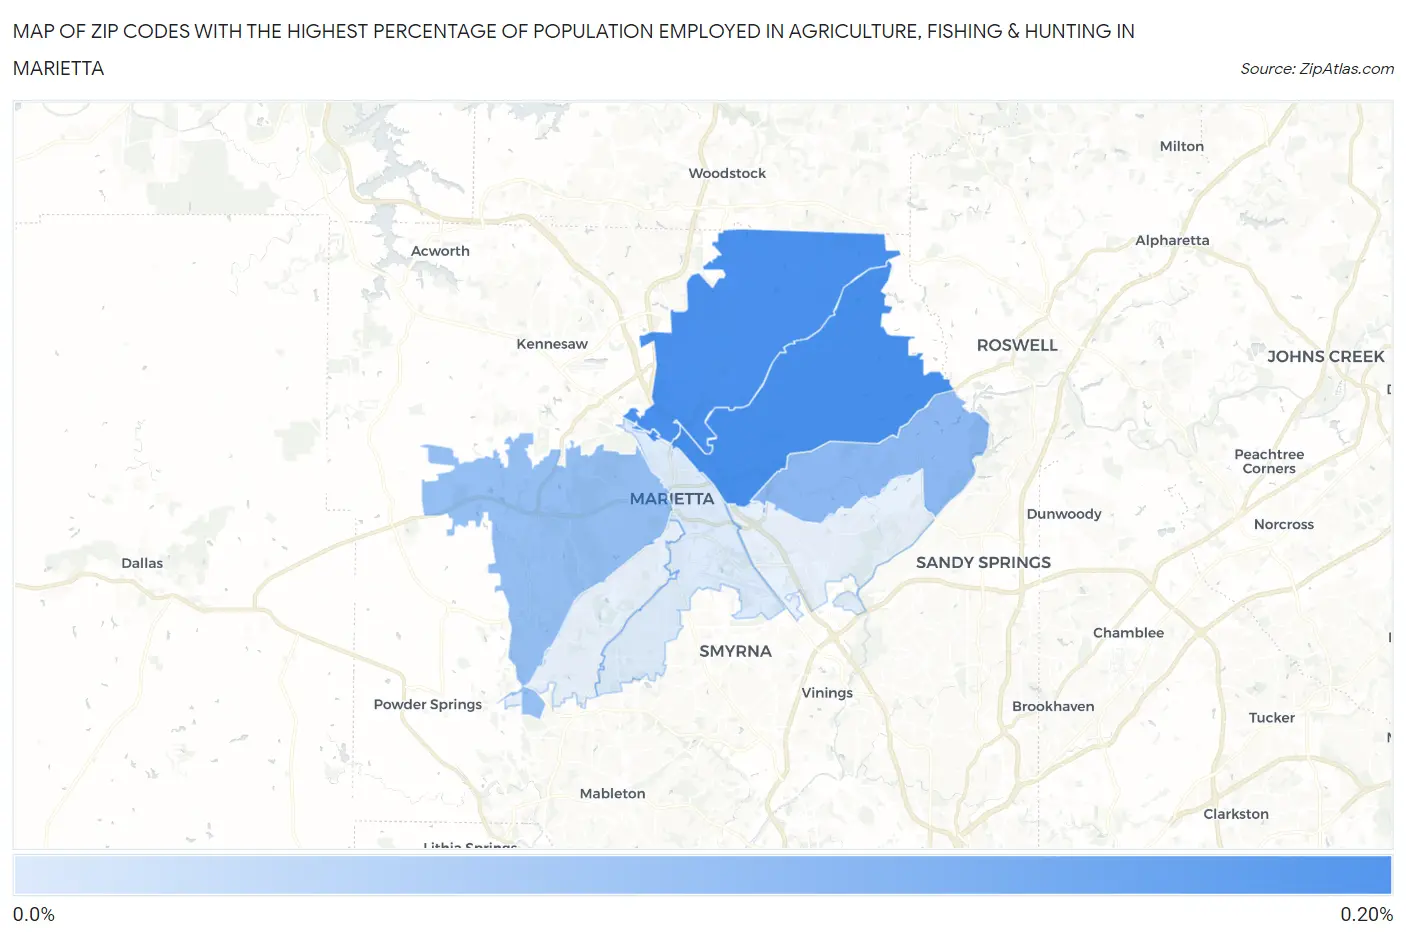
Map of Zip Codes with the Highest Percentage of Population Employed in Agriculture, Fishing & Hunting in Marietta
0.031%
0.20%
Zip Codes with the Highest Percentage of Population Employed in Agriculture, Fishing & Hunting in Marietta, GA
| Zip Code | % Employed | vs State | vs National | |
| 1. | 30062 | 0.20% | 0.91%(-0.713)#490 | 1.2%(-1.00)#22,410 |
| 2. | 30066 | 0.19% | 0.91%(-0.716)#491 | 1.2%(-1.01)#22,443 |
| 3. | 30068 | 0.12% | 0.91%(-0.789)#517 | 1.2%(-1.08)#23,401 |
| 4. | 30064 | 0.11% | 0.91%(-0.801)#524 | 1.2%(-1.09)#23,548 |
| 5. | 30060 | 0.031% | 0.91%(-0.878)#553 | 1.2%(-1.17)#24,524 |
1
Common Questions
What are the Top 5 Zip Codes with the Highest Percentage of Population Employed in Agriculture, Fishing & Hunting in Marietta, GA?
Top 5 Zip Codes with the Highest Percentage of Population Employed in Agriculture, Fishing & Hunting in Marietta, GA are:
What zip code has the Highest Percentage of Population Employed in Agriculture, Fishing & Hunting in Marietta, GA?
30062 has the Highest Percentage of Population Employed in Agriculture, Fishing & Hunting in Marietta, GA with 0.20%.
What is the Percentage of Population Employed in Agriculture, Fishing & Hunting in Marietta, GA?
Percentage of Population Employed in Agriculture, Fishing & Hunting in Marietta is 0.16%.
What is the Percentage of Population Employed in Agriculture, Fishing & Hunting in Georgia?
Percentage of Population Employed in Agriculture, Fishing & Hunting in Georgia is 0.91%.
What is the Percentage of Population Employed in Agriculture, Fishing & Hunting in the United States?
Percentage of Population Employed in Agriculture, Fishing & Hunting in the United States is 1.2%.