Zip Codes with the Highest Percentage of Population Employed in Education Instruction & Library in Atlanta, GA

RELATED REPORTS & OPTIONS

Education Instruction & Library
Population
Families and Households
Female Fertility
Female Fertility (Unmarried)
Race (Community Size)
Race (Percentage)
Ancestry (Community Size)
AfghanAfricanAlbanianAmericanApacheArabArgentineanArmenianAssyrian / Chaldean / SyriacAustralianAustrianBahamianBangladeshiBarbadianBelgianBelizeanBermudanBhutaneseBlackfeetBolivianBrazilianBritishBritish West IndianBulgarianBurmeseCajunCambodianCanadianCape VerdeanCelticCentral AmericanCentral American IndianCherokeeChickasawChileanChippewaChoctawColombianCosta RicanCreekCroatianCubanCzechCzechoslovakianDanishDominicanDutchDutch West IndianEastern EuropeanEcuadorianEgyptianEnglishEstonianEthiopianEuropeanFilipinoFinnishFrenchFrench CanadianGermanGhanaianGreekGuamanian / ChamorroGuatemalanGuyaneseHaitianHonduranHungarianIcelanderIndian (Asian)IndonesianIranianIraqiIrishIroquoisIsraeliItalianJamaicanJapaneseJordanianKenyanKoreanLaotianLatvianLebaneseLiberianLithuanianLumbeeLuxembourgerMacedonianMalaysianMalteseMexicanMexican American IndianMongolianMoroccanNative HawaiianNavajoNew ZealanderNicaraguanNigerianNorthern EuropeanNorwegianOsagePakistaniPalestinianPanamanianParaguayanPennsylvania GermanPeruvianPolishPortuguesePotawatomiPuerto RicanRomanianRussianSalvadoranSamoanScandinavianScotch-IrishScottishSeminoleSenegaleseSerbianSierra LeoneanSiouxSlavicSlovakSloveneSomaliSouth AfricanSouth AmericanSouth American IndianSoviet UnionSpaniardSpanishSpanish AmericanSri LankanSubsaharan AfricanSudaneseSwedishSwissSyrianThaiTrinidadian and TobagonianTurkishU.S. Virgin IslanderUgandanUkrainianUruguayanVenezuelanVietnameseWelshWest IndianYugoslavianZimbabwean
Ancestry (Percentage)
AfghanAfricanAlbanianAmericanApacheArabArgentineanArmenianAssyrian / Chaldean / SyriacAustralianAustrianBahamianBangladeshiBarbadianBelgianBelizeanBermudanBhutaneseBlackfeetBolivianBrazilianBritishBritish West IndianBulgarianBurmeseCajunCambodianCanadianCape VerdeanCelticCentral AmericanCentral American IndianCherokeeChickasawChileanChippewaChoctawColombianCosta RicanCreekCroatianCubanCzechCzechoslovakianDanishDominicanDutchDutch West IndianEastern EuropeanEcuadorianEgyptianEnglishEstonianEthiopianEuropeanFilipinoFinnishFrenchFrench CanadianGermanGhanaianGreekGuamanian / ChamorroGuatemalanGuyaneseHaitianHonduranHungarianIcelanderIndian (Asian)IndonesianIranianIraqiIrishIroquoisIsraeliItalianJamaicanJapaneseJordanianKenyanKoreanLaotianLatvianLebaneseLiberianLithuanianLumbeeLuxembourgerMacedonianMalaysianMalteseMexicanMexican American IndianMongolianMoroccanNative HawaiianNavajoNew ZealanderNicaraguanNigerianNorthern EuropeanNorwegianOsagePakistaniPalestinianPanamanianParaguayanPennsylvania GermanPeruvianPolishPortuguesePotawatomiPuerto RicanRomanianRussianSalvadoranSamoanScandinavianScotch-IrishScottishSeminoleSenegaleseSerbianSierra LeoneanSiouxSlavicSlovakSloveneSomaliSouth AfricanSouth AmericanSouth American IndianSoviet UnionSpaniardSpanishSpanish AmericanSri LankanSubsaharan AfricanSudaneseSwedishSwissSyrianThaiTrinidadian and TobagonianTurkishU.S. Virgin IslanderUgandanUkrainianUruguayanVenezuelanVietnameseWelshWest IndianYugoslavianZimbabwean
Immigrant Origin (Total)
AfghanistanAfricaArgentinaArmeniaAsiaAustraliaAustriaBahamasBangladeshBarbadosBelarusBelgiumBelizeBoliviaBosnia and HerzegovinaBrazilBulgariaCambodiaCameroonCanadaCaribbeanCentral AmericaChileChinaColombiaCongoCosta RicaCroatiaCubaCzechoslovakiaDenmarkDominicaDominican RepublicEastern AfricaEastern AsiaEastern EuropeEcuadorEgyptEl SalvadorEnglandEritreaEthiopiaEuropeFranceGermanyGhanaGreeceGrenadaGuatemalaGuyanaHaitiHondurasHong KongHungaryIndiaIndonesiaIranIraqIrelandIsraelItalyJamaicaJapanJordanKenyaKoreaKuwaitLaosLatin AmericaLatviaLebanonLiberiaLithuaniaMalaysiaMexicoMiddle AfricaMoldovaMoroccoNepalNetherlandsNicaraguaNigeriaNorthern AfricaNorthern EuropeOceaniaPakistanPanamaPeruPhilippinesPolandPortugalRomaniaRussiaSaudi ArabiaScotlandSenegalSerbiaSierra LeoneSingaporeSouth AfricaSouth AmericaSouth Central AsiaSouth Eastern AsiaSouthern EuropeSpainSri LankaSt. Vincent and the GrenadinesSudanSwedenSwitzerlandSyriaTaiwanThailandTrinidad and TobagoTurkeyUgandaUkraineUruguayUzbekistanVenezuelaVietnamWest IndiesWestern AfricaWestern AsiaWestern EuropeZaireZimbabwe
Immigrant Origin (Percentage)
AfghanistanAfricaArgentinaArmeniaAsiaAustraliaAustriaBahamasBangladeshBarbadosBelarusBelgiumBelizeBoliviaBosnia and HerzegovinaBrazilBulgariaCambodiaCameroonCanadaCaribbeanCentral AmericaChileChinaColombiaCongoCosta RicaCroatiaCubaCzechoslovakiaDenmarkDominicaDominican RepublicEastern AfricaEastern AsiaEastern EuropeEcuadorEgyptEl SalvadorEnglandEritreaEthiopiaEuropeFranceGermanyGhanaGreeceGrenadaGuatemalaGuyanaHaitiHondurasHong KongHungaryIndiaIndonesiaIranIraqIrelandIsraelItalyJamaicaJapanJordanKenyaKoreaKuwaitLaosLatin AmericaLatviaLebanonLiberiaLithuaniaMalaysiaMexicoMiddle AfricaMoldovaMoroccoNepalNetherlandsNicaraguaNigeriaNorthern AfricaNorthern EuropeOceaniaPakistanPanamaPeruPhilippinesPolandPortugalRomaniaRussiaSaudi ArabiaScotlandSenegalSerbiaSierra LeoneSingaporeSouth AfricaSouth AmericaSouth Central AsiaSouth Eastern AsiaSouthern EuropeSpainSri LankaSt. Vincent and the GrenadinesSudanSwedenSwitzerlandSyriaTaiwanThailandTrinidad and TobagoTurkeyUgandaUkraineUruguayUzbekistanVenezuelaVietnamWest IndiesWestern AfricaWestern AsiaWestern EuropeZaireZimbabwe
Income
Income (Families)
Income (Households)
Poverty
Poverty (Families)
Unemployment
Employment Occupations
Employment Industries
Employer Class
Commute Time
Commute Means
School Enrollment
Education by Degree Field
Occupancy
Finances
Physical Characteristics
Atlanta
Compare Zip Codes
Comparison Subject

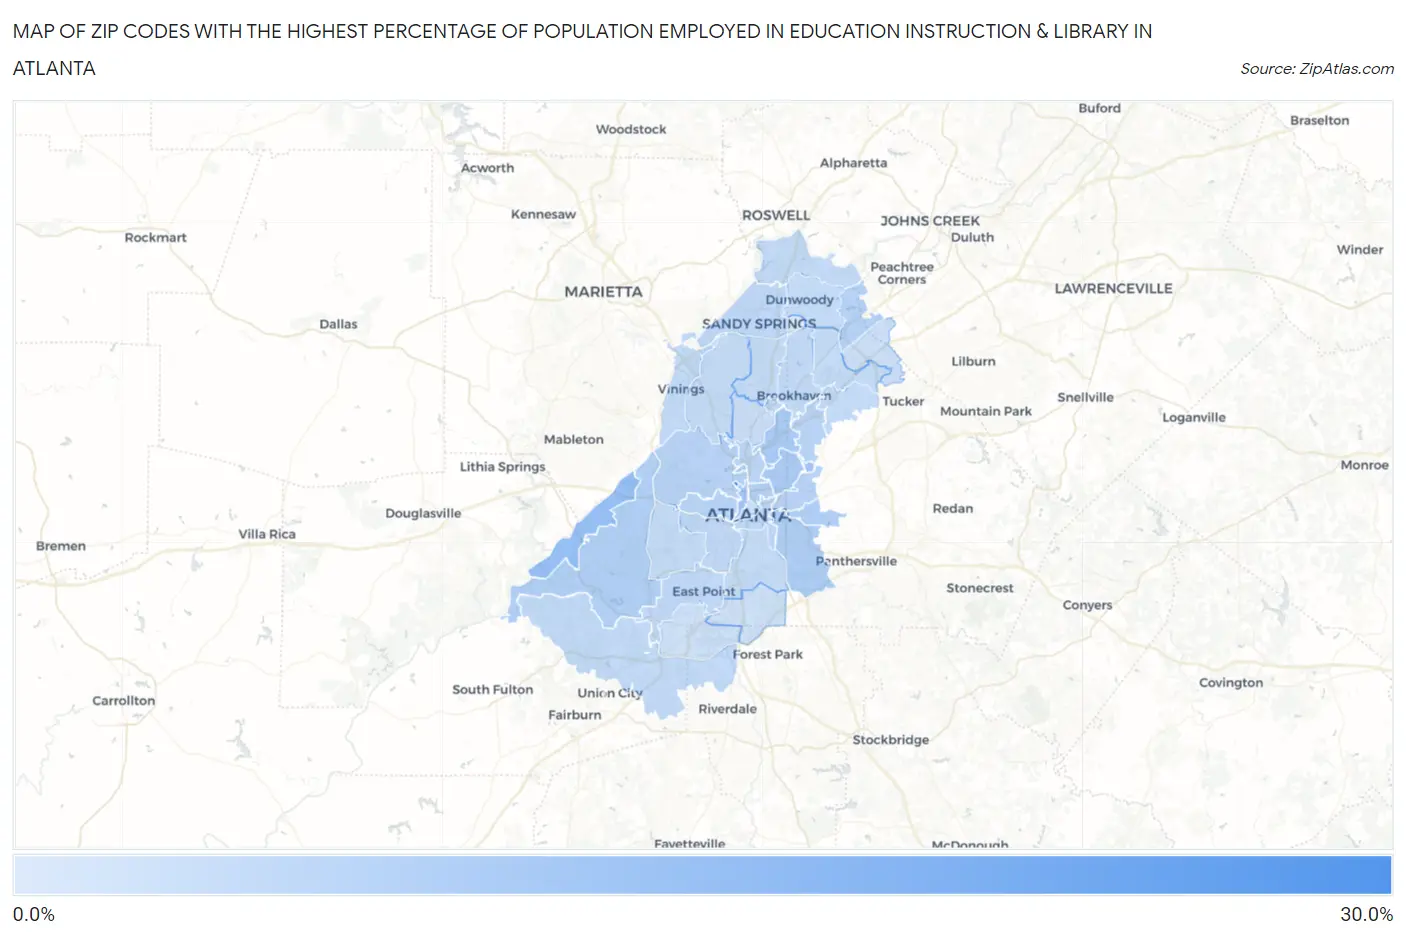
Map of Zip Codes with the Highest Percentage of Population Employed in Education Instruction & Library in Atlanta

0.0%
30.0%
Zip Codes with the Highest Percentage of Population Employed in Education Instruction & Library in Atlanta Map

Zip Codes with the Highest Percentage of Population Employed in Education Instruction & Library in Atlanta, GA

Zip Code % Employed vs State vs National
1.3033228.1%6.3%(+21.8)#46.2%(+21.9)#293
2.3033612.9%6.3%(+6.57)#406.2%(+6.73)#1,939
3.3032211.5%6.3%(+5.12)#586.2%(+5.28)#2,729
4.3031311.2%6.3%(+4.88)#636.2%(+5.03)#2,904
5.303249.6%6.3%(+3.25)#936.2%(+3.40)#4,422
6.303639.2%6.3%(+2.90)#1076.2%(+3.05)#4,884
7.303069.0%6.3%(+2.68)#1176.2%(+2.84)#5,194
8.303168.6%6.3%(+2.27)#1336.2%(+2.43)#5,898
9.303178.5%6.3%(+2.14)#1386.2%(+2.30)#6,129
10.303318.1%6.3%(+1.74)#1566.2%(+1.90)#6,963
11.303087.8%6.3%(+1.48)#1736.2%(+1.64)#7,580
12.303607.5%6.3%(+1.16)#2056.2%(+1.31)#8,434
13.303077.3%6.3%(+0.918)#2366.2%(+1.08)#9,122
14.303187.2%6.3%(+0.877)#2396.2%(+1.04)#9,245
15.303146.9%6.3%(+0.607)#2666.2%(+0.766)#10,080
16.303296.7%6.3%(+0.365)#2906.2%(+0.524)#10,882
17.303096.3%6.3%(-0.040)#3336.2%(+0.119)#12,353
18.303445.8%6.3%(-0.591)#3796.2%(-0.432)#14,527
19.303265.6%6.3%(-0.717)#3956.2%(-0.558)#15,058
20.303125.6%6.3%(-0.748)#3986.2%(-0.589)#15,177
21.303105.5%6.3%(-0.832)#4096.2%(-0.673)#15,516
22.303285.5%6.3%(-0.842)#4116.2%(-0.683)#15,552
23.303455.4%6.3%(-0.900)#4136.2%(-0.741)#15,791
24.303395.3%6.3%(-0.998)#4216.2%(-0.839)#16,217
25.303195.3%6.3%(-1.03)#4266.2%(-0.876)#16,349
26.303495.3%6.3%(-1.05)#4316.2%(-0.895)#16,417
27.303505.1%6.3%(-1.23)#4426.2%(-1.07)#17,160
28.303155.1%6.3%(-1.26)#4486.2%(-1.10)#17,310
29.303275.0%6.3%(-1.32)#4546.2%(-1.16)#17,547
30.303415.0%6.3%(-1.38)#4606.2%(-1.22)#17,821
31.303114.9%6.3%(-1.41)#4616.2%(-1.25)#17,925
32.303384.7%6.3%(-1.60)#4736.2%(-1.44)#18,744
33.303424.7%6.3%(-1.60)#4746.2%(-1.44)#18,745
34.303034.2%6.3%(-2.15)#5156.2%(-1.99)#20,942
35.303054.1%6.3%(-2.29)#5236.2%(-2.13)#21,471
36.303403.9%6.3%(-2.44)#5326.2%(-2.28)#22,018
37.303373.5%6.3%(-2.85)#5596.2%(-2.69)#23,385
38.303543.2%6.3%(-3.12)#5826.2%(-2.96)#24,250
39.303461.2%6.3%(-5.18)#6546.2%(-5.02)#28,068

Common Questions

What are the Top 10 Zip Codes with the Highest Percentage of Population Employed in Education Instruction & Library in Atlanta, GA?
Top 10 Zip Codes with the Highest Percentage of Population Employed in Education Instruction & Library in Atlanta, GA are:
#1
28.1%
#2
12.9%
#3
11.5%
#4
11.2%
#5
9.6%
#6
9.2%
#7
9.0%
#8
8.6%
#9
8.5%
#10
8.1%
What zip code has the Highest Percentage of Population Employed in Education Instruction & Library in Atlanta, GA?
30332 has the Highest Percentage of Population Employed in Education Instruction & Library in Atlanta, GA with 28.1%.
What is the Percentage of Population Employed in Education Instruction & Library in Atlanta, GA?
Percentage of Population Employed in Education Instruction & Library in Atlanta is 6.9%.
What is the Percentage of Population Employed in Education Instruction & Library in Georgia?
Percentage of Population Employed in Education Instruction & Library in Georgia is 6.3%.
What is the Percentage of Population Employed in Education Instruction & Library in the United States?
Percentage of Population Employed in Education Instruction & Library in the United States is 6.2%.