Lealman, FL Map & Demographics
Lealman Map
Lealman Overview
$25,268
PER CAPITA INCOME
$54,123
AVG FAMILY INCOME
$45,522
AVG HOUSEHOLD INCOME
11.1%
WAGE / INCOME GAP [ % ]
88.9¢/ $1
WAGE / INCOME GAP [ $ ]
$11,071
FAMILY INCOME DEFICIT
0.40
INEQUALITY / GINI INDEX
21,237
TOTAL POPULATION
10,373
MALE POPULATION
10,864
FEMALE POPULATION
95.48
MALES / 100 FEMALES
104.73
FEMALES / 100 MALES
41.0
MEDIAN AGE
3.1
AVG FAMILY SIZE
2.4
AVG HOUSEHOLD SIZE
10,676
LABOR FORCE [ PEOPLE ]
59.7%
PERCENT IN LABOR FORCE
6.9%
UNEMPLOYMENT RATE
Lealman Area Codes
Income in Lealman
Income Overview in Lealman
Per Capita Income in Lealman is $25,268, while median incomes of families and households are $54,123 and $45,522 respectively.
| Characteristic | Number | Measure |
| Per Capita Income | 21,237 | $25,268 |
| Median Family Income | 5,057 | $54,123 |
| Mean Family Income | 5,057 | $65,788 |
| Median Household Income | 8,838 | $45,522 |
| Mean Household Income | 8,838 | $56,243 |
| Income Deficit | 5,057 | $11,071 |
| Wage / Income Gap (%) | 21,237 | 11.11% |
| Wage / Income Gap ($) | 21,237 | 88.89¢ per $1 |
| Gini / Inequality Index | 21,237 | 0.40 |
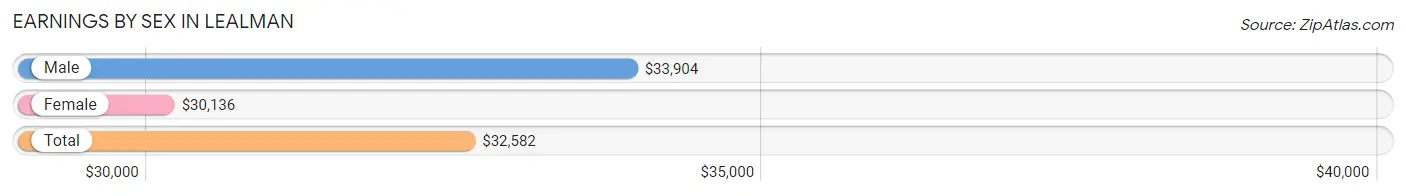
Earnings by Sex in Lealman
Average Earnings in Lealman are $32,582, $33,904 for men and $30,136 for women, a difference of 11.1%.
| Sex | Number | Average Earnings |
| Male | 5,775 (53.4%) | $33,904 |
| Female | 5,036 (46.6%) | $30,136 |
| Total | 10,811 (100.0%) | $32,582 |
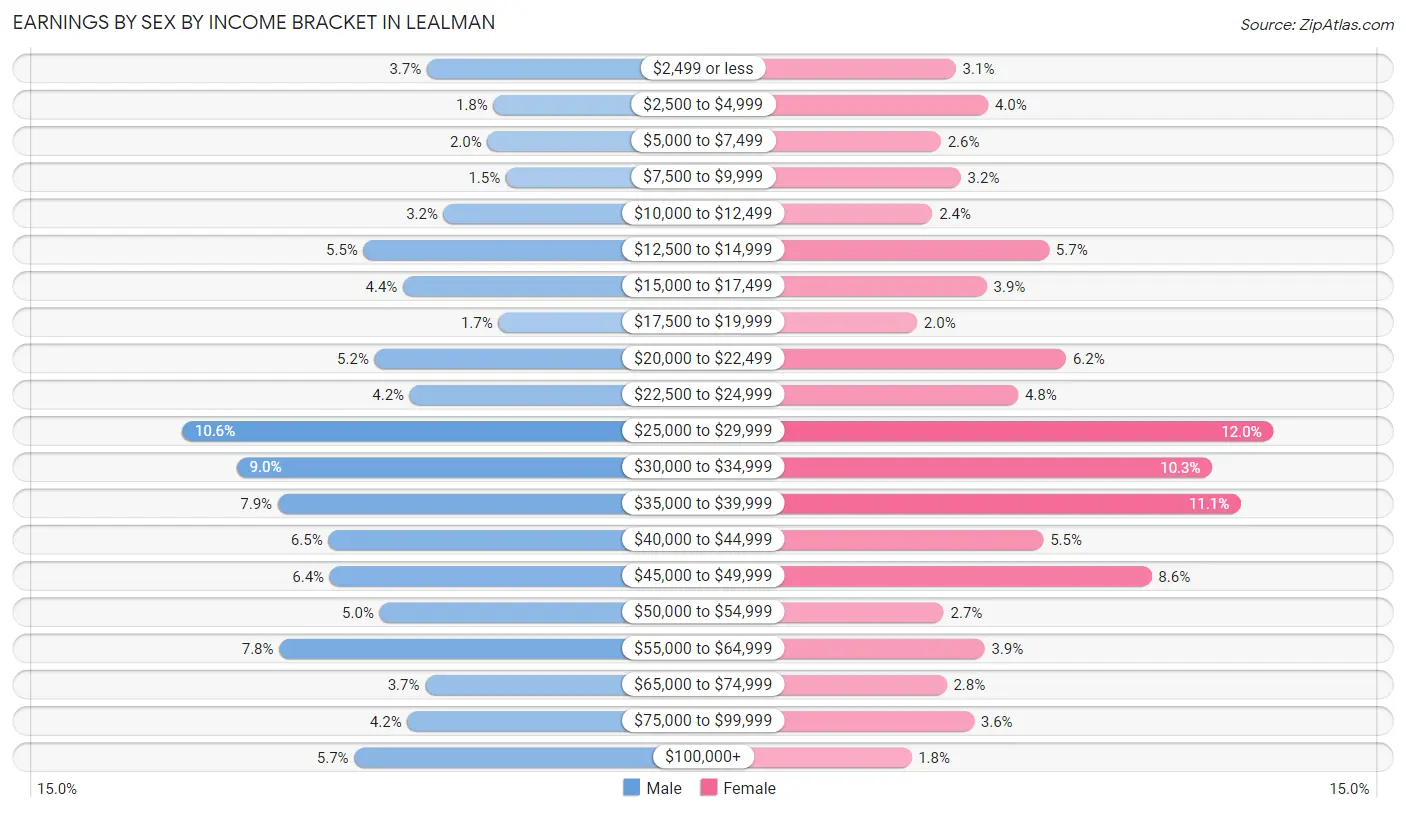
Earnings by Sex by Income Bracket in Lealman
The most common earnings brackets in Lealman are $25,000 to $29,999 for men (611 | 10.6%) and $25,000 to $29,999 for women (604 | 12.0%).
| Income | Male | Female |
| $2,499 or less | 213 (3.7%) | 154 (3.1%) |
| $2,500 to $4,999 | 105 (1.8%) | 200 (4.0%) |
| $5,000 to $7,499 | 115 (2.0%) | 133 (2.6%) |
| $7,500 to $9,999 | 85 (1.5%) | 161 (3.2%) |
| $10,000 to $12,499 | 186 (3.2%) | 121 (2.4%) |
| $12,500 to $14,999 | 316 (5.5%) | 286 (5.7%) |
| $15,000 to $17,499 | 252 (4.4%) | 198 (3.9%) |
| $17,500 to $19,999 | 97 (1.7%) | 99 (2.0%) |
| $20,000 to $22,499 | 298 (5.2%) | 310 (6.2%) |
| $22,500 to $24,999 | 241 (4.2%) | 242 (4.8%) |
| $25,000 to $29,999 | 611 (10.6%) | 604 (12.0%) |
| $30,000 to $34,999 | 522 (9.0%) | 517 (10.3%) |
| $35,000 to $39,999 | 455 (7.9%) | 558 (11.1%) |
| $40,000 to $44,999 | 373 (6.5%) | 278 (5.5%) |
| $45,000 to $49,999 | 371 (6.4%) | 431 (8.6%) |
| $50,000 to $54,999 | 290 (5.0%) | 137 (2.7%) |
| $55,000 to $64,999 | 453 (7.8%) | 195 (3.9%) |
| $65,000 to $74,999 | 216 (3.7%) | 141 (2.8%) |
| $75,000 to $99,999 | 245 (4.2%) | 180 (3.6%) |
| $100,000+ | 331 (5.7%) | 91 (1.8%) |
| Total | 5,775 (100.0%) | 5,036 (100.0%) |
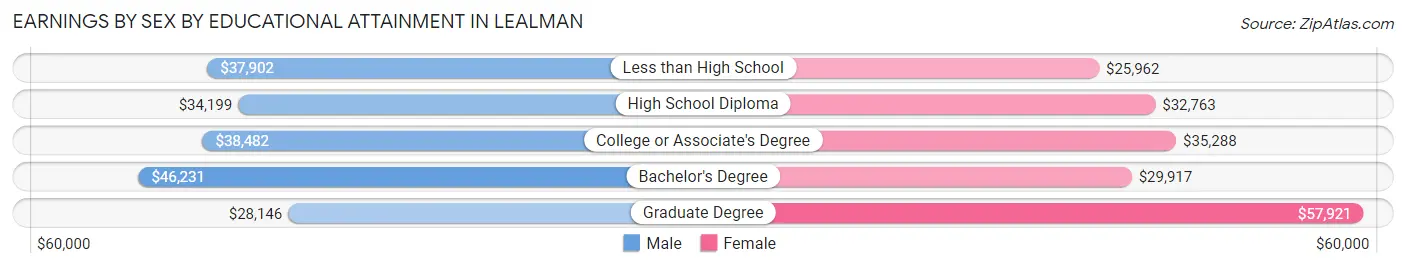
Earnings by Sex by Educational Attainment in Lealman
Average earnings in Lealman are $36,730 for men and $31,800 for women, a difference of 13.4%. Men with an educational attainment of bachelor's degree enjoy the highest average annual earnings of $46,231, while those with graduate degree education earn the least with $28,146. Women with an educational attainment of graduate degree earn the most with the average annual earnings of $57,921, while those with less than high school education have the smallest earnings of $25,962.
| Educational Attainment | Male Income | Female Income |
| Less than High School | $37,902 | $25,962 |
| High School Diploma | $34,199 | $32,763 |
| College or Associate's Degree | $38,482 | $35,288 |
| Bachelor's Degree | $46,231 | $29,917 |
| Graduate Degree | $28,146 | $57,921 |
| Total | $36,730 | $31,800 |
Family Income in Lealman
Family Income Brackets in Lealman
According to the Lealman family income data, there are 1,097 families falling into the $50,000 to $74,999 income range, which is the most common income bracket and makes up 21.7% of all families. Conversely, the $200,000+ income bracket is the least frequent group with only 91 families (1.8%) belonging to this category.
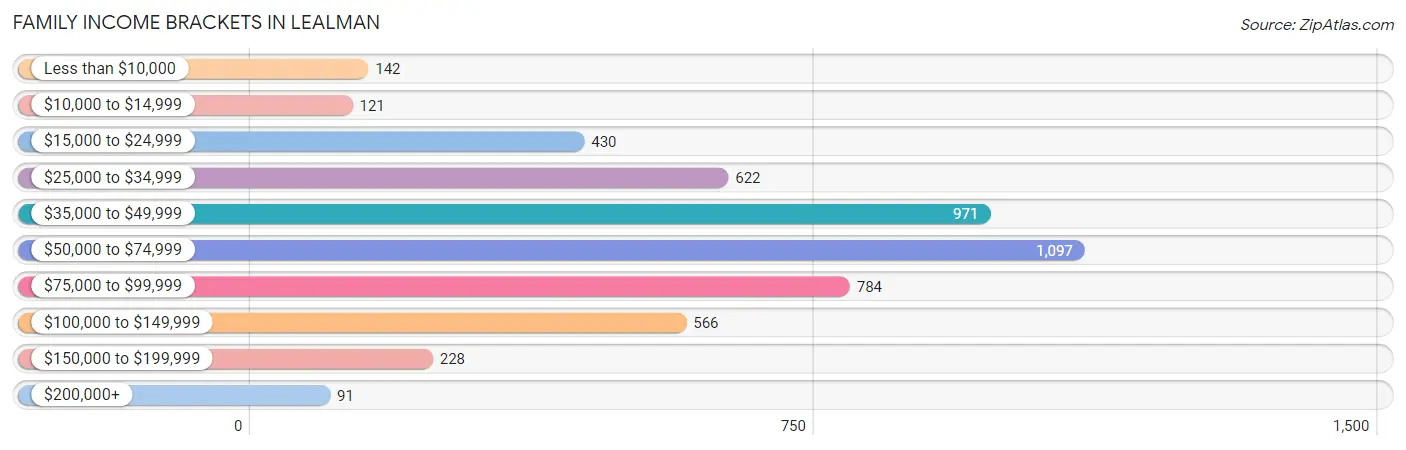
| Income Bracket | # Families | % Families |
| Less than $10,000 | 142 | 2.8% |
| $10,000 to $14,999 | 121 | 2.4% |
| $15,000 to $24,999 | 430 | 8.5% |
| $25,000 to $34,999 | 622 | 12.3% |
| $35,000 to $49,999 | 971 | 19.2% |
| $50,000 to $74,999 | 1,097 | 21.7% |
| $75,000 to $99,999 | 784 | 15.5% |
| $100,000 to $149,999 | 566 | 11.2% |
| $150,000 to $199,999 | 228 | 4.5% |
| $200,000+ | 91 | 1.8% |
Family Income by Famaliy Size in Lealman
5-person families (460 | 9.1%) account for the highest median family income in Lealman with $100,074 per family, while 2-person families (2,879 | 56.9%) have the highest median income of $25,496 per family member.
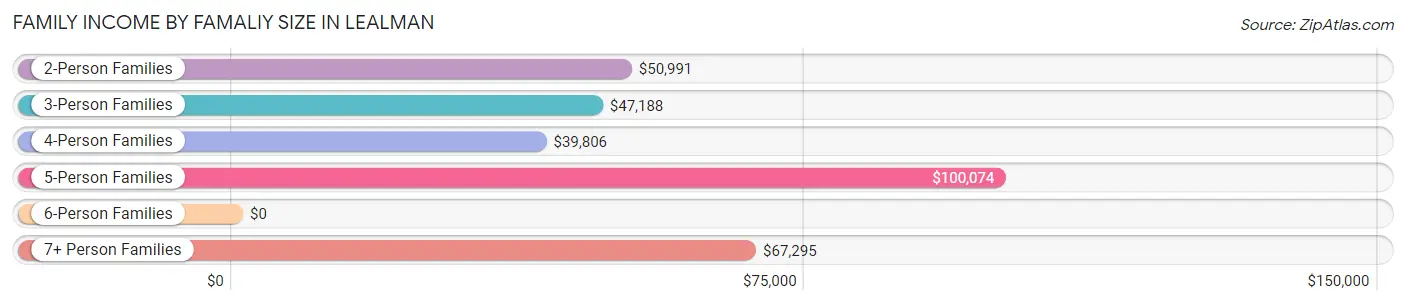
| Income Bracket | # Families | Median Income |
| 2-Person Families | 2,879 (56.9%) | $50,991 |
| 3-Person Families | 932 (18.4%) | $47,188 |
| 4-Person Families | 680 (13.5%) | $39,806 |
| 5-Person Families | 460 (9.1%) | $100,074 |
| 6-Person Families | 5 (0.1%) | $0 |
| 7+ Person Families | 101 (2.0%) | $67,295 |
| Total | 5,057 (100.0%) | $54,123 |
Family Income by Number of Earners in Lealman
The median family income in Lealman is $54,123, with families comprising 3+ earners (508) having the highest median family income of $113,654, while families with no earners (903) have the lowest median family income of $36,639, accounting for 10.1% and 17.9% of families, respectively.
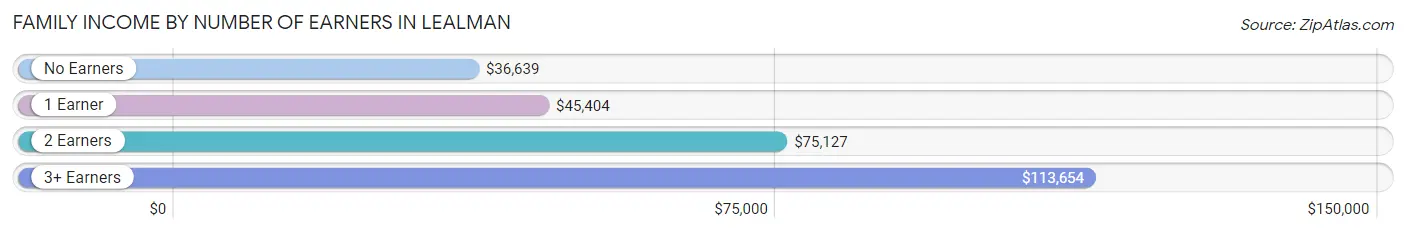
| Number of Earners | # Families | Median Income |
| No Earners | 903 (17.9%) | $36,639 |
| 1 Earner | 2,060 (40.7%) | $45,404 |
| 2 Earners | 1,586 (31.4%) | $75,127 |
| 3+ Earners | 508 (10.1%) | $113,654 |
| Total | 5,057 (100.0%) | $54,123 |
Household Income in Lealman
Household Income Brackets in Lealman
With 1,759 households falling in the category, the $50,000 to $74,999 income range is the most frequent in Lealman, accounting for 19.9% of all households. In contrast, only 168 households (1.9%) fall into the $200,000+ income bracket, making it the least populous group.
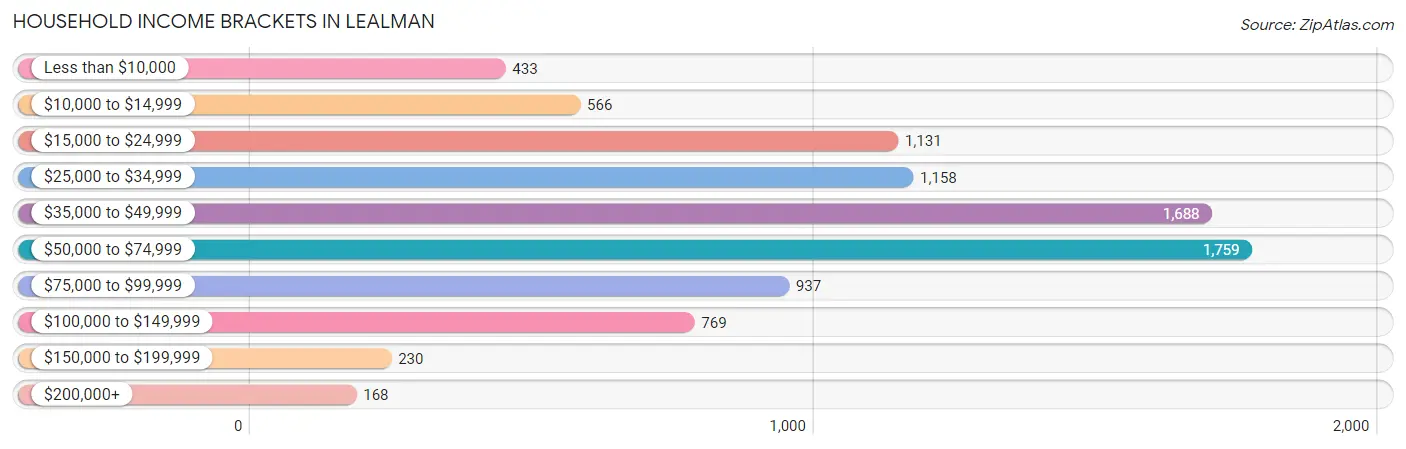
| Income Bracket | # Households | % Households |
| Less than $10,000 | 433 | 4.9% |
| $10,000 to $14,999 | 566 | 6.4% |
| $15,000 to $24,999 | 1,131 | 12.8% |
| $25,000 to $34,999 | 1,158 | 13.1% |
| $35,000 to $49,999 | 1,688 | 19.1% |
| $50,000 to $74,999 | 1,759 | 19.9% |
| $75,000 to $99,999 | 937 | 10.6% |
| $100,000 to $149,999 | 769 | 8.7% |
| $150,000 to $199,999 | 230 | 2.6% |
| $200,000+ | 168 | 1.9% |
Household Income by Householder Age in Lealman
The median household income in Lealman is $45,522, with the highest median household income of $69,583 found in the 15 to 24 years age bracket for the primary householder. A total of 62 households (0.7%) fall into this category. Meanwhile, the 65+ years age bracket for the primary householder has the lowest median household income of $29,651, with 2,781 households (31.5%) in this group.
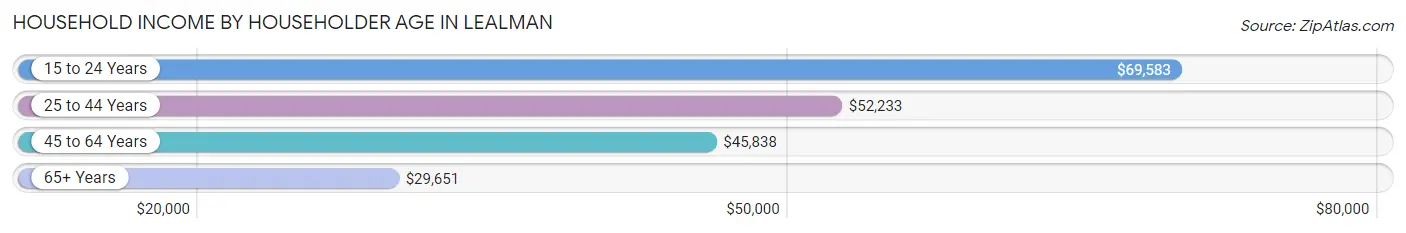
| Income Bracket | # Households | Median Income |
| 15 to 24 Years | 62 (0.7%) | $69,583 |
| 25 to 44 Years | 2,628 (29.7%) | $52,233 |
| 45 to 64 Years | 3,367 (38.1%) | $45,838 |
| 65+ Years | 2,781 (31.5%) | $29,651 |
| Total | 8,838 (100.0%) | $45,522 |
Poverty in Lealman
Income Below Poverty by Sex and Age in Lealman
With 11.0% poverty level for males and 13.5% for females among the residents of Lealman, 16 and 17 year old males and 16 and 17 year old females are the most vulnerable to poverty, with 60 males (33.3%) and 70 females (26.8%) in their respective age groups living below the poverty level.
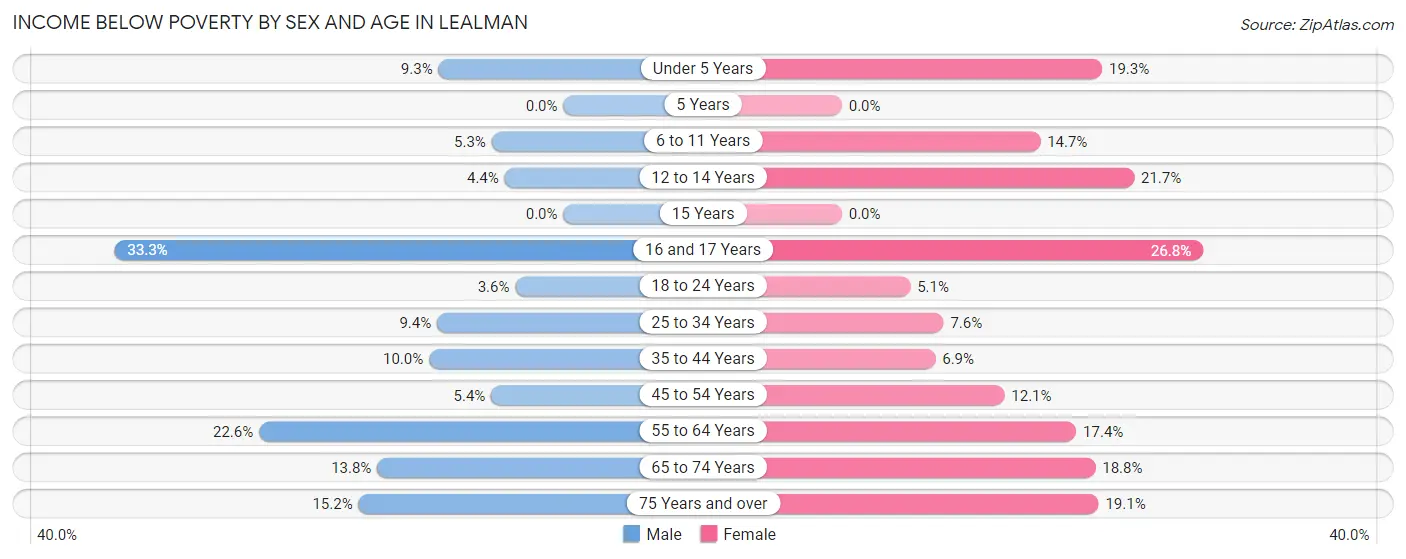
| Age Bracket | Male | Female |
| Under 5 Years | 23 (9.3%) | 91 (19.3%) |
| 5 Years | 0 (0.0%) | 0 (0.0%) |
| 6 to 11 Years | 43 (5.3%) | 123 (14.7%) |
| 12 to 14 Years | 14 (4.4%) | 46 (21.7%) |
| 15 Years | 0 (0.0%) | 0 (0.0%) |
| 16 and 17 Years | 60 (33.3%) | 70 (26.8%) |
| 18 to 24 Years | 27 (3.6%) | 35 (5.1%) |
| 25 to 34 Years | 154 (9.4%) | 138 (7.5%) |
| 35 to 44 Years | 155 (10.0%) | 70 (6.9%) |
| 45 to 54 Years | 78 (5.4%) | 148 (12.1%) |
| 55 to 64 Years | 347 (22.6%) | 274 (17.4%) |
| 65 to 74 Years | 150 (13.8%) | 290 (18.8%) |
| 75 Years and over | 80 (15.2%) | 174 (19.1%) |
| Total | 1,131 (11.0%) | 1,459 (13.5%) |
Income Above Poverty by Sex and Age in Lealman
According to the poverty statistics in Lealman, males aged 5 years and females aged 5 years are the age groups that are most secure financially, with 100.0% of males and 100.0% of females in these age groups living above the poverty line.
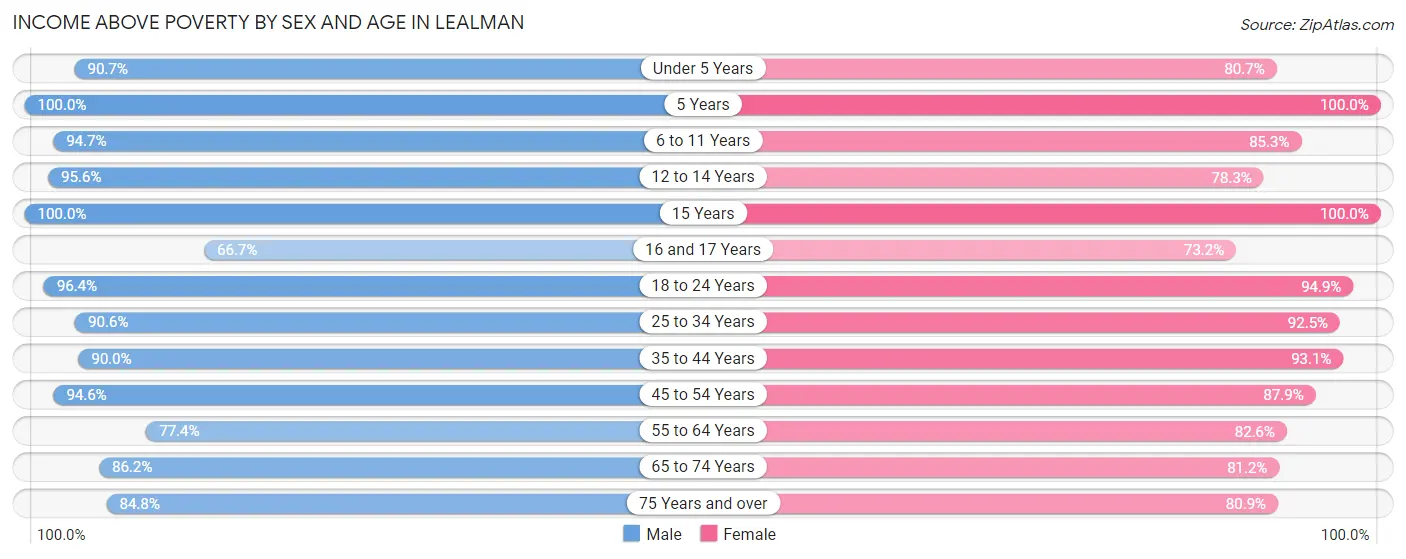
| Age Bracket | Male | Female |
| Under 5 Years | 225 (90.7%) | 380 (80.7%) |
| 5 Years | 99 (100.0%) | 186 (100.0%) |
| 6 to 11 Years | 766 (94.7%) | 712 (85.3%) |
| 12 to 14 Years | 307 (95.6%) | 166 (78.3%) |
| 15 Years | 102 (100.0%) | 66 (100.0%) |
| 16 and 17 Years | 120 (66.7%) | 191 (73.2%) |
| 18 to 24 Years | 729 (96.4%) | 654 (94.9%) |
| 25 to 34 Years | 1,488 (90.6%) | 1,690 (92.4%) |
| 35 to 44 Years | 1,400 (90.0%) | 938 (93.1%) |
| 45 to 54 Years | 1,378 (94.6%) | 1,078 (87.9%) |
| 55 to 64 Years | 1,189 (77.4%) | 1,301 (82.6%) |
| 65 to 74 Years | 935 (86.2%) | 1,251 (81.2%) |
| 75 Years and over | 446 (84.8%) | 739 (80.9%) |
| Total | 9,184 (89.0%) | 9,352 (86.5%) |
Income Below Poverty Among Married-Couple Families in Lealman
The poverty statistics for married-couple families in Lealman show that 7.0% or 207 of the total 2,972 families live below the poverty line. Families with no children have the highest poverty rate of 8.1%, comprising of 149 families. On the other hand, families with 3 or 4 children have the lowest poverty rate of 0.0%, which includes 0 families.
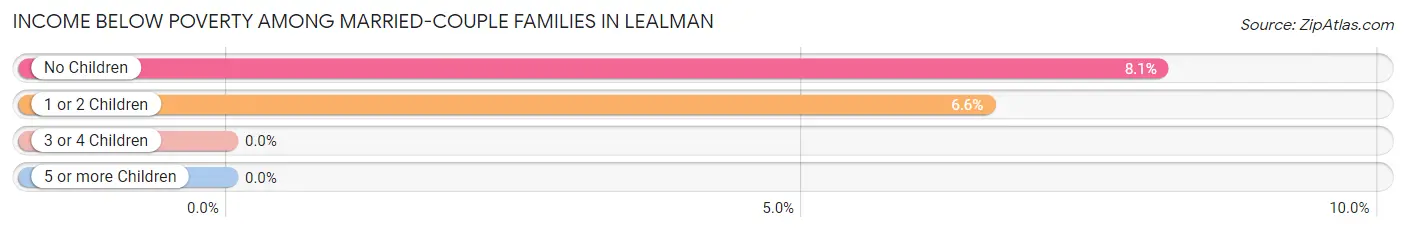
| Children | Above Poverty | Below Poverty |
| No Children | 1,690 (91.9%) | 149 (8.1%) |
| 1 or 2 Children | 822 (93.4%) | 58 (6.6%) |
| 3 or 4 Children | 170 (100.0%) | 0 (0.0%) |
| 5 or more Children | 83 (100.0%) | 0 (0.0%) |
| Total | 2,765 (93.0%) | 207 (7.0%) |
Income Below Poverty Among Single-Parent Households in Lealman
According to the poverty data in Lealman, 5.5% or 33 single-father households and 10.9% or 162 single-mother households are living below the poverty line. Among single-father households, those with 1 or 2 children have the highest poverty rate, with 26 households (15.2%) experiencing poverty. Likewise, among single-mother households, those with 1 or 2 children have the highest poverty rate, with 140 households (29.7%) falling below the poverty line.
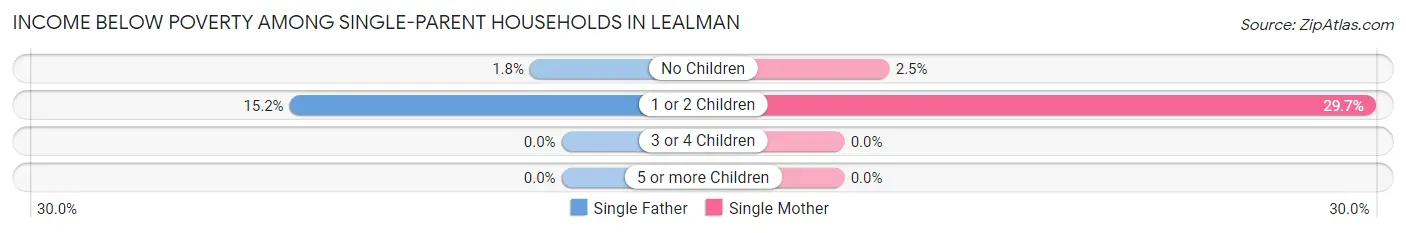
| Children | Single Father | Single Mother |
| No Children | 7 (1.8%) | 22 (2.5%) |
| 1 or 2 Children | 26 (15.2%) | 140 (29.7%) |
| 3 or 4 Children | 0 (0.0%) | 0 (0.0%) |
| 5 or more Children | 0 (0.0%) | 0 (0.0%) |
| Total | 33 (5.5%) | 162 (10.9%) |
Income Below Poverty Among Married-Couple vs Single-Parent Households in Lealman
The poverty data for Lealman shows that 207 of the married-couple family households (7.0%) and 195 of the single-parent households (9.3%) are living below the poverty level. Within the married-couple family households, those with no children have the highest poverty rate, with 149 households (8.1%) falling below the poverty line. Among the single-parent households, those with 1 or 2 children have the highest poverty rate, with 166 household (25.9%) living below poverty.
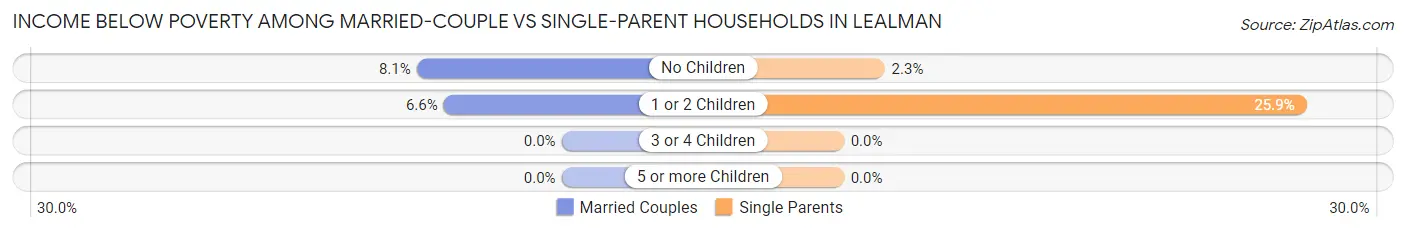
| Children | Married-Couple Families | Single-Parent Households |
| No Children | 149 (8.1%) | 29 (2.3%) |
| 1 or 2 Children | 58 (6.6%) | 166 (25.9%) |
| 3 or 4 Children | 0 (0.0%) | 0 (0.0%) |
| 5 or more Children | 0 (0.0%) | 0 (0.0%) |
| Total | 207 (7.0%) | 195 (9.3%) |
Race in Lealman
The most populous races in Lealman are White / Caucasian (14,261 | 67.1%), Black / African American (2,840 | 13.4%), and Hispanic or Latino (2,713 | 12.8%).
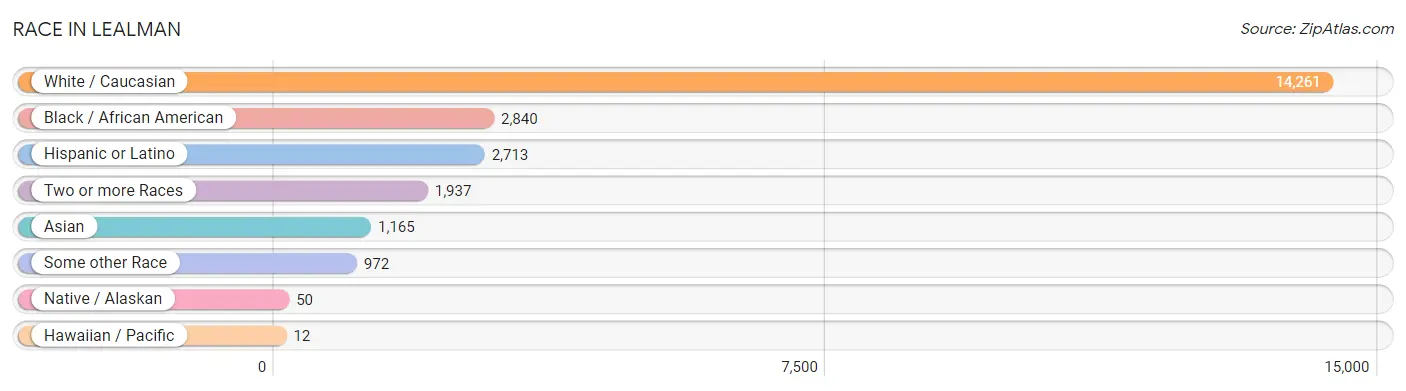
| Race | # Population | % Population |
| Asian | 1,165 | 5.5% |
| Black / African American | 2,840 | 13.4% |
| Hawaiian / Pacific | 12 | 0.1% |
| Hispanic or Latino | 2,713 | 12.8% |
| Native / Alaskan | 50 | 0.2% |
| White / Caucasian | 14,261 | 67.1% |
| Two or more Races | 1,937 | 9.1% |
| Some other Race | 972 | 4.6% |
| Total | 21,237 | 100.0% |
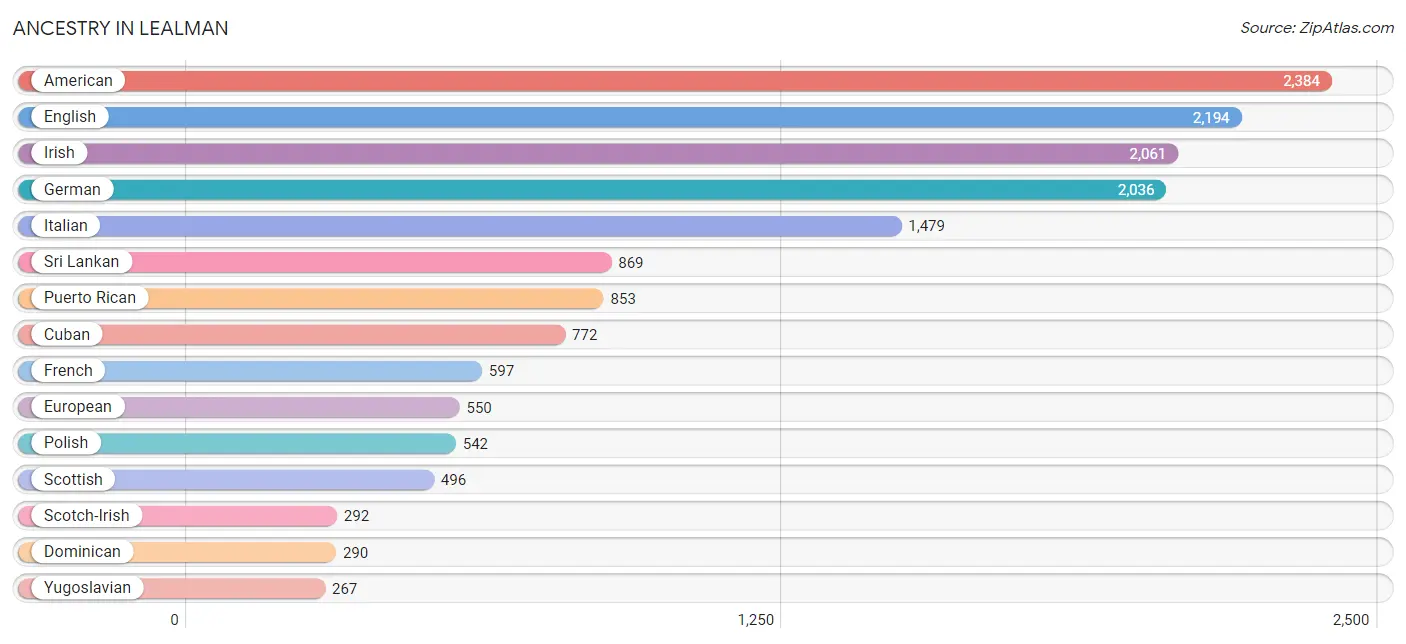
Ancestry in Lealman
The most populous ancestries reported in Lealman are American (2,384 | 11.2%), English (2,194 | 10.3%), Irish (2,061 | 9.7%), German (2,036 | 9.6%), and Italian (1,479 | 7.0%), together accounting for 47.8% of all Lealman residents.
| Ancestry | # Population | % Population |
| African | 199 | 0.9% |
| Albanian | 86 | 0.4% |
| American | 2,384 | 11.2% |
| Arab | 41 | 0.2% |
| Austrian | 30 | 0.1% |
| Bhutanese | 68 | 0.3% |
| Brazilian | 13 | 0.1% |
| British | 62 | 0.3% |
| Burmese | 102 | 0.5% |
| Cajun | 10 | 0.1% |
| Cambodian | 9 | 0.0% |
| Canadian | 47 | 0.2% |
| Central American | 210 | 1.0% |
| Cherokee | 25 | 0.1% |
| Chippewa | 14 | 0.1% |
| Choctaw | 11 | 0.1% |
| Colombian | 36 | 0.2% |
| Costa Rican | 25 | 0.1% |
| Creek | 14 | 0.1% |
| Croatian | 36 | 0.2% |
| Cuban | 772 | 3.6% |
| Czech | 46 | 0.2% |
| Czechoslovakian | 40 | 0.2% |
| Danish | 57 | 0.3% |
| Dominican | 290 | 1.4% |
| Dutch | 155 | 0.7% |
| Eastern European | 25 | 0.1% |
| Ecuadorian | 7 | 0.0% |
| English | 2,194 | 10.3% |
| European | 550 | 2.6% |
| Finnish | 62 | 0.3% |
| French | 597 | 2.8% |
| French Canadian | 189 | 0.9% |
| German | 2,036 | 9.6% |
| Greek | 88 | 0.4% |
| Guamanian / Chamorro | 12 | 0.1% |
| Guatemalan | 17 | 0.1% |
| Honduran | 119 | 0.6% |
| Hungarian | 81 | 0.4% |
| Indian (Asian) | 118 | 0.6% |
| Irish | 2,061 | 9.7% |
| Italian | 1,479 | 7.0% |
| Jamaican | 8 | 0.0% |
| Japanese | 100 | 0.5% |
| Korean | 68 | 0.3% |
| Latvian | 13 | 0.1% |
| Lebanese | 22 | 0.1% |
| Lithuanian | 55 | 0.3% |
| Macedonian | 40 | 0.2% |
| Malaysian | 235 | 1.1% |
| Mexican | 182 | 0.9% |
| Native Hawaiian | 51 | 0.2% |
| Nigerian | 32 | 0.2% |
| Northern European | 34 | 0.2% |
| Norwegian | 221 | 1.0% |
| Pakistani | 61 | 0.3% |
| Panamanian | 36 | 0.2% |
| Pennsylvania German | 13 | 0.1% |
| Polish | 542 | 2.5% |
| Portuguese | 57 | 0.3% |
| Puerto Rican | 853 | 4.0% |
| Russian | 96 | 0.4% |
| Salvadoran | 13 | 0.1% |
| Samoan | 7 | 0.0% |
| Scotch-Irish | 292 | 1.4% |
| Scottish | 496 | 2.3% |
| Serbian | 256 | 1.2% |
| Shoshone | 9 | 0.0% |
| Slovak | 18 | 0.1% |
| Slovene | 14 | 0.1% |
| South African | 9 | 0.0% |
| South American | 92 | 0.4% |
| Spaniard | 66 | 0.3% |
| Spanish | 53 | 0.3% |
| Spanish American Indian | 8 | 0.0% |
| Sri Lankan | 869 | 4.1% |
| Subsaharan African | 240 | 1.1% |
| Swedish | 81 | 0.4% |
| Swiss | 57 | 0.3% |
| Syrian | 11 | 0.1% |
| Thai | 61 | 0.3% |
| Trinidadian and Tobagonian | 15 | 0.1% |
| Ukrainian | 23 | 0.1% |
| Venezuelan | 49 | 0.2% |
| Welsh | 106 | 0.5% |
| West Indian | 62 | 0.3% |
| Yugoslavian | 267 | 1.3% | View All 87 Rows |
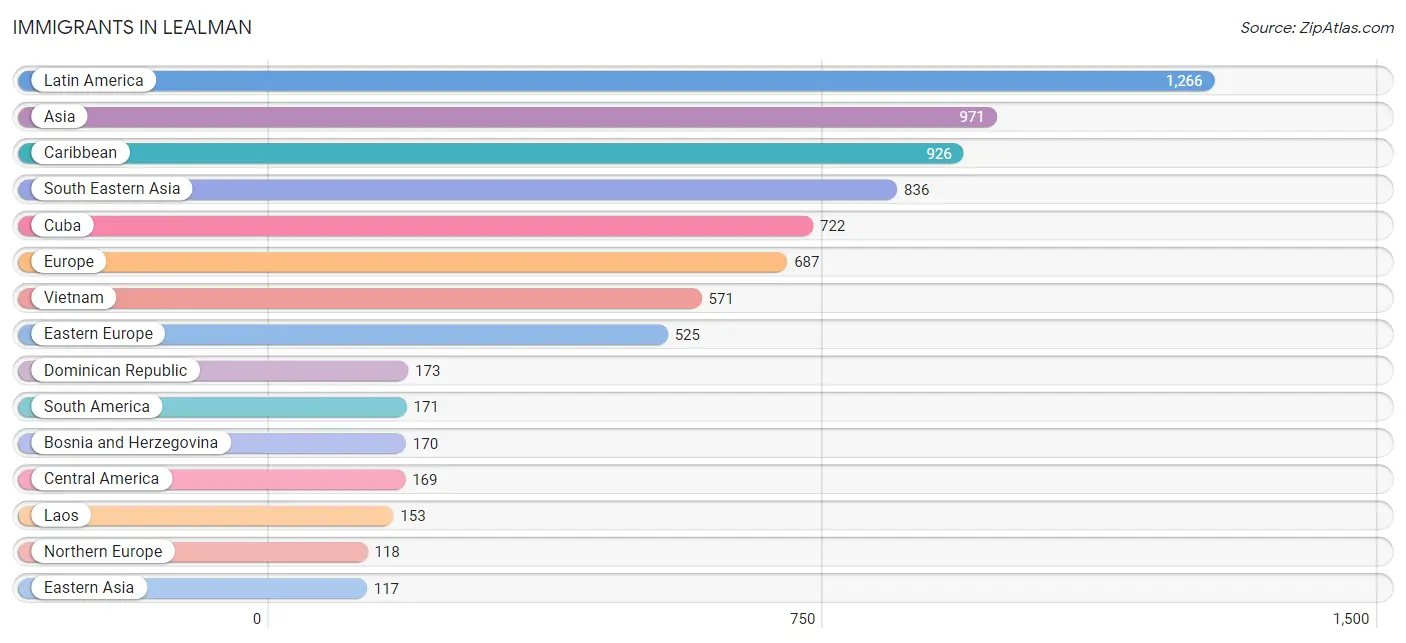
Immigrants in Lealman
The most numerous immigrant groups reported in Lealman came from Latin America (1,266 | 6.0%), Asia (971 | 4.6%), Caribbean (926 | 4.4%), South Eastern Asia (836 | 3.9%), and Cuba (722 | 3.4%), together accounting for 22.2% of all Lealman residents.
| Immigration Origin | # Population | % Population |
| Africa | 34 | 0.2% |
| Albania | 47 | 0.2% |
| Asia | 971 | 4.6% |
| Australia | 18 | 0.1% |
| Bosnia and Herzegovina | 170 | 0.8% |
| Brazil | 39 | 0.2% |
| Cambodia | 23 | 0.1% |
| Canada | 104 | 0.5% |
| Caribbean | 926 | 4.4% |
| Central America | 169 | 0.8% |
| China | 21 | 0.1% |
| Colombia | 72 | 0.3% |
| Costa Rica | 23 | 0.1% |
| Cuba | 722 | 3.4% |
| Dominican Republic | 173 | 0.8% |
| Eastern Africa | 22 | 0.1% |
| Eastern Asia | 117 | 0.5% |
| Eastern Europe | 525 | 2.5% |
| El Salvador | 13 | 0.1% |
| England | 55 | 0.3% |
| Europe | 687 | 3.2% |
| Germany | 9 | 0.0% |
| Guatemala | 17 | 0.1% |
| Honduras | 116 | 0.5% |
| India | 18 | 0.1% |
| Ireland | 14 | 0.1% |
| Italy | 15 | 0.1% |
| Jamaica | 16 | 0.1% |
| Japan | 11 | 0.1% |
| Kenya | 22 | 0.1% |
| Korea | 85 | 0.4% |
| Laos | 153 | 0.7% |
| Latin America | 1,266 | 6.0% |
| Latvia | 8 | 0.0% |
| North Macedonia | 40 | 0.2% |
| Northern Europe | 118 | 0.6% |
| Oceania | 18 | 0.1% |
| Philippines | 68 | 0.3% |
| Poland | 52 | 0.2% |
| Portugal | 11 | 0.1% |
| Russia | 17 | 0.1% |
| Serbia | 100 | 0.5% |
| South Africa | 12 | 0.1% |
| South America | 171 | 0.8% |
| South Central Asia | 18 | 0.1% |
| South Eastern Asia | 836 | 3.9% |
| Southern Europe | 35 | 0.2% |
| Spain | 9 | 0.0% |
| Thailand | 21 | 0.1% |
| Trinidad and Tobago | 15 | 0.1% |
| Ukraine | 37 | 0.2% |
| Uruguay | 11 | 0.1% |
| Venezuela | 49 | 0.2% |
| Vietnam | 571 | 2.7% |
| Western Europe | 9 | 0.0% | View All 55 Rows |
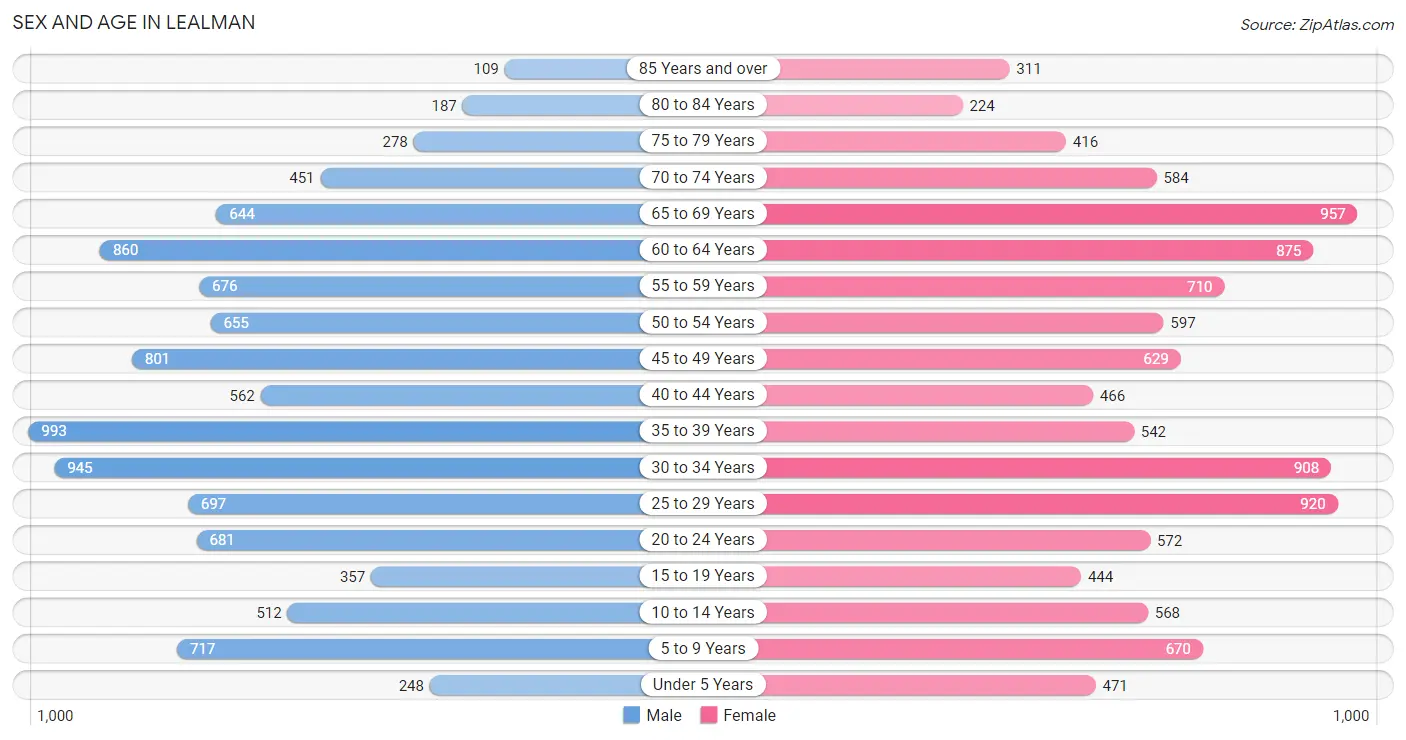
Sex and Age in Lealman
Sex and Age in Lealman
The most populous age groups in Lealman are 35 to 39 Years (993 | 9.6%) for men and 65 to 69 Years (957 | 8.8%) for women.
| Age Bracket | Male | Female |
| Under 5 Years | 248 (2.4%) | 471 (4.3%) |
| 5 to 9 Years | 717 (6.9%) | 670 (6.2%) |
| 10 to 14 Years | 512 (4.9%) | 568 (5.2%) |
| 15 to 19 Years | 357 (3.4%) | 444 (4.1%) |
| 20 to 24 Years | 681 (6.6%) | 572 (5.3%) |
| 25 to 29 Years | 697 (6.7%) | 920 (8.5%) |
| 30 to 34 Years | 945 (9.1%) | 908 (8.4%) |
| 35 to 39 Years | 993 (9.6%) | 542 (5.0%) |
| 40 to 44 Years | 562 (5.4%) | 466 (4.3%) |
| 45 to 49 Years | 801 (7.7%) | 629 (5.8%) |
| 50 to 54 Years | 655 (6.3%) | 597 (5.5%) |
| 55 to 59 Years | 676 (6.5%) | 710 (6.5%) |
| 60 to 64 Years | 860 (8.3%) | 875 (8.1%) |
| 65 to 69 Years | 644 (6.2%) | 957 (8.8%) |
| 70 to 74 Years | 451 (4.3%) | 584 (5.4%) |
| 75 to 79 Years | 278 (2.7%) | 416 (3.8%) |
| 80 to 84 Years | 187 (1.8%) | 224 (2.1%) |
| 85 Years and over | 109 (1.1%) | 311 (2.9%) |
| Total | 10,373 (100.0%) | 10,864 (100.0%) |
Families and Households in Lealman
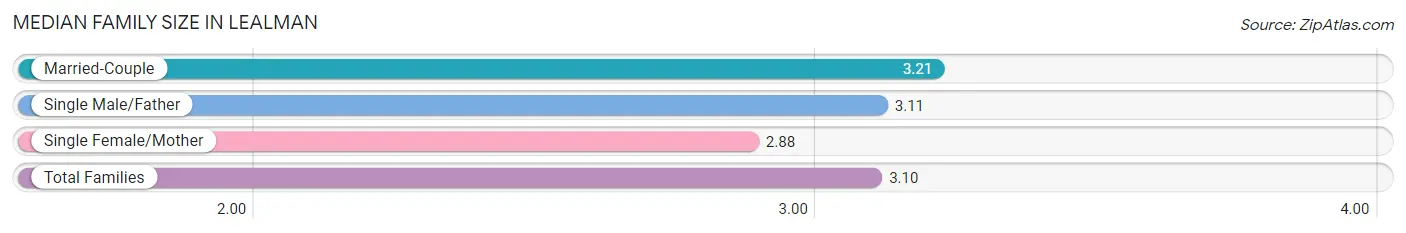
Median Family Size in Lealman
The median family size in Lealman is 3.10 persons per family, with married-couple families (2,972 | 58.8%) accounting for the largest median family size of 3.21 persons per family. On the other hand, single female/mother families (1,482 | 29.3%) represent the smallest median family size with 2.88 persons per family.
| Family Type | # Families | Family Size |
| Married-Couple | 2,972 (58.8%) | 3.21 |
| Single Male/Father | 603 (11.9%) | 3.11 |
| Single Female/Mother | 1,482 (29.3%) | 2.88 |
| Total Families | 5,057 (100.0%) | 3.10 |
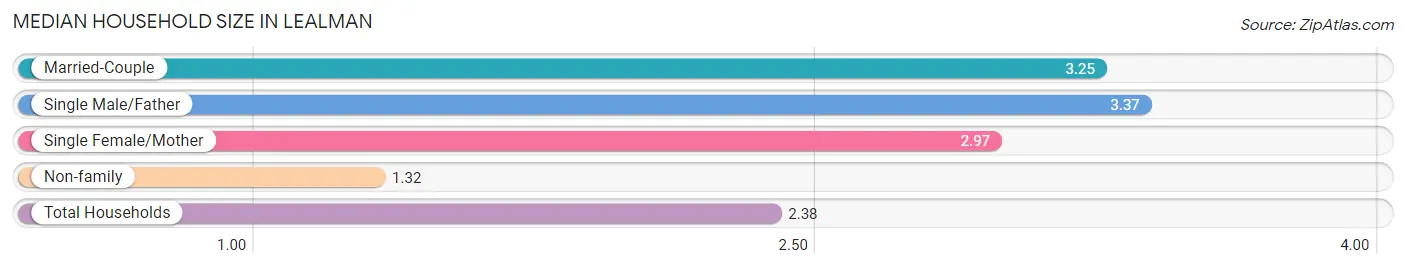
Median Household Size in Lealman
The median household size in Lealman is 2.38 persons per household, with single male/father households (603 | 6.8%) accounting for the largest median household size of 3.37 persons per household. non-family households (3,781 | 42.8%) represent the smallest median household size with 1.32 persons per household.
| Household Type | # Households | Household Size |
| Married-Couple | 2,972 (33.6%) | 3.25 |
| Single Male/Father | 603 (6.8%) | 3.37 |
| Single Female/Mother | 1,482 (16.8%) | 2.97 |
| Non-family | 3,781 (42.8%) | 1.32 |
| Total Households | 8,838 (100.0%) | 2.38 |
Household Size by Marriage Status in Lealman
Out of a total of 8,838 households in Lealman, 5,057 (57.2%) are family households, while 3,781 (42.8%) are nonfamily households. The most numerous type of family households are 2-person households, comprising 2,725, and the most common type of nonfamily households are 1-person households, comprising 3,030.
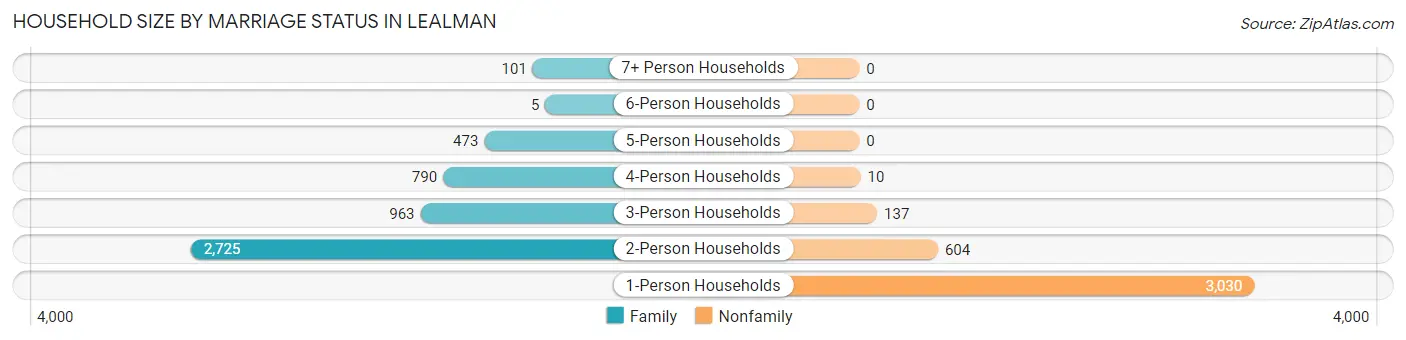
| Household Size | Family Households | Nonfamily Households |
| 1-Person Households | - | 3,030 (34.3%) |
| 2-Person Households | 2,725 (30.8%) | 604 (6.8%) |
| 3-Person Households | 963 (10.9%) | 137 (1.5%) |
| 4-Person Households | 790 (8.9%) | 10 (0.1%) |
| 5-Person Households | 473 (5.3%) | 0 (0.0%) |
| 6-Person Households | 5 (0.1%) | 0 (0.0%) |
| 7+ Person Households | 101 (1.1%) | 0 (0.0%) |
| Total | 5,057 (57.2%) | 3,781 (42.8%) |
Female Fertility in Lealman
Fertility by Age in Lealman
Average fertility rate in Lealman is 73.0 births per 1,000 women. Women in the age bracket of 20 to 34 years have the highest fertility rate with 116.0 births per 1,000 women. Women in the age bracket of 20 to 34 years acount for 84.3% of all women with births.
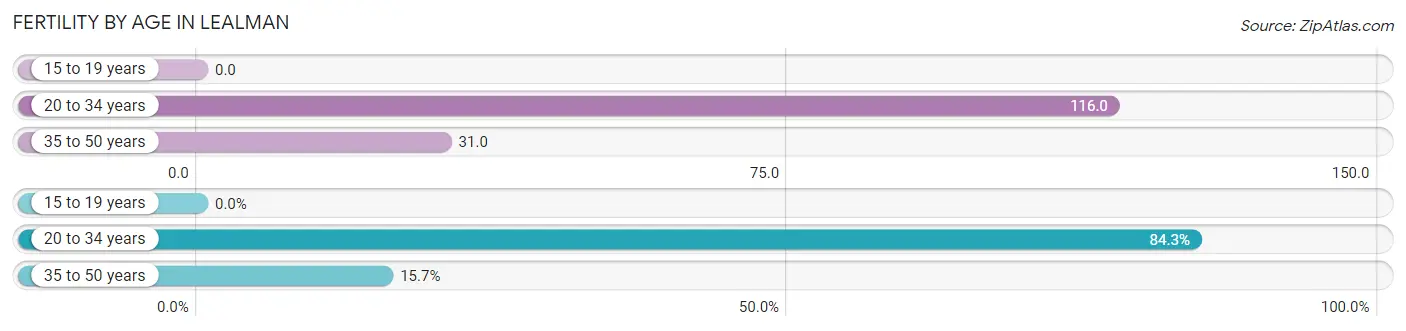
| Age Bracket | Women with Births | Births / 1,000 Women |
| 15 to 19 years | 0 (0.0%) | 0.0 |
| 20 to 34 years | 279 (84.3%) | 116.0 |
| 35 to 50 years | 52 (15.7%) | 31.0 |
| Total | 331 (100.0%) | 73.0 |
Fertility by Age by Marriage Status in Lealman
57.7% of women with births (331) in Lealman are married. The highest percentage of unmarried women with births falls into 20 to 34 years age bracket with 47.3% of them unmarried at the time of birth, while the lowest percentage of unmarried women with births belong to 35 to 50 years age bracket with 15.4% of them unmarried.
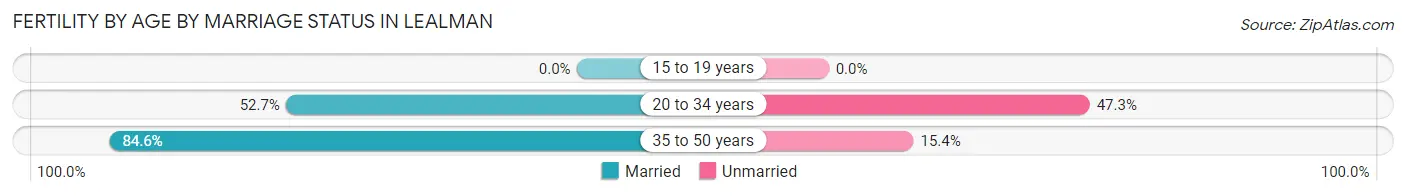
| Age Bracket | Married | Unmarried |
| 15 to 19 years | 0 (0.0%) | 0 (0.0%) |
| 20 to 34 years | 147 (52.7%) | 132 (47.3%) |
| 35 to 50 years | 44 (84.6%) | 8 (15.4%) |
| Total | 191 (57.7%) | 140 (42.3%) |
Fertility by Education in Lealman
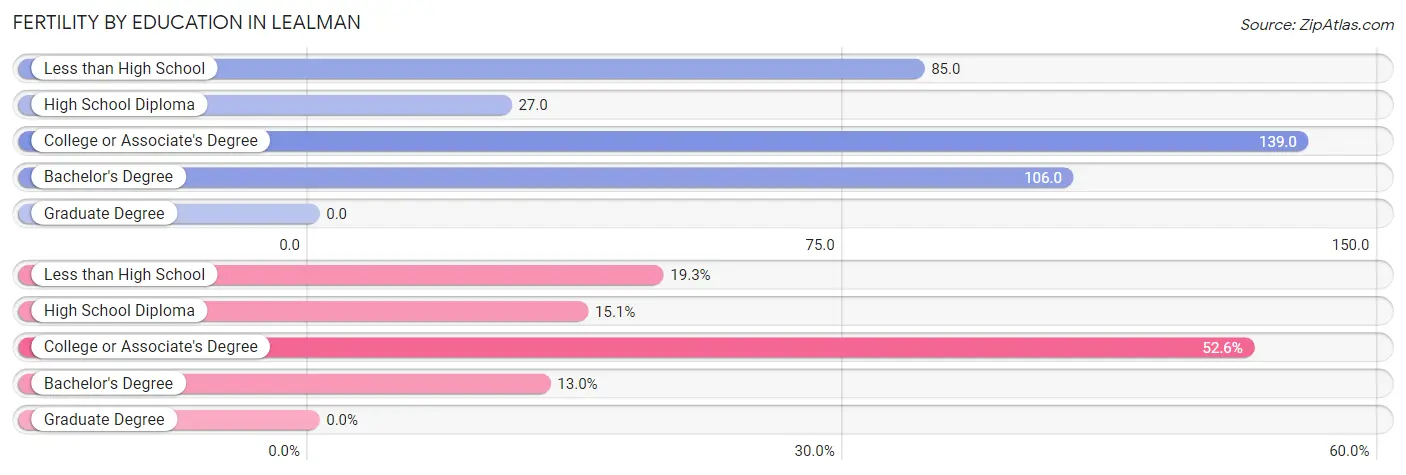
| Educational Attainment | Women with Births | Births / 1,000 Women |
| Less than High School | 64 (19.3%) | 85.0 |
| High School Diploma | 50 (15.1%) | 27.0 |
| College or Associate's Degree | 174 (52.6%) | 139.0 |
| Bachelor's Degree | 43 (13.0%) | 106.0 |
| Graduate Degree | 0 (0.0%) | 0.0 |
| Total | 331 (100.0%) | 73.0 |
Fertility by Education by Marriage Status in Lealman
42.3% of women with births in Lealman are unmarried. Women with the educational attainment of bachelor's degree are most likely to be married with 100.0% of them married at childbirth, while women with the educational attainment of less than high school are least likely to be married with 79.7% of them unmarried at childbirth.
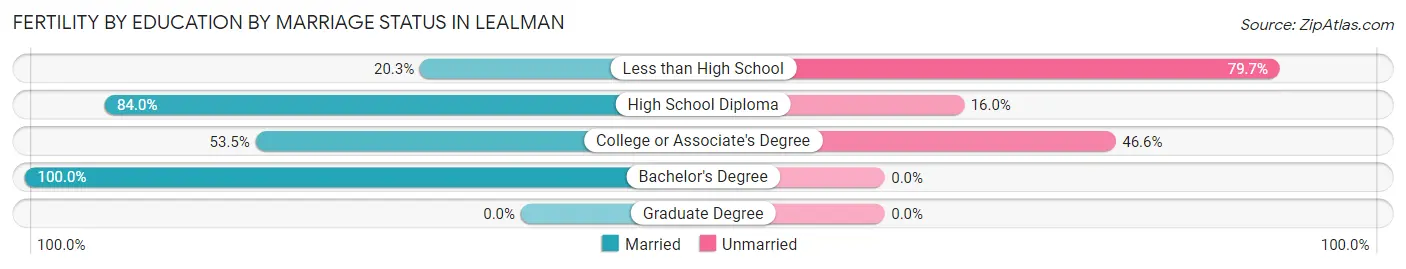
| Educational Attainment | Married | Unmarried |
| Less than High School | 13 (20.3%) | 51 (79.7%) |
| High School Diploma | 42 (84.0%) | 8 (16.0%) |
| College or Associate's Degree | 93 (53.4%) | 81 (46.6%) |
| Bachelor's Degree | 43 (100.0%) | 0 (0.0%) |
| Graduate Degree | 0 (0.0%) | 0 (0.0%) |
| Total | 191 (57.7%) | 140 (42.3%) |
Employment Characteristics in Lealman
Employment by Class of Employer in Lealman
Among the 9,757 employed individuals in Lealman, private company employees (7,993 | 81.9%), local government employees (538 | 5.5%), and self-employed (not incorporated) (425 | 4.4%) make up the most common classes of employment.
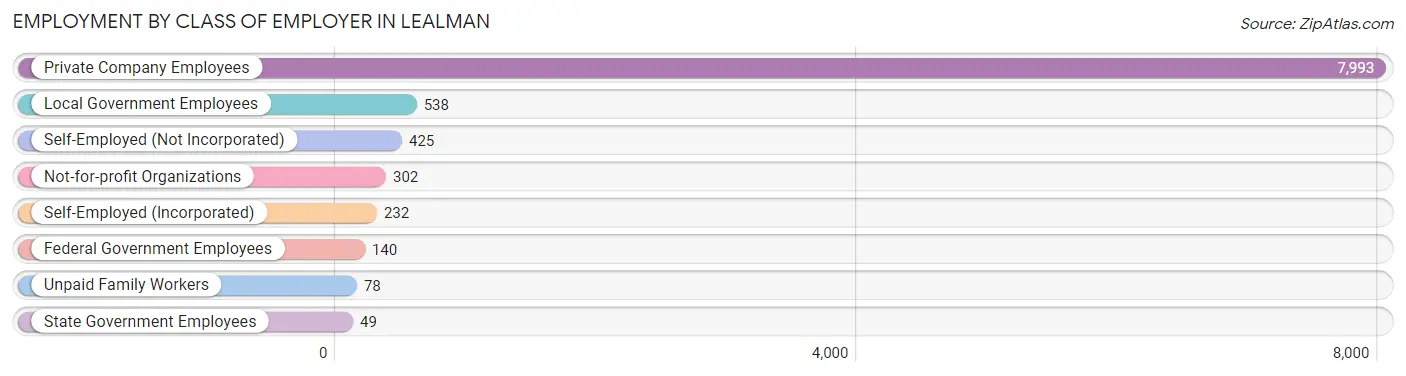
| Employer Class | # Employees | % Employees |
| Private Company Employees | 7,993 | 81.9% |
| Self-Employed (Incorporated) | 232 | 2.4% |
| Self-Employed (Not Incorporated) | 425 | 4.4% |
| Not-for-profit Organizations | 302 | 3.1% |
| Local Government Employees | 538 | 5.5% |
| State Government Employees | 49 | 0.5% |
| Federal Government Employees | 140 | 1.4% |
| Unpaid Family Workers | 78 | 0.8% |
| Total | 9,757 | 100.0% |
Employment Status by Age in Lealman
According to the labor force statistics for Lealman, out of the total population over 16 years of age (17,883), 59.7% or 10,676 individuals are in the labor force, with 6.9% or 737 of them unemployed. The age group with the highest labor force participation rate is 25 to 29 years, with 87.9% or 1,421 individuals in the labor force. Within the labor force, the 16 to 19 years age range has the highest percentage of unemployed individuals, with 27.5% or 41 of them being unemployed.
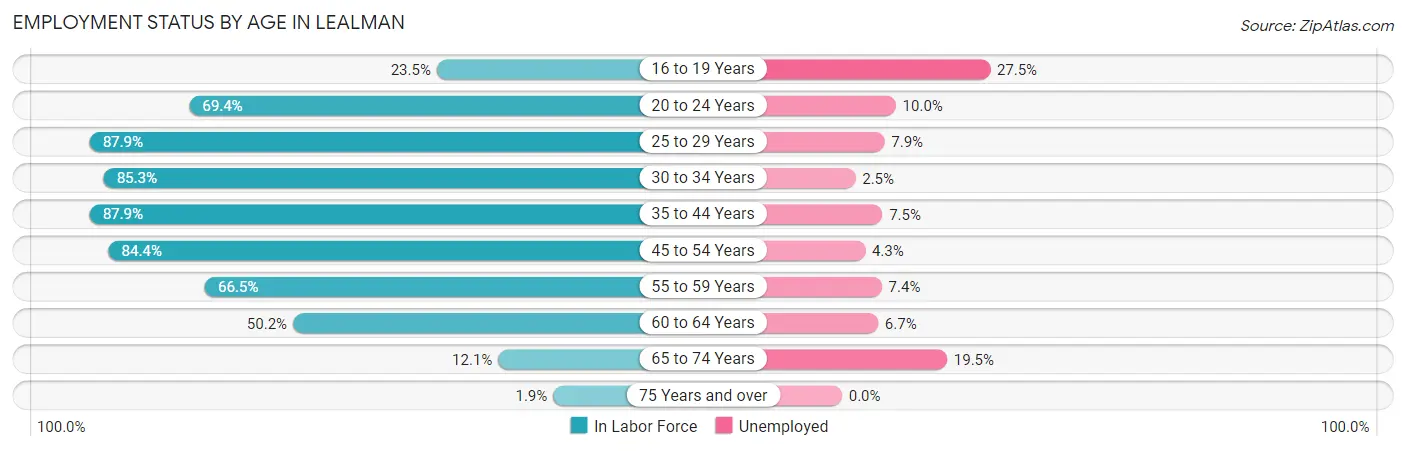
| Age Bracket | In Labor Force | Unemployed |
| 16 to 19 Years | 149 (23.5%) | 41 (27.5%) |
| 20 to 24 Years | 870 (69.4%) | 87 (10.0%) |
| 25 to 29 Years | 1,421 (87.9%) | 112 (7.9%) |
| 30 to 34 Years | 1,581 (85.3%) | 40 (2.5%) |
| 35 to 44 Years | 2,253 (87.9%) | 169 (7.5%) |
| 45 to 54 Years | 2,264 (84.4%) | 97 (4.3%) |
| 55 to 59 Years | 922 (66.5%) | 68 (7.4%) |
| 60 to 64 Years | 871 (50.2%) | 58 (6.7%) |
| 65 to 74 Years | 319 (12.1%) | 62 (19.5%) |
| 75 Years and over | 29 (1.9%) | 0 (0.0%) |
| Total | 10,676 (59.7%) | 737 (6.9%) |
Employment Status by Educational Attainment in Lealman
According to labor force statistics for Lealman, 78.7% of individuals (9,315) out of the total population between 25 and 64 years of age (11,836) are in the labor force, with 5.8% or 540 of them being unemployed. The group with the highest labor force participation rate are those with the educational attainment of college / associate degree, with 83.3% or 3,114 individuals in the labor force. Within the labor force, individuals with less than high school education have the highest percentage of unemployment, with 9.4% or 93 of them being unemployed.
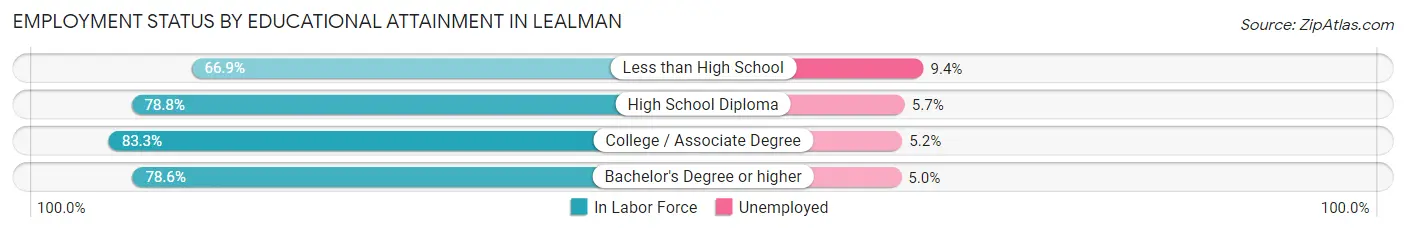
| Educational Attainment | In Labor Force | Unemployed |
| Less than High School | 993 (66.9%) | 140 (9.4%) |
| High School Diploma | 3,635 (78.8%) | 263 (5.7%) |
| College / Associate Degree | 3,114 (83.3%) | 194 (5.2%) |
| Bachelor's Degree or higher | 1,572 (78.6%) | 100 (5.0%) |
| Total | 9,315 (78.7%) | 686 (5.8%) |
Employment Occupations by Sex in Lealman
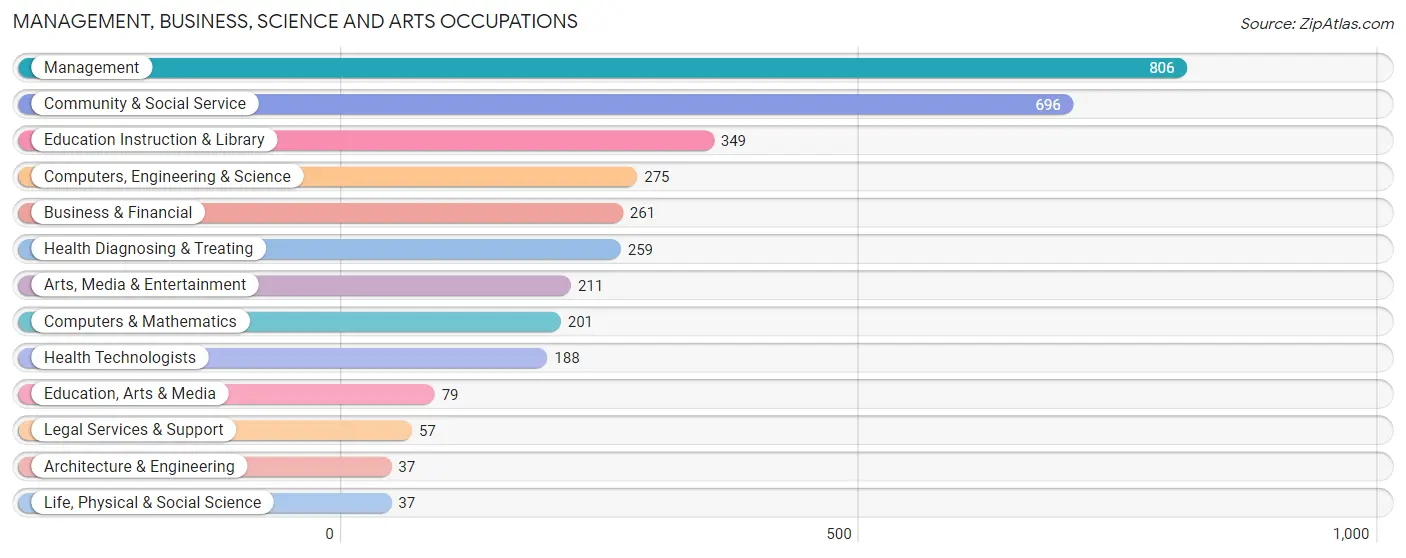
Management, Business, Science and Arts Occupations
The most common Management, Business, Science and Arts occupations in Lealman are Management (806 | 8.2%), Community & Social Service (696 | 7.0%), Education Instruction & Library (349 | 3.5%), Computers, Engineering & Science (275 | 2.8%), and Business & Financial (261 | 2.6%).
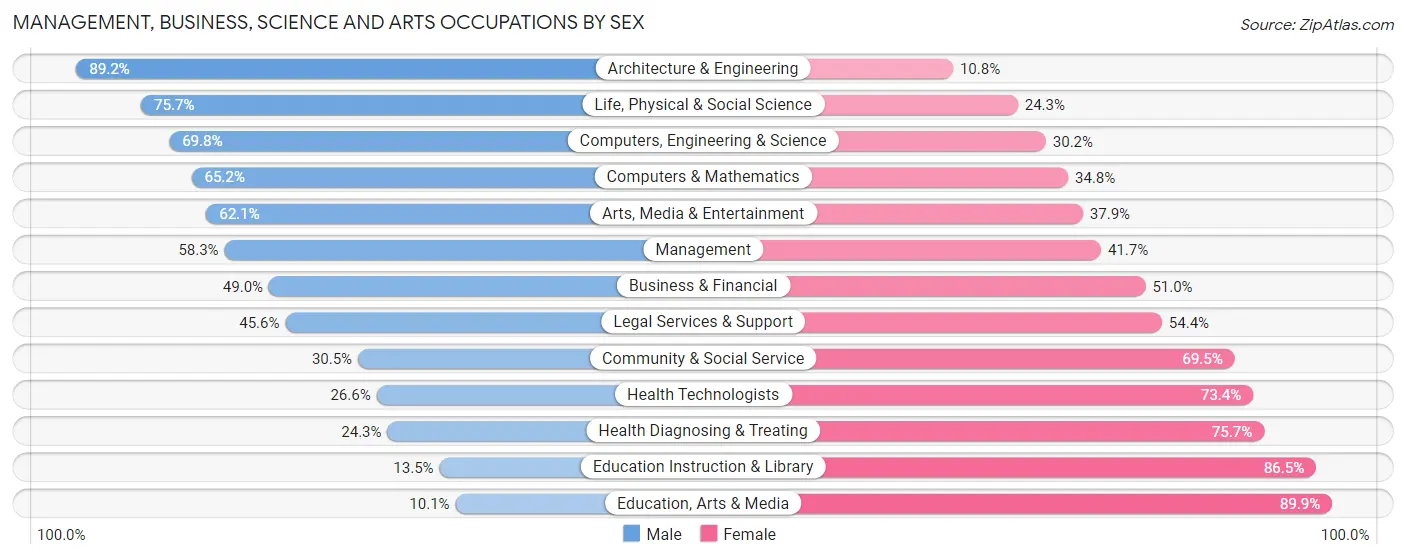
Management, Business, Science and Arts Occupations by Sex
Within the Management, Business, Science and Arts occupations in Lealman, the most male-oriented occupations are Architecture & Engineering (89.2%), Life, Physical & Social Science (75.7%), and Computers, Engineering & Science (69.8%), while the most female-oriented occupations are Education, Arts & Media (89.9%), Education Instruction & Library (86.5%), and Health Diagnosing & Treating (75.7%).
| Occupation | Male | Female |
| Management | 470 (58.3%) | 336 (41.7%) |
| Business & Financial | 128 (49.0%) | 133 (51.0%) |
| Computers, Engineering & Science | 192 (69.8%) | 83 (30.2%) |
| Computers & Mathematics | 131 (65.2%) | 70 (34.8%) |
| Architecture & Engineering | 33 (89.2%) | 4 (10.8%) |
| Life, Physical & Social Science | 28 (75.7%) | 9 (24.3%) |
| Community & Social Service | 212 (30.5%) | 484 (69.5%) |
| Education, Arts & Media | 8 (10.1%) | 71 (89.9%) |
| Legal Services & Support | 26 (45.6%) | 31 (54.4%) |
| Education Instruction & Library | 47 (13.5%) | 302 (86.5%) |
| Arts, Media & Entertainment | 131 (62.1%) | 80 (37.9%) |
| Health Diagnosing & Treating | 63 (24.3%) | 196 (75.7%) |
| Health Technologists | 50 (26.6%) | 138 (73.4%) |
| Total (Category) | 1,065 (46.4%) | 1,232 (53.6%) |
| Total (Overall) | 5,255 (53.1%) | 4,634 (46.9%) |
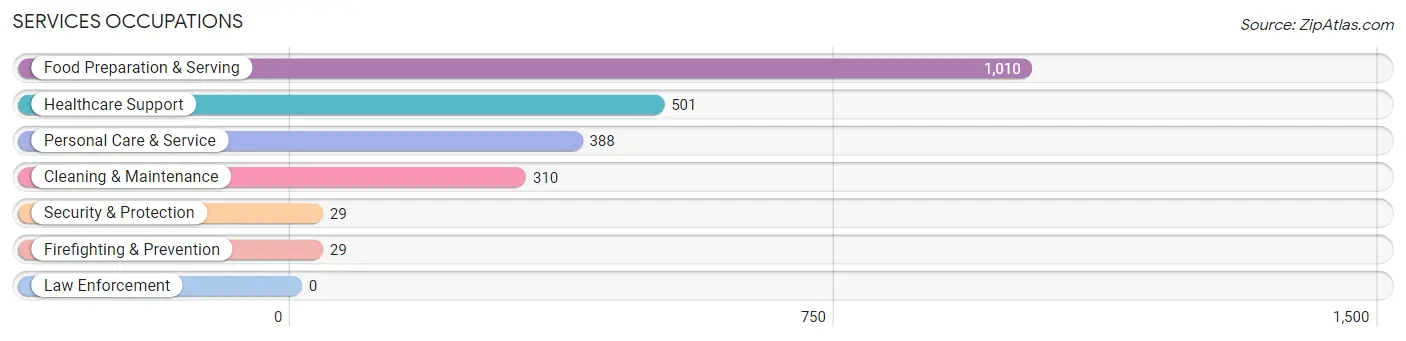
Services Occupations
The most common Services occupations in Lealman are Food Preparation & Serving (1,010 | 10.2%), Healthcare Support (501 | 5.1%), Personal Care & Service (388 | 3.9%), Cleaning & Maintenance (310 | 3.1%), and Security & Protection (29 | 0.3%).
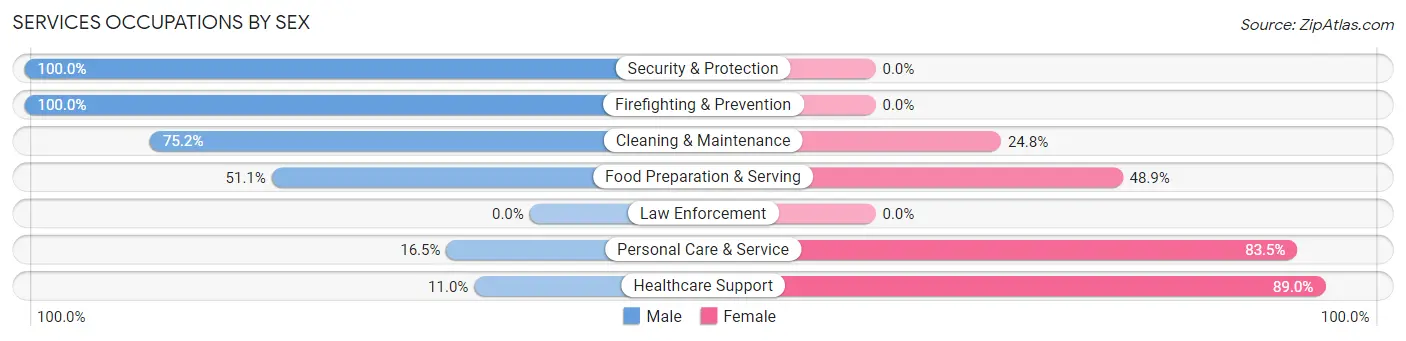
Services Occupations by Sex
Within the Services occupations in Lealman, the most male-oriented occupations are Security & Protection (100.0%), Firefighting & Prevention (100.0%), and Cleaning & Maintenance (75.2%), while the most female-oriented occupations are Healthcare Support (89.0%), Personal Care & Service (83.5%), and Food Preparation & Serving (48.9%).
| Occupation | Male | Female |
| Healthcare Support | 55 (11.0%) | 446 (89.0%) |
| Security & Protection | 29 (100.0%) | 0 (0.0%) |
| Firefighting & Prevention | 29 (100.0%) | 0 (0.0%) |
| Law Enforcement | 0 (0.0%) | 0 (0.0%) |
| Food Preparation & Serving | 516 (51.1%) | 494 (48.9%) |
| Cleaning & Maintenance | 233 (75.2%) | 77 (24.8%) |
| Personal Care & Service | 64 (16.5%) | 324 (83.5%) |
| Total (Category) | 897 (40.1%) | 1,341 (59.9%) |
| Total (Overall) | 5,255 (53.1%) | 4,634 (46.9%) |
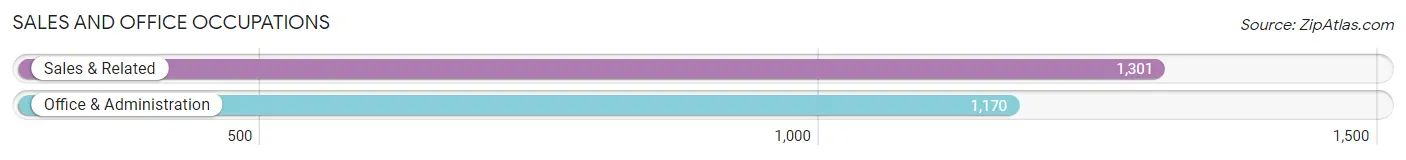
Sales and Office Occupations
The most common Sales and Office occupations in Lealman are Sales & Related (1,301 | 13.2%), and Office & Administration (1,170 | 11.8%).
Sales and Office Occupations by Sex
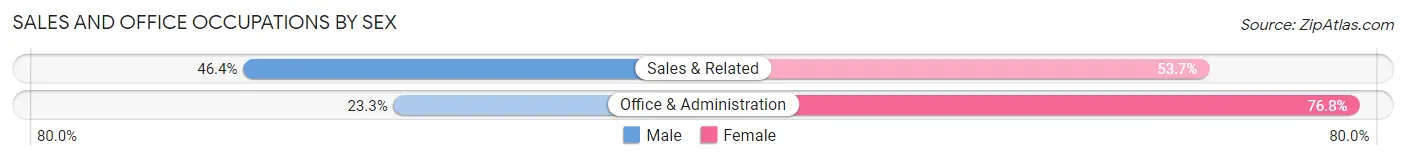
| Occupation | Male | Female |
| Sales & Related | 603 (46.4%) | 698 (53.6%) |
| Office & Administration | 272 (23.3%) | 898 (76.7%) |
| Total (Category) | 875 (35.4%) | 1,596 (64.6%) |
| Total (Overall) | 5,255 (53.1%) | 4,634 (46.9%) |
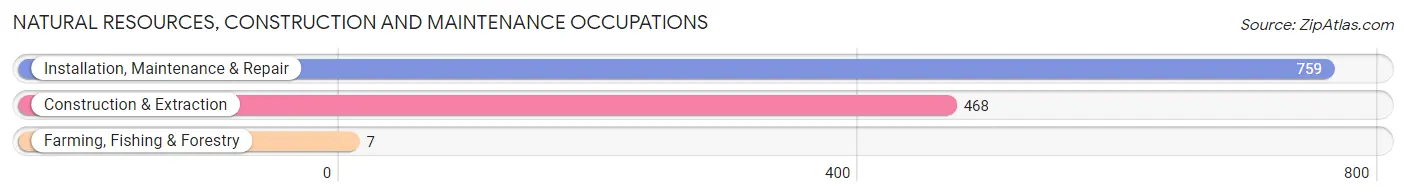
Natural Resources, Construction and Maintenance Occupations
The most common Natural Resources, Construction and Maintenance occupations in Lealman are Installation, Maintenance & Repair (759 | 7.7%), Construction & Extraction (468 | 4.7%), and Farming, Fishing & Forestry (7 | 0.1%).
Natural Resources, Construction and Maintenance Occupations by Sex
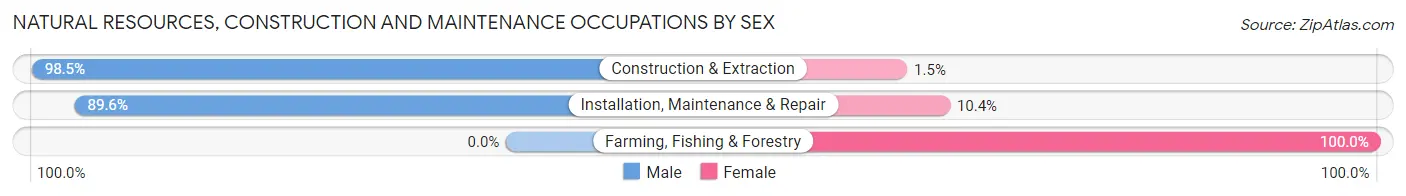
| Occupation | Male | Female |
| Farming, Fishing & Forestry | 0 (0.0%) | 7 (100.0%) |
| Construction & Extraction | 461 (98.5%) | 7 (1.5%) |
| Installation, Maintenance & Repair | 680 (89.6%) | 79 (10.4%) |
| Total (Category) | 1,141 (92.5%) | 93 (7.5%) |
| Total (Overall) | 5,255 (53.1%) | 4,634 (46.9%) |
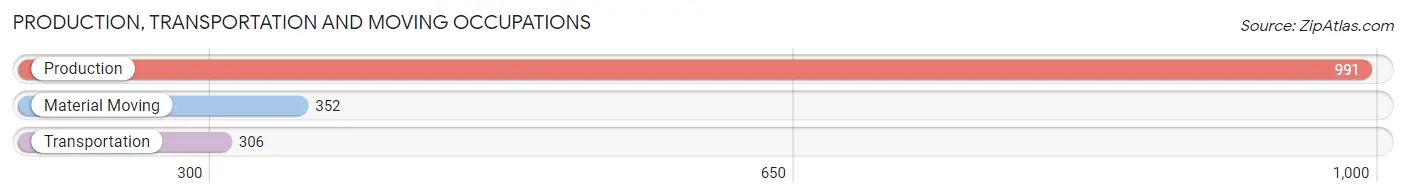
Production, Transportation and Moving Occupations
The most common Production, Transportation and Moving occupations in Lealman are Production (991 | 10.0%), Material Moving (352 | 3.6%), and Transportation (306 | 3.1%).
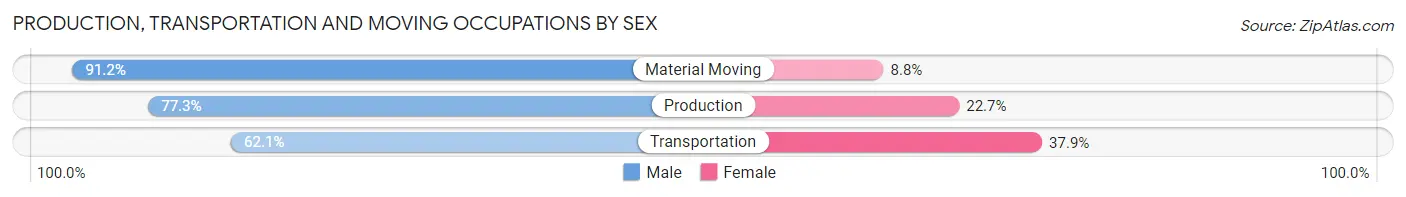
Production, Transportation and Moving Occupations by Sex
| Occupation | Male | Female |
| Production | 766 (77.3%) | 225 (22.7%) |
| Transportation | 190 (62.1%) | 116 (37.9%) |
| Material Moving | 321 (91.2%) | 31 (8.8%) |
| Total (Category) | 1,277 (77.4%) | 372 (22.6%) |
| Total (Overall) | 5,255 (53.1%) | 4,634 (46.9%) |
Employment Industries by Sex in Lealman
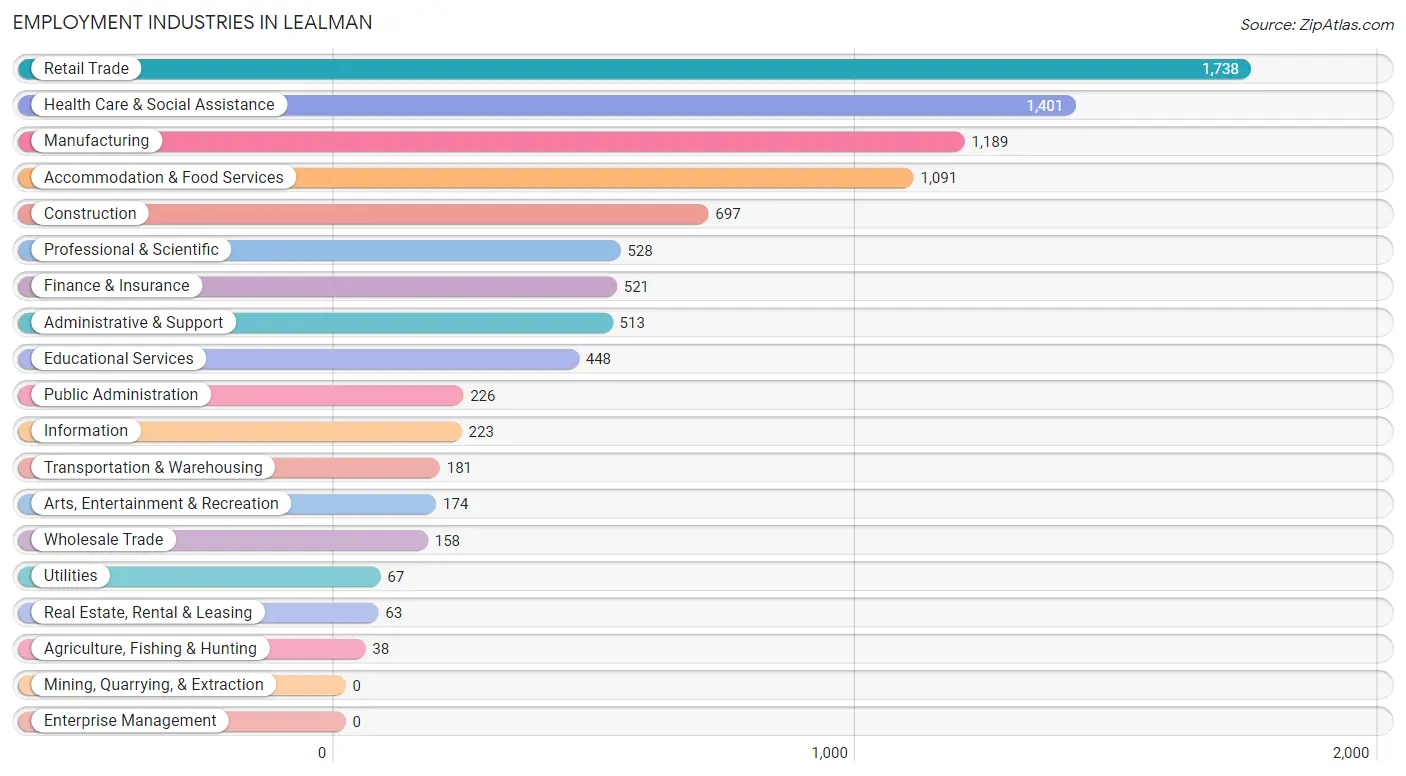
Employment Industries in Lealman
The major employment industries in Lealman include Retail Trade (1,738 | 17.6%), Health Care & Social Assistance (1,401 | 14.2%), Manufacturing (1,189 | 12.0%), Accommodation & Food Services (1,091 | 11.0%), and Construction (697 | 7.0%).
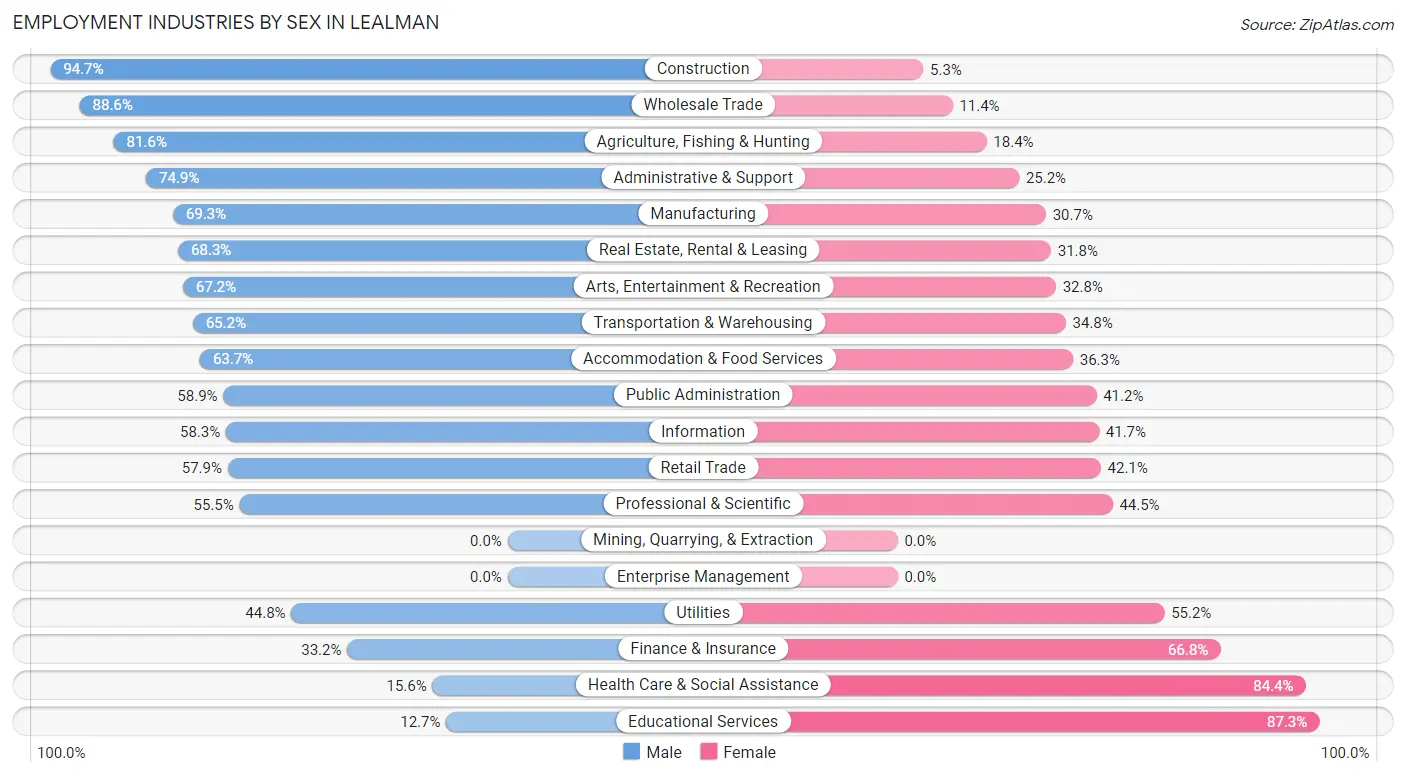
Employment Industries by Sex in Lealman
The Lealman industries that see more men than women are Construction (94.7%), Wholesale Trade (88.6%), and Agriculture, Fishing & Hunting (81.6%), whereas the industries that tend to have a higher number of women are Educational Services (87.3%), Health Care & Social Assistance (84.4%), and Finance & Insurance (66.8%).
| Industry | Male | Female |
| Agriculture, Fishing & Hunting | 31 (81.6%) | 7 (18.4%) |
| Mining, Quarrying, & Extraction | 0 (0.0%) | 0 (0.0%) |
| Construction | 660 (94.7%) | 37 (5.3%) |
| Manufacturing | 824 (69.3%) | 365 (30.7%) |
| Wholesale Trade | 140 (88.6%) | 18 (11.4%) |
| Retail Trade | 1,007 (57.9%) | 731 (42.1%) |
| Transportation & Warehousing | 118 (65.2%) | 63 (34.8%) |
| Utilities | 30 (44.8%) | 37 (55.2%) |
| Information | 130 (58.3%) | 93 (41.7%) |
| Finance & Insurance | 173 (33.2%) | 348 (66.8%) |
| Real Estate, Rental & Leasing | 43 (68.2%) | 20 (31.8%) |
| Professional & Scientific | 293 (55.5%) | 235 (44.5%) |
| Enterprise Management | 0 (0.0%) | 0 (0.0%) |
| Administrative & Support | 384 (74.9%) | 129 (25.2%) |
| Educational Services | 57 (12.7%) | 391 (87.3%) |
| Health Care & Social Assistance | 218 (15.6%) | 1,183 (84.4%) |
| Arts, Entertainment & Recreation | 117 (67.2%) | 57 (32.8%) |
| Accommodation & Food Services | 695 (63.7%) | 396 (36.3%) |
| Public Administration | 133 (58.9%) | 93 (41.1%) |
| Total | 5,255 (53.1%) | 4,634 (46.9%) |
Education in Lealman
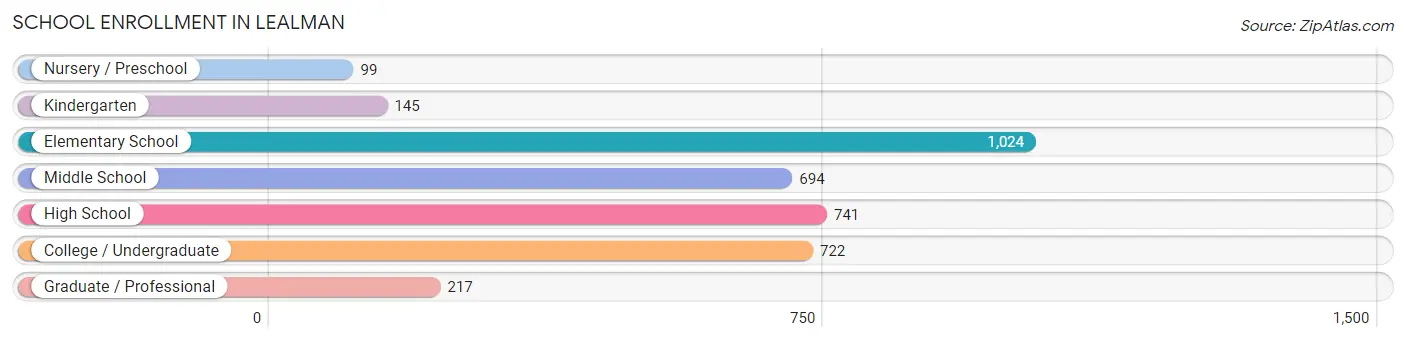
School Enrollment in Lealman
The most common levels of schooling among the 3,642 students in Lealman are elementary school (1,024 | 28.1%), high school (741 | 20.3%), and college / undergraduate (722 | 19.8%).
| School Level | # Students | % Students |
| Nursery / Preschool | 99 | 2.7% |
| Kindergarten | 145 | 4.0% |
| Elementary School | 1,024 | 28.1% |
| Middle School | 694 | 19.1% |
| High School | 741 | 20.3% |
| College / Undergraduate | 722 | 19.8% |
| Graduate / Professional | 217 | 6.0% |
| Total | 3,642 | 100.0% |
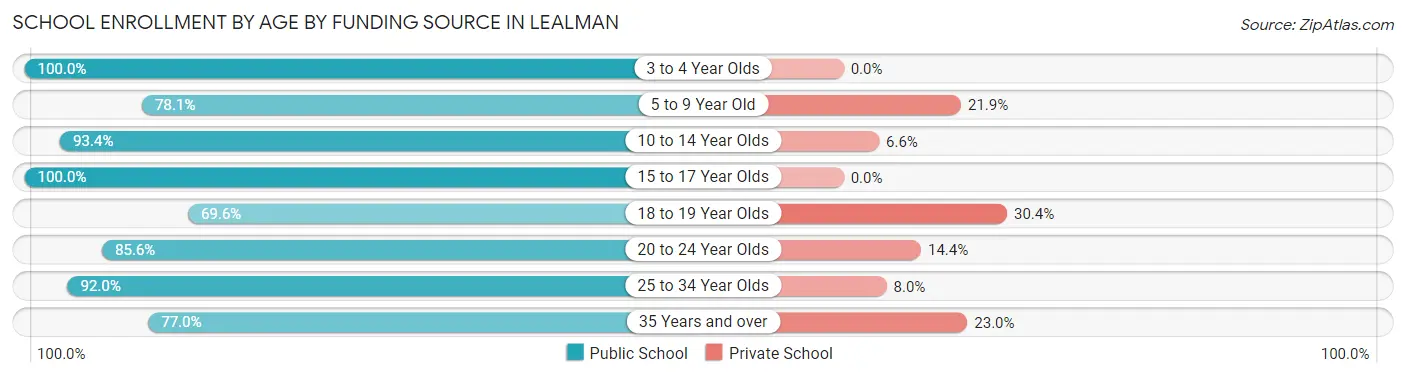
School Enrollment by Age by Funding Source in Lealman
Out of a total of 3,642 students who are enrolled in schools in Lealman, 437 (12.0%) attend a private institution, while the remaining 3,205 (88.0%) are enrolled in public schools. The age group of 18 to 19 year olds has the highest likelihood of being enrolled in private schools, with 14 (30.4% in the age bracket) enrolled. Conversely, the age group of 3 to 4 year olds has the lowest likelihood of being enrolled in a private school, with 84 (100.0% in the age bracket) attending a public institution.
| Age Bracket | Public School | Private School |
| 3 to 4 Year Olds | 84 (100.0%) | 0 (0.0%) |
| 5 to 9 Year Old | 854 (78.1%) | 239 (21.9%) |
| 10 to 14 Year Olds | 891 (93.4%) | 63 (6.6%) |
| 15 to 17 Year Olds | 590 (100.0%) | 0 (0.0%) |
| 18 to 19 Year Olds | 32 (69.6%) | 14 (30.4%) |
| 20 to 24 Year Olds | 285 (85.6%) | 48 (14.4%) |
| 25 to 34 Year Olds | 311 (92.0%) | 27 (8.0%) |
| 35 Years and over | 157 (77.0%) | 47 (23.0%) |
| Total | 3,205 (88.0%) | 437 (12.0%) |
Educational Attainment by Field of Study in Lealman
Business (637 | 22.5%), science & technology (611 | 21.6%), education (232 | 8.2%), engineering (210 | 7.4%), and social sciences (194 | 6.9%) are the most common fields of study among 2,833 individuals in Lealman who have obtained a bachelor's degree or higher.
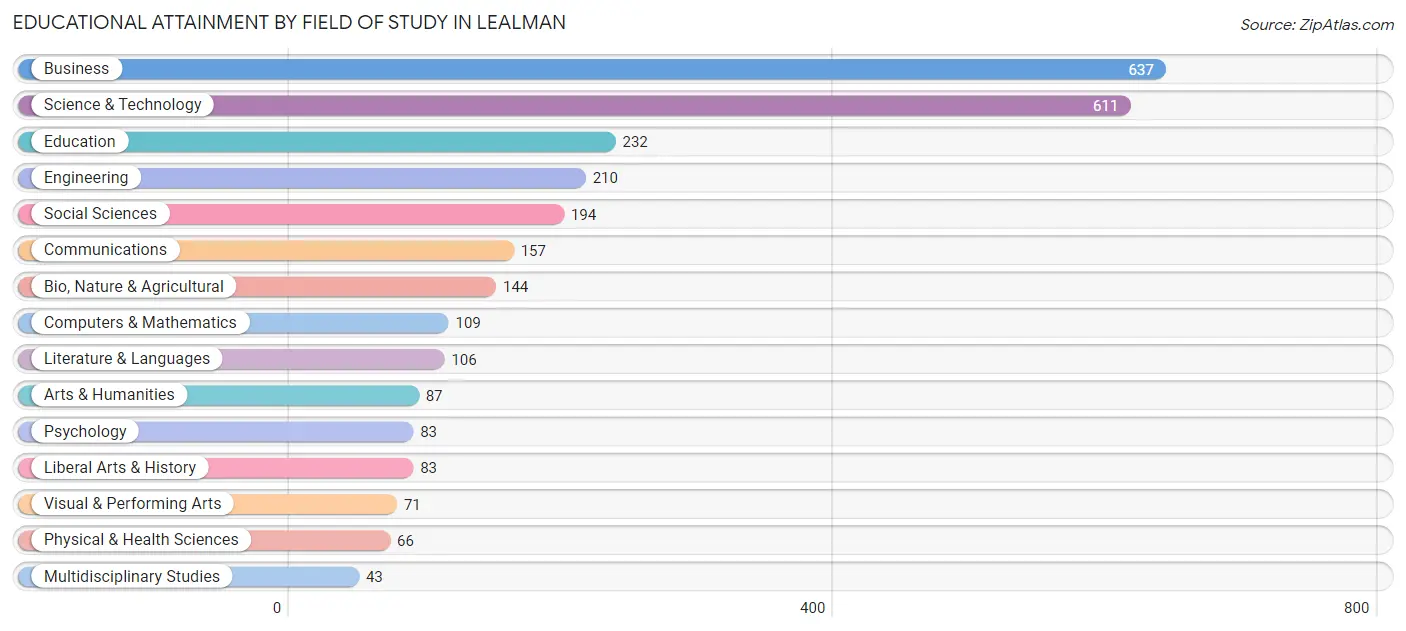
| Field of Study | # Graduates | % Graduates |
| Computers & Mathematics | 109 | 3.8% |
| Bio, Nature & Agricultural | 144 | 5.1% |
| Physical & Health Sciences | 66 | 2.3% |
| Psychology | 83 | 2.9% |
| Social Sciences | 194 | 6.9% |
| Engineering | 210 | 7.4% |
| Multidisciplinary Studies | 43 | 1.5% |
| Science & Technology | 611 | 21.6% |
| Business | 637 | 22.5% |
| Education | 232 | 8.2% |
| Literature & Languages | 106 | 3.7% |
| Liberal Arts & History | 83 | 2.9% |
| Visual & Performing Arts | 71 | 2.5% |
| Communications | 157 | 5.5% |
| Arts & Humanities | 87 | 3.1% |
| Total | 2,833 | 100.0% |
Transportation & Commute in Lealman
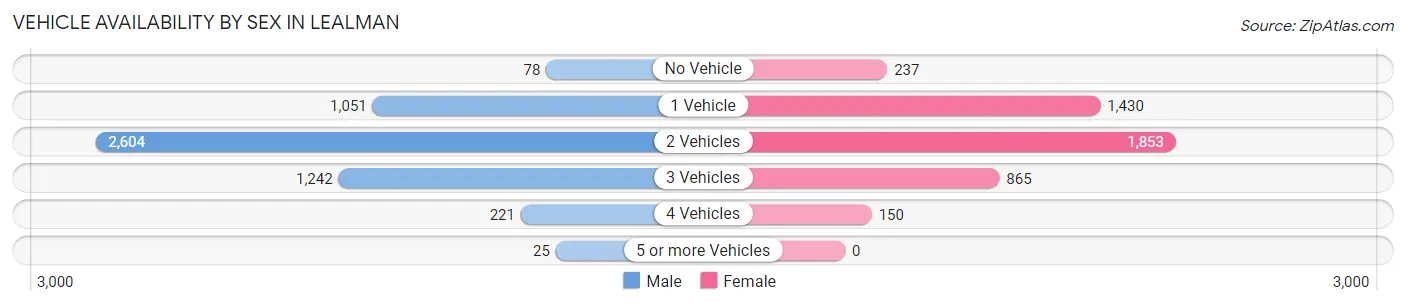
Vehicle Availability by Sex in Lealman
The most prevalent vehicle ownership categories in Lealman are males with 2 vehicles (2,604, accounting for 49.9%) and females with 2 vehicles (1,853, making up 57.4%).
| Vehicles Available | Male | Female |
| No Vehicle | 78 (1.5%) | 237 (5.2%) |
| 1 Vehicle | 1,051 (20.1%) | 1,430 (31.5%) |
| 2 Vehicles | 2,604 (49.9%) | 1,853 (40.9%) |
| 3 Vehicles | 1,242 (23.8%) | 865 (19.1%) |
| 4 Vehicles | 221 (4.2%) | 150 (3.3%) |
| 5 or more Vehicles | 25 (0.5%) | 0 (0.0%) |
| Total | 5,221 (100.0%) | 4,535 (100.0%) |
Commute Time in Lealman
The most frequently occuring commute durations in Lealman are 15 to 19 minutes (2,100 commuters, 23.2%), 20 to 24 minutes (1,585 commuters, 17.5%), and 10 to 14 minutes (1,562 commuters, 17.2%).
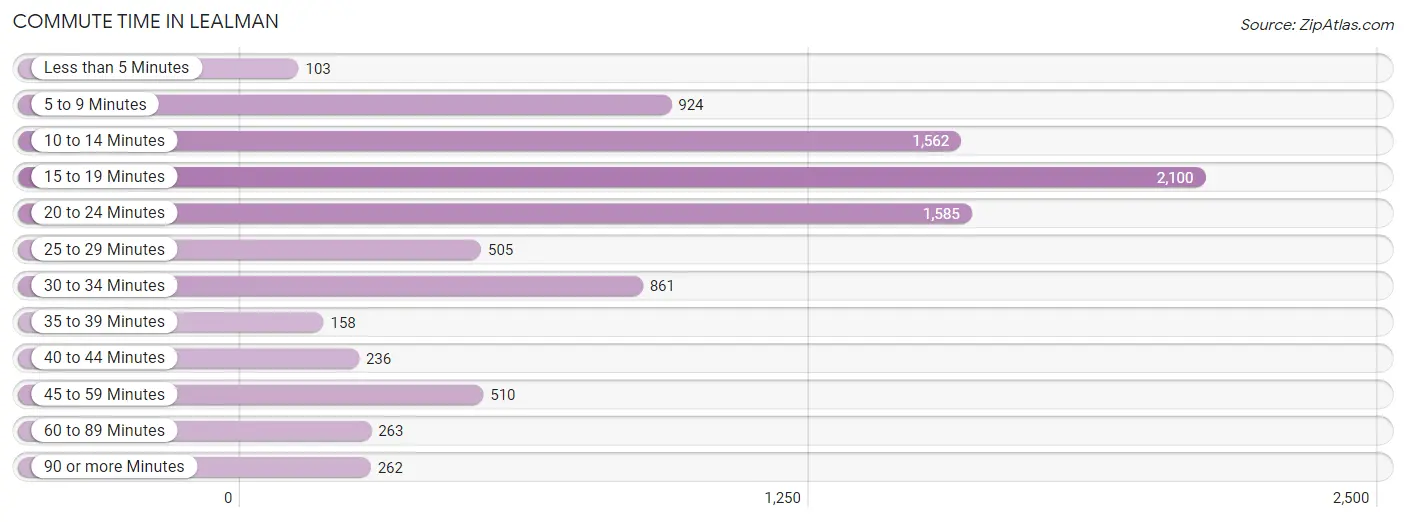
| Commute Time | # Commuters | % Commuters |
| Less than 5 Minutes | 103 | 1.1% |
| 5 to 9 Minutes | 924 | 10.2% |
| 10 to 14 Minutes | 1,562 | 17.2% |
| 15 to 19 Minutes | 2,100 | 23.2% |
| 20 to 24 Minutes | 1,585 | 17.5% |
| 25 to 29 Minutes | 505 | 5.6% |
| 30 to 34 Minutes | 861 | 9.5% |
| 35 to 39 Minutes | 158 | 1.7% |
| 40 to 44 Minutes | 236 | 2.6% |
| 45 to 59 Minutes | 510 | 5.6% |
| 60 to 89 Minutes | 263 | 2.9% |
| 90 or more Minutes | 262 | 2.9% |
Commute Time by Sex in Lealman
The most common commute times in Lealman are 15 to 19 minutes (1,046 commuters, 21.2%) for males and 15 to 19 minutes (1,054 commuters, 25.5%) for females.
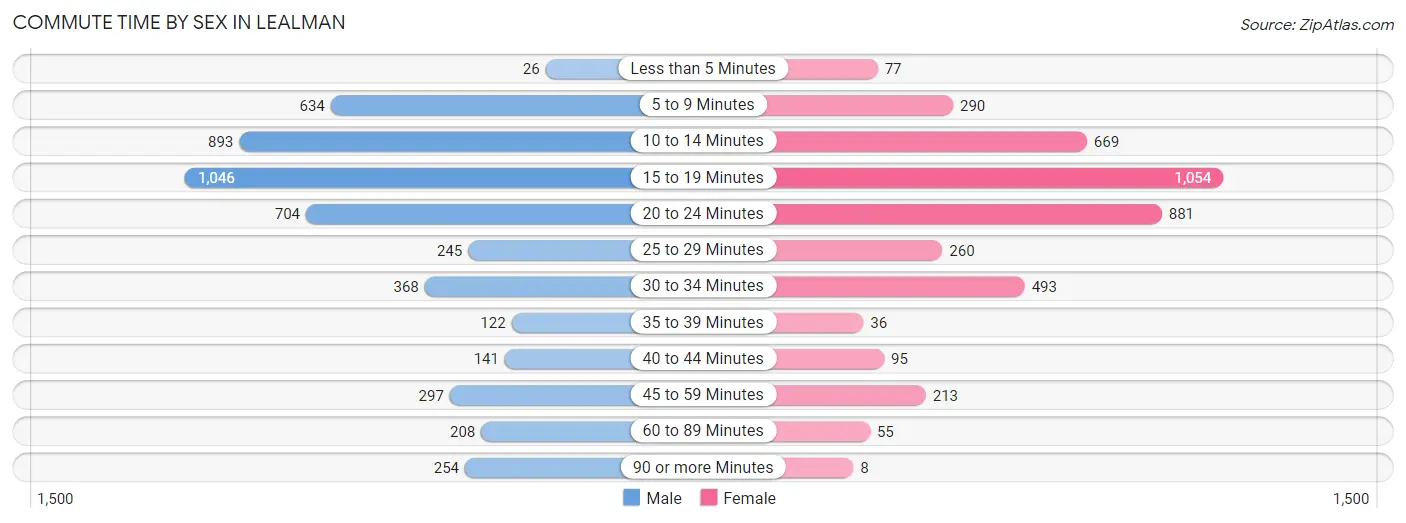
| Commute Time | Male | Female |
| Less than 5 Minutes | 26 (0.5%) | 77 (1.9%) |
| 5 to 9 Minutes | 634 (12.8%) | 290 (7.0%) |
| 10 to 14 Minutes | 893 (18.1%) | 669 (16.2%) |
| 15 to 19 Minutes | 1,046 (21.2%) | 1,054 (25.5%) |
| 20 to 24 Minutes | 704 (14.3%) | 881 (21.3%) |
| 25 to 29 Minutes | 245 (5.0%) | 260 (6.3%) |
| 30 to 34 Minutes | 368 (7.4%) | 493 (11.9%) |
| 35 to 39 Minutes | 122 (2.5%) | 36 (0.9%) |
| 40 to 44 Minutes | 141 (2.9%) | 95 (2.3%) |
| 45 to 59 Minutes | 297 (6.0%) | 213 (5.2%) |
| 60 to 89 Minutes | 208 (4.2%) | 55 (1.3%) |
| 90 or more Minutes | 254 (5.1%) | 8 (0.2%) |
Time of Departure to Work by Sex in Lealman
The most frequent times of departure to work in Lealman are 8:00 AM to 8:29 AM (654, 13.2%) for males and 7:30 AM to 7:59 AM (557, 13.5%) for females.
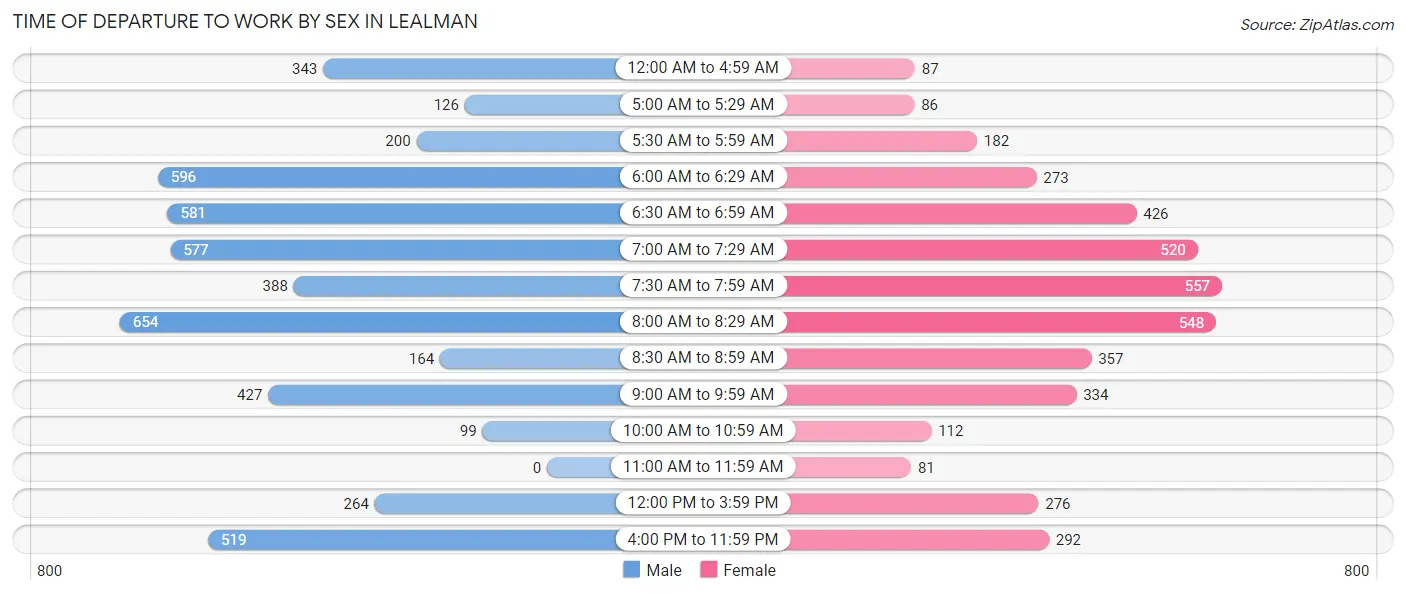
| Time of Departure | Male | Female |
| 12:00 AM to 4:59 AM | 343 (7.0%) | 87 (2.1%) |
| 5:00 AM to 5:29 AM | 126 (2.5%) | 86 (2.1%) |
| 5:30 AM to 5:59 AM | 200 (4.1%) | 182 (4.4%) |
| 6:00 AM to 6:29 AM | 596 (12.1%) | 273 (6.6%) |
| 6:30 AM to 6:59 AM | 581 (11.8%) | 426 (10.3%) |
| 7:00 AM to 7:29 AM | 577 (11.7%) | 520 (12.6%) |
| 7:30 AM to 7:59 AM | 388 (7.9%) | 557 (13.5%) |
| 8:00 AM to 8:29 AM | 654 (13.2%) | 548 (13.3%) |
| 8:30 AM to 8:59 AM | 164 (3.3%) | 357 (8.6%) |
| 9:00 AM to 9:59 AM | 427 (8.6%) | 334 (8.1%) |
| 10:00 AM to 10:59 AM | 99 (2.0%) | 112 (2.7%) |
| 11:00 AM to 11:59 AM | 0 (0.0%) | 81 (2.0%) |
| 12:00 PM to 3:59 PM | 264 (5.3%) | 276 (6.7%) |
| 4:00 PM to 11:59 PM | 519 (10.5%) | 292 (7.1%) |
| Total | 4,938 (100.0%) | 4,131 (100.0%) |
Housing Occupancy in Lealman
Occupancy by Ownership in Lealman
Of the total 8,838 dwellings in Lealman, owner-occupied units account for 5,508 (62.3%), while renter-occupied units make up 3,330 (37.7%).
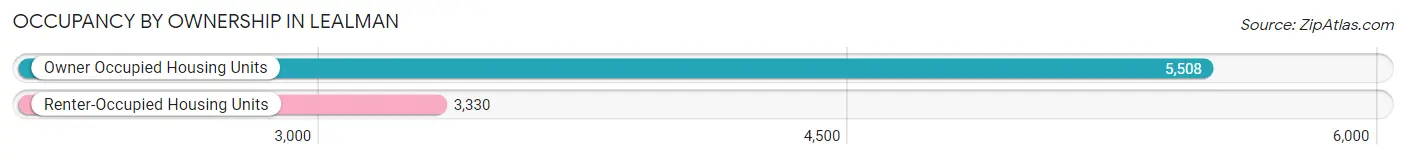
| Occupancy | # Housing Units | % Housing Units |
| Owner Occupied Housing Units | 5,508 | 62.3% |
| Renter-Occupied Housing Units | 3,330 | 37.7% |
| Total Occupied Housing Units | 8,838 | 100.0% |
Occupancy by Household Size in Lealman
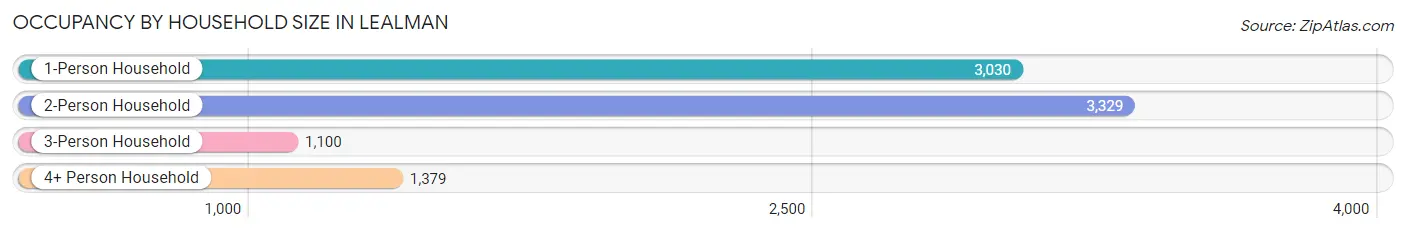
| Household Size | # Housing Units | % Housing Units |
| 1-Person Household | 3,030 | 34.3% |
| 2-Person Household | 3,329 | 37.7% |
| 3-Person Household | 1,100 | 12.4% |
| 4+ Person Household | 1,379 | 15.6% |
| Total Housing Units | 8,838 | 100.0% |
Occupancy by Ownership by Household Size in Lealman
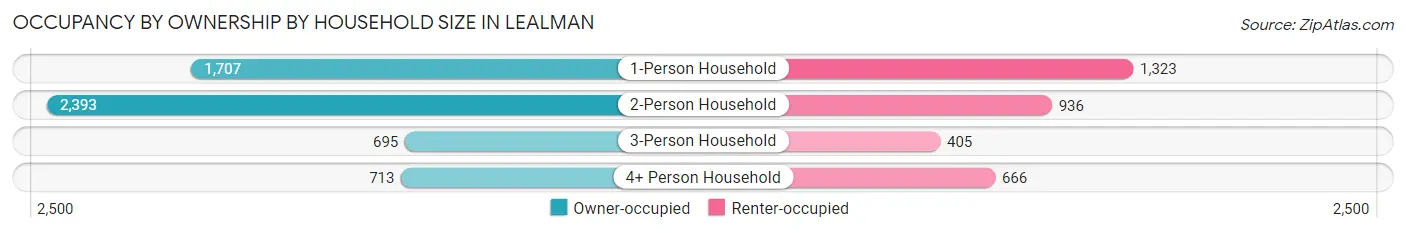
| Household Size | Owner-occupied | Renter-occupied |
| 1-Person Household | 1,707 (56.3%) | 1,323 (43.7%) |
| 2-Person Household | 2,393 (71.9%) | 936 (28.1%) |
| 3-Person Household | 695 (63.2%) | 405 (36.8%) |
| 4+ Person Household | 713 (51.7%) | 666 (48.3%) |
| Total Housing Units | 5,508 (62.3%) | 3,330 (37.7%) |
Occupancy by Educational Attainment in Lealman
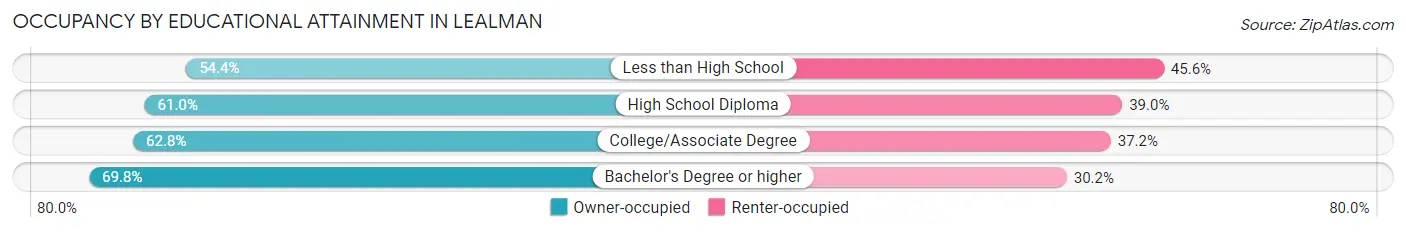
| Household Size | Owner-occupied | Renter-occupied |
| Less than High School | 698 (54.4%) | 586 (45.6%) |
| High School Diploma | 1,795 (61.0%) | 1,149 (39.0%) |
| College/Associate Degree | 1,808 (62.8%) | 1,072 (37.2%) |
| Bachelor's Degree or higher | 1,207 (69.8%) | 523 (30.2%) |
Occupancy by Age of Householder in Lealman
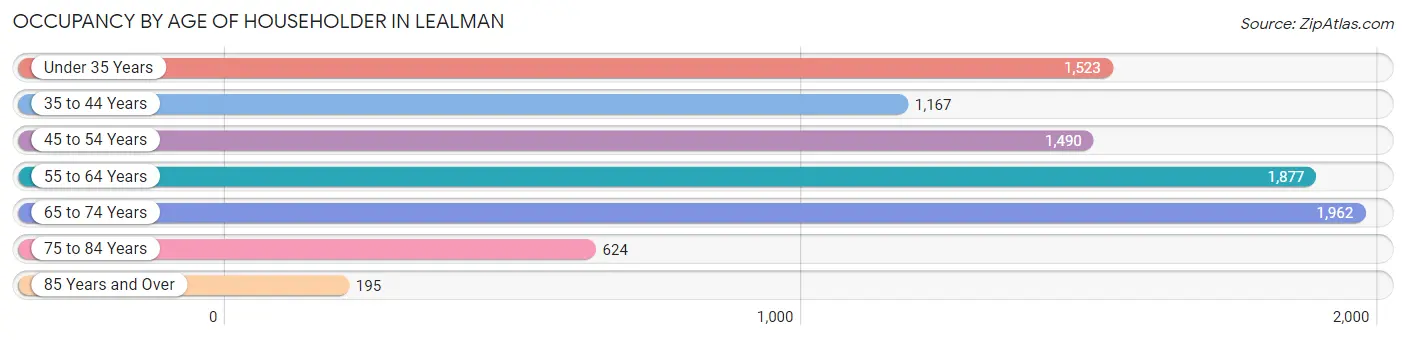
| Age Bracket | # Households | % Households |
| Under 35 Years | 1,523 | 17.2% |
| 35 to 44 Years | 1,167 | 13.2% |
| 45 to 54 Years | 1,490 | 16.9% |
| 55 to 64 Years | 1,877 | 21.2% |
| 65 to 74 Years | 1,962 | 22.2% |
| 75 to 84 Years | 624 | 7.1% |
| 85 Years and Over | 195 | 2.2% |
| Total | 8,838 | 100.0% |
Housing Finances in Lealman
Median Income by Occupancy in Lealman
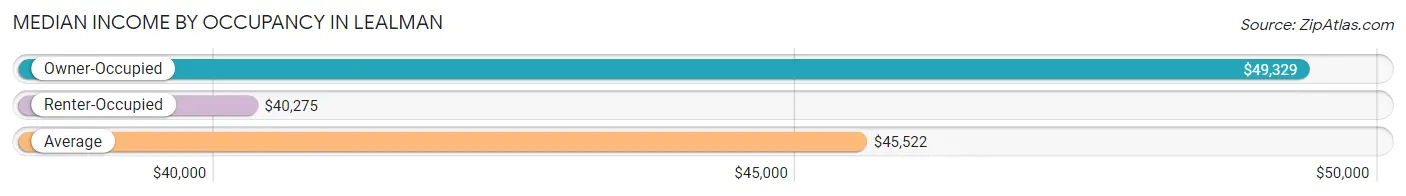
| Occupancy Type | # Households | Median Income |
| Owner-Occupied | 5,508 (62.3%) | $49,329 |
| Renter-Occupied | 3,330 (37.7%) | $40,275 |
| Average | 8,838 (100.0%) | $45,522 |
Occupancy by Householder Income Bracket in Lealman
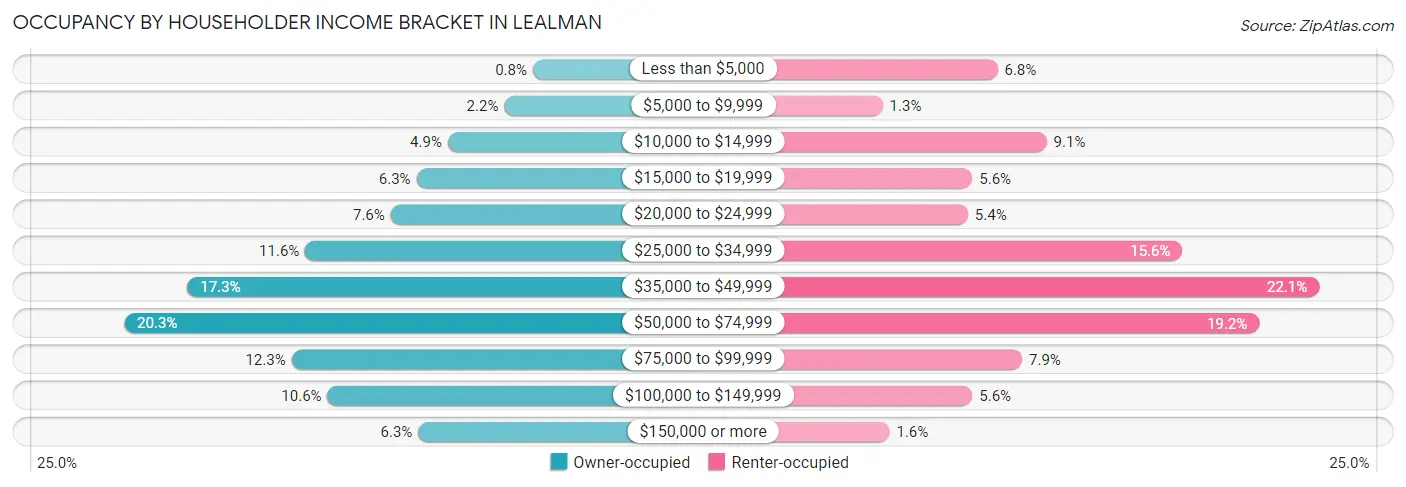
| Income Bracket | Owner-occupied | Renter-occupied |
| Less than $5,000 | 44 (0.8%) | 225 (6.8%) |
| $5,000 to $9,999 | 119 (2.2%) | 43 (1.3%) |
| $10,000 to $14,999 | 267 (4.9%) | 303 (9.1%) |
| $15,000 to $19,999 | 349 (6.3%) | 185 (5.6%) |
| $20,000 to $24,999 | 417 (7.6%) | 178 (5.3%) |
| $25,000 to $34,999 | 641 (11.6%) | 518 (15.6%) |
| $35,000 to $49,999 | 950 (17.2%) | 735 (22.1%) |
| $50,000 to $74,999 | 1,116 (20.3%) | 640 (19.2%) |
| $75,000 to $99,999 | 677 (12.3%) | 264 (7.9%) |
| $100,000 to $149,999 | 583 (10.6%) | 185 (5.6%) |
| $150,000 or more | 345 (6.3%) | 54 (1.6%) |
| Total | 5,508 (100.0%) | 3,330 (100.0%) |
Monthly Housing Cost Tiers in Lealman
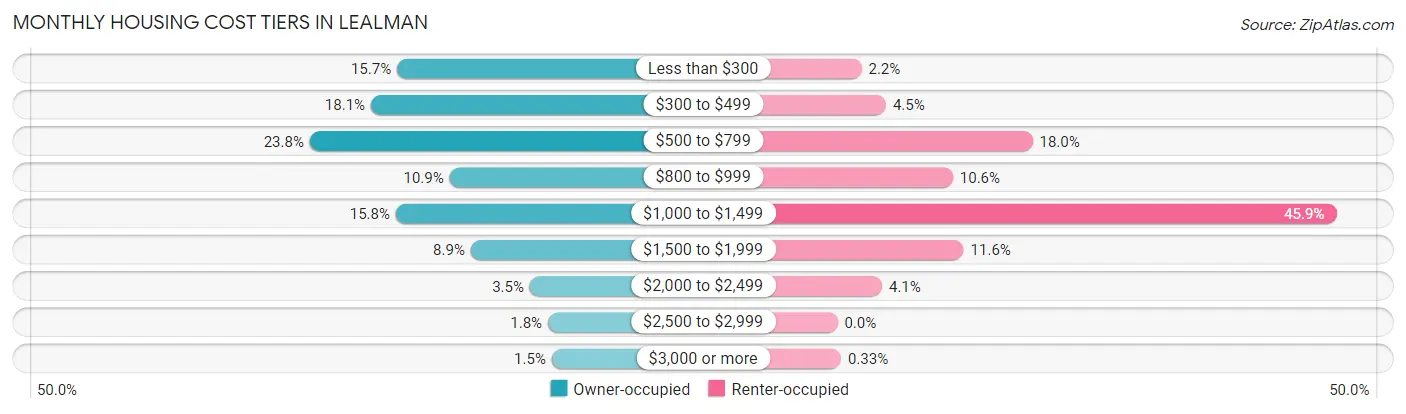
| Monthly Cost | Owner-occupied | Renter-occupied |
| Less than $300 | 866 (15.7%) | 74 (2.2%) |
| $300 to $499 | 998 (18.1%) | 149 (4.5%) |
| $500 to $799 | 1,308 (23.7%) | 598 (18.0%) |
| $800 to $999 | 599 (10.9%) | 354 (10.6%) |
| $1,000 to $1,499 | 872 (15.8%) | 1,529 (45.9%) |
| $1,500 to $1,999 | 492 (8.9%) | 387 (11.6%) |
| $2,000 to $2,499 | 192 (3.5%) | 137 (4.1%) |
| $2,500 to $2,999 | 100 (1.8%) | 0 (0.0%) |
| $3,000 or more | 81 (1.5%) | 11 (0.3%) |
| Total | 5,508 (100.0%) | 3,330 (100.0%) |
Physical Housing Characteristics in Lealman
Housing Structures in Lealman
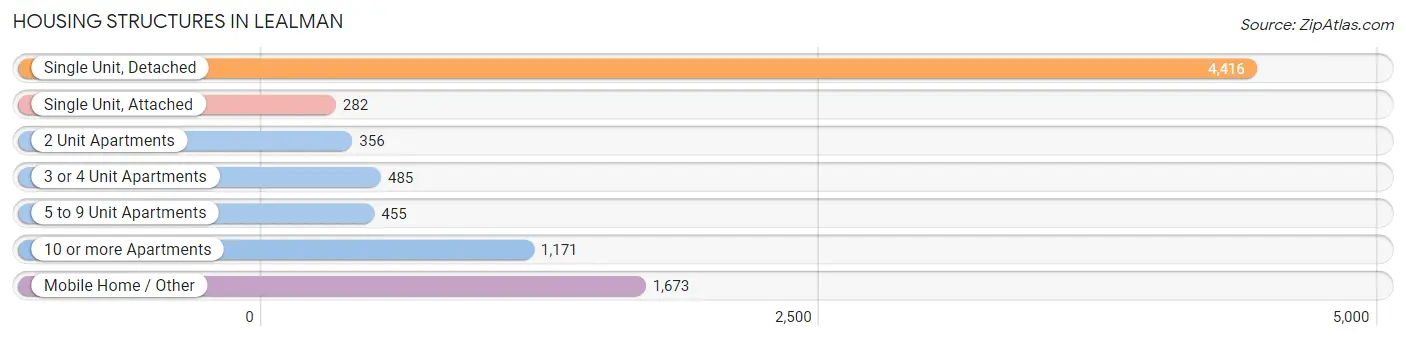
| Structure Type | # Housing Units | % Housing Units |
| Single Unit, Detached | 4,416 | 50.0% |
| Single Unit, Attached | 282 | 3.2% |
| 2 Unit Apartments | 356 | 4.0% |
| 3 or 4 Unit Apartments | 485 | 5.5% |
| 5 to 9 Unit Apartments | 455 | 5.1% |
| 10 or more Apartments | 1,171 | 13.3% |
| Mobile Home / Other | 1,673 | 18.9% |
| Total | 8,838 | 100.0% |
Housing Structures by Occupancy in Lealman
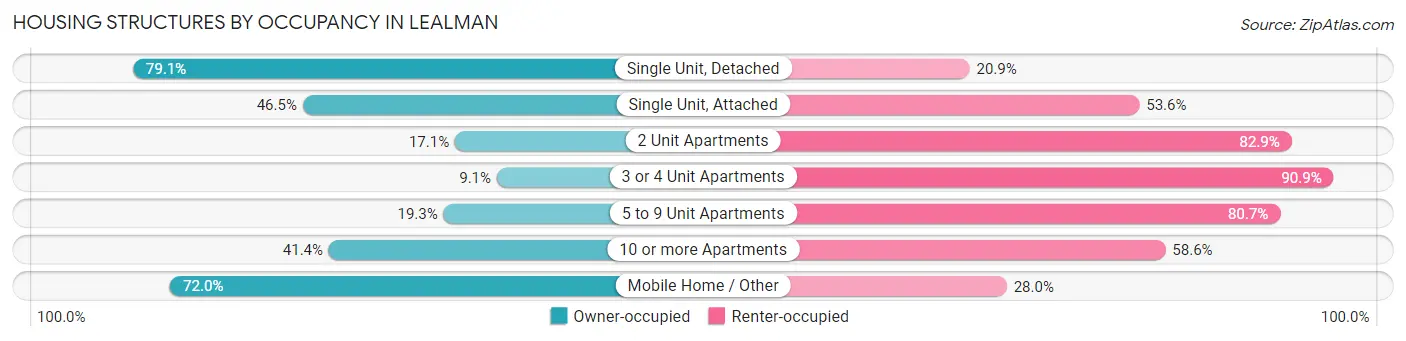
| Structure Type | Owner-occupied | Renter-occupied |
| Single Unit, Detached | 3,495 (79.1%) | 921 (20.9%) |
| Single Unit, Attached | 131 (46.5%) | 151 (53.5%) |
| 2 Unit Apartments | 61 (17.1%) | 295 (82.9%) |
| 3 or 4 Unit Apartments | 44 (9.1%) | 441 (90.9%) |
| 5 to 9 Unit Apartments | 88 (19.3%) | 367 (80.7%) |
| 10 or more Apartments | 485 (41.4%) | 686 (58.6%) |
| Mobile Home / Other | 1,204 (72.0%) | 469 (28.0%) |
| Total | 5,508 (62.3%) | 3,330 (37.7%) |
Housing Structures by Number of Rooms in Lealman
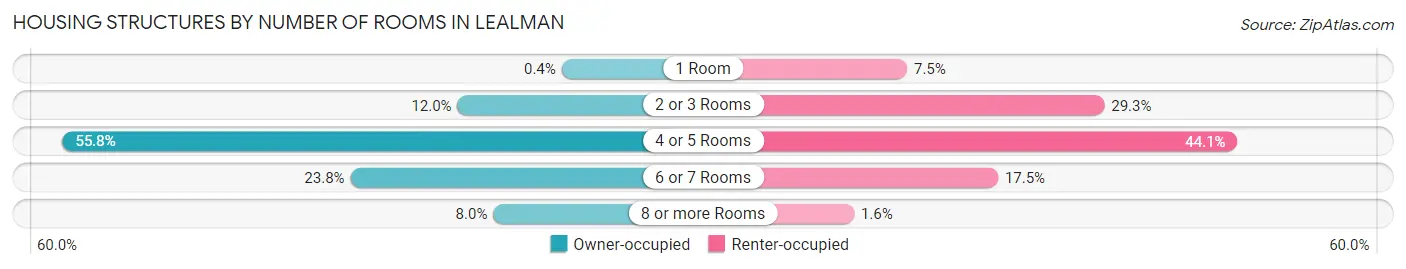
| Number of Rooms | Owner-occupied | Renter-occupied |
| 1 Room | 22 (0.4%) | 248 (7.4%) |
| 2 or 3 Rooms | 659 (12.0%) | 977 (29.3%) |
| 4 or 5 Rooms | 3,074 (55.8%) | 1,469 (44.1%) |
| 6 or 7 Rooms | 1,313 (23.8%) | 584 (17.5%) |
| 8 or more Rooms | 440 (8.0%) | 52 (1.6%) |
| Total | 5,508 (100.0%) | 3,330 (100.0%) |
Housing Structure by Heating Type in Lealman
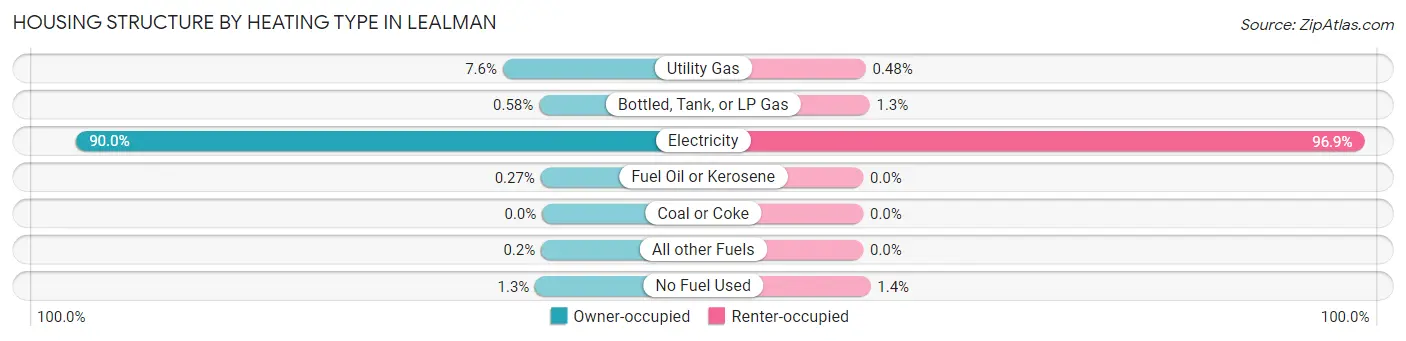
| Heating Type | Owner-occupied | Renter-occupied |
| Utility Gas | 418 (7.6%) | 16 (0.5%) |
| Bottled, Tank, or LP Gas | 32 (0.6%) | 42 (1.3%) |
| Electricity | 4,958 (90.0%) | 3,225 (96.9%) |
| Fuel Oil or Kerosene | 15 (0.3%) | 0 (0.0%) |
| Coal or Coke | 0 (0.0%) | 0 (0.0%) |
| All other Fuels | 11 (0.2%) | 0 (0.0%) |
| No Fuel Used | 74 (1.3%) | 47 (1.4%) |
| Total | 5,508 (100.0%) | 3,330 (100.0%) |
Household Vehicle Usage in Lealman
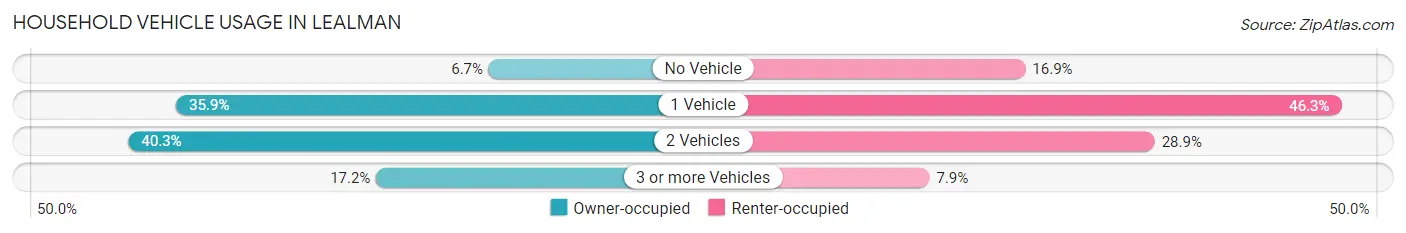
| Vehicles per Household | Owner-occupied | Renter-occupied |
| No Vehicle | 367 (6.7%) | 561 (16.9%) |
| 1 Vehicle | 1,975 (35.9%) | 1,543 (46.3%) |
| 2 Vehicles | 2,220 (40.3%) | 963 (28.9%) |
| 3 or more Vehicles | 946 (17.2%) | 263 (7.9%) |
| Total | 5,508 (100.0%) | 3,330 (100.0%) |
Real Estate & Mortgages in Lealman
Real Estate and Mortgage Overview in Lealman
| Characteristic | Without Mortgage | With Mortgage |
| Housing Units | 3,294 | 2,214 |
| Median Property Value | $111,800 | $203,600 |
| Median Household Income | $41,268 | $239 |
| Monthly Housing Costs | $470 | $45 |
| Real Estate Taxes | $933 | $148 |
Property Value by Mortgage Status in Lealman
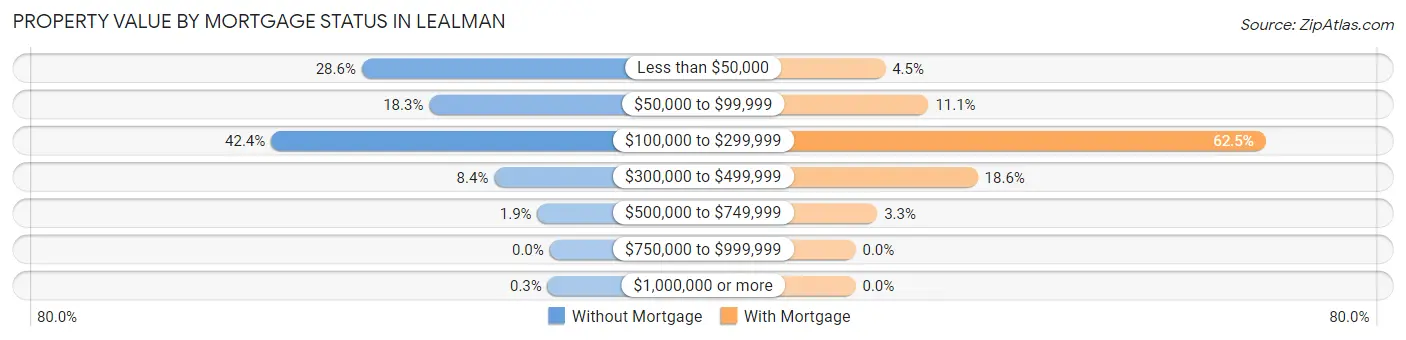
| Property Value | Without Mortgage | With Mortgage |
| Less than $50,000 | 943 (28.6%) | 100 (4.5%) |
| $50,000 to $99,999 | 604 (18.3%) | 246 (11.1%) |
| $100,000 to $299,999 | 1,398 (42.4%) | 1,383 (62.5%) |
| $300,000 to $499,999 | 278 (8.4%) | 412 (18.6%) |
| $500,000 to $749,999 | 61 (1.8%) | 73 (3.3%) |
| $750,000 to $999,999 | 0 (0.0%) | 0 (0.0%) |
| $1,000,000 or more | 10 (0.3%) | 0 (0.0%) |
| Total | 3,294 (100.0%) | 2,214 (100.0%) |
Household Income by Mortgage Status in Lealman
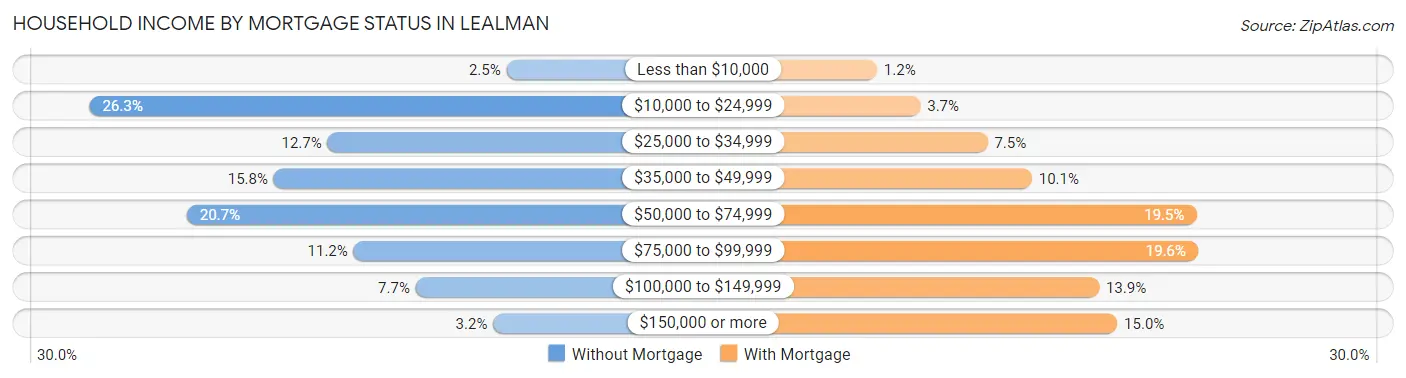
| Household Income | Without Mortgage | With Mortgage |
| Less than $10,000 | 81 (2.5%) | 27 (1.2%) |
| $10,000 to $24,999 | 866 (26.3%) | 82 (3.7%) |
| $25,000 to $34,999 | 418 (12.7%) | 167 (7.5%) |
| $35,000 to $49,999 | 519 (15.8%) | 223 (10.1%) |
| $50,000 to $74,999 | 683 (20.7%) | 431 (19.5%) |
| $75,000 to $99,999 | 369 (11.2%) | 433 (19.6%) |
| $100,000 to $149,999 | 252 (7.6%) | 308 (13.9%) |
| $150,000 or more | 106 (3.2%) | 331 (14.9%) |
| Total | 3,294 (100.0%) | 2,214 (100.0%) |
Property Value to Household Income Ratio in Lealman
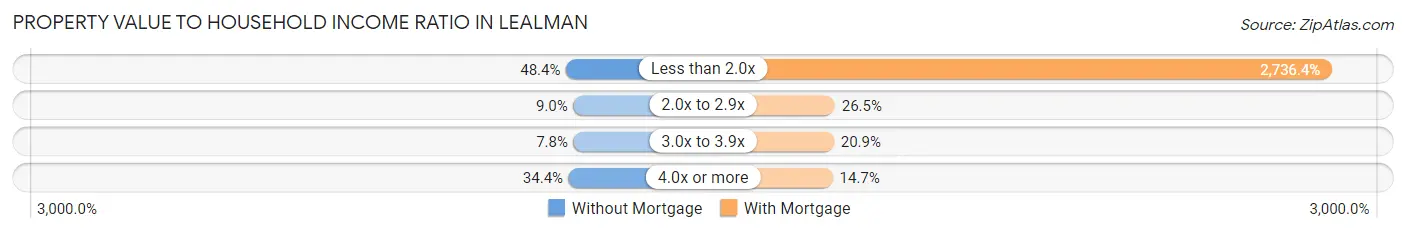
| Value-to-Income Ratio | Without Mortgage | With Mortgage |
| Less than 2.0x | 1,595 (48.4%) | 60,583 (2,736.4%) |
| 2.0x to 2.9x | 295 (9.0%) | 587 (26.5%) |
| 3.0x to 3.9x | 258 (7.8%) | 463 (20.9%) |
| 4.0x or more | 1,133 (34.4%) | 326 (14.7%) |
| Total | 3,294 (100.0%) | 2,214 (100.0%) |
Real Estate Taxes by Mortgage Status in Lealman
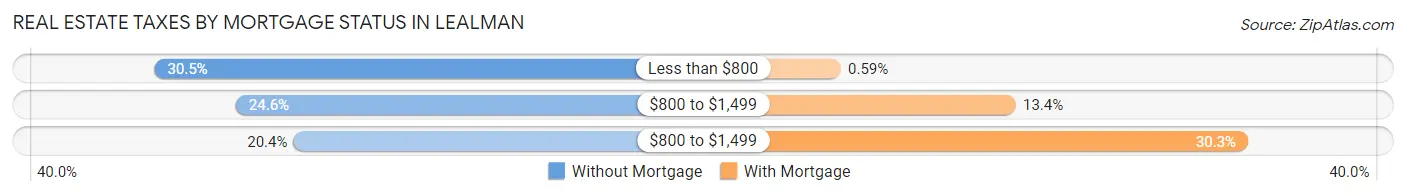
| Property Taxes | Without Mortgage | With Mortgage |
| Less than $800 | 1,005 (30.5%) | 13 (0.6%) |
| $800 to $1,499 | 809 (24.6%) | 296 (13.4%) |
| $800 to $1,499 | 671 (20.4%) | 671 (30.3%) |
| Total | 3,294 (100.0%) | 2,214 (100.0%) |
Health & Disability in Lealman
Health Insurance Coverage by Age in Lealman
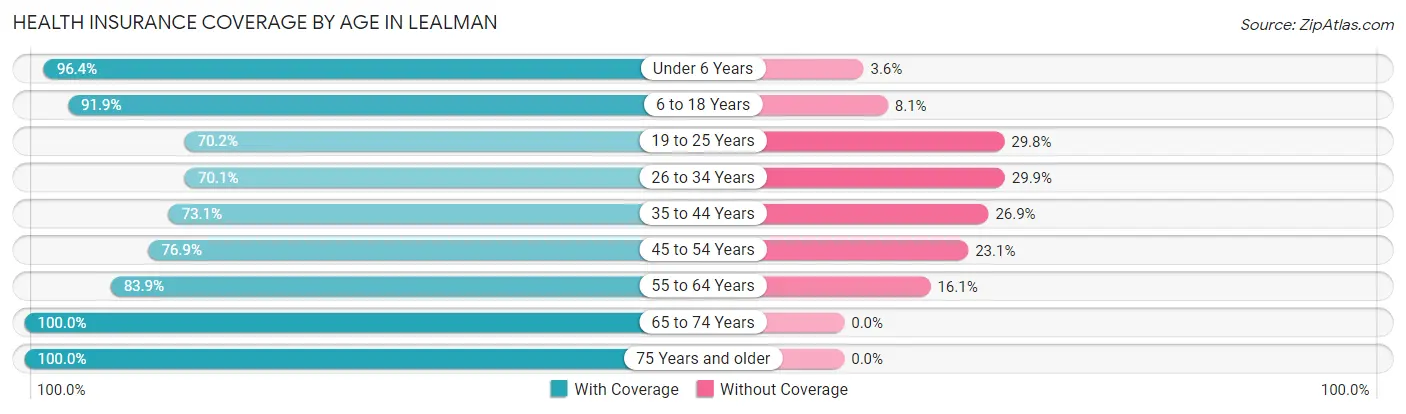
| Age Bracket | With Coverage | Without Coverage |
| Under 6 Years | 968 (96.4%) | 36 (3.6%) |
| 6 to 18 Years | 2,624 (91.9%) | 232 (8.1%) |
| 19 to 25 Years | 1,246 (70.2%) | 530 (29.8%) |
| 26 to 34 Years | 2,125 (70.1%) | 908 (29.9%) |
| 35 to 44 Years | 1,874 (73.1%) | 689 (26.9%) |
| 45 to 54 Years | 2,049 (76.9%) | 616 (23.1%) |
| 55 to 64 Years | 2,611 (83.9%) | 500 (16.1%) |
| 65 to 74 Years | 2,626 (100.0%) | 0 (0.0%) |
| 75 Years and older | 1,439 (100.0%) | 0 (0.0%) |
| Total | 17,562 (83.3%) | 3,511 (16.7%) |
Health Insurance Coverage by Citizenship Status in Lealman
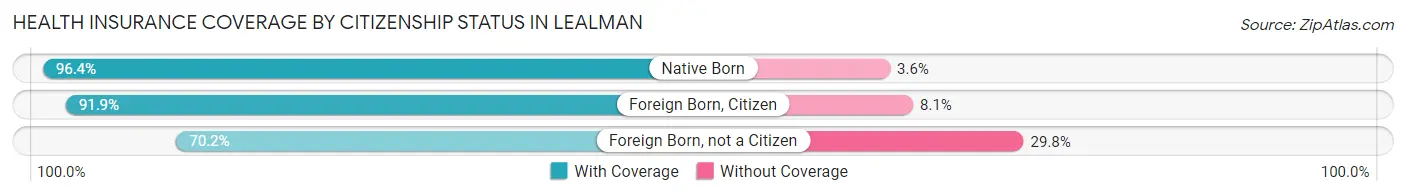
| Citizenship Status | With Coverage | Without Coverage |
| Native Born | 968 (96.4%) | 36 (3.6%) |
| Foreign Born, Citizen | 2,624 (91.9%) | 232 (8.1%) |
| Foreign Born, not a Citizen | 1,246 (70.2%) | 530 (29.8%) |
Health Insurance Coverage by Household Income in Lealman
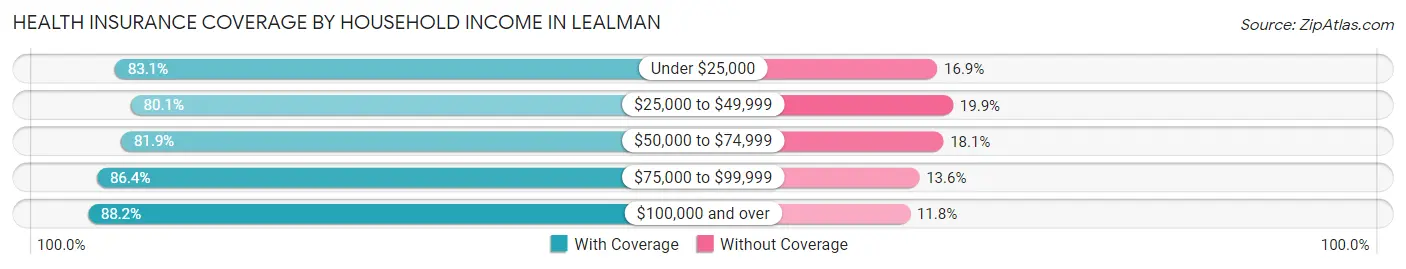
| Household Income | With Coverage | Without Coverage |
| Under $25,000 | 2,706 (83.1%) | 551 (16.9%) |
| $25,000 to $49,999 | 5,086 (80.1%) | 1,262 (19.9%) |
| $50,000 to $74,999 | 3,721 (81.9%) | 820 (18.1%) |
| $75,000 to $99,999 | 2,375 (86.4%) | 373 (13.6%) |
| $100,000 and over | 3,632 (88.2%) | 488 (11.8%) |
Public vs Private Health Insurance Coverage by Age in Lealman
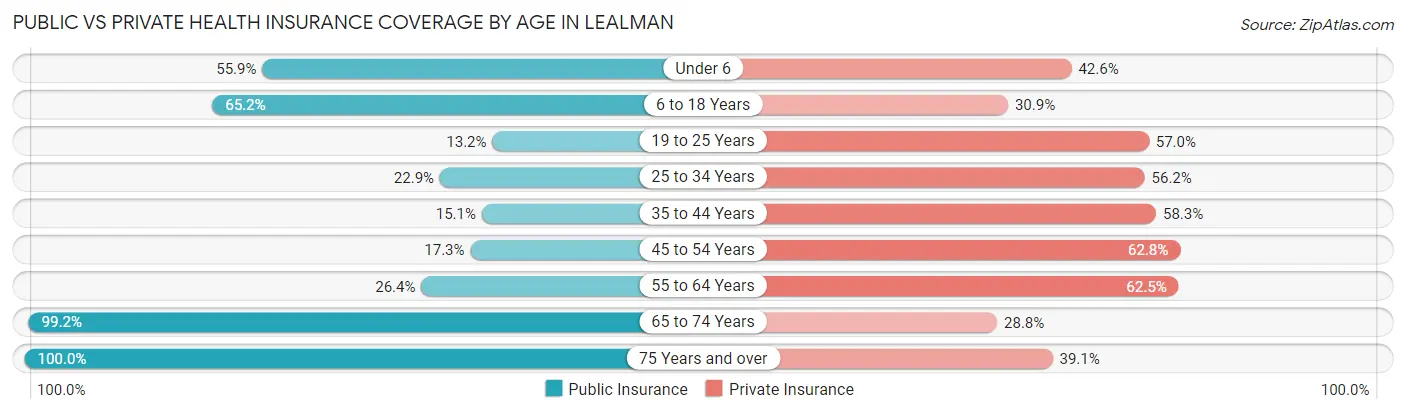
| Age Bracket | Public Insurance | Private Insurance |
| Under 6 | 561 (55.9%) | 428 (42.6%) |
| 6 to 18 Years | 1,861 (65.2%) | 881 (30.8%) |
| 19 to 25 Years | 234 (13.2%) | 1,012 (57.0%) |
| 25 to 34 Years | 695 (22.9%) | 1,705 (56.2%) |
| 35 to 44 Years | 388 (15.1%) | 1,495 (58.3%) |
| 45 to 54 Years | 460 (17.3%) | 1,673 (62.8%) |
| 55 to 64 Years | 820 (26.4%) | 1,945 (62.5%) |
| 65 to 74 Years | 2,606 (99.2%) | 757 (28.8%) |
| 75 Years and over | 1,439 (100.0%) | 563 (39.1%) |
| Total | 9,064 (43.0%) | 10,459 (49.6%) |
Disability Status by Sex by Age in Lealman
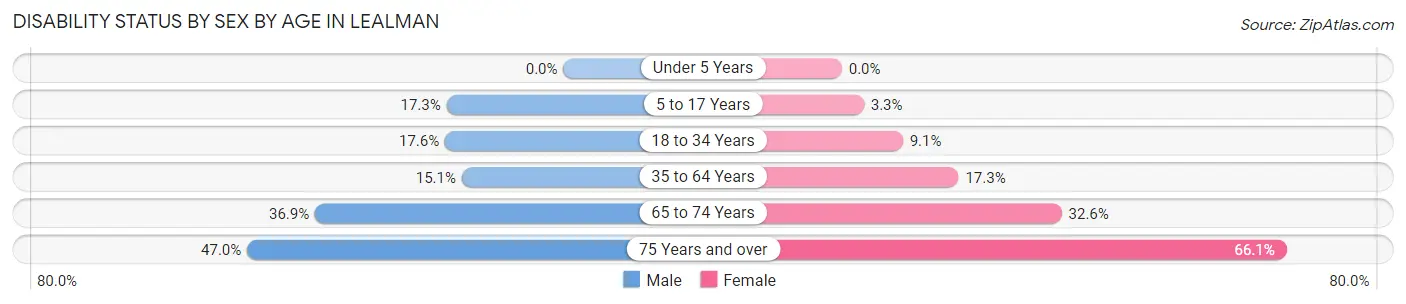
| Age Bracket | Male | Female |
| Under 5 Years | 0 (0.0%) | 0 (0.0%) |
| 5 to 17 Years | 262 (17.3%) | 51 (3.3%) |
| 18 to 34 Years | 416 (17.6%) | 227 (9.0%) |
| 35 to 64 Years | 683 (15.1%) | 660 (17.3%) |
| 65 to 74 Years | 400 (36.9%) | 503 (32.6%) |
| 75 Years and over | 247 (47.0%) | 603 (66.0%) |
Disability Class by Sex by Age in Lealman
Disability Class: Hearing Difficulty
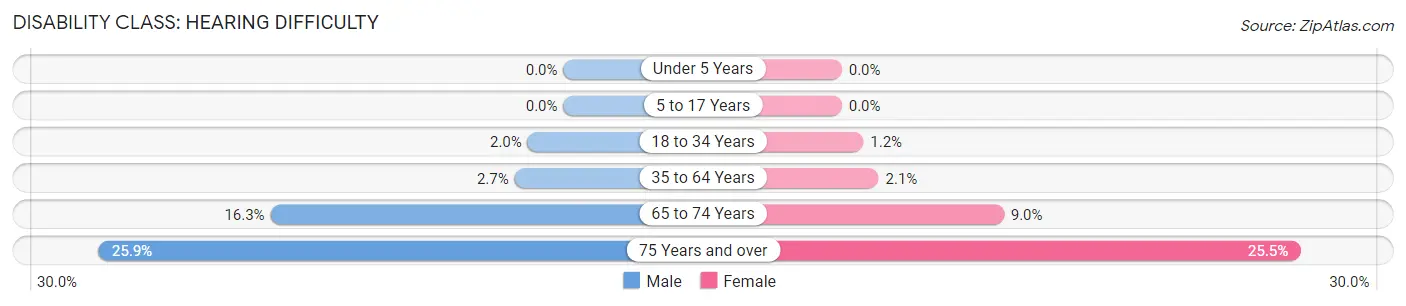
| Age Bracket | Male | Female |
| Under 5 Years | 0 (0.0%) | 0 (0.0%) |
| 5 to 17 Years | 0 (0.0%) | 0 (0.0%) |
| 18 to 34 Years | 47 (2.0%) | 30 (1.2%) |
| 35 to 64 Years | 123 (2.7%) | 78 (2.1%) |
| 65 to 74 Years | 177 (16.3%) | 139 (9.0%) |
| 75 Years and over | 136 (25.9%) | 233 (25.5%) |
Disability Class: Vision Difficulty
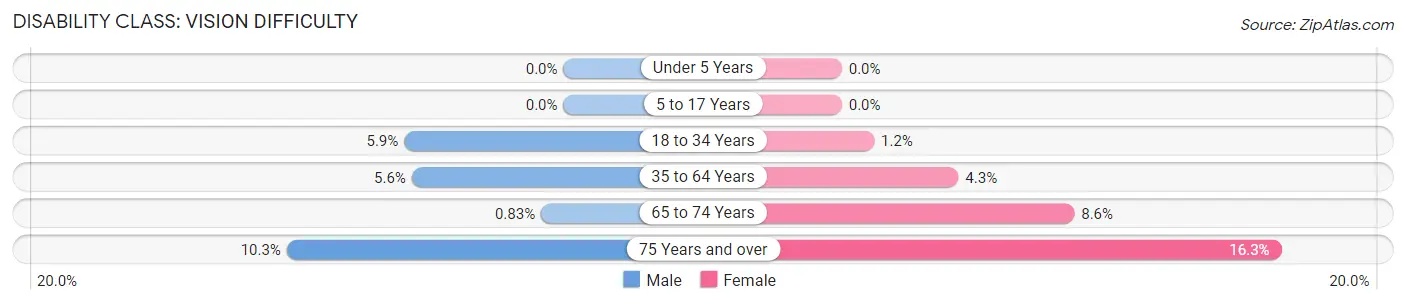
| Age Bracket | Male | Female |
| Under 5 Years | 0 (0.0%) | 0 (0.0%) |
| 5 to 17 Years | 0 (0.0%) | 0 (0.0%) |
| 18 to 34 Years | 140 (5.9%) | 30 (1.2%) |
| 35 to 64 Years | 255 (5.6%) | 165 (4.3%) |
| 65 to 74 Years | 9 (0.8%) | 133 (8.6%) |
| 75 Years and over | 54 (10.3%) | 149 (16.3%) |
Disability Class: Cognitive Difficulty
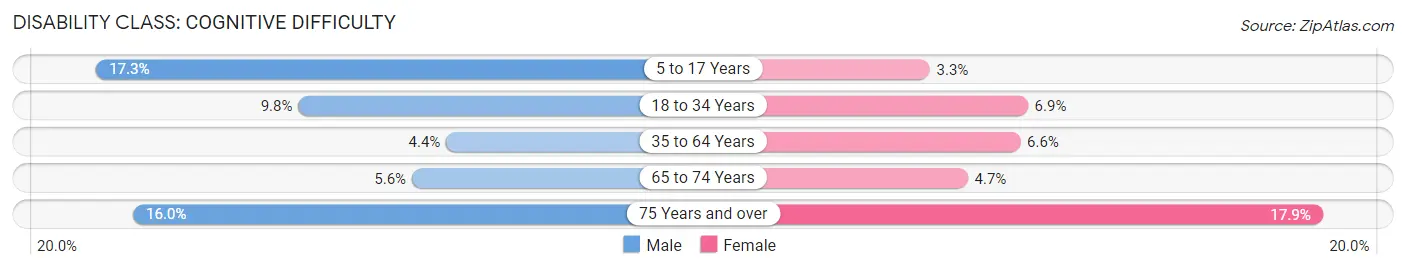
| Age Bracket | Male | Female |
| 5 to 17 Years | 262 (17.3%) | 51 (3.3%) |
| 18 to 34 Years | 233 (9.8%) | 173 (6.9%) |
| 35 to 64 Years | 197 (4.3%) | 252 (6.6%) |
| 65 to 74 Years | 61 (5.6%) | 72 (4.7%) |
| 75 Years and over | 84 (16.0%) | 163 (17.8%) |
Disability Class: Ambulatory Difficulty
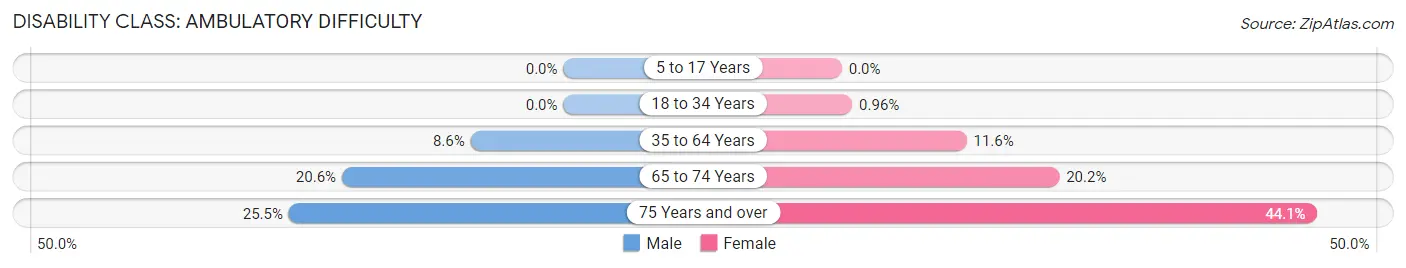
| Age Bracket | Male | Female |
| 5 to 17 Years | 0 (0.0%) | 0 (0.0%) |
| 18 to 34 Years | 0 (0.0%) | 24 (1.0%) |
| 35 to 64 Years | 390 (8.6%) | 441 (11.6%) |
| 65 to 74 Years | 223 (20.5%) | 311 (20.2%) |
| 75 Years and over | 134 (25.5%) | 403 (44.1%) |
Disability Class: Self-Care Difficulty
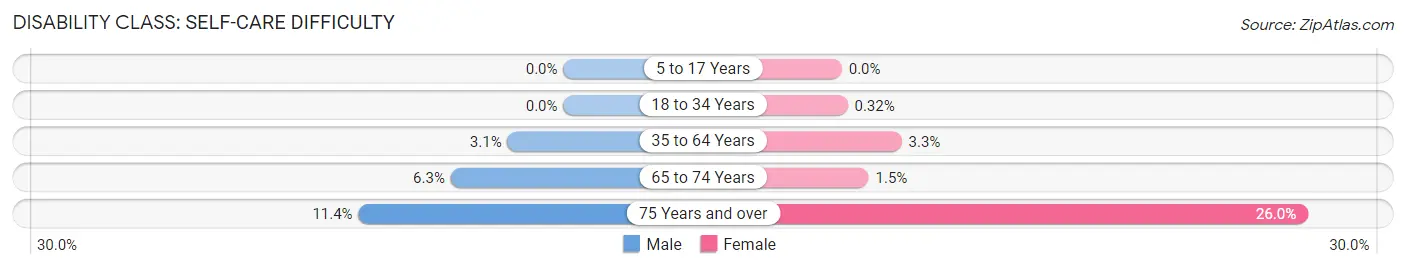
| Age Bracket | Male | Female |
| 5 to 17 Years | 0 (0.0%) | 0 (0.0%) |
| 18 to 34 Years | 0 (0.0%) | 8 (0.3%) |
| 35 to 64 Years | 141 (3.1%) | 127 (3.3%) |
| 65 to 74 Years | 68 (6.3%) | 23 (1.5%) |
| 75 Years and over | 60 (11.4%) | 237 (26.0%) |
Technology Access in Lealman
Computing Device Access in Lealman
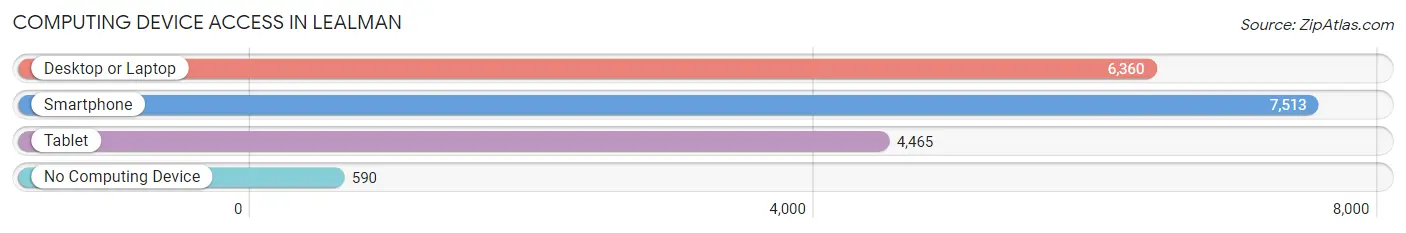
| Device Type | # Households | % Households |
| Desktop or Laptop | 6,360 | 72.0% |
| Smartphone | 7,513 | 85.0% |
| Tablet | 4,465 | 50.5% |
| No Computing Device | 590 | 6.7% |
| Total | 8,838 | 100.0% |
Internet Access in Lealman
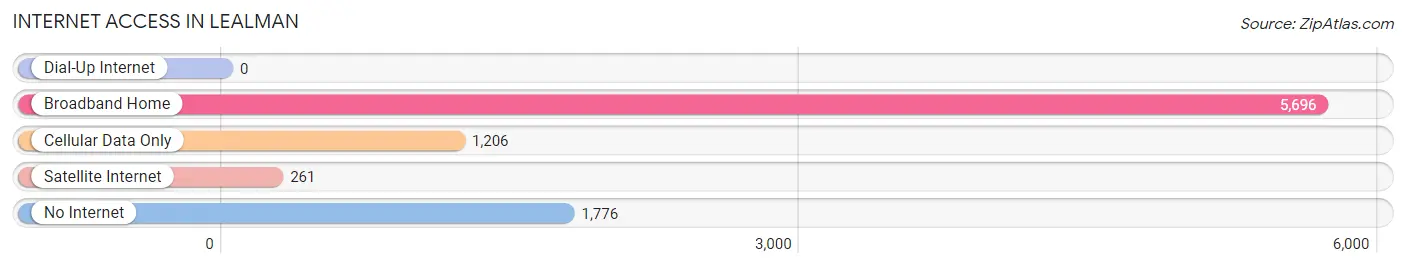
| Internet Type | # Households | % Households |
| Dial-Up Internet | 0 | 0.0% |
| Broadband Home | 5,696 | 64.4% |
| Cellular Data Only | 1,206 | 13.7% |
| Satellite Internet | 261 | 2.9% |
| No Internet | 1,776 | 20.1% |
| Total | 8,838 | 100.0% |
Lealman Summary
Lealman is an unincorporated community located in Pinellas County, Florida. It is located just north of St. Petersburg and is part of the Tampa Bay Area. The population of Lealman was estimated to be around 33,000 in 2019.
History
Lealman was originally part of the Pinellas Peninsula, which was inhabited by the Tocobaga people until the late 18th century. The area was then settled by European settlers in the early 19th century. The first settlers were mostly farmers and fishermen, and the area was known as “Lealman’s Landing”. The name was derived from the Spanish word “leal”, which means “loyal”.
In the late 19th century, the area was developed as a resort community. The area was known for its beautiful beaches and was a popular destination for tourists. In the early 20th century, the area was developed further with the construction of a railroad line and the development of a small business district.
Geography
Lealman is located in Pinellas County, Florida. It is situated just north of St. Petersburg and is part of the Tampa Bay Area. The area is bordered by the cities of St. Petersburg, Kenneth City, Pinellas Park, and Seminole. The area is mostly flat and is located at an elevation of about 10 feet above sea level.
The climate in Lealman is classified as humid subtropical, with hot and humid summers and mild winters. The average temperature in the summer is around 90°F, and the average temperature in the winter is around 60°F. The area receives an average of 54 inches of rain per year.
Economy
The economy of Lealman is largely based on tourism and retail. The area is home to several hotels, restaurants, and shopping centers. The area is also home to several manufacturing and industrial businesses.
The largest employer in the area is the Pinellas County School District, which employs over 5,000 people. Other major employers include Bayfront Health St. Petersburg, BayCare Health System, and the Pinellas County Sheriff’s Office.
Demographics
As of 2019, the population of Lealman was estimated to be around 33,000. The population is mostly white (77.3%), followed by African American (14.2%), Hispanic (4.7%), and Asian (2.7%). The median household income in the area is around $41,000, and the median home value is around $150,000.
The area is served by the Pinellas County School District, which operates several elementary, middle, and high schools in the area. The area is also home to several private schools, including St. Petersburg Catholic High School and St. Petersburg College.
Conclusion
Lealman is an unincorporated community located in Pinellas County, Florida. It is located just north of St. Petersburg and is part of the Tampa Bay Area. The population of Lealman was estimated to be around 33,000 in 2019. The economy of Lealman is largely based on tourism and retail, and the area is served by the Pinellas County School District. The population is mostly white, followed by African American, Hispanic, and Asian. The median household income in the area is around $41,000, and the median home value is around $150,000.
Common Questions
What is Per Capita Income in Lealman?
Per Capita income in Lealman is $25,268.
What is the Median Family Income in Lealman?
Median Family Income in Lealman is $54,123.
What is the Median Household income in Lealman?
Median Household Income in Lealman is $45,522.
What is Income or Wage Gap in Lealman?
Income or Wage Gap in Lealman is 11.1%.
Women in Lealman earn 88.9 cents for every dollar earned by a man.
What is Family Income Deficit in Lealman?
Family Income Deficit in Lealman is $11,071.
Families that are below poverty line in Lealman earn $11,071 less on average than the poverty threshold level.
What is Inequality or Gini Index in Lealman?
Inequality or Gini Index in Lealman is 0.40.
What is the Total Population of Lealman?
Total Population of Lealman is 21,237.
What is the Total Male Population of Lealman?
Total Male Population of Lealman is 10,373.
What is the Total Female Population of Lealman?
Total Female Population of Lealman is 10,864.
What is the Ratio of Males per 100 Females in Lealman?
There are 95.48 Males per 100 Females in Lealman.
What is the Ratio of Females per 100 Males in Lealman?
There are 104.73 Females per 100 Males in Lealman.
What is the Median Population Age in Lealman?
Median Population Age in Lealman is 41.0 Years.
What is the Average Family Size in Lealman
Average Family Size in Lealman is 3.1 People.
What is the Average Household Size in Lealman
Average Household Size in Lealman is 2.4 People.
How Large is the Labor Force in Lealman?
There are 10,676 People in the Labor Forcein in Lealman.
What is the Percentage of People in the Labor Force in Lealman?
59.7% of People are in the Labor Force in Lealman.
What is the Unemployment Rate in Lealman?
Unemployment Rate in Lealman is 6.9%.