Bellview, FL Map & Demographics
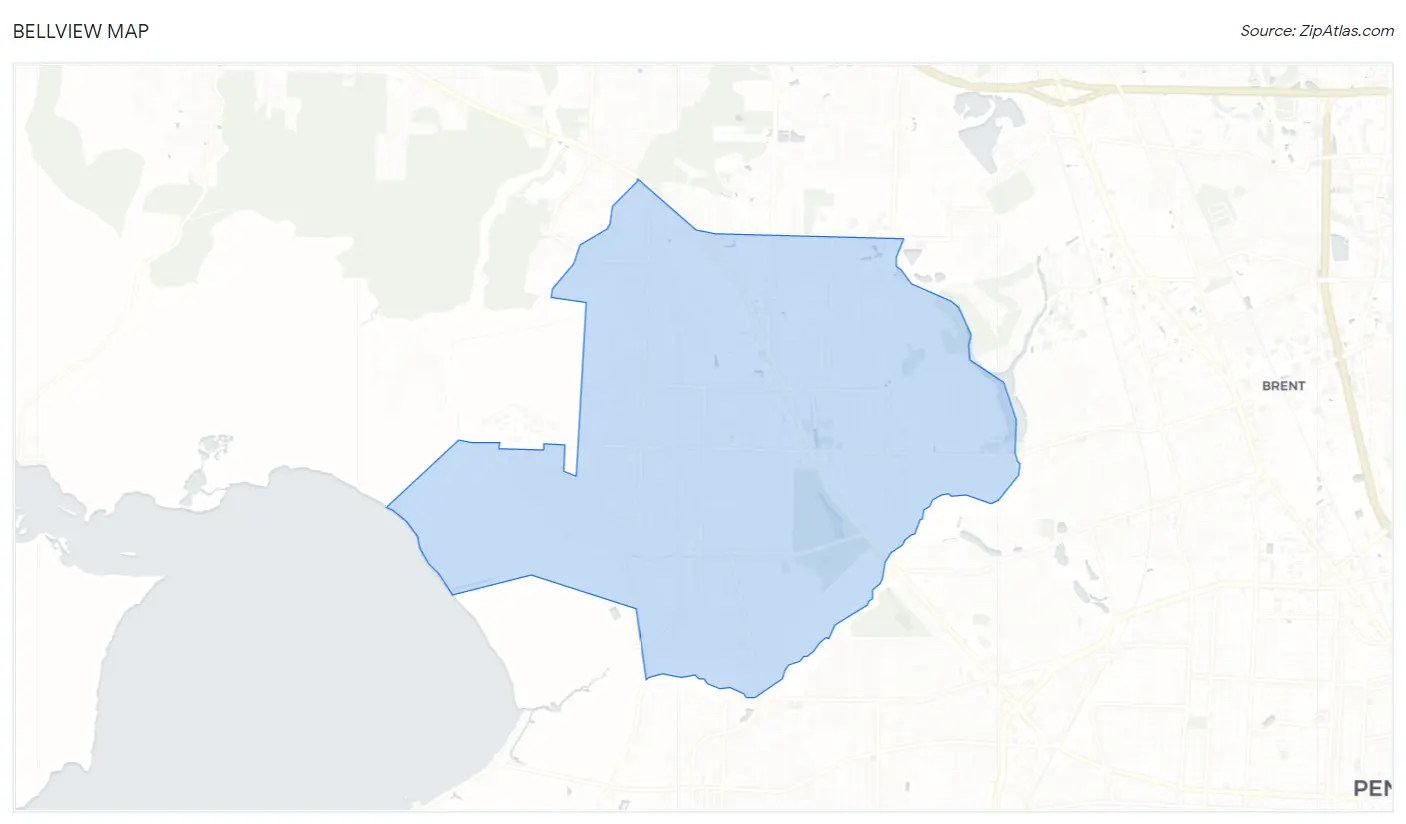
Bellview Map
Bellview Overview
$30,094
PER CAPITA INCOME
$69,600
AVG FAMILY INCOME
$63,596
AVG HOUSEHOLD INCOME
25.0%
WAGE / INCOME GAP [ % ]
75.0¢/ $1
WAGE / INCOME GAP [ $ ]
$8,707
FAMILY INCOME DEFICIT
0.36
INEQUALITY / GINI INDEX
24,035
TOTAL POPULATION
11,183
MALE POPULATION
12,852
FEMALE POPULATION
87.01
MALES / 100 FEMALES
114.92
FEMALES / 100 MALES
38.9
MEDIAN AGE
3.0
AVG FAMILY SIZE
2.5
AVG HOUSEHOLD SIZE
11,754
LABOR FORCE [ PEOPLE ]
61.8%
PERCENT IN LABOR FORCE
5.5%
UNEMPLOYMENT RATE
Bellview Area Codes
Income in Bellview
Income Overview in Bellview
Per Capita Income in Bellview is $30,094, while median incomes of families and households are $69,600 and $63,596 respectively.
| Characteristic | Number | Measure |
| Per Capita Income | 24,035 | $30,094 |
| Median Family Income | 6,443 | $69,600 |
| Mean Family Income | 6,443 | $77,017 |
| Median Household Income | 9,663 | $63,596 |
| Mean Household Income | 9,663 | $72,478 |
| Income Deficit | 6,443 | $8,707 |
| Wage / Income Gap (%) | 24,035 | 24.98% |
| Wage / Income Gap ($) | 24,035 | 75.02¢ per $1 |
| Gini / Inequality Index | 24,035 | 0.36 |
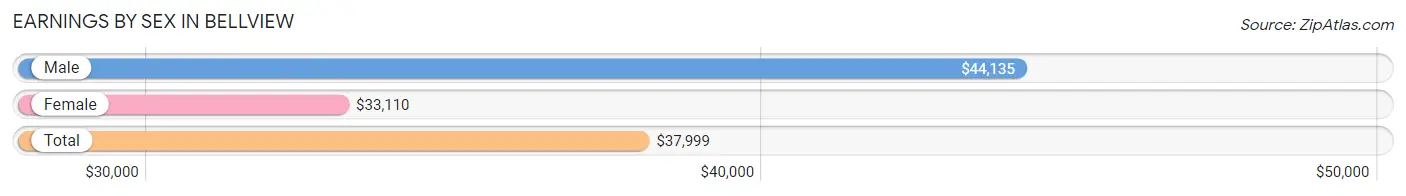
Earnings by Sex in Bellview
Average Earnings in Bellview are $37,999, $44,135 for men and $33,110 for women, a difference of 25.0%.
| Sex | Number | Average Earnings |
| Male | 5,755 (48.2%) | $44,135 |
| Female | 6,174 (51.8%) | $33,110 |
| Total | 11,929 (100.0%) | $37,999 |
Earnings by Sex by Income Bracket in Bellview
The most common earnings brackets in Bellview are $55,000 to $64,999 for men (647 | 11.2%) and $30,000 to $34,999 for women (882 | 14.3%).
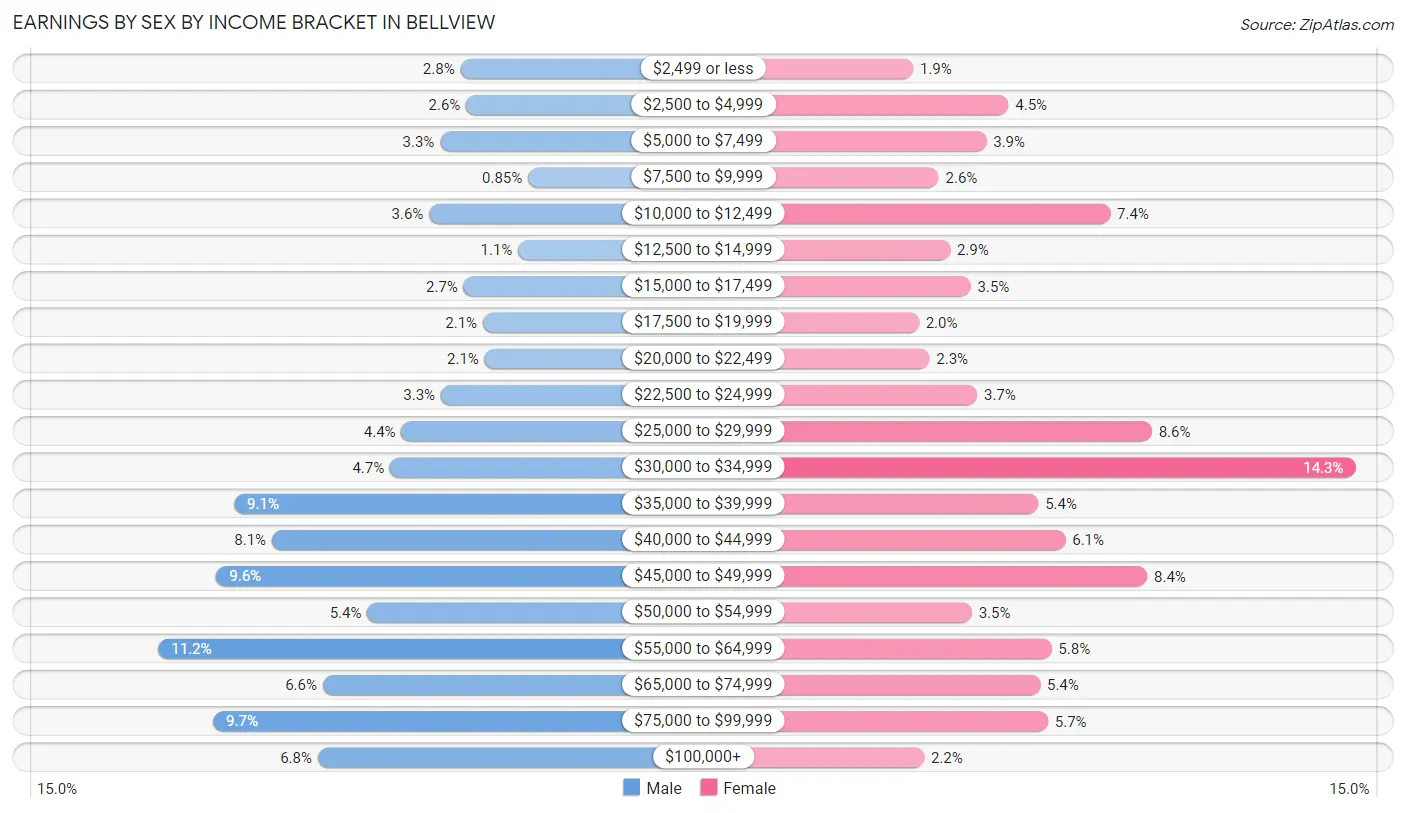
| Income | Male | Female |
| $2,499 or less | 158 (2.8%) | 115 (1.9%) |
| $2,500 to $4,999 | 149 (2.6%) | 280 (4.5%) |
| $5,000 to $7,499 | 191 (3.3%) | 242 (3.9%) |
| $7,500 to $9,999 | 49 (0.9%) | 159 (2.6%) |
| $10,000 to $12,499 | 209 (3.6%) | 457 (7.4%) |
| $12,500 to $14,999 | 65 (1.1%) | 179 (2.9%) |
| $15,000 to $17,499 | 153 (2.7%) | 215 (3.5%) |
| $17,500 to $19,999 | 122 (2.1%) | 125 (2.0%) |
| $20,000 to $22,499 | 119 (2.1%) | 143 (2.3%) |
| $22,500 to $24,999 | 190 (3.3%) | 226 (3.7%) |
| $25,000 to $29,999 | 254 (4.4%) | 529 (8.6%) |
| $30,000 to $34,999 | 272 (4.7%) | 882 (14.3%) |
| $35,000 to $39,999 | 524 (9.1%) | 332 (5.4%) |
| $40,000 to $44,999 | 463 (8.1%) | 379 (6.1%) |
| $45,000 to $49,999 | 553 (9.6%) | 521 (8.4%) |
| $50,000 to $54,999 | 309 (5.4%) | 217 (3.5%) |
| $55,000 to $64,999 | 647 (11.2%) | 355 (5.8%) |
| $65,000 to $74,999 | 381 (6.6%) | 335 (5.4%) |
| $75,000 to $99,999 | 558 (9.7%) | 349 (5.7%) |
| $100,000+ | 389 (6.8%) | 134 (2.2%) |
| Total | 5,755 (100.0%) | 6,174 (100.0%) |
Earnings by Sex by Educational Attainment in Bellview
Average earnings in Bellview are $46,335 for men and $33,556 for women, a difference of 27.6%. Men with an educational attainment of graduate degree enjoy the highest average annual earnings of $75,583, while those with high school diploma education earn the least with $40,856. Women with an educational attainment of bachelor's degree earn the most with the average annual earnings of $51,193, while those with less than high school education have the smallest earnings of $14,150.
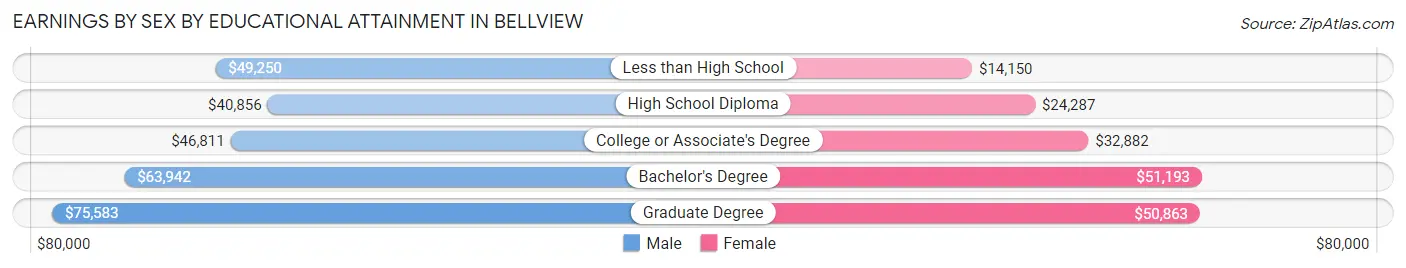
| Educational Attainment | Male Income | Female Income |
| Less than High School | $49,250 | $14,150 |
| High School Diploma | $40,856 | $24,287 |
| College or Associate's Degree | $46,811 | $32,882 |
| Bachelor's Degree | $63,942 | $51,193 |
| Graduate Degree | $75,583 | $50,863 |
| Total | $46,335 | $33,556 |
Family Income in Bellview
Family Income Brackets in Bellview
According to the Bellview family income data, there are 1,778 families falling into the $50,000 to $74,999 income range, which is the most common income bracket and makes up 27.6% of all families. Conversely, the $10,000 to $14,999 income bracket is the least frequent group with only 97 families (1.5%) belonging to this category.
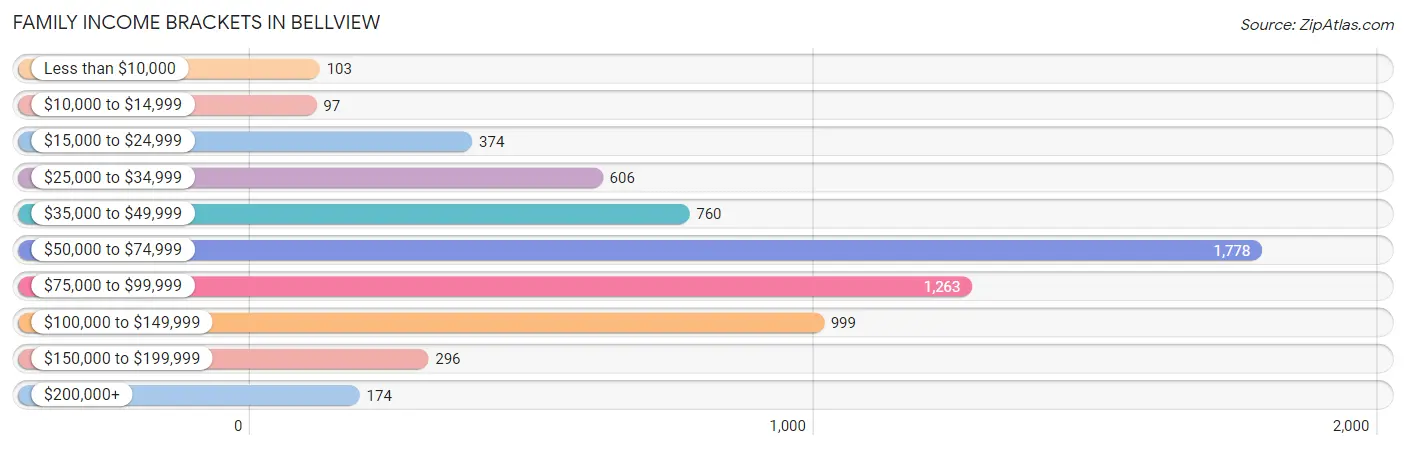
| Income Bracket | # Families | % Families |
| Less than $10,000 | 103 | 1.6% |
| $10,000 to $14,999 | 97 | 1.5% |
| $15,000 to $24,999 | 374 | 5.8% |
| $25,000 to $34,999 | 606 | 9.4% |
| $35,000 to $49,999 | 760 | 11.8% |
| $50,000 to $74,999 | 1,778 | 27.6% |
| $75,000 to $99,999 | 1,263 | 19.6% |
| $100,000 to $149,999 | 999 | 15.5% |
| $150,000 to $199,999 | 296 | 4.6% |
| $200,000+ | 174 | 2.7% |
Family Income by Famaliy Size in Bellview
7+ person families (22 | 0.3%) account for the highest median family income in Bellview with $140,208 per family, while 2-person families (3,454 | 53.6%) have the highest median income of $34,978 per family member.
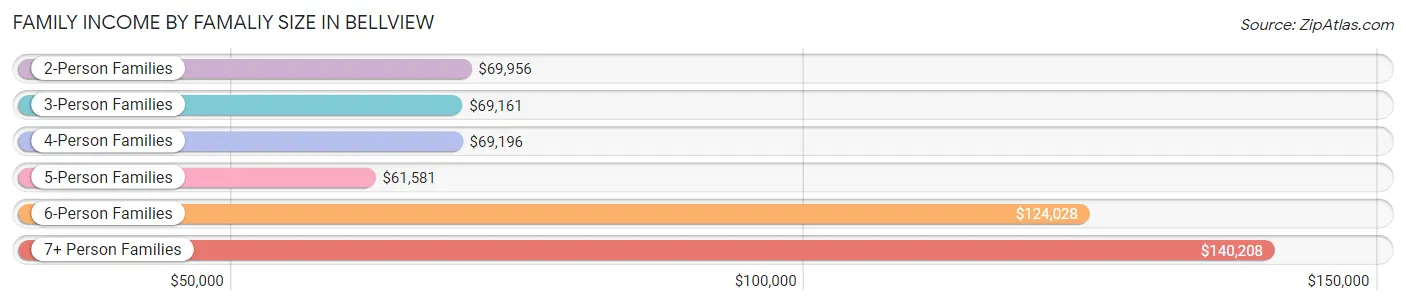
| Income Bracket | # Families | Median Income |
| 2-Person Families | 3,454 (53.6%) | $69,956 |
| 3-Person Families | 1,547 (24.0%) | $69,161 |
| 4-Person Families | 992 (15.4%) | $69,196 |
| 5-Person Families | 361 (5.6%) | $61,581 |
| 6-Person Families | 67 (1.0%) | $124,028 |
| 7+ Person Families | 22 (0.3%) | $140,208 |
| Total | 6,443 (100.0%) | $69,600 |
Family Income by Number of Earners in Bellview
The median family income in Bellview is $69,600, with families comprising 3+ earners (350) having the highest median family income of $134,722, while families with no earners (1,134) have the lowest median family income of $49,114, accounting for 5.4% and 17.6% of families, respectively.
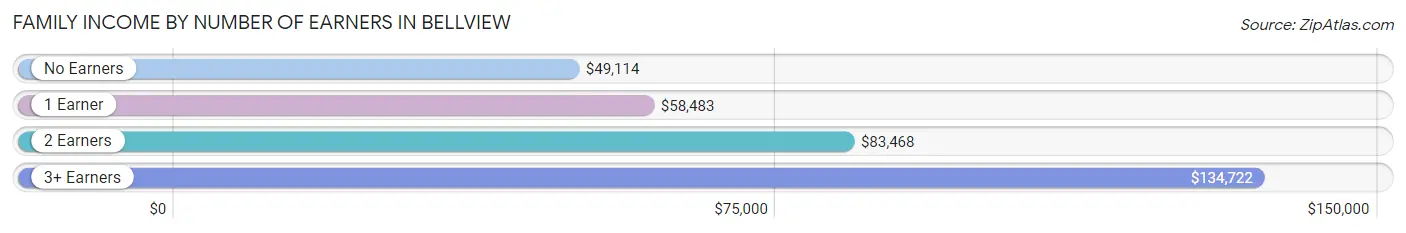
| Number of Earners | # Families | Median Income |
| No Earners | 1,134 (17.6%) | $49,114 |
| 1 Earner | 2,606 (40.5%) | $58,483 |
| 2 Earners | 2,353 (36.5%) | $83,468 |
| 3+ Earners | 350 (5.4%) | $134,722 |
| Total | 6,443 (100.0%) | $69,600 |
Household Income in Bellview
Household Income Brackets in Bellview
With 2,367 households falling in the category, the $50,000 to $74,999 income range is the most frequent in Bellview, accounting for 24.5% of all households. In contrast, only 213 households (2.2%) fall into the $200,000+ income bracket, making it the least populous group.
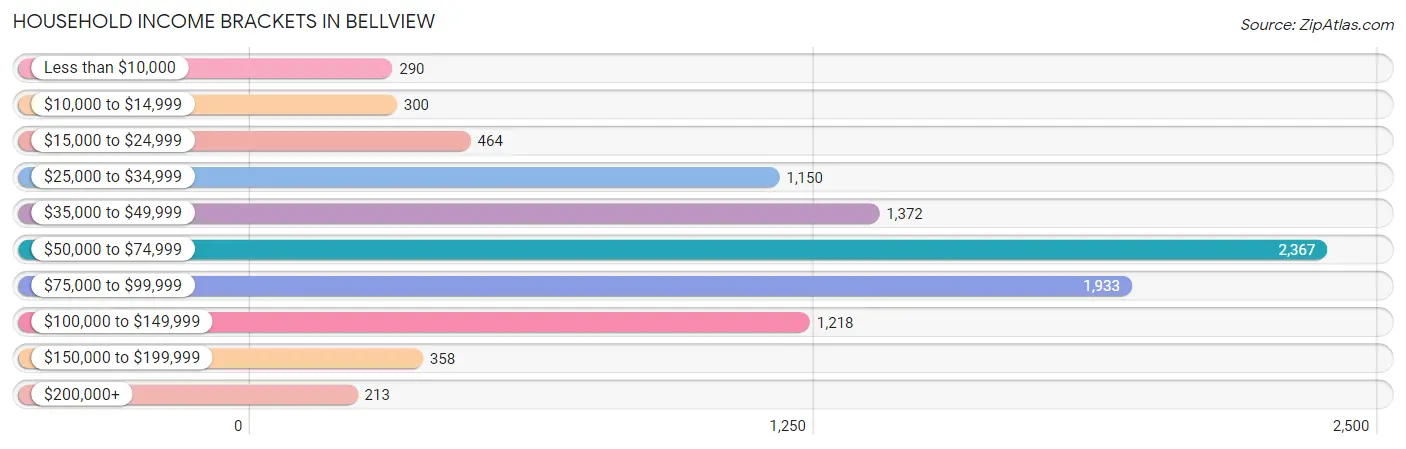
| Income Bracket | # Households | % Households |
| Less than $10,000 | 290 | 3.0% |
| $10,000 to $14,999 | 300 | 3.1% |
| $15,000 to $24,999 | 464 | 4.8% |
| $25,000 to $34,999 | 1,150 | 11.9% |
| $35,000 to $49,999 | 1,372 | 14.2% |
| $50,000 to $74,999 | 2,367 | 24.5% |
| $75,000 to $99,999 | 1,933 | 20.0% |
| $100,000 to $149,999 | 1,218 | 12.6% |
| $150,000 to $199,999 | 358 | 3.7% |
| $200,000+ | 213 | 2.2% |
Household Income by Householder Age in Bellview
The median household income in Bellview is $63,596, with the highest median household income of $77,059 found in the 15 to 24 years age bracket for the primary householder. A total of 452 households (4.7%) fall into this category. Meanwhile, the 65+ years age bracket for the primary householder has the lowest median household income of $58,133, with 2,881 households (29.8%) in this group.
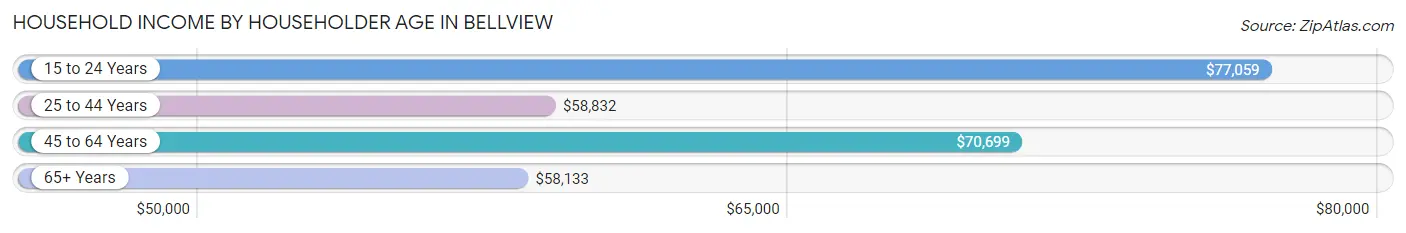
| Income Bracket | # Households | Median Income |
| 15 to 24 Years | 452 (4.7%) | $77,059 |
| 25 to 44 Years | 2,876 (29.8%) | $58,832 |
| 45 to 64 Years | 3,454 (35.7%) | $70,699 |
| 65+ Years | 2,881 (29.8%) | $58,133 |
| Total | 9,663 (100.0%) | $63,596 |
Poverty in Bellview
Income Below Poverty by Sex and Age in Bellview
With 10.4% poverty level for males and 17.1% for females among the residents of Bellview, 16 and 17 year old males and 15 year old females are the most vulnerable to poverty, with 115 males (59.3%) and 196 females (56.7%) in their respective age groups living below the poverty level.
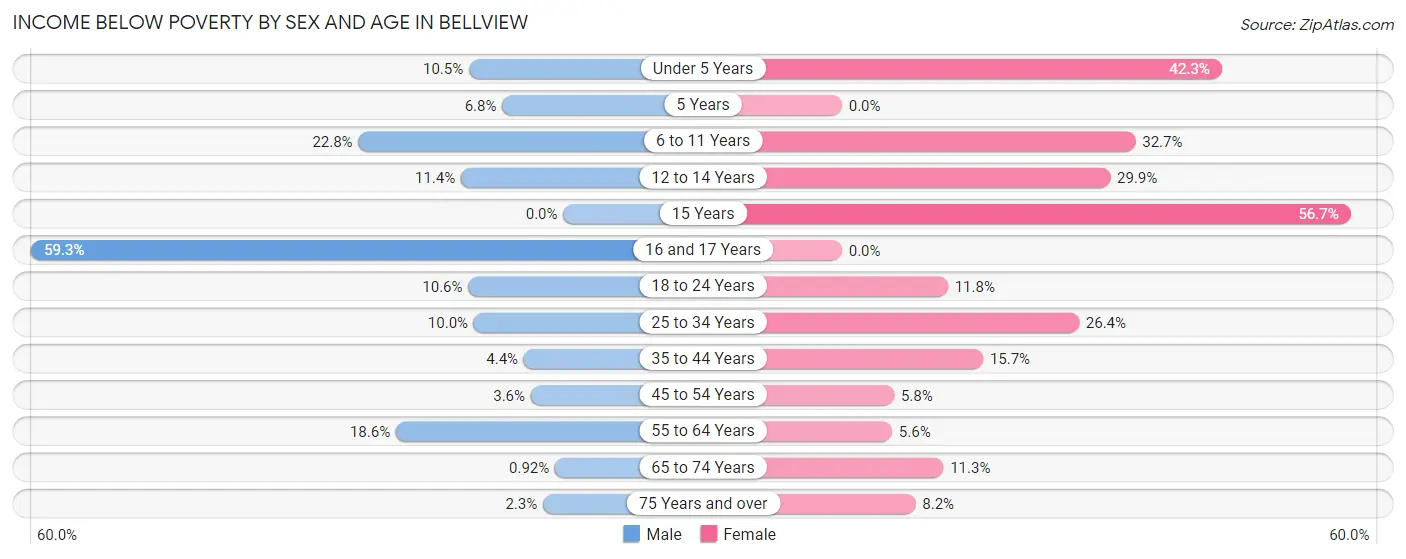
| Age Bracket | Male | Female |
| Under 5 Years | 119 (10.5%) | 283 (42.3%) |
| 5 Years | 10 (6.8%) | 0 (0.0%) |
| 6 to 11 Years | 173 (22.8%) | 239 (32.7%) |
| 12 to 14 Years | 41 (11.4%) | 150 (29.9%) |
| 15 Years | 0 (0.0%) | 196 (56.7%) |
| 16 and 17 Years | 115 (59.3%) | 0 (0.0%) |
| 18 to 24 Years | 91 (10.6%) | 99 (11.8%) |
| 25 to 34 Years | 184 (10.0%) | 552 (26.4%) |
| 35 to 44 Years | 39 (4.4%) | 243 (15.7%) |
| 45 to 54 Years | 50 (3.6%) | 79 (5.8%) |
| 55 to 64 Years | 313 (18.6%) | 101 (5.6%) |
| 65 to 74 Years | 9 (0.9%) | 138 (11.3%) |
| 75 Years and over | 19 (2.3%) | 106 (8.2%) |
| Total | 1,163 (10.4%) | 2,186 (17.1%) |
Income Above Poverty by Sex and Age in Bellview
According to the poverty statistics in Bellview, males aged 15 years and females aged 5 years are the age groups that are most secure financially, with 100.0% of males and 100.0% of females in these age groups living above the poverty line.
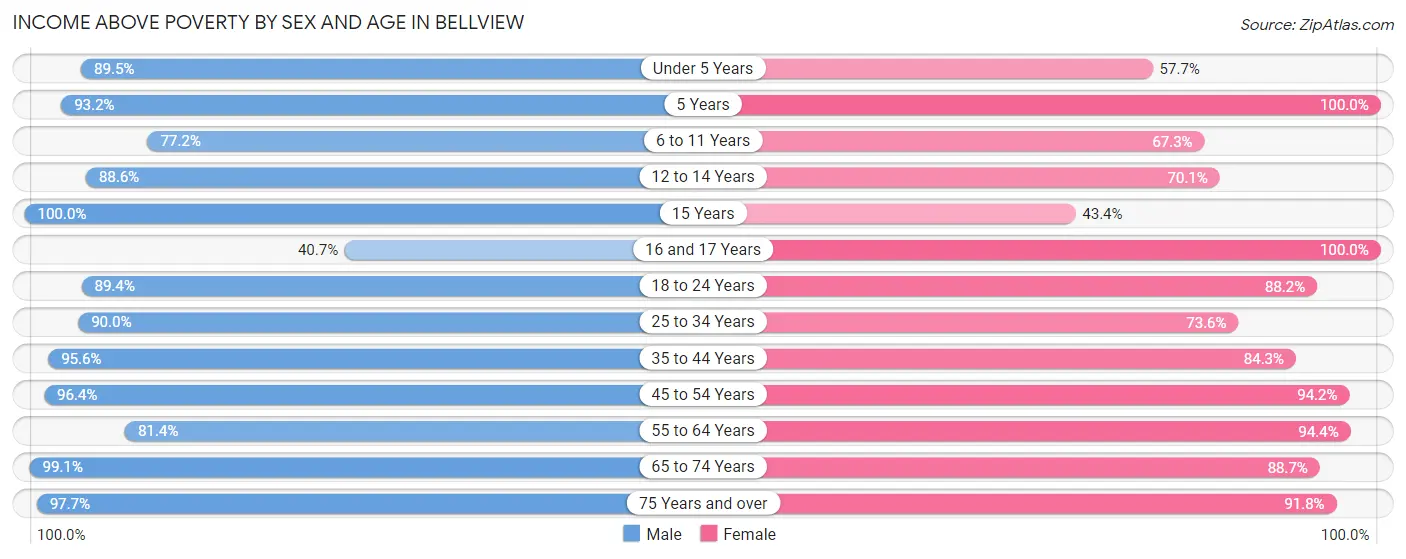
| Age Bracket | Male | Female |
| Under 5 Years | 1,014 (89.5%) | 386 (57.7%) |
| 5 Years | 137 (93.2%) | 219 (100.0%) |
| 6 to 11 Years | 585 (77.2%) | 492 (67.3%) |
| 12 to 14 Years | 319 (88.6%) | 352 (70.1%) |
| 15 Years | 70 (100.0%) | 150 (43.3%) |
| 16 and 17 Years | 79 (40.7%) | 187 (100.0%) |
| 18 to 24 Years | 769 (89.4%) | 740 (88.2%) |
| 25 to 34 Years | 1,664 (90.0%) | 1,539 (73.6%) |
| 35 to 44 Years | 849 (95.6%) | 1,303 (84.3%) |
| 45 to 54 Years | 1,330 (96.4%) | 1,280 (94.2%) |
| 55 to 64 Years | 1,366 (81.4%) | 1,710 (94.4%) |
| 65 to 74 Years | 972 (99.1%) | 1,083 (88.7%) |
| 75 Years and over | 821 (97.7%) | 1,188 (91.8%) |
| Total | 9,975 (89.6%) | 10,629 (82.9%) |
Income Below Poverty Among Married-Couple Families in Bellview
The poverty statistics for married-couple families in Bellview show that 4.6% or 181 of the total 3,955 families live below the poverty line. Families with no children have the highest poverty rate of 5.1%, comprising of 126 families. On the other hand, families with 3 or 4 children have the lowest poverty rate of 0.0%, which includes 0 families.
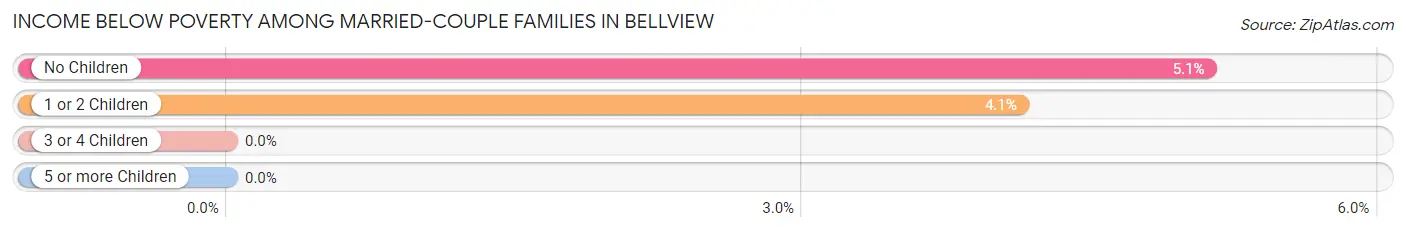
| Children | Above Poverty | Below Poverty |
| No Children | 2,339 (94.9%) | 126 (5.1%) |
| 1 or 2 Children | 1,276 (95.9%) | 55 (4.1%) |
| 3 or 4 Children | 159 (100.0%) | 0 (0.0%) |
| 5 or more Children | 0 (0.0%) | 0 (0.0%) |
| Total | 3,774 (95.4%) | 181 (4.6%) |
Income Below Poverty Among Single-Parent Households in Bellview
According to the poverty data in Bellview, 13.8% or 99 single-father households and 16.9% or 298 single-mother households are living below the poverty line. Among single-father households, those with 3 or 4 children have the highest poverty rate, with 85 households (100.0%) experiencing poverty. Likewise, among single-mother households, those with 3 or 4 children have the highest poverty rate, with 172 households (93.5%) falling below the poverty line.
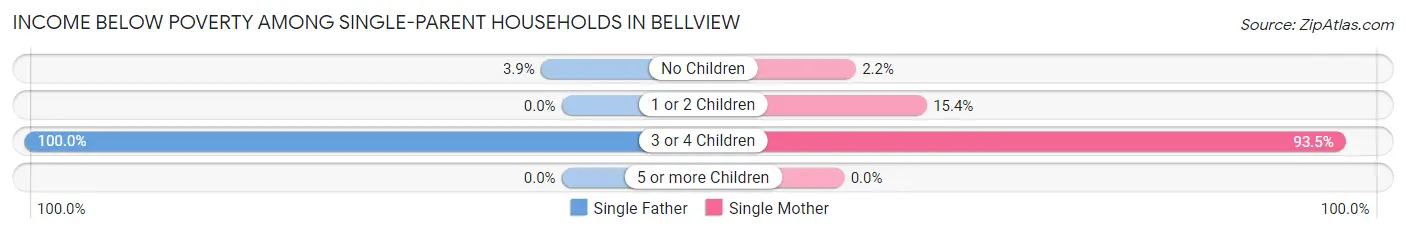
| Children | Single Father | Single Mother |
| No Children | 14 (3.9%) | 19 (2.1%) |
| 1 or 2 Children | 0 (0.0%) | 107 (15.4%) |
| 3 or 4 Children | 85 (100.0%) | 172 (93.5%) |
| 5 or more Children | 0 (0.0%) | 0 (0.0%) |
| Total | 99 (13.8%) | 298 (16.9%) |
Income Below Poverty Among Married-Couple vs Single-Parent Households in Bellview
The poverty data for Bellview shows that 181 of the married-couple family households (4.6%) and 397 of the single-parent households (16.0%) are living below the poverty level. Within the married-couple family households, those with no children have the highest poverty rate, with 126 households (5.1%) falling below the poverty line. Among the single-parent households, those with 3 or 4 children have the highest poverty rate, with 257 household (95.5%) living below poverty.
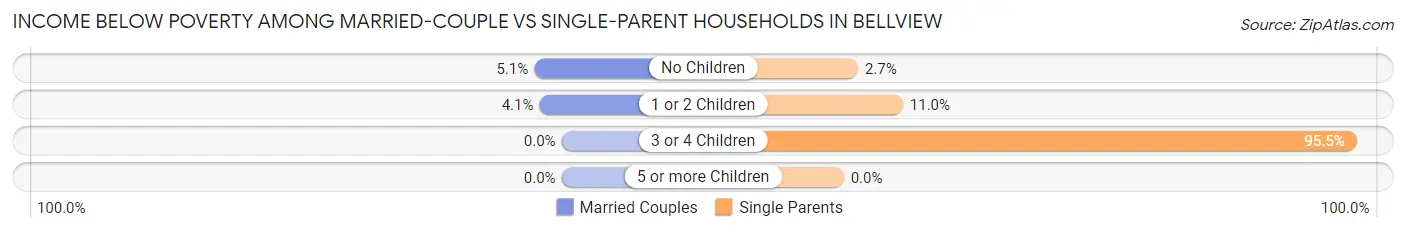
| Children | Married-Couple Families | Single-Parent Households |
| No Children | 126 (5.1%) | 33 (2.7%) |
| 1 or 2 Children | 55 (4.1%) | 107 (11.0%) |
| 3 or 4 Children | 0 (0.0%) | 257 (95.5%) |
| 5 or more Children | 0 (0.0%) | 0 (0.0%) |
| Total | 181 (4.6%) | 397 (16.0%) |
Race in Bellview
The most populous races in Bellview are White / Caucasian (15,212 | 63.3%), Black / African American (5,410 | 22.5%), and Two or more Races (2,144 | 8.9%).
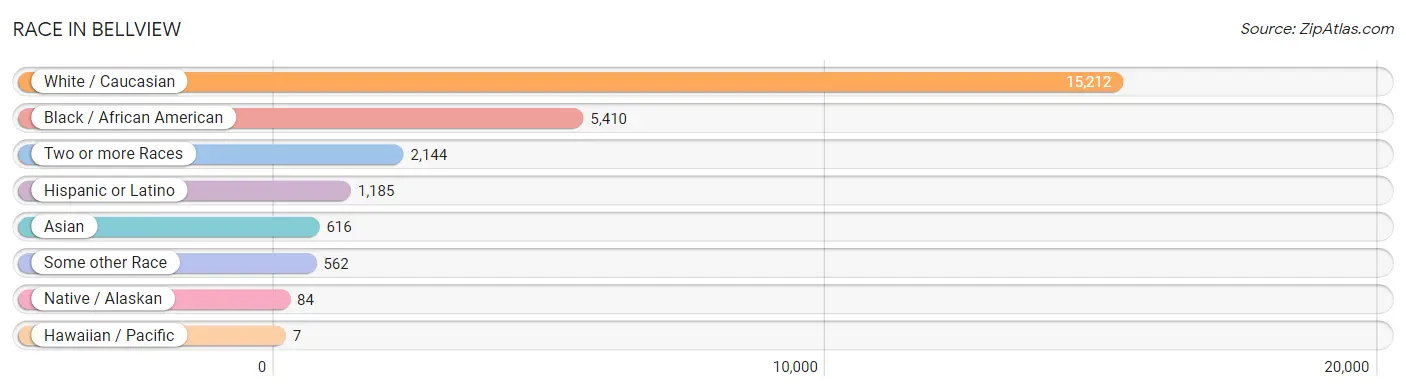
| Race | # Population | % Population |
| Asian | 616 | 2.6% |
| Black / African American | 5,410 | 22.5% |
| Hawaiian / Pacific | 7 | 0.0% |
| Hispanic or Latino | 1,185 | 4.9% |
| Native / Alaskan | 84 | 0.4% |
| White / Caucasian | 15,212 | 63.3% |
| Two or more Races | 2,144 | 8.9% |
| Some other Race | 562 | 2.3% |
| Total | 24,035 | 100.0% |
Ancestry in Bellview
The most populous ancestries reported in Bellview are German (2,783 | 11.6%), English (2,461 | 10.2%), Irish (2,085 | 8.7%), American (1,782 | 7.4%), and Korean (1,176 | 4.9%), together accounting for 42.8% of all Bellview residents.
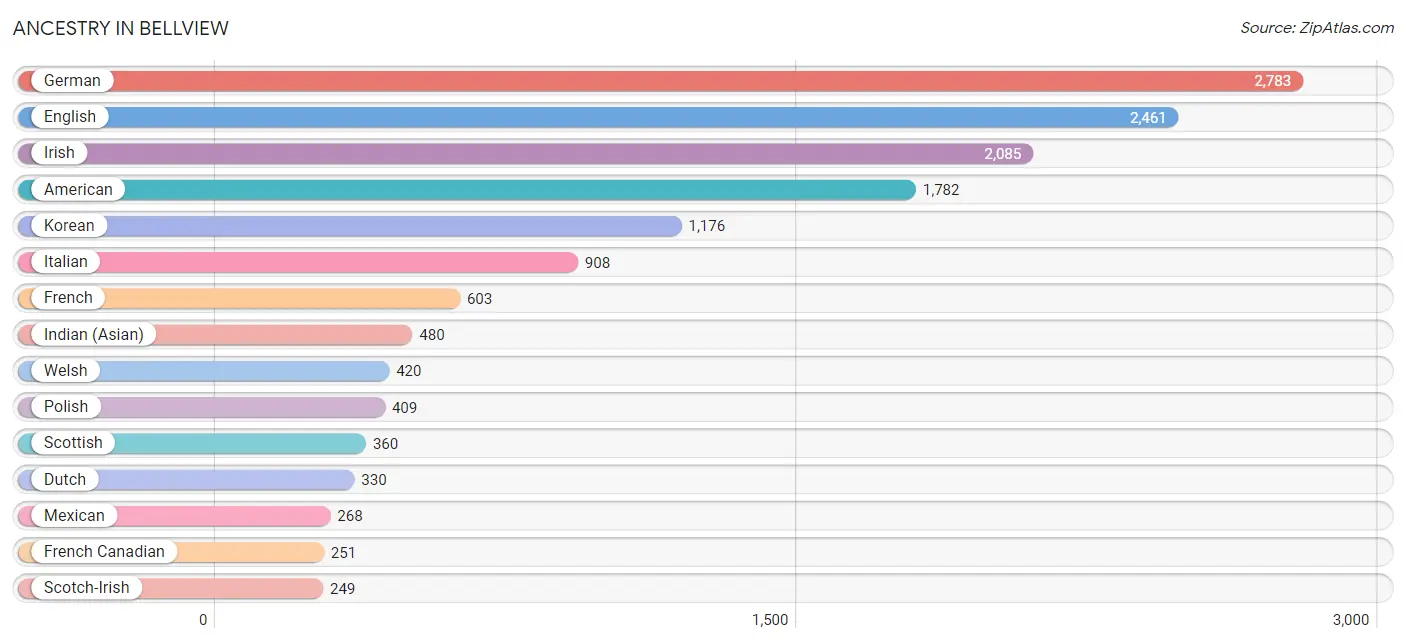
| Ancestry | # Population | % Population |
| African | 105 | 0.4% |
| American | 1,782 | 7.4% |
| Arab | 76 | 0.3% |
| Australian | 60 | 0.3% |
| Bangladeshi | 10 | 0.0% |
| Belgian | 34 | 0.1% |
| Bhutanese | 82 | 0.3% |
| Blackfeet | 48 | 0.2% |
| British | 126 | 0.5% |
| Burmese | 60 | 0.3% |
| Cajun | 25 | 0.1% |
| Cambodian | 10 | 0.0% |
| Canadian | 32 | 0.1% |
| Central American | 169 | 0.7% |
| Central American Indian | 28 | 0.1% |
| Cherokee | 69 | 0.3% |
| Chickasaw | 29 | 0.1% |
| Choctaw | 42 | 0.2% |
| Colombian | 85 | 0.4% |
| Creek | 80 | 0.3% |
| Cuban | 122 | 0.5% |
| Czech | 99 | 0.4% |
| Danish | 13 | 0.1% |
| Dominican | 17 | 0.1% |
| Dutch | 330 | 1.4% |
| Eastern European | 46 | 0.2% |
| English | 2,461 | 10.2% |
| European | 176 | 0.7% |
| Finnish | 54 | 0.2% |
| French | 603 | 2.5% |
| French Canadian | 251 | 1.0% |
| German | 2,783 | 11.6% |
| Greek | 46 | 0.2% |
| Guamanian / Chamorro | 7 | 0.0% |
| Guatemalan | 54 | 0.2% |
| Honduran | 115 | 0.5% |
| Hungarian | 53 | 0.2% |
| Indian (Asian) | 480 | 2.0% |
| Irish | 2,085 | 8.7% |
| Italian | 908 | 3.8% |
| Jamaican | 225 | 0.9% |
| Korean | 1,176 | 4.9% |
| Lebanese | 26 | 0.1% |
| Lithuanian | 35 | 0.2% |
| Macedonian | 19 | 0.1% |
| Mexican | 268 | 1.1% |
| Moroccan | 4 | 0.0% |
| Native Hawaiian | 7 | 0.0% |
| Northern European | 7 | 0.0% |
| Norwegian | 173 | 0.7% |
| Paraguayan | 18 | 0.1% |
| Pennsylvania German | 10 | 0.0% |
| Peruvian | 18 | 0.1% |
| Polish | 409 | 1.7% |
| Portuguese | 80 | 0.3% |
| Puerto Rican | 148 | 0.6% |
| Romanian | 9 | 0.0% |
| Russian | 111 | 0.5% |
| Samoan | 50 | 0.2% |
| Scandinavian | 52 | 0.2% |
| Scotch-Irish | 249 | 1.0% |
| Scottish | 360 | 1.5% |
| Serbian | 19 | 0.1% |
| Sioux | 5 | 0.0% |
| Slovene | 5 | 0.0% |
| South American | 165 | 0.7% |
| Spaniard | 227 | 0.9% |
| Spanish | 10 | 0.0% |
| Spanish American | 20 | 0.1% |
| Sri Lankan | 219 | 0.9% |
| Subsaharan African | 105 | 0.4% |
| Swedish | 144 | 0.6% |
| Swiss | 23 | 0.1% |
| Syrian | 46 | 0.2% |
| Thai | 12 | 0.1% |
| Ukrainian | 50 | 0.2% |
| Uruguayan | 29 | 0.1% |
| Venezuelan | 15 | 0.1% |
| Welsh | 420 | 1.8% |
| West Indian | 11 | 0.1% |
| Yugoslavian | 10 | 0.0% | View All 81 Rows |
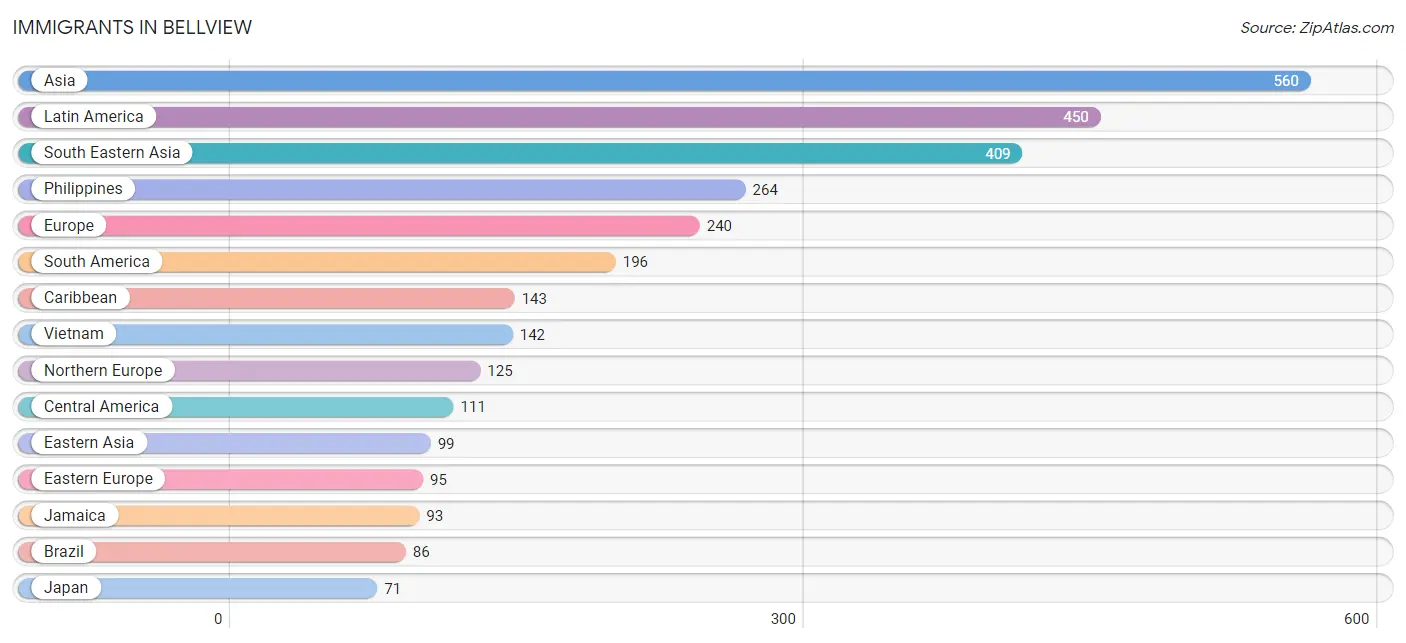
Immigrants in Bellview
The most numerous immigrant groups reported in Bellview came from Asia (560 | 2.3%), Latin America (450 | 1.9%), South Eastern Asia (409 | 1.7%), Philippines (264 | 1.1%), and Europe (240 | 1.0%), together accounting for 8.0% of all Bellview residents.
| Immigration Origin | # Population | % Population |
| Africa | 9 | 0.0% |
| Asia | 560 | 2.3% |
| Australia | 28 | 0.1% |
| Brazil | 86 | 0.4% |
| Canada | 16 | 0.1% |
| Caribbean | 143 | 0.6% |
| Central America | 111 | 0.5% |
| Colombia | 52 | 0.2% |
| Cuba | 50 | 0.2% |
| Eastern Africa | 9 | 0.0% |
| Eastern Asia | 99 | 0.4% |
| Eastern Europe | 95 | 0.4% |
| England | 14 | 0.1% |
| Ethiopia | 9 | 0.0% |
| Europe | 240 | 1.0% |
| France | 5 | 0.0% |
| Germany | 15 | 0.1% |
| Guatemala | 54 | 0.2% |
| Honduras | 57 | 0.2% |
| India | 52 | 0.2% |
| Ireland | 4 | 0.0% |
| Jamaica | 93 | 0.4% |
| Japan | 71 | 0.3% |
| Korea | 28 | 0.1% |
| Latin America | 450 | 1.9% |
| Malaysia | 3 | 0.0% |
| North Macedonia | 10 | 0.0% |
| Northern Europe | 125 | 0.5% |
| Oceania | 28 | 0.1% |
| Peru | 14 | 0.1% |
| Philippines | 264 | 1.1% |
| Russia | 35 | 0.2% |
| Scotland | 26 | 0.1% |
| South America | 196 | 0.8% |
| South Central Asia | 52 | 0.2% |
| South Eastern Asia | 409 | 1.7% |
| Ukraine | 50 | 0.2% |
| Uruguay | 29 | 0.1% |
| Venezuela | 15 | 0.1% |
| Vietnam | 142 | 0.6% |
| Western Europe | 20 | 0.1% | View All 41 Rows |
Sex and Age in Bellview
Sex and Age in Bellview
The most populous age groups in Bellview are Under 5 Years (1,175 | 10.5%) for men and 55 to 59 Years (1,091 | 8.5%) for women.
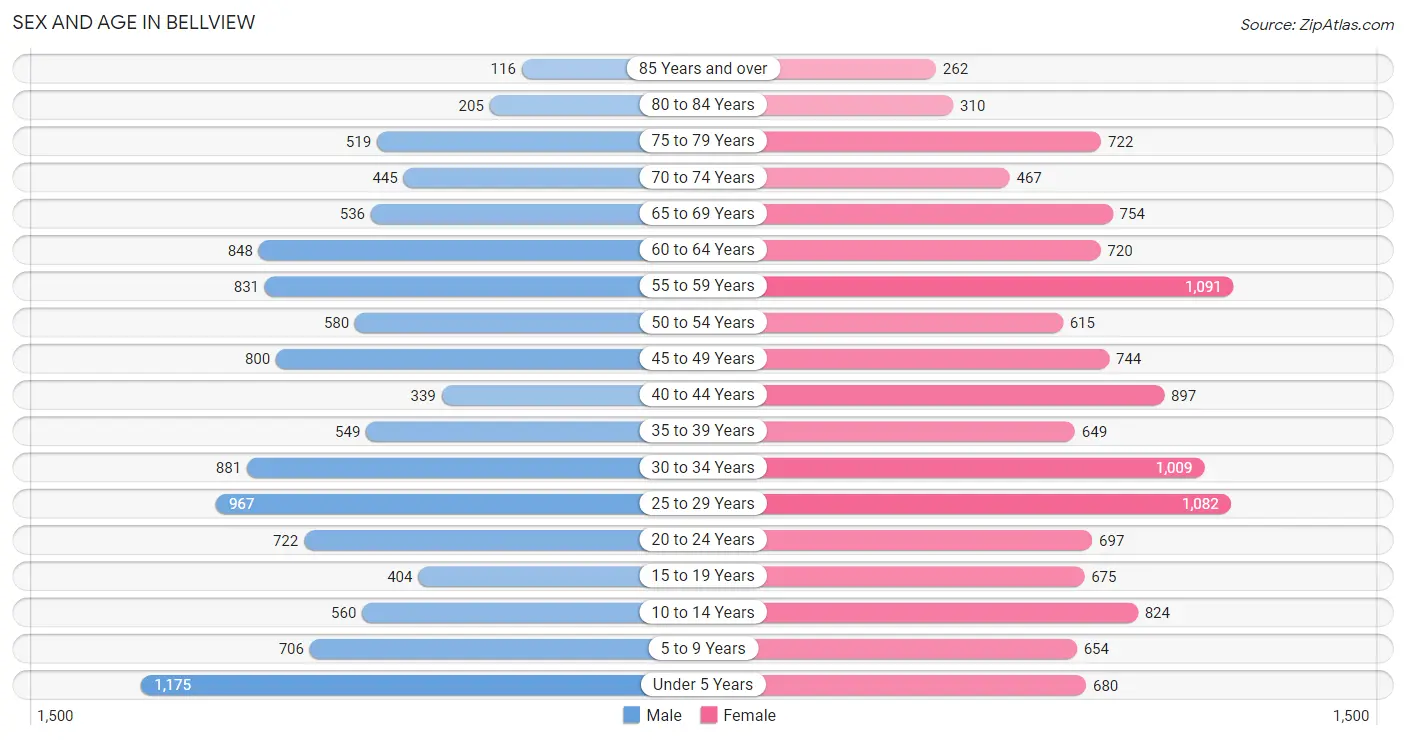
| Age Bracket | Male | Female |
| Under 5 Years | 1,175 (10.5%) | 680 (5.3%) |
| 5 to 9 Years | 706 (6.3%) | 654 (5.1%) |
| 10 to 14 Years | 560 (5.0%) | 824 (6.4%) |
| 15 to 19 Years | 404 (3.6%) | 675 (5.2%) |
| 20 to 24 Years | 722 (6.5%) | 697 (5.4%) |
| 25 to 29 Years | 967 (8.6%) | 1,082 (8.4%) |
| 30 to 34 Years | 881 (7.9%) | 1,009 (7.9%) |
| 35 to 39 Years | 549 (4.9%) | 649 (5.1%) |
| 40 to 44 Years | 339 (3.0%) | 897 (7.0%) |
| 45 to 49 Years | 800 (7.1%) | 744 (5.8%) |
| 50 to 54 Years | 580 (5.2%) | 615 (4.8%) |
| 55 to 59 Years | 831 (7.4%) | 1,091 (8.5%) |
| 60 to 64 Years | 848 (7.6%) | 720 (5.6%) |
| 65 to 69 Years | 536 (4.8%) | 754 (5.9%) |
| 70 to 74 Years | 445 (4.0%) | 467 (3.6%) |
| 75 to 79 Years | 519 (4.6%) | 722 (5.6%) |
| 80 to 84 Years | 205 (1.8%) | 310 (2.4%) |
| 85 Years and over | 116 (1.0%) | 262 (2.0%) |
| Total | 11,183 (100.0%) | 12,852 (100.0%) |
Families and Households in Bellview
Median Family Size in Bellview
The median family size in Bellview is 2.95 persons per family, with married-couple families (3,955 | 61.4%) accounting for the largest median family size of 3.02 persons per family. On the other hand, single male/father families (720 | 11.2%) represent the smallest median family size with 2.47 persons per family.
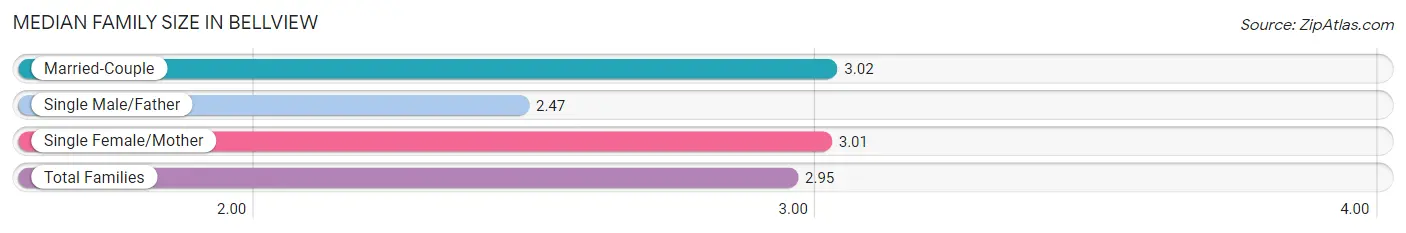
| Family Type | # Families | Family Size |
| Married-Couple | 3,955 (61.4%) | 3.02 |
| Single Male/Father | 720 (11.2%) | 2.47 |
| Single Female/Mother | 1,768 (27.4%) | 3.01 |
| Total Families | 6,443 (100.0%) | 2.95 |
Median Household Size in Bellview
The median household size in Bellview is 2.49 persons per household, with single female/mother households (1,768 | 18.3%) accounting for the largest median household size of 3.07 persons per household. non-family households (3,220 | 33.3%) represent the smallest median household size with 1.41 persons per household.
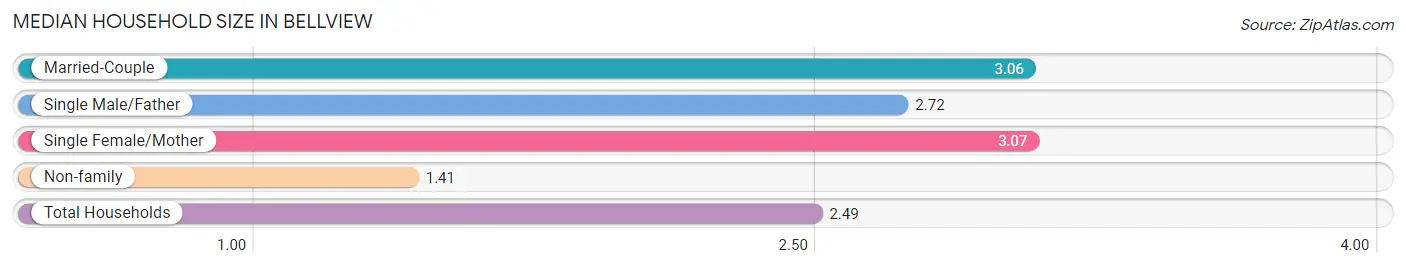
| Household Type | # Households | Household Size |
| Married-Couple | 3,955 (40.9%) | 3.06 |
| Single Male/Father | 720 (7.4%) | 2.72 |
| Single Female/Mother | 1,768 (18.3%) | 3.07 |
| Non-family | 3,220 (33.3%) | 1.41 |
| Total Households | 9,663 (100.0%) | 2.49 |
Household Size by Marriage Status in Bellview
Out of a total of 9,663 households in Bellview, 6,443 (66.7%) are family households, while 3,220 (33.3%) are nonfamily households. The most numerous type of family households are 2-person households, comprising 3,304, and the most common type of nonfamily households are 1-person households, comprising 2,288.
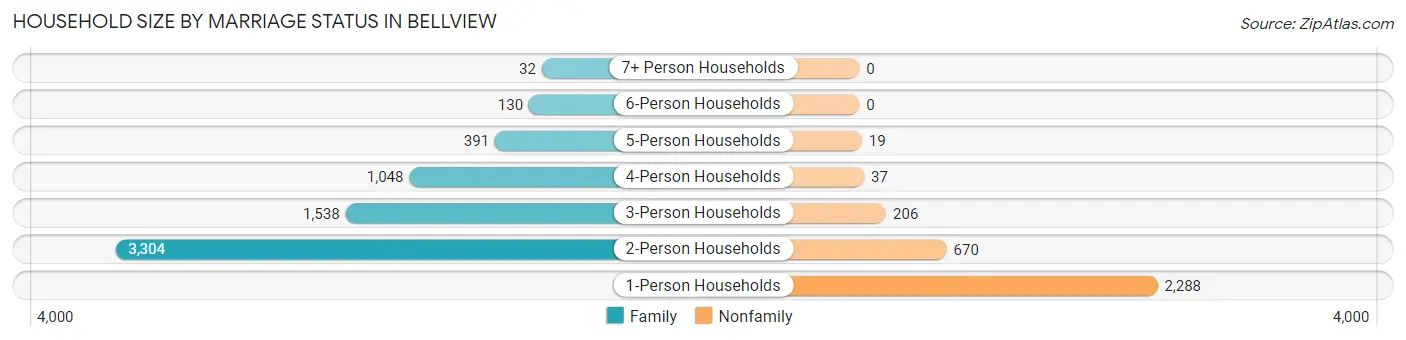
| Household Size | Family Households | Nonfamily Households |
| 1-Person Households | - | 2,288 (23.7%) |
| 2-Person Households | 3,304 (34.2%) | 670 (6.9%) |
| 3-Person Households | 1,538 (15.9%) | 206 (2.1%) |
| 4-Person Households | 1,048 (10.8%) | 37 (0.4%) |
| 5-Person Households | 391 (4.1%) | 19 (0.2%) |
| 6-Person Households | 130 (1.3%) | 0 (0.0%) |
| 7+ Person Households | 32 (0.3%) | 0 (0.0%) |
| Total | 6,443 (66.7%) | 3,220 (33.3%) |
Female Fertility in Bellview
Fertility by Age in Bellview
Average fertility rate in Bellview is 60.0 births per 1,000 women. Women in the age bracket of 20 to 34 years have the highest fertility rate with 115.0 births per 1,000 women. Women in the age bracket of 20 to 34 years acount for 90.7% of all women with births.
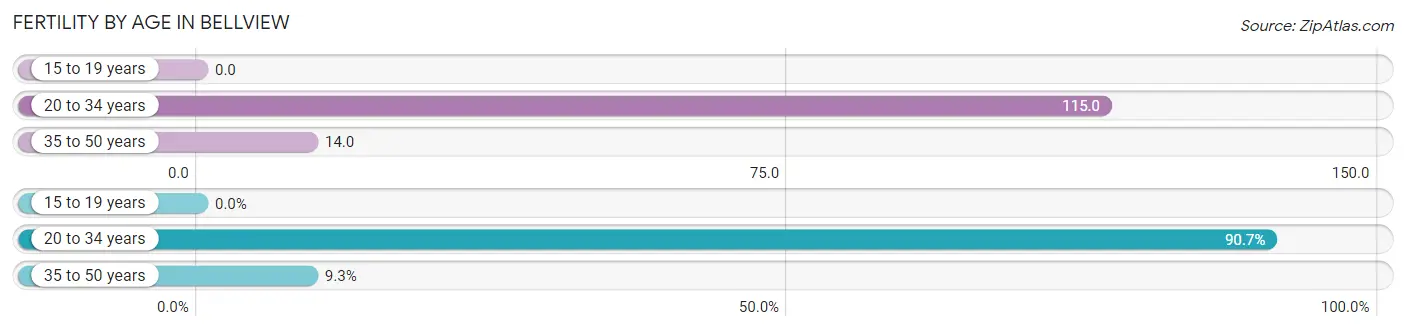
| Age Bracket | Women with Births | Births / 1,000 Women |
| 15 to 19 years | 0 (0.0%) | 0.0 |
| 20 to 34 years | 321 (90.7%) | 115.0 |
| 35 to 50 years | 33 (9.3%) | 14.0 |
| Total | 354 (100.0%) | 60.0 |
Fertility by Age by Marriage Status in Bellview
55.1% of women with births (354) in Bellview are married. The highest percentage of unmarried women with births falls into 20 to 34 years age bracket with 46.1% of them unmarried at the time of birth, while the lowest percentage of unmarried women with births belong to 35 to 50 years age bracket with 33.3% of them unmarried.
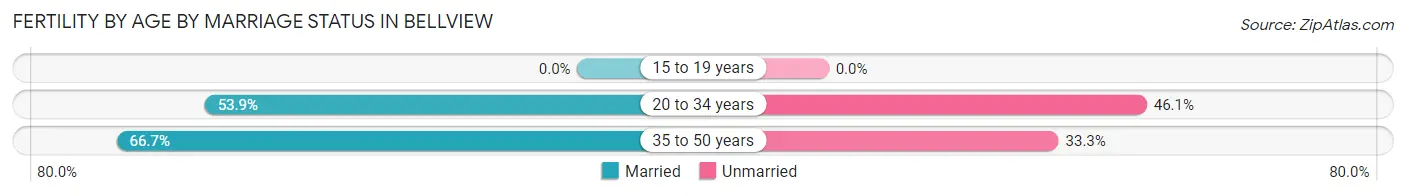
| Age Bracket | Married | Unmarried |
| 15 to 19 years | 0 (0.0%) | 0 (0.0%) |
| 20 to 34 years | 173 (53.9%) | 148 (46.1%) |
| 35 to 50 years | 22 (66.7%) | 11 (33.3%) |
| Total | 195 (55.1%) | 159 (44.9%) |
Fertility by Education in Bellview
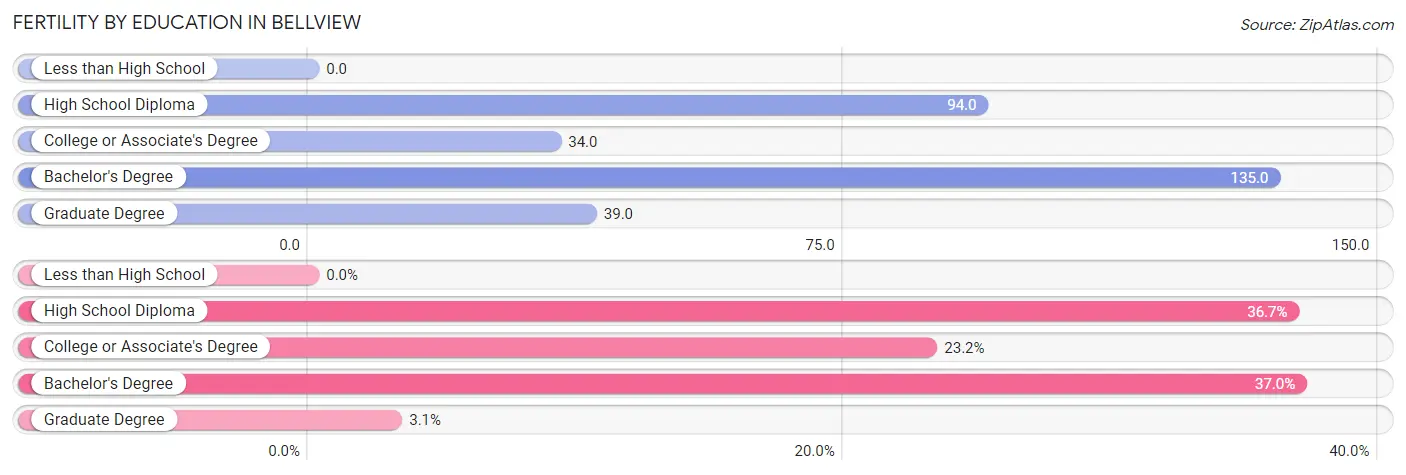
| Educational Attainment | Women with Births | Births / 1,000 Women |
| Less than High School | 0 (0.0%) | 0.0 |
| High School Diploma | 130 (36.7%) | 94.0 |
| College or Associate's Degree | 82 (23.2%) | 34.0 |
| Bachelor's Degree | 131 (37.0%) | 135.0 |
| Graduate Degree | 11 (3.1%) | 39.0 |
| Total | 354 (100.0%) | 60.0 |
Fertility by Education by Marriage Status in Bellview
44.9% of women with births in Bellview are unmarried. Women with the educational attainment of bachelor's degree are most likely to be married with 100.0% of them married at childbirth, while women with the educational attainment of graduate degree are least likely to be married with 100.0% of them unmarried at childbirth.
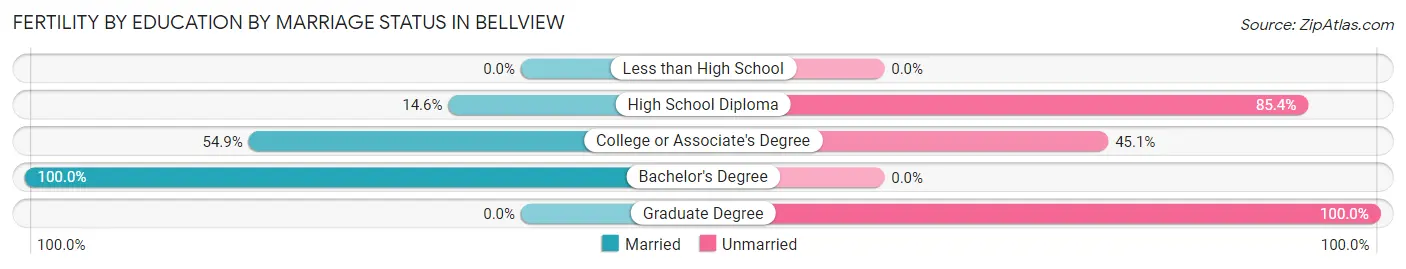
| Educational Attainment | Married | Unmarried |
| Less than High School | 0 (0.0%) | 0 (0.0%) |
| High School Diploma | 19 (14.6%) | 111 (85.4%) |
| College or Associate's Degree | 45 (54.9%) | 37 (45.1%) |
| Bachelor's Degree | 131 (100.0%) | 0 (0.0%) |
| Graduate Degree | 0 (0.0%) | 11 (100.0%) |
| Total | 195 (55.1%) | 159 (44.9%) |
Employment Characteristics in Bellview
Employment by Class of Employer in Bellview
Among the 10,866 employed individuals in Bellview, private company employees (7,001 | 64.4%), federal government employees (1,285 | 11.8%), and not-for-profit organizations (873 | 8.0%) make up the most common classes of employment.
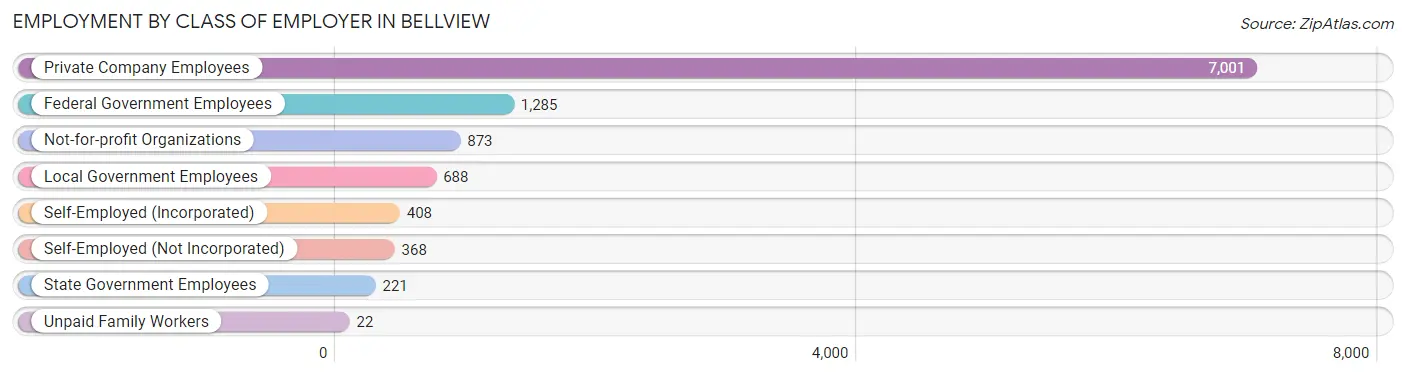
| Employer Class | # Employees | % Employees |
| Private Company Employees | 7,001 | 64.4% |
| Self-Employed (Incorporated) | 408 | 3.7% |
| Self-Employed (Not Incorporated) | 368 | 3.4% |
| Not-for-profit Organizations | 873 | 8.0% |
| Local Government Employees | 688 | 6.3% |
| State Government Employees | 221 | 2.0% |
| Federal Government Employees | 1,285 | 11.8% |
| Unpaid Family Workers | 22 | 0.2% |
| Total | 10,866 | 100.0% |
Employment Status by Age in Bellview
According to the labor force statistics for Bellview, out of the total population over 16 years of age (19,020), 61.8% or 11,754 individuals are in the labor force, with 5.5% or 646 of them unemployed. The age group with the highest labor force participation rate is 20 to 24 years, with 88.6% or 1,257 individuals in the labor force. Within the labor force, the 25 to 29 years age range has the highest percentage of unemployed individuals, with 13.0% or 212 of them being unemployed.
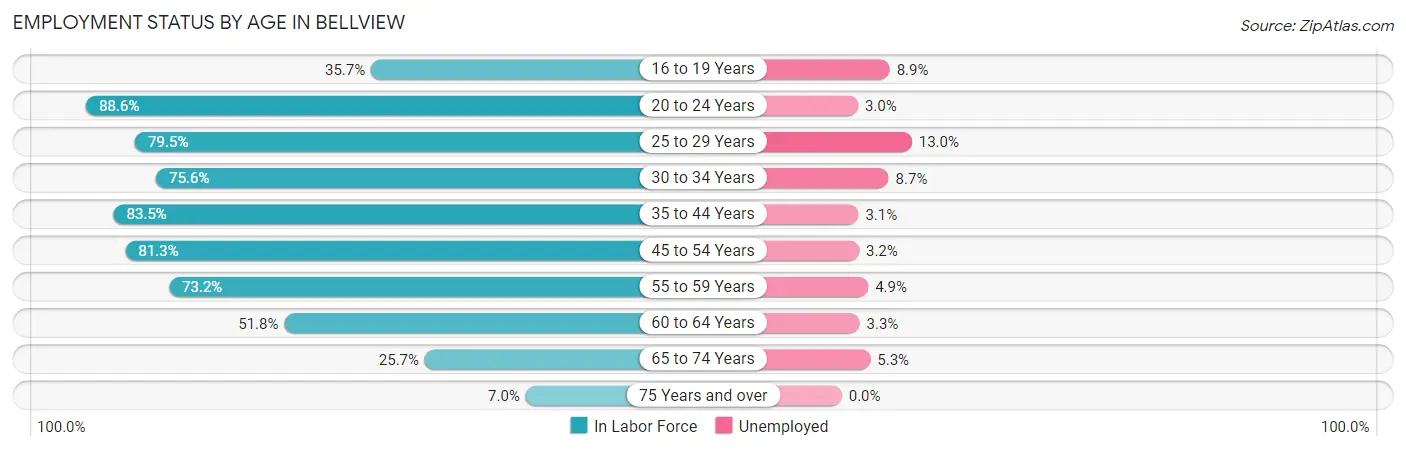
| Age Bracket | In Labor Force | Unemployed |
| 16 to 19 Years | 237 (35.7%) | 21 (8.9%) |
| 20 to 24 Years | 1,257 (88.6%) | 38 (3.0%) |
| 25 to 29 Years | 1,629 (79.5%) | 212 (13.0%) |
| 30 to 34 Years | 1,429 (75.6%) | 124 (8.7%) |
| 35 to 44 Years | 2,032 (83.5%) | 63 (3.1%) |
| 45 to 54 Years | 2,227 (81.3%) | 71 (3.2%) |
| 55 to 59 Years | 1,407 (73.2%) | 69 (4.9%) |
| 60 to 64 Years | 812 (51.8%) | 27 (3.3%) |
| 65 to 74 Years | 566 (25.7%) | 30 (5.3%) |
| 75 Years and over | 149 (7.0%) | 0 (0.0%) |
| Total | 11,754 (61.8%) | 646 (5.5%) |
Employment Status by Educational Attainment in Bellview
According to labor force statistics for Bellview, 75.7% of individuals (9,540) out of the total population between 25 and 64 years of age (12,602) are in the labor force, with 5.8% or 553 of them being unemployed. The group with the highest labor force participation rate are those with the educational attainment of bachelor's degree or higher, with 88.1% or 2,168 individuals in the labor force. Within the labor force, individuals with high school diploma education have the highest percentage of unemployment, with 8.9% or 221 of them being unemployed.

| Educational Attainment | In Labor Force | Unemployed |
| Less than High School | 428 (55.7%) | 52 (6.8%) |
| High School Diploma | 2,488 (63.4%) | 349 (8.9%) |
| College / Associate Degree | 4,452 (81.7%) | 311 (5.7%) |
| Bachelor's Degree or higher | 2,168 (88.1%) | 49 (2.0%) |
| Total | 9,540 (75.7%) | 731 (5.8%) |
Employment Occupations by Sex in Bellview
Management, Business, Science and Arts Occupations
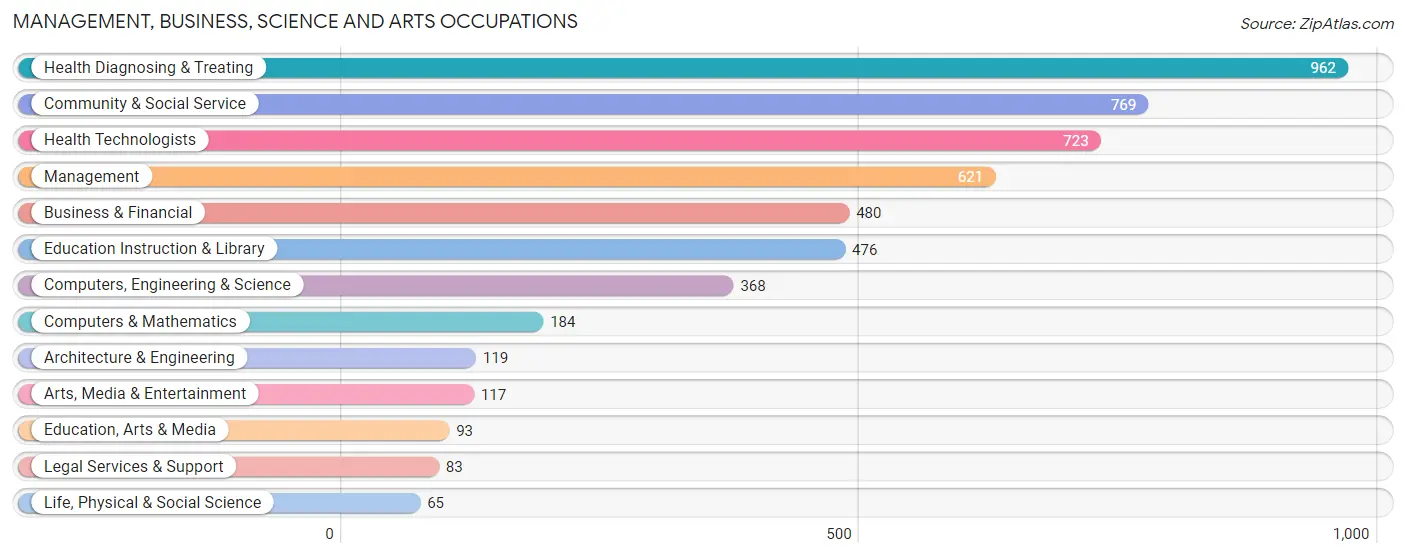
The most common Management, Business, Science and Arts occupations in Bellview are Health Diagnosing & Treating (962 | 9.1%), Community & Social Service (769 | 7.3%), Health Technologists (723 | 6.8%), Management (621 | 5.9%), and Business & Financial (480 | 4.5%).
Management, Business, Science and Arts Occupations by Sex
Within the Management, Business, Science and Arts occupations in Bellview, the most male-oriented occupations are Life, Physical & Social Science (93.9%), Architecture & Engineering (83.2%), and Computers, Engineering & Science (81.0%), while the most female-oriented occupations are Health Diagnosing & Treating (86.5%), Health Technologists (86.2%), and Education Instruction & Library (79.6%).
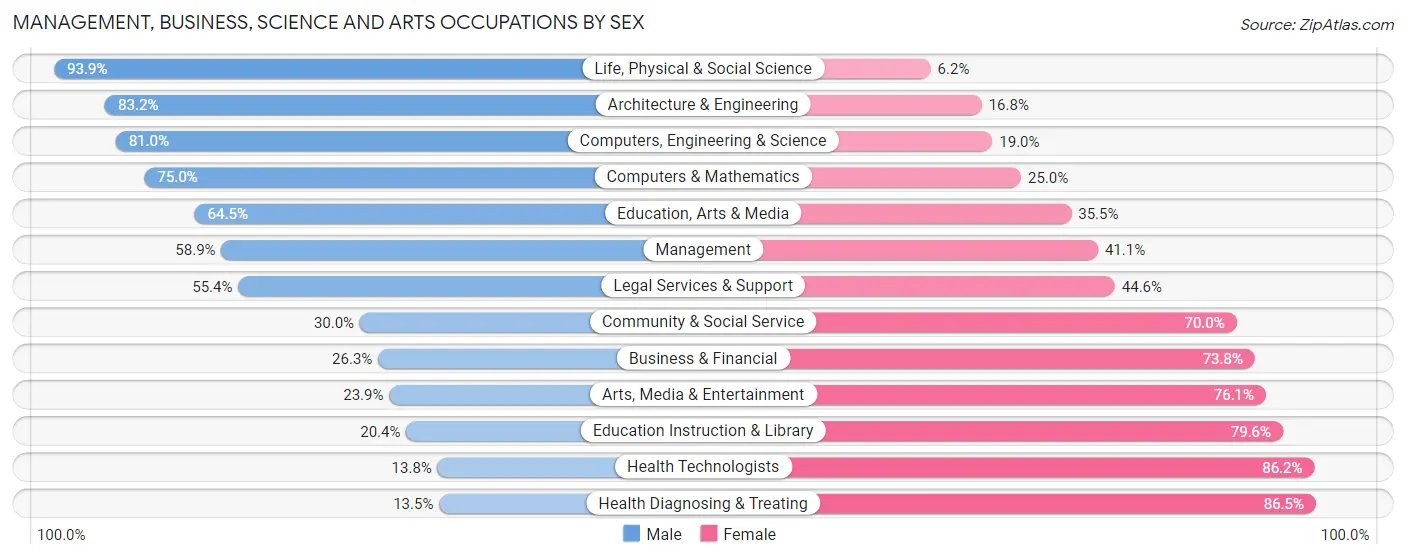
| Occupation | Male | Female |
| Management | 366 (58.9%) | 255 (41.1%) |
| Business & Financial | 126 (26.3%) | 354 (73.8%) |
| Computers, Engineering & Science | 298 (81.0%) | 70 (19.0%) |
| Computers & Mathematics | 138 (75.0%) | 46 (25.0%) |
| Architecture & Engineering | 99 (83.2%) | 20 (16.8%) |
| Life, Physical & Social Science | 61 (93.9%) | 4 (6.1%) |
| Community & Social Service | 231 (30.0%) | 538 (70.0%) |
| Education, Arts & Media | 60 (64.5%) | 33 (35.5%) |
| Legal Services & Support | 46 (55.4%) | 37 (44.6%) |
| Education Instruction & Library | 97 (20.4%) | 379 (79.6%) |
| Arts, Media & Entertainment | 28 (23.9%) | 89 (76.1%) |
| Health Diagnosing & Treating | 130 (13.5%) | 832 (86.5%) |
| Health Technologists | 100 (13.8%) | 623 (86.2%) |
| Total (Category) | 1,151 (36.0%) | 2,049 (64.0%) |
| Total (Overall) | 4,882 (46.2%) | 5,685 (53.8%) |
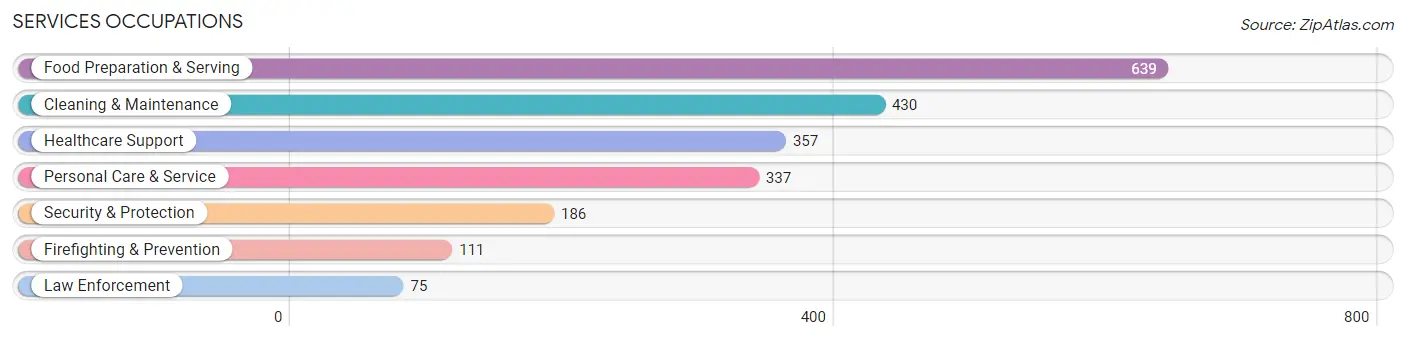
Services Occupations
The most common Services occupations in Bellview are Food Preparation & Serving (639 | 6.0%), Cleaning & Maintenance (430 | 4.1%), Healthcare Support (357 | 3.4%), Personal Care & Service (337 | 3.2%), and Security & Protection (186 | 1.8%).
Services Occupations by Sex
Within the Services occupations in Bellview, the most male-oriented occupations are Firefighting & Prevention (91.0%), Security & Protection (86.6%), and Law Enforcement (80.0%), while the most female-oriented occupations are Healthcare Support (86.6%), Personal Care & Service (64.4%), and Food Preparation & Serving (52.9%).
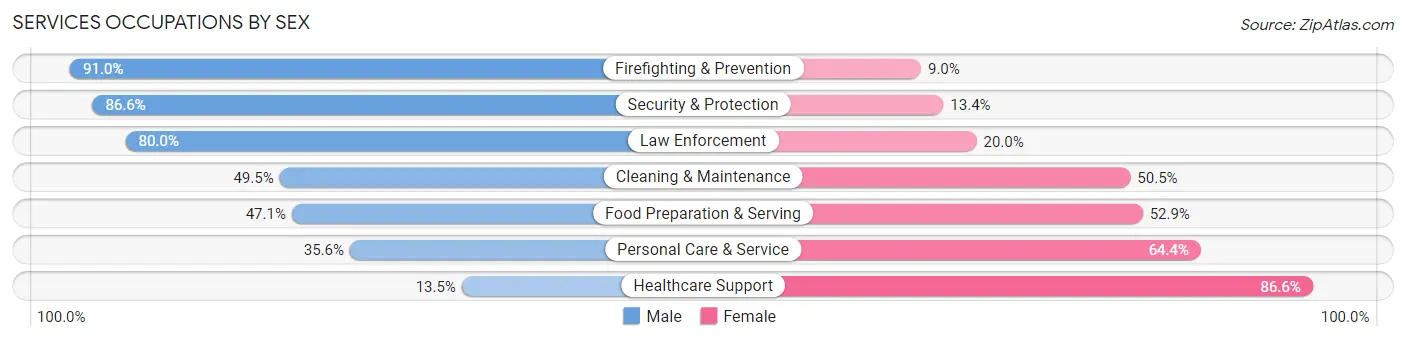
| Occupation | Male | Female |
| Healthcare Support | 48 (13.5%) | 309 (86.6%) |
| Security & Protection | 161 (86.6%) | 25 (13.4%) |
| Firefighting & Prevention | 101 (91.0%) | 10 (9.0%) |
| Law Enforcement | 60 (80.0%) | 15 (20.0%) |
| Food Preparation & Serving | 301 (47.1%) | 338 (52.9%) |
| Cleaning & Maintenance | 213 (49.5%) | 217 (50.5%) |
| Personal Care & Service | 120 (35.6%) | 217 (64.4%) |
| Total (Category) | 843 (43.2%) | 1,106 (56.8%) |
| Total (Overall) | 4,882 (46.2%) | 5,685 (53.8%) |
Sales and Office Occupations
The most common Sales and Office occupations in Bellview are Office & Administration (1,589 | 15.0%), and Sales & Related (1,249 | 11.8%).

Sales and Office Occupations by Sex

| Occupation | Male | Female |
| Sales & Related | 476 (38.1%) | 773 (61.9%) |
| Office & Administration | 371 (23.4%) | 1,218 (76.6%) |
| Total (Category) | 847 (29.8%) | 1,991 (70.2%) |
| Total (Overall) | 4,882 (46.2%) | 5,685 (53.8%) |
Natural Resources, Construction and Maintenance Occupations
The most common Natural Resources, Construction and Maintenance occupations in Bellview are Construction & Extraction (804 | 7.6%), Installation, Maintenance & Repair (400 | 3.8%), and Farming, Fishing & Forestry (35 | 0.3%).

Natural Resources, Construction and Maintenance Occupations by Sex

| Occupation | Male | Female |
| Farming, Fishing & Forestry | 35 (100.0%) | 0 (0.0%) |
| Construction & Extraction | 662 (82.3%) | 142 (17.7%) |
| Installation, Maintenance & Repair | 383 (95.8%) | 17 (4.3%) |
| Total (Category) | 1,080 (87.2%) | 159 (12.8%) |
| Total (Overall) | 4,882 (46.2%) | 5,685 (53.8%) |
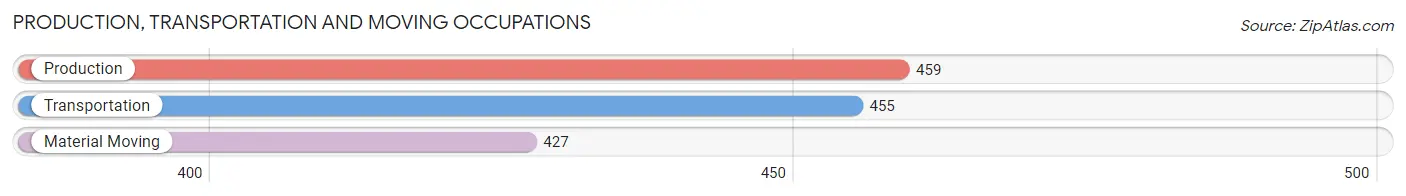
Production, Transportation and Moving Occupations
The most common Production, Transportation and Moving occupations in Bellview are Production (459 | 4.3%), Transportation (455 | 4.3%), and Material Moving (427 | 4.0%).
Production, Transportation and Moving Occupations by Sex

| Occupation | Male | Female |
| Production | 294 (64.0%) | 165 (35.9%) |
| Transportation | 404 (88.8%) | 51 (11.2%) |
| Material Moving | 263 (61.6%) | 164 (38.4%) |
| Total (Category) | 961 (71.7%) | 380 (28.3%) |
| Total (Overall) | 4,882 (46.2%) | 5,685 (53.8%) |
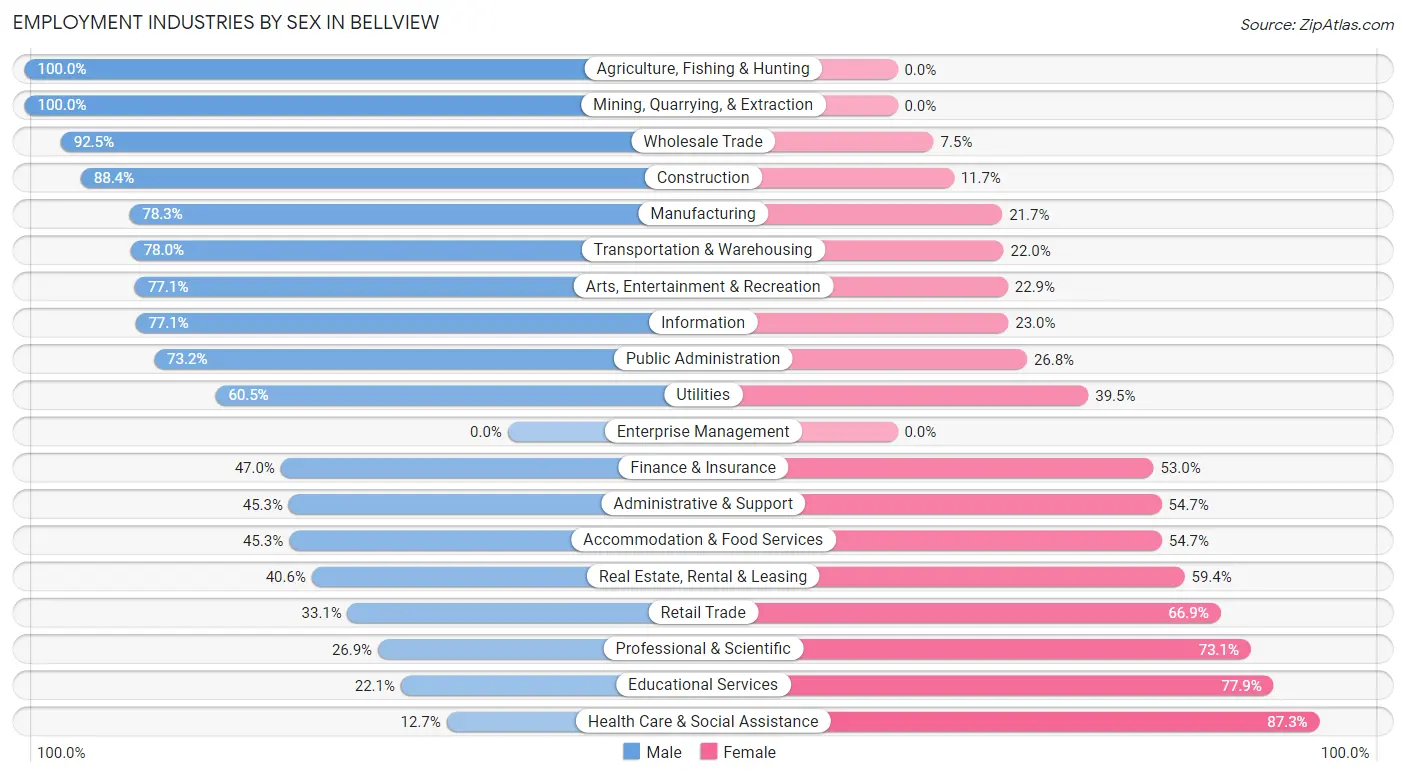
Employment Industries by Sex in Bellview
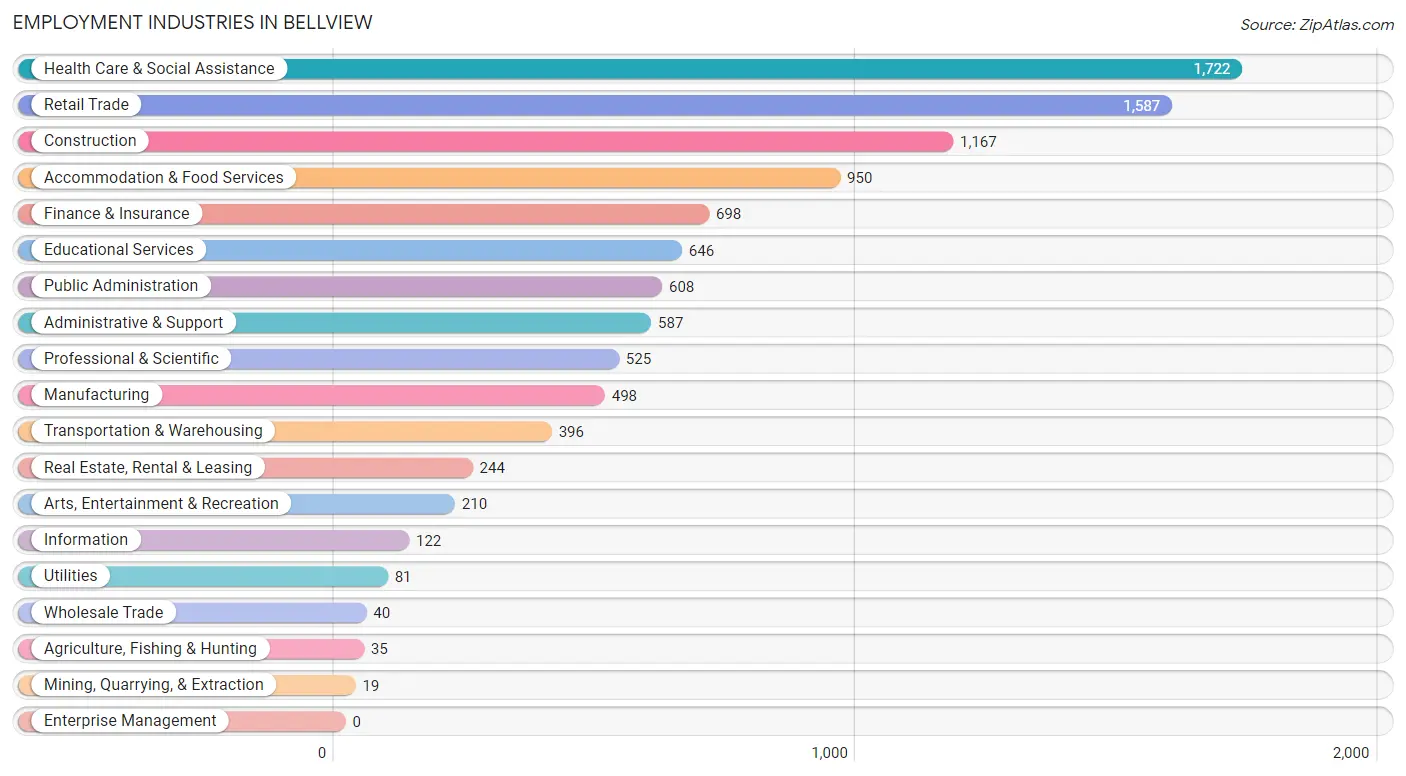
Employment Industries in Bellview
The major employment industries in Bellview include Health Care & Social Assistance (1,722 | 16.3%), Retail Trade (1,587 | 15.0%), Construction (1,167 | 11.0%), Accommodation & Food Services (950 | 9.0%), and Finance & Insurance (698 | 6.6%).
Employment Industries by Sex in Bellview
The Bellview industries that see more men than women are Agriculture, Fishing & Hunting (100.0%), Mining, Quarrying, & Extraction (100.0%), and Wholesale Trade (92.5%), whereas the industries that tend to have a higher number of women are Health Care & Social Assistance (87.3%), Educational Services (77.9%), and Professional & Scientific (73.1%).
| Industry | Male | Female |
| Agriculture, Fishing & Hunting | 35 (100.0%) | 0 (0.0%) |
| Mining, Quarrying, & Extraction | 19 (100.0%) | 0 (0.0%) |
| Construction | 1,031 (88.3%) | 136 (11.7%) |
| Manufacturing | 390 (78.3%) | 108 (21.7%) |
| Wholesale Trade | 37 (92.5%) | 3 (7.5%) |
| Retail Trade | 526 (33.1%) | 1,061 (66.9%) |
| Transportation & Warehousing | 309 (78.0%) | 87 (22.0%) |
| Utilities | 49 (60.5%) | 32 (39.5%) |
| Information | 94 (77.0%) | 28 (23.0%) |
| Finance & Insurance | 328 (47.0%) | 370 (53.0%) |
| Real Estate, Rental & Leasing | 99 (40.6%) | 145 (59.4%) |
| Professional & Scientific | 141 (26.9%) | 384 (73.1%) |
| Enterprise Management | 0 (0.0%) | 0 (0.0%) |
| Administrative & Support | 266 (45.3%) | 321 (54.7%) |
| Educational Services | 143 (22.1%) | 503 (77.9%) |
| Health Care & Social Assistance | 218 (12.7%) | 1,504 (87.3%) |
| Arts, Entertainment & Recreation | 162 (77.1%) | 48 (22.9%) |
| Accommodation & Food Services | 430 (45.3%) | 520 (54.7%) |
| Public Administration | 445 (73.2%) | 163 (26.8%) |
| Total | 4,882 (46.2%) | 5,685 (53.8%) |
Education in Bellview
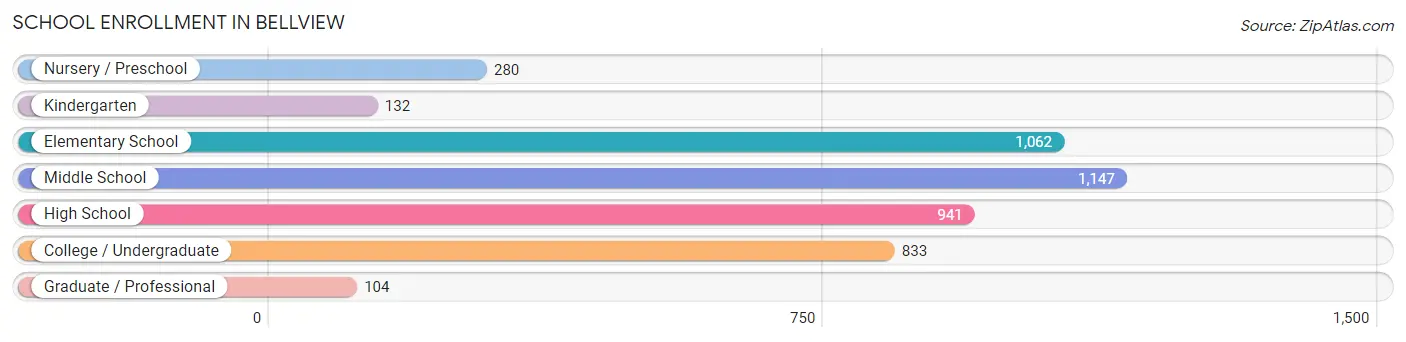
School Enrollment in Bellview
The most common levels of schooling among the 4,499 students in Bellview are middle school (1,147 | 25.5%), elementary school (1,062 | 23.6%), and high school (941 | 20.9%).
| School Level | # Students | % Students |
| Nursery / Preschool | 280 | 6.2% |
| Kindergarten | 132 | 2.9% |
| Elementary School | 1,062 | 23.6% |
| Middle School | 1,147 | 25.5% |
| High School | 941 | 20.9% |
| College / Undergraduate | 833 | 18.5% |
| Graduate / Professional | 104 | 2.3% |
| Total | 4,499 | 100.0% |
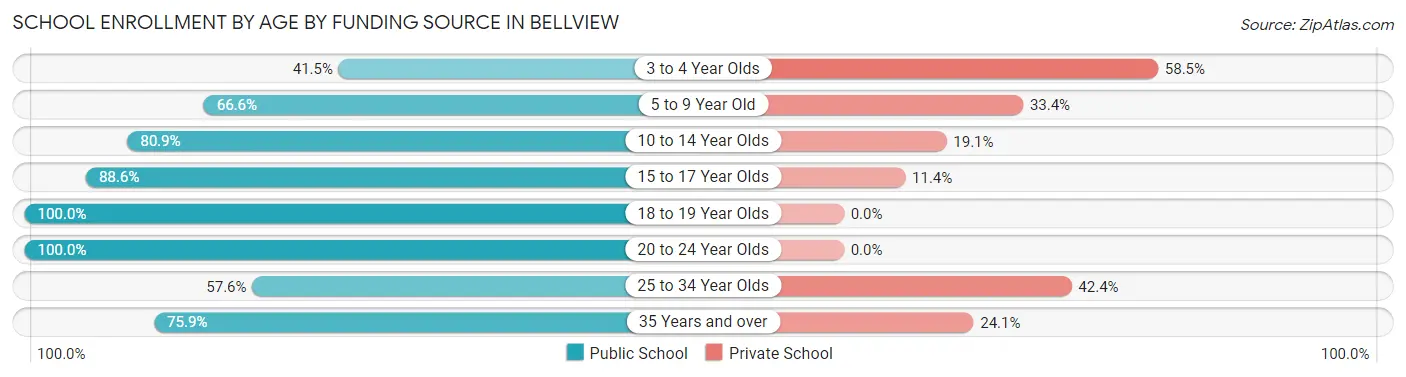
School Enrollment by Age by Funding Source in Bellview
Out of a total of 4,499 students who are enrolled in schools in Bellview, 1,044 (23.2%) attend a private institution, while the remaining 3,455 (76.8%) are enrolled in public schools. The age group of 3 to 4 year olds has the highest likelihood of being enrolled in private schools, with 103 (58.5% in the age bracket) enrolled. Conversely, the age group of 18 to 19 year olds has the lowest likelihood of being enrolled in a private school, with 76 (100.0% in the age bracket) attending a public institution.
| Age Bracket | Public School | Private School |
| 3 to 4 Year Olds | 73 (41.5%) | 103 (58.5%) |
| 5 to 9 Year Old | 776 (66.6%) | 389 (33.4%) |
| 10 to 14 Year Olds | 1,116 (80.9%) | 264 (19.1%) |
| 15 to 17 Year Olds | 697 (88.6%) | 90 (11.4%) |
| 18 to 19 Year Olds | 76 (100.0%) | 0 (0.0%) |
| 20 to 24 Year Olds | 381 (100.0%) | 0 (0.0%) |
| 25 to 34 Year Olds | 224 (57.6%) | 165 (42.4%) |
| 35 Years and over | 110 (75.9%) | 35 (24.1%) |
| Total | 3,455 (76.8%) | 1,044 (23.2%) |
Educational Attainment by Field of Study in Bellview
Business (588 | 18.2%), arts & humanities (426 | 13.2%), education (422 | 13.1%), science & technology (370 | 11.5%), and liberal arts & history (265 | 8.2%) are the most common fields of study among 3,222 individuals in Bellview who have obtained a bachelor's degree or higher.
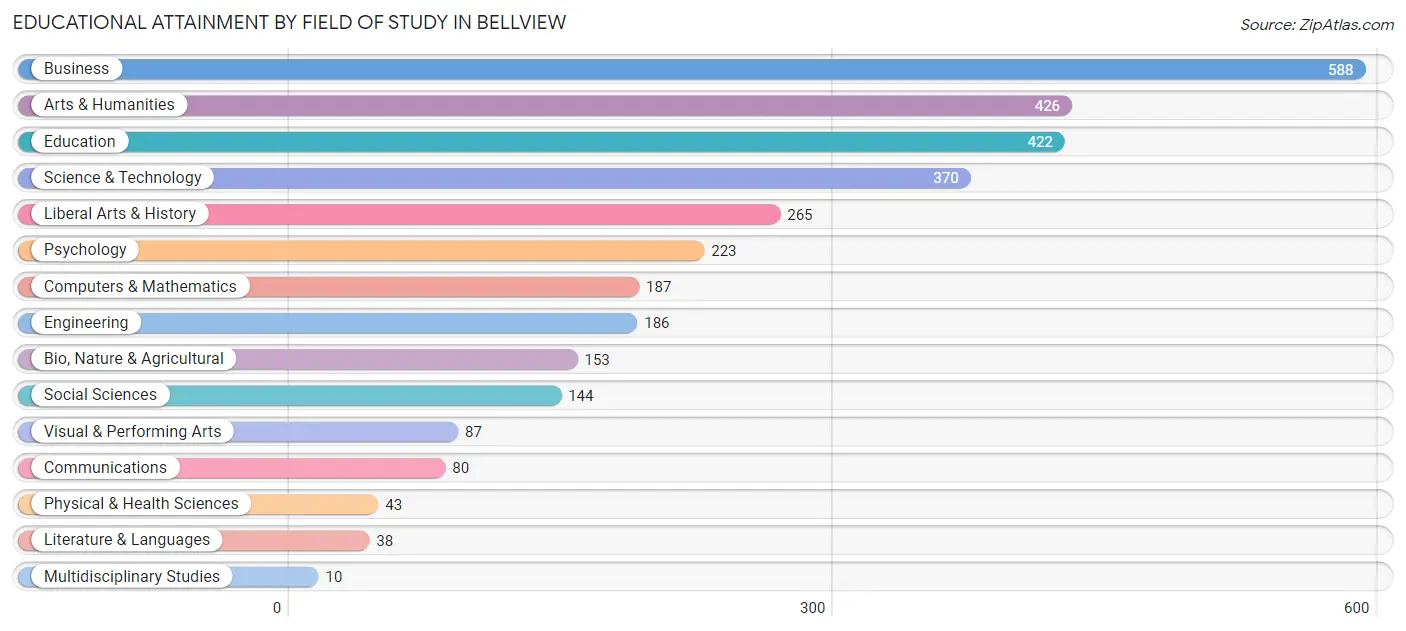
| Field of Study | # Graduates | % Graduates |
| Computers & Mathematics | 187 | 5.8% |
| Bio, Nature & Agricultural | 153 | 4.8% |
| Physical & Health Sciences | 43 | 1.3% |
| Psychology | 223 | 6.9% |
| Social Sciences | 144 | 4.5% |
| Engineering | 186 | 5.8% |
| Multidisciplinary Studies | 10 | 0.3% |
| Science & Technology | 370 | 11.5% |
| Business | 588 | 18.2% |
| Education | 422 | 13.1% |
| Literature & Languages | 38 | 1.2% |
| Liberal Arts & History | 265 | 8.2% |
| Visual & Performing Arts | 87 | 2.7% |
| Communications | 80 | 2.5% |
| Arts & Humanities | 426 | 13.2% |
| Total | 3,222 | 100.0% |
Transportation & Commute in Bellview
Vehicle Availability by Sex in Bellview
The most prevalent vehicle ownership categories in Bellview are males with 2 vehicles (2,406, accounting for 46.3%) and females with 2 vehicles (2,613, making up 42.5%).
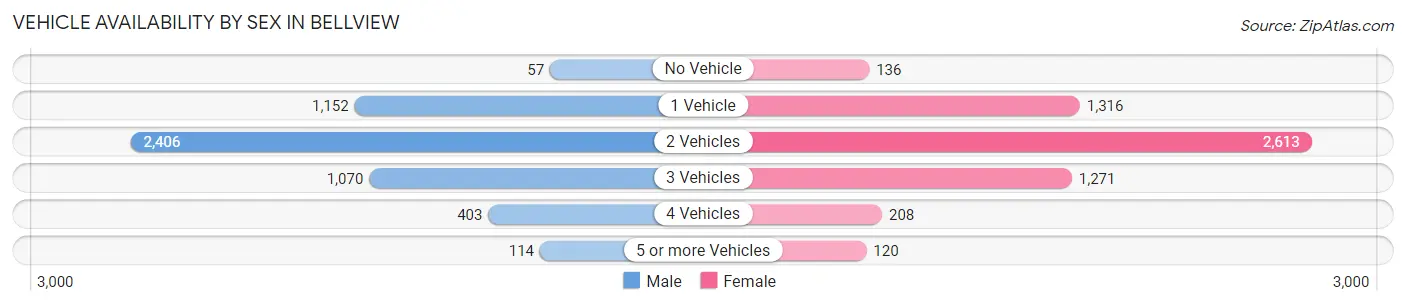
| Vehicles Available | Male | Female |
| No Vehicle | 57 (1.1%) | 136 (2.4%) |
| 1 Vehicle | 1,152 (22.2%) | 1,316 (23.2%) |
| 2 Vehicles | 2,406 (46.3%) | 2,613 (46.1%) |
| 3 Vehicles | 1,070 (20.6%) | 1,271 (22.4%) |
| 4 Vehicles | 403 (7.7%) | 208 (3.7%) |
| 5 or more Vehicles | 114 (2.2%) | 120 (2.1%) |
| Total | 5,202 (100.0%) | 5,664 (100.0%) |
Commute Time in Bellview
The most frequently occuring commute durations in Bellview are 15 to 19 minutes (3,034 commuters, 29.8%), 20 to 24 minutes (2,133 commuters, 21.0%), and 30 to 34 minutes (1,363 commuters, 13.4%).
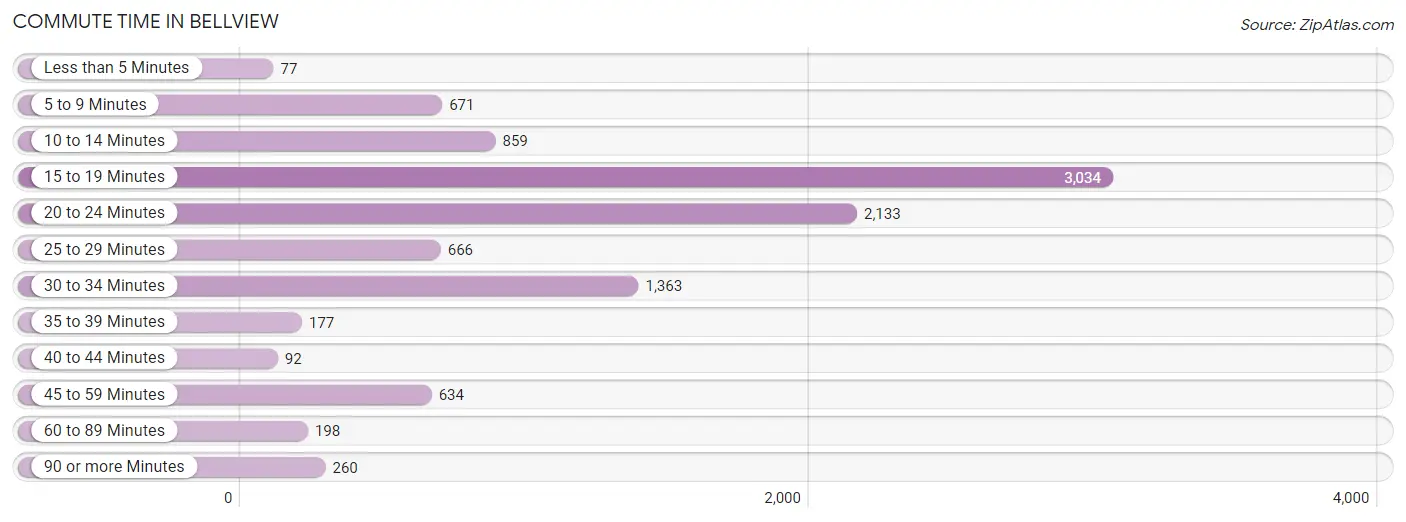
| Commute Time | # Commuters | % Commuters |
| Less than 5 Minutes | 77 | 0.8% |
| 5 to 9 Minutes | 671 | 6.6% |
| 10 to 14 Minutes | 859 | 8.5% |
| 15 to 19 Minutes | 3,034 | 29.8% |
| 20 to 24 Minutes | 2,133 | 21.0% |
| 25 to 29 Minutes | 666 | 6.6% |
| 30 to 34 Minutes | 1,363 | 13.4% |
| 35 to 39 Minutes | 177 | 1.7% |
| 40 to 44 Minutes | 92 | 0.9% |
| 45 to 59 Minutes | 634 | 6.2% |
| 60 to 89 Minutes | 198 | 1.9% |
| 90 or more Minutes | 260 | 2.6% |
Commute Time by Sex in Bellview
The most common commute times in Bellview are 15 to 19 minutes (1,249 commuters, 24.8%) for males and 15 to 19 minutes (1,785 commuters, 34.8%) for females.
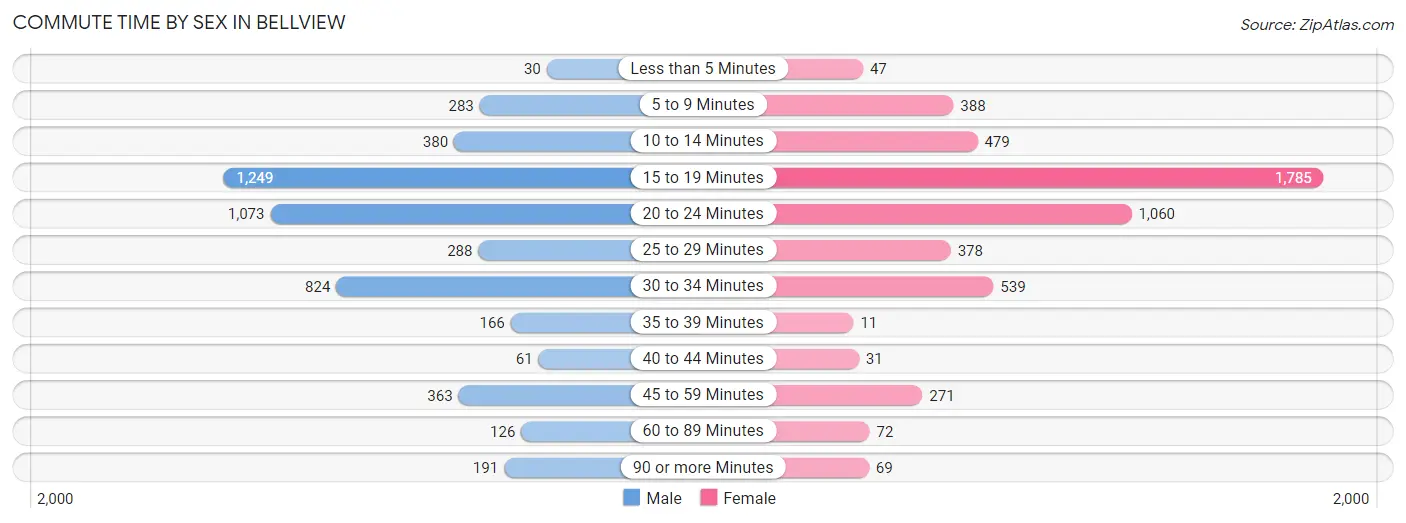
| Commute Time | Male | Female |
| Less than 5 Minutes | 30 (0.6%) | 47 (0.9%) |
| 5 to 9 Minutes | 283 (5.6%) | 388 (7.6%) |
| 10 to 14 Minutes | 380 (7.5%) | 479 (9.3%) |
| 15 to 19 Minutes | 1,249 (24.8%) | 1,785 (34.8%) |
| 20 to 24 Minutes | 1,073 (21.3%) | 1,060 (20.7%) |
| 25 to 29 Minutes | 288 (5.7%) | 378 (7.4%) |
| 30 to 34 Minutes | 824 (16.4%) | 539 (10.5%) |
| 35 to 39 Minutes | 166 (3.3%) | 11 (0.2%) |
| 40 to 44 Minutes | 61 (1.2%) | 31 (0.6%) |
| 45 to 59 Minutes | 363 (7.2%) | 271 (5.3%) |
| 60 to 89 Minutes | 126 (2.5%) | 72 (1.4%) |
| 90 or more Minutes | 191 (3.8%) | 69 (1.3%) |
Time of Departure to Work by Sex in Bellview
The most frequent times of departure to work in Bellview are 6:30 AM to 6:59 AM (867, 17.2%) for males and 6:30 AM to 6:59 AM (1,279, 24.9%) for females.
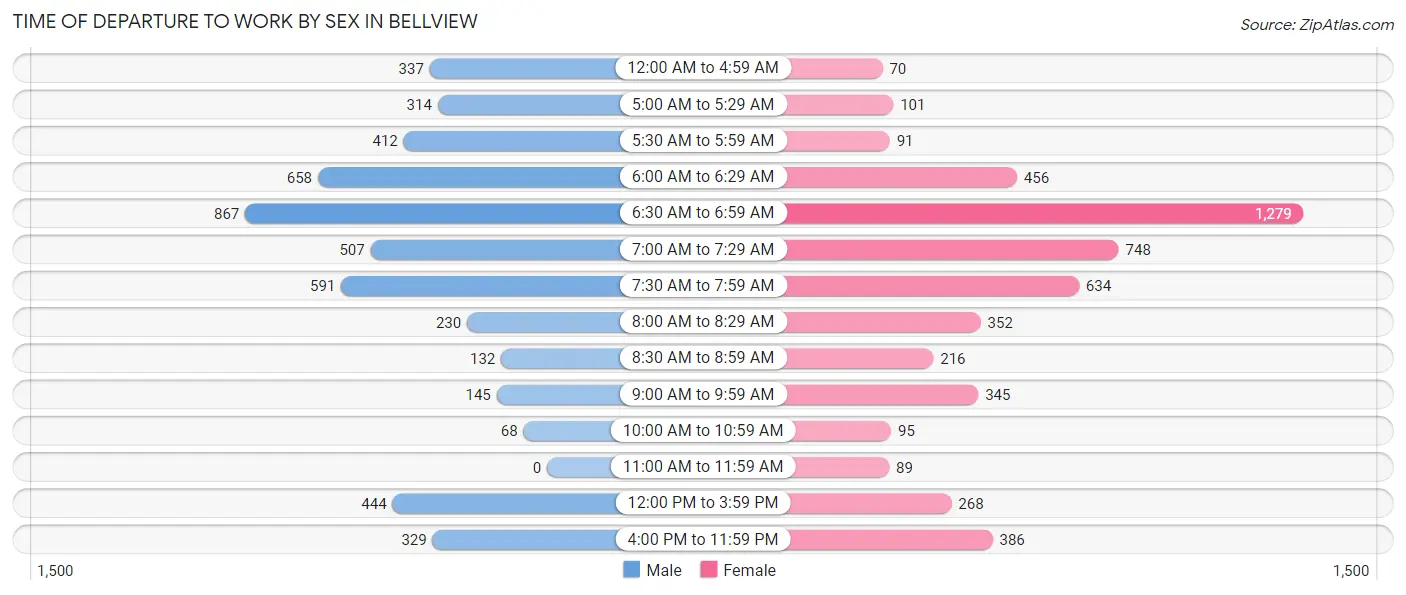
| Time of Departure | Male | Female |
| 12:00 AM to 4:59 AM | 337 (6.7%) | 70 (1.4%) |
| 5:00 AM to 5:29 AM | 314 (6.2%) | 101 (2.0%) |
| 5:30 AM to 5:59 AM | 412 (8.2%) | 91 (1.8%) |
| 6:00 AM to 6:29 AM | 658 (13.1%) | 456 (8.9%) |
| 6:30 AM to 6:59 AM | 867 (17.2%) | 1,279 (24.9%) |
| 7:00 AM to 7:29 AM | 507 (10.1%) | 748 (14.6%) |
| 7:30 AM to 7:59 AM | 591 (11.7%) | 634 (12.4%) |
| 8:00 AM to 8:29 AM | 230 (4.6%) | 352 (6.9%) |
| 8:30 AM to 8:59 AM | 132 (2.6%) | 216 (4.2%) |
| 9:00 AM to 9:59 AM | 145 (2.9%) | 345 (6.7%) |
| 10:00 AM to 10:59 AM | 68 (1.3%) | 95 (1.8%) |
| 11:00 AM to 11:59 AM | 0 (0.0%) | 89 (1.7%) |
| 12:00 PM to 3:59 PM | 444 (8.8%) | 268 (5.2%) |
| 4:00 PM to 11:59 PM | 329 (6.5%) | 386 (7.5%) |
| Total | 5,034 (100.0%) | 5,130 (100.0%) |
Housing Occupancy in Bellview
Occupancy by Ownership in Bellview
Of the total 9,663 dwellings in Bellview, owner-occupied units account for 6,806 (70.4%), while renter-occupied units make up 2,857 (29.6%).
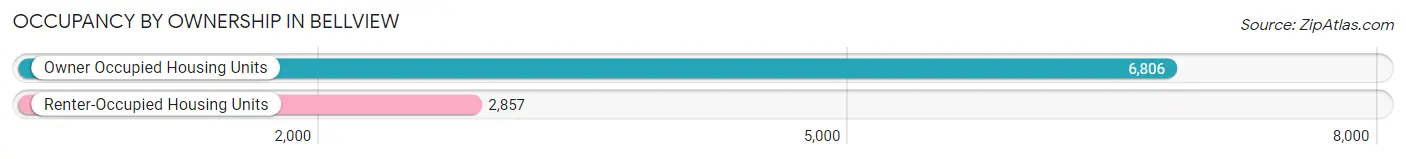
| Occupancy | # Housing Units | % Housing Units |
| Owner Occupied Housing Units | 6,806 | 70.4% |
| Renter-Occupied Housing Units | 2,857 | 29.6% |
| Total Occupied Housing Units | 9,663 | 100.0% |
Occupancy by Household Size in Bellview
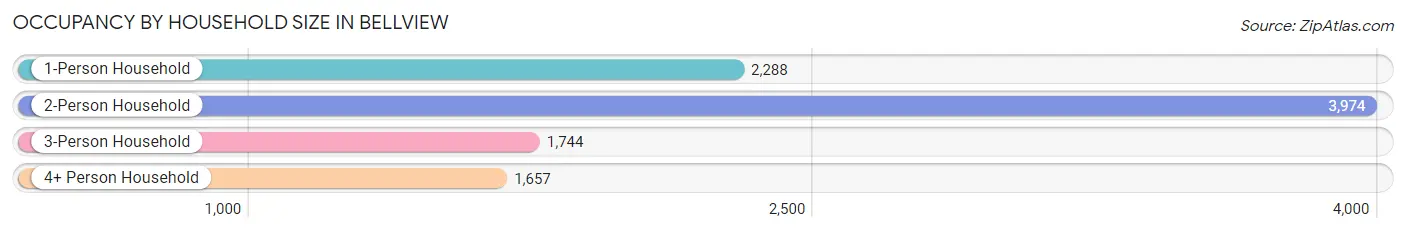
| Household Size | # Housing Units | % Housing Units |
| 1-Person Household | 2,288 | 23.7% |
| 2-Person Household | 3,974 | 41.1% |
| 3-Person Household | 1,744 | 18.0% |
| 4+ Person Household | 1,657 | 17.2% |
| Total Housing Units | 9,663 | 100.0% |
Occupancy by Ownership by Household Size in Bellview
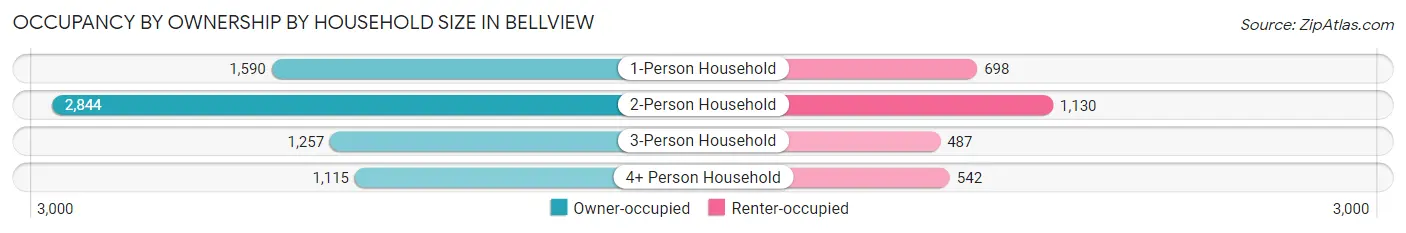
| Household Size | Owner-occupied | Renter-occupied |
| 1-Person Household | 1,590 (69.5%) | 698 (30.5%) |
| 2-Person Household | 2,844 (71.6%) | 1,130 (28.4%) |
| 3-Person Household | 1,257 (72.1%) | 487 (27.9%) |
| 4+ Person Household | 1,115 (67.3%) | 542 (32.7%) |
| Total Housing Units | 6,806 (70.4%) | 2,857 (29.6%) |
Occupancy by Educational Attainment in Bellview
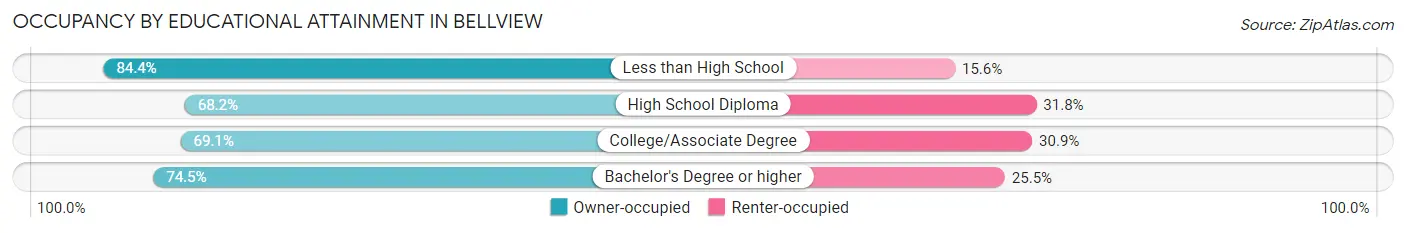
| Household Size | Owner-occupied | Renter-occupied |
| Less than High School | 275 (84.4%) | 51 (15.6%) |
| High School Diploma | 1,746 (68.2%) | 813 (31.8%) |
| College/Associate Degree | 3,361 (69.1%) | 1,505 (30.9%) |
| Bachelor's Degree or higher | 1,424 (74.5%) | 488 (25.5%) |
Occupancy by Age of Householder in Bellview
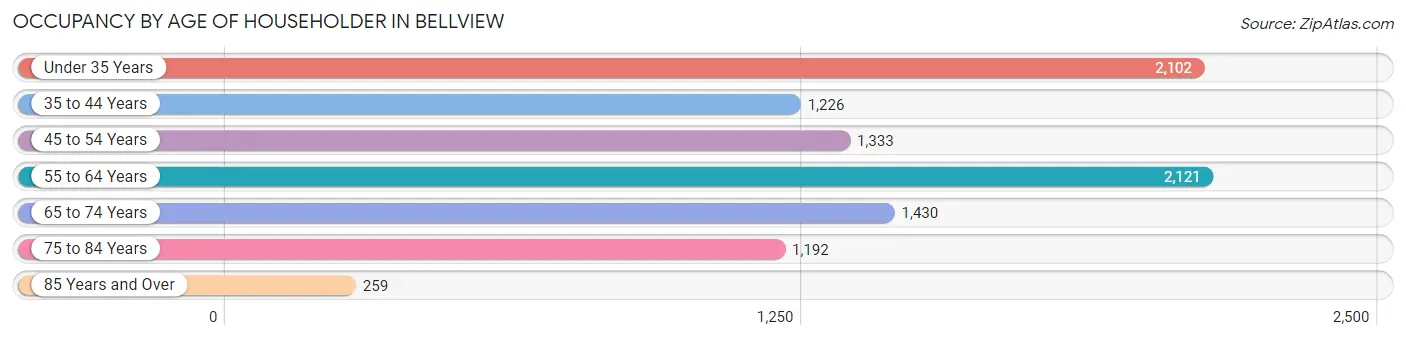
| Age Bracket | # Households | % Households |
| Under 35 Years | 2,102 | 21.7% |
| 35 to 44 Years | 1,226 | 12.7% |
| 45 to 54 Years | 1,333 | 13.8% |
| 55 to 64 Years | 2,121 | 22.0% |
| 65 to 74 Years | 1,430 | 14.8% |
| 75 to 84 Years | 1,192 | 12.3% |
| 85 Years and Over | 259 | 2.7% |
| Total | 9,663 | 100.0% |
Housing Finances in Bellview
Median Income by Occupancy in Bellview
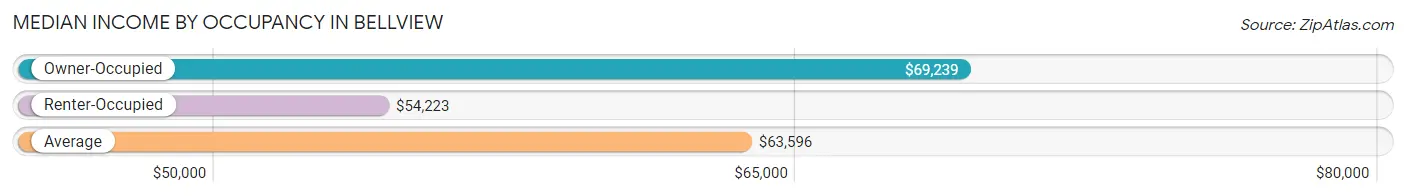
| Occupancy Type | # Households | Median Income |
| Owner-Occupied | 6,806 (70.4%) | $69,239 |
| Renter-Occupied | 2,857 (29.6%) | $54,223 |
| Average | 9,663 (100.0%) | $63,596 |
Occupancy by Householder Income Bracket in Bellview
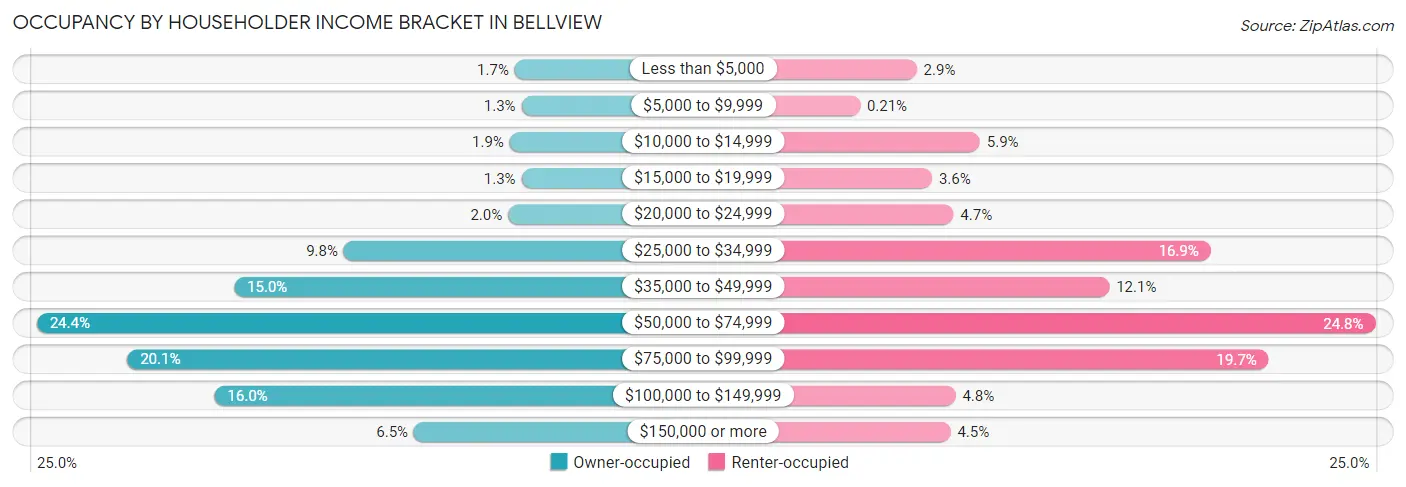
| Income Bracket | Owner-occupied | Renter-occupied |
| Less than $5,000 | 113 (1.7%) | 83 (2.9%) |
| $5,000 to $9,999 | 91 (1.3%) | 6 (0.2%) |
| $10,000 to $14,999 | 129 (1.9%) | 169 (5.9%) |
| $15,000 to $19,999 | 91 (1.3%) | 104 (3.6%) |
| $20,000 to $24,999 | 135 (2.0%) | 133 (4.7%) |
| $25,000 to $34,999 | 667 (9.8%) | 483 (16.9%) |
| $35,000 to $49,999 | 1,023 (15.0%) | 345 (12.1%) |
| $50,000 to $74,999 | 1,662 (24.4%) | 707 (24.7%) |
| $75,000 to $99,999 | 1,369 (20.1%) | 562 (19.7%) |
| $100,000 to $149,999 | 1,086 (16.0%) | 136 (4.8%) |
| $150,000 or more | 440 (6.5%) | 129 (4.5%) |
| Total | 6,806 (100.0%) | 2,857 (100.0%) |
Monthly Housing Cost Tiers in Bellview
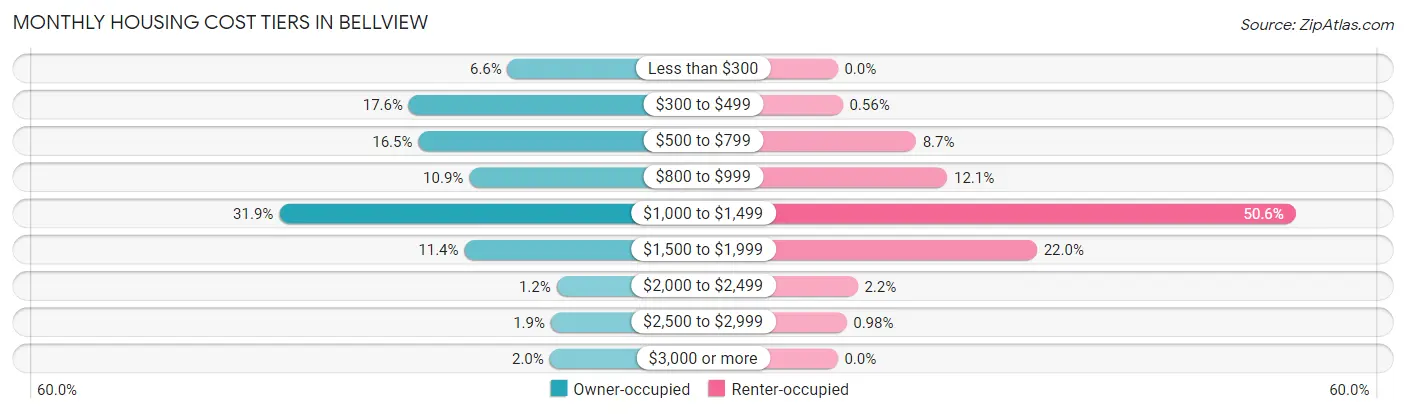
| Monthly Cost | Owner-occupied | Renter-occupied |
| Less than $300 | 452 (6.6%) | 0 (0.0%) |
| $300 to $499 | 1,195 (17.6%) | 16 (0.6%) |
| $500 to $799 | 1,124 (16.5%) | 247 (8.6%) |
| $800 to $999 | 741 (10.9%) | 346 (12.1%) |
| $1,000 to $1,499 | 2,170 (31.9%) | 1,446 (50.6%) |
| $1,500 to $1,999 | 777 (11.4%) | 629 (22.0%) |
| $2,000 to $2,499 | 84 (1.2%) | 63 (2.2%) |
| $2,500 to $2,999 | 127 (1.9%) | 28 (1.0%) |
| $3,000 or more | 136 (2.0%) | 0 (0.0%) |
| Total | 6,806 (100.0%) | 2,857 (100.0%) |
Physical Housing Characteristics in Bellview
Housing Structures in Bellview
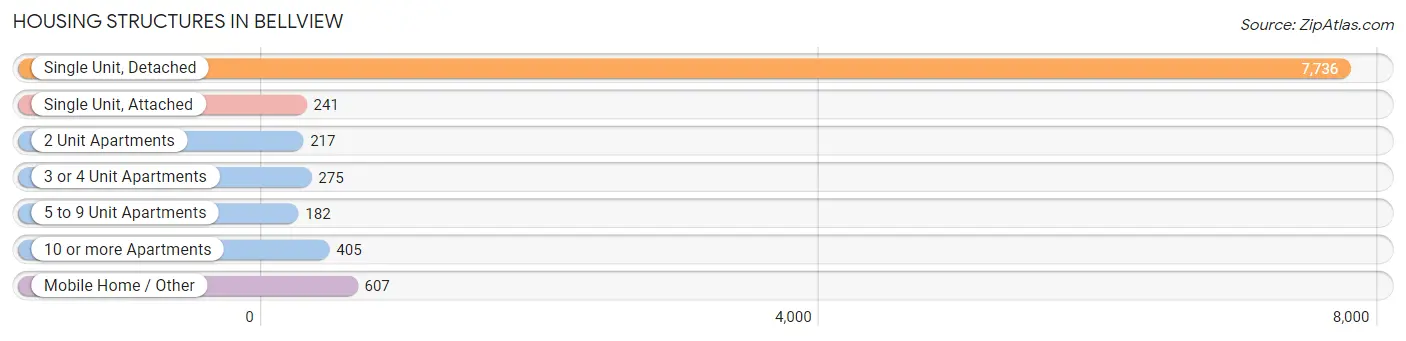
| Structure Type | # Housing Units | % Housing Units |
| Single Unit, Detached | 7,736 | 80.1% |
| Single Unit, Attached | 241 | 2.5% |
| 2 Unit Apartments | 217 | 2.2% |
| 3 or 4 Unit Apartments | 275 | 2.9% |
| 5 to 9 Unit Apartments | 182 | 1.9% |
| 10 or more Apartments | 405 | 4.2% |
| Mobile Home / Other | 607 | 6.3% |
| Total | 9,663 | 100.0% |
Housing Structures by Occupancy in Bellview
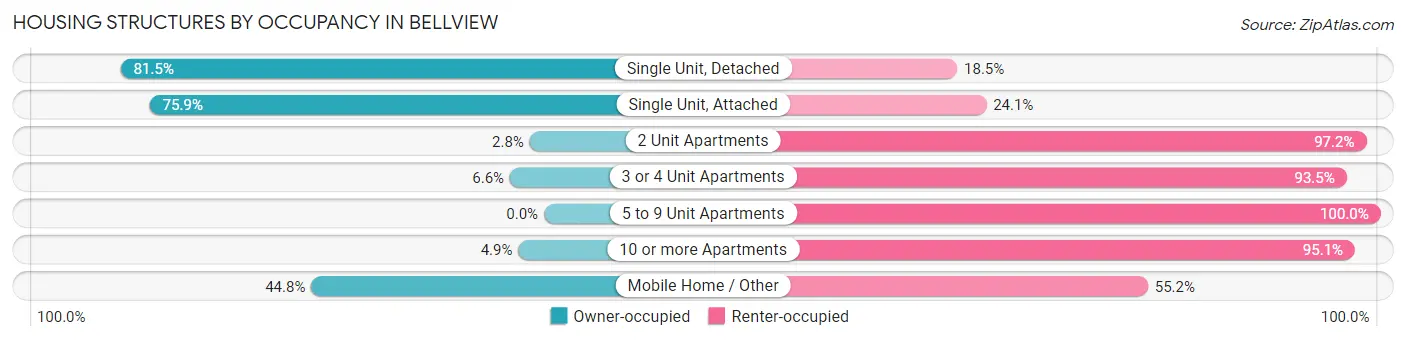
| Structure Type | Owner-occupied | Renter-occupied |
| Single Unit, Detached | 6,307 (81.5%) | 1,429 (18.5%) |
| Single Unit, Attached | 183 (75.9%) | 58 (24.1%) |
| 2 Unit Apartments | 6 (2.8%) | 211 (97.2%) |
| 3 or 4 Unit Apartments | 18 (6.6%) | 257 (93.4%) |
| 5 to 9 Unit Apartments | 0 (0.0%) | 182 (100.0%) |
| 10 or more Apartments | 20 (4.9%) | 385 (95.1%) |
| Mobile Home / Other | 272 (44.8%) | 335 (55.2%) |
| Total | 6,806 (70.4%) | 2,857 (29.6%) |
Housing Structures by Number of Rooms in Bellview
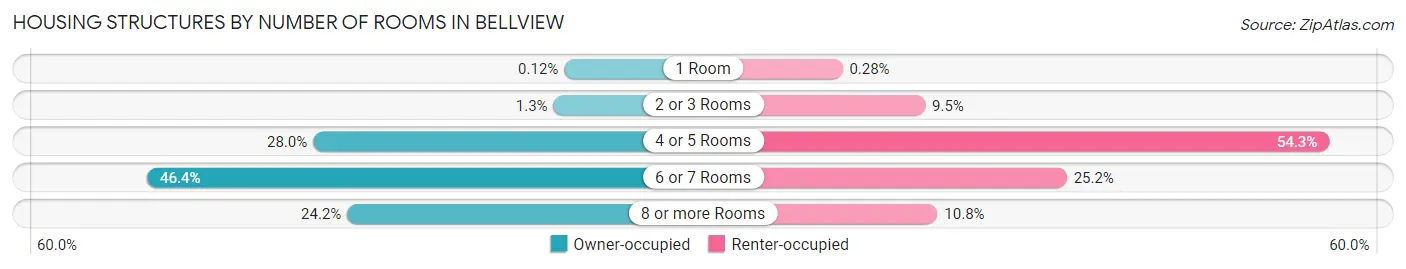
| Number of Rooms | Owner-occupied | Renter-occupied |
| 1 Room | 8 (0.1%) | 8 (0.3%) |
| 2 or 3 Rooms | 89 (1.3%) | 270 (9.5%) |
| 4 or 5 Rooms | 1,904 (28.0%) | 1,551 (54.3%) |
| 6 or 7 Rooms | 3,158 (46.4%) | 719 (25.2%) |
| 8 or more Rooms | 1,647 (24.2%) | 309 (10.8%) |
| Total | 6,806 (100.0%) | 2,857 (100.0%) |
Housing Structure by Heating Type in Bellview
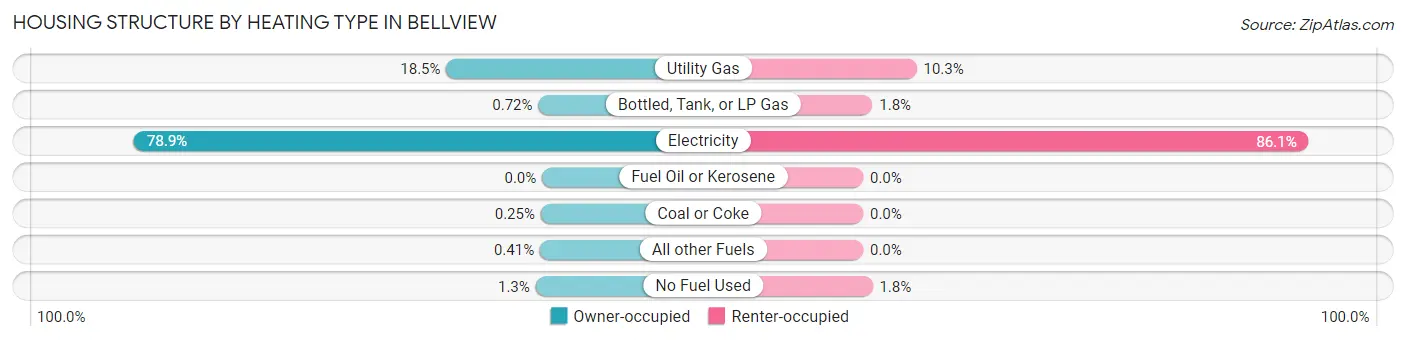
| Heating Type | Owner-occupied | Renter-occupied |
| Utility Gas | 1,259 (18.5%) | 295 (10.3%) |
| Bottled, Tank, or LP Gas | 49 (0.7%) | 51 (1.8%) |
| Electricity | 5,368 (78.9%) | 2,459 (86.1%) |
| Fuel Oil or Kerosene | 0 (0.0%) | 0 (0.0%) |
| Coal or Coke | 17 (0.3%) | 0 (0.0%) |
| All other Fuels | 28 (0.4%) | 0 (0.0%) |
| No Fuel Used | 85 (1.3%) | 52 (1.8%) |
| Total | 6,806 (100.0%) | 2,857 (100.0%) |
Household Vehicle Usage in Bellview
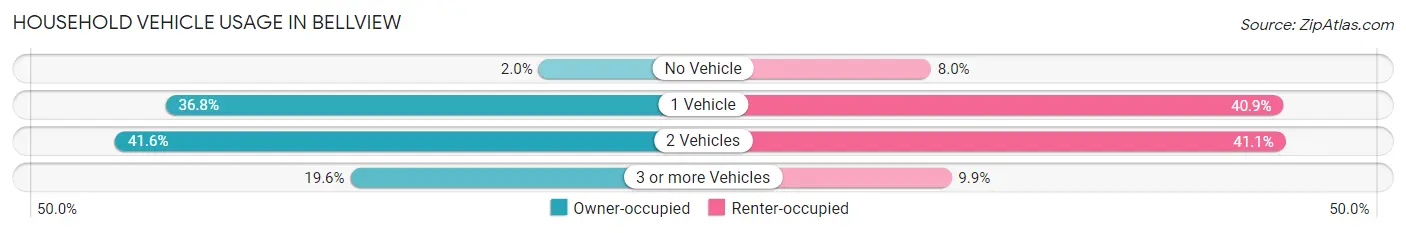
| Vehicles per Household | Owner-occupied | Renter-occupied |
| No Vehicle | 138 (2.0%) | 229 (8.0%) |
| 1 Vehicle | 2,507 (36.8%) | 1,169 (40.9%) |
| 2 Vehicles | 2,828 (41.5%) | 1,175 (41.1%) |
| 3 or more Vehicles | 1,333 (19.6%) | 284 (9.9%) |
| Total | 6,806 (100.0%) | 2,857 (100.0%) |
Real Estate & Mortgages in Bellview
Real Estate and Mortgage Overview in Bellview
| Characteristic | Without Mortgage | With Mortgage |
| Housing Units | 2,487 | 4,319 |
| Median Property Value | $139,600 | $165,300 |
| Median Household Income | $63,009 | $302 |
| Monthly Housing Costs | $433 | $131 |
| Real Estate Taxes | $891 | $326 |
Property Value by Mortgage Status in Bellview
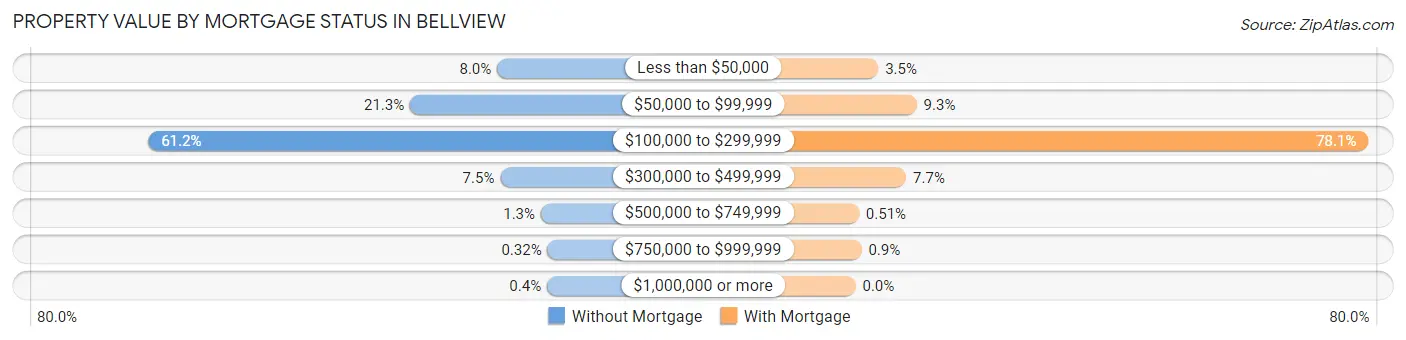
| Property Value | Without Mortgage | With Mortgage |
| Less than $50,000 | 199 (8.0%) | 149 (3.5%) |
| $50,000 to $99,999 | 529 (21.3%) | 402 (9.3%) |
| $100,000 to $299,999 | 1,521 (61.2%) | 3,374 (78.1%) |
| $300,000 to $499,999 | 187 (7.5%) | 333 (7.7%) |
| $500,000 to $749,999 | 33 (1.3%) | 22 (0.5%) |
| $750,000 to $999,999 | 8 (0.3%) | 39 (0.9%) |
| $1,000,000 or more | 10 (0.4%) | 0 (0.0%) |
| Total | 2,487 (100.0%) | 4,319 (100.0%) |
Household Income by Mortgage Status in Bellview
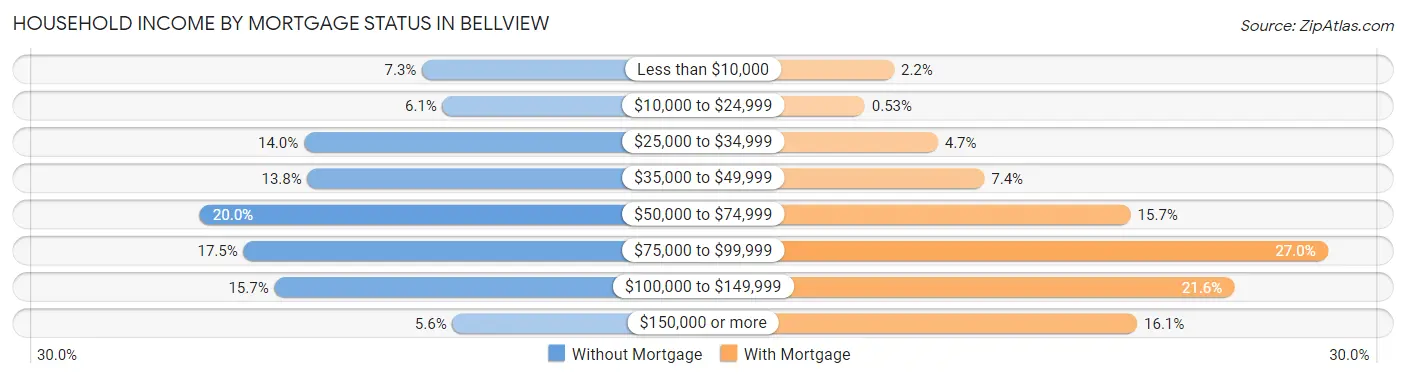
| Household Income | Without Mortgage | With Mortgage |
| Less than $10,000 | 181 (7.3%) | 95 (2.2%) |
| $10,000 to $24,999 | 152 (6.1%) | 23 (0.5%) |
| $25,000 to $34,999 | 349 (14.0%) | 203 (4.7%) |
| $35,000 to $49,999 | 344 (13.8%) | 318 (7.4%) |
| $50,000 to $74,999 | 497 (20.0%) | 679 (15.7%) |
| $75,000 to $99,999 | 435 (17.5%) | 1,165 (27.0%) |
| $100,000 to $149,999 | 391 (15.7%) | 934 (21.6%) |
| $150,000 or more | 138 (5.6%) | 695 (16.1%) |
| Total | 2,487 (100.0%) | 4,319 (100.0%) |
Property Value to Household Income Ratio in Bellview
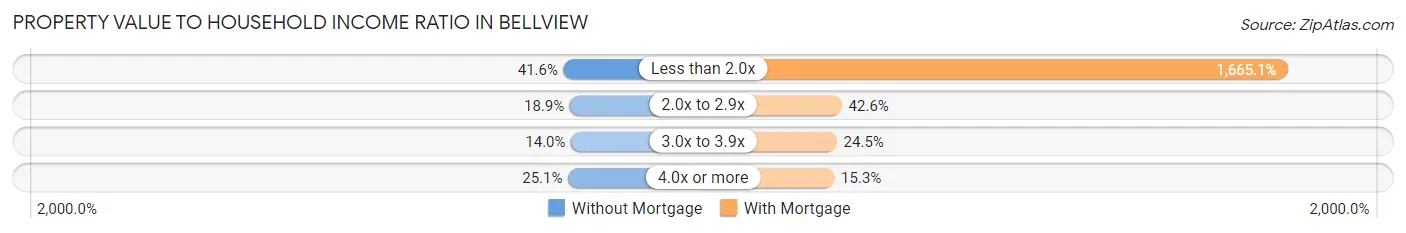
| Value-to-Income Ratio | Without Mortgage | With Mortgage |
| Less than 2.0x | 1,034 (41.6%) | 71,917 (1,665.1%) |
| 2.0x to 2.9x | 471 (18.9%) | 1,840 (42.6%) |
| 3.0x to 3.9x | 348 (14.0%) | 1,056 (24.4%) |
| 4.0x or more | 624 (25.1%) | 662 (15.3%) |
| Total | 2,487 (100.0%) | 4,319 (100.0%) |
Real Estate Taxes by Mortgage Status in Bellview
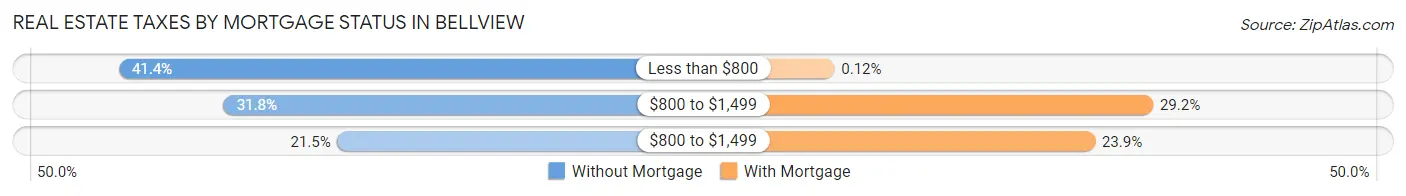
| Property Taxes | Without Mortgage | With Mortgage |
| Less than $800 | 1,029 (41.4%) | 5 (0.1%) |
| $800 to $1,499 | 791 (31.8%) | 1,262 (29.2%) |
| $800 to $1,499 | 535 (21.5%) | 1,033 (23.9%) |
| Total | 2,487 (100.0%) | 4,319 (100.0%) |
Health & Disability in Bellview
Health Insurance Coverage by Age in Bellview
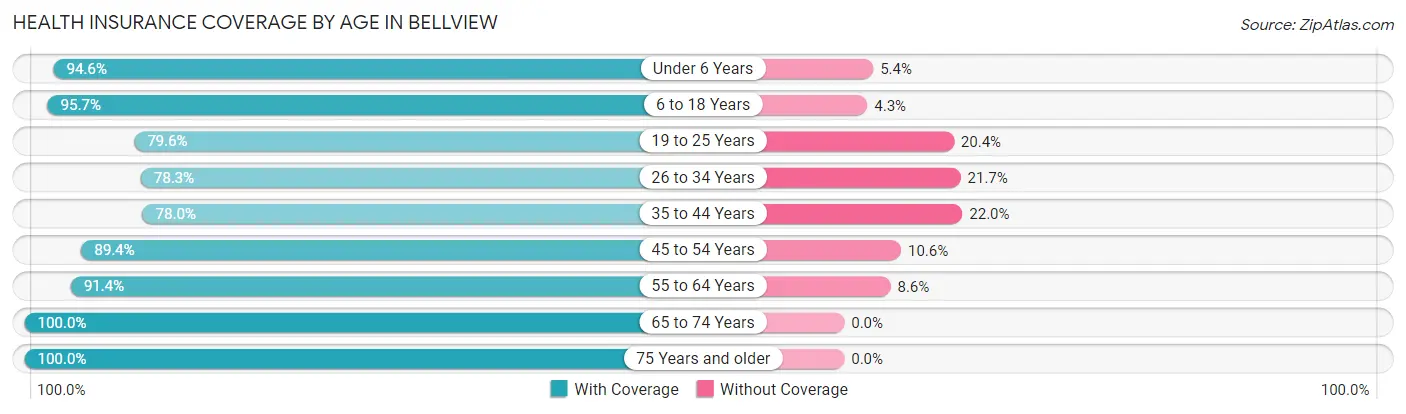
| Age Bracket | With Coverage | Without Coverage |
| Under 6 Years | 2,101 (94.6%) | 120 (5.4%) |
| 6 to 18 Years | 3,160 (95.7%) | 142 (4.3%) |
| 19 to 25 Years | 1,448 (79.6%) | 372 (20.4%) |
| 26 to 34 Years | 2,495 (78.3%) | 691 (21.7%) |
| 35 to 44 Years | 1,845 (78.0%) | 521 (22.0%) |
| 45 to 54 Years | 2,449 (89.4%) | 290 (10.6%) |
| 55 to 64 Years | 3,189 (91.4%) | 301 (8.6%) |
| 65 to 74 Years | 2,202 (100.0%) | 0 (0.0%) |
| 75 Years and older | 2,134 (100.0%) | 0 (0.0%) |
| Total | 21,023 (89.6%) | 2,437 (10.4%) |
Health Insurance Coverage by Citizenship Status in Bellview

| Citizenship Status | With Coverage | Without Coverage |
| Native Born | 2,101 (94.6%) | 120 (5.4%) |
| Foreign Born, Citizen | 3,160 (95.7%) | 142 (4.3%) |
| Foreign Born, not a Citizen | 1,448 (79.6%) | 372 (20.4%) |
Health Insurance Coverage by Household Income in Bellview
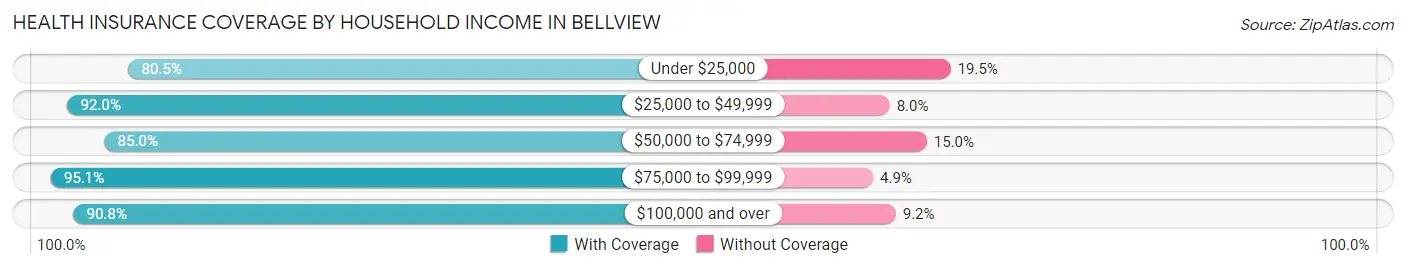
| Household Income | With Coverage | Without Coverage |
| Under $25,000 | 1,526 (80.5%) | 369 (19.5%) |
| $25,000 to $49,999 | 4,998 (92.0%) | 437 (8.0%) |
| $50,000 to $74,999 | 5,088 (85.0%) | 898 (15.0%) |
| $75,000 to $99,999 | 4,434 (95.1%) | 230 (4.9%) |
| $100,000 and over | 4,977 (90.8%) | 503 (9.2%) |
Public vs Private Health Insurance Coverage by Age in Bellview
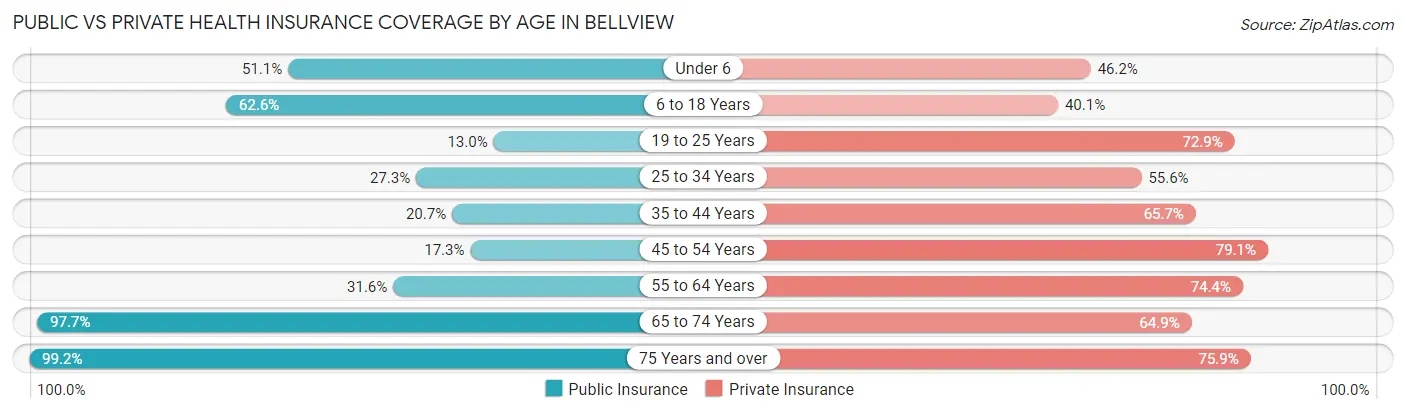
| Age Bracket | Public Insurance | Private Insurance |
| Under 6 | 1,135 (51.1%) | 1,026 (46.2%) |
| 6 to 18 Years | 2,068 (62.6%) | 1,325 (40.1%) |
| 19 to 25 Years | 236 (13.0%) | 1,327 (72.9%) |
| 25 to 34 Years | 871 (27.3%) | 1,772 (55.6%) |
| 35 to 44 Years | 489 (20.7%) | 1,554 (65.7%) |
| 45 to 54 Years | 473 (17.3%) | 2,166 (79.1%) |
| 55 to 64 Years | 1,103 (31.6%) | 2,598 (74.4%) |
| 65 to 74 Years | 2,151 (97.7%) | 1,429 (64.9%) |
| 75 Years and over | 2,116 (99.2%) | 1,619 (75.9%) |
| Total | 10,642 (45.4%) | 14,816 (63.1%) |
Disability Status by Sex by Age in Bellview
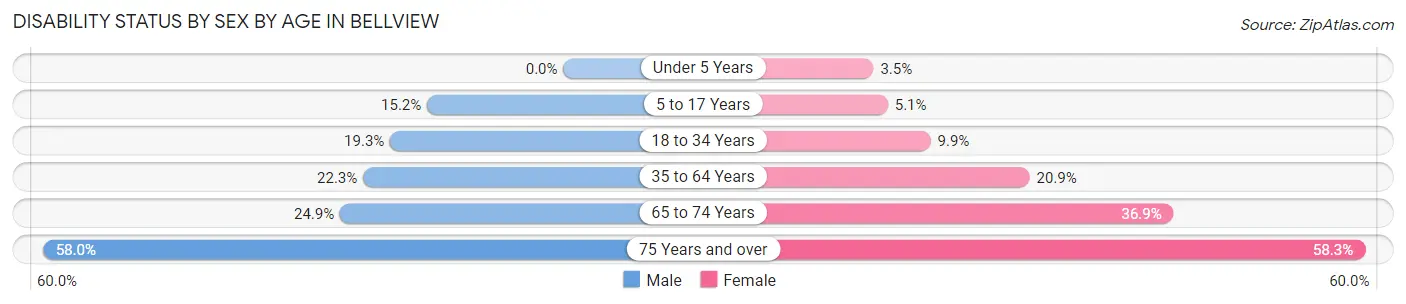
| Age Bracket | Male | Female |
| Under 5 Years | 0 (0.0%) | 24 (3.5%) |
| 5 to 17 Years | 232 (15.2%) | 103 (5.1%) |
| 18 to 34 Years | 452 (19.3%) | 276 (9.9%) |
| 35 to 64 Years | 865 (22.3%) | 986 (20.9%) |
| 65 to 74 Years | 244 (24.9%) | 451 (36.9%) |
| 75 Years and over | 487 (58.0%) | 754 (58.3%) |
Disability Class by Sex by Age in Bellview
Disability Class: Hearing Difficulty
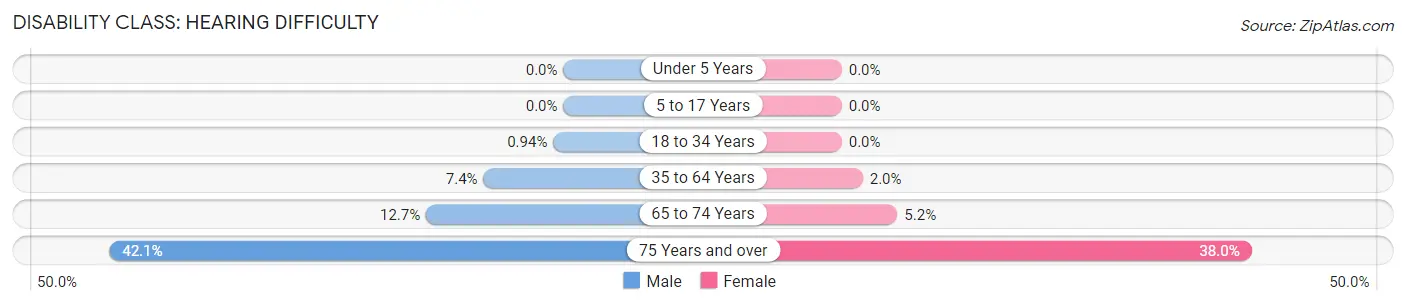
| Age Bracket | Male | Female |
| Under 5 Years | 0 (0.0%) | 0 (0.0%) |
| 5 to 17 Years | 0 (0.0%) | 0 (0.0%) |
| 18 to 34 Years | 22 (0.9%) | 0 (0.0%) |
| 35 to 64 Years | 288 (7.4%) | 92 (1.9%) |
| 65 to 74 Years | 125 (12.7%) | 63 (5.2%) |
| 75 Years and over | 354 (42.1%) | 492 (38.0%) |
Disability Class: Vision Difficulty
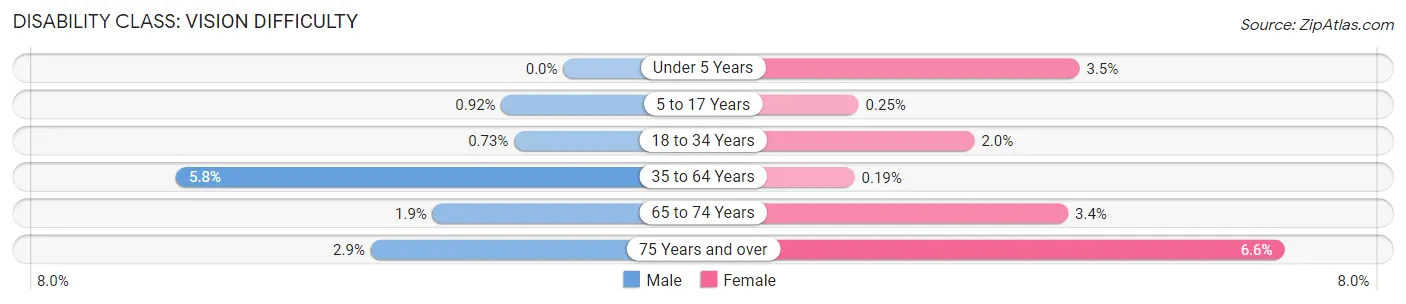
| Age Bracket | Male | Female |
| Under 5 Years | 0 (0.0%) | 24 (3.5%) |
| 5 to 17 Years | 14 (0.9%) | 5 (0.3%) |
| 18 to 34 Years | 17 (0.7%) | 55 (2.0%) |
| 35 to 64 Years | 223 (5.8%) | 9 (0.2%) |
| 65 to 74 Years | 19 (1.9%) | 41 (3.4%) |
| 75 Years and over | 24 (2.9%) | 85 (6.6%) |
Disability Class: Cognitive Difficulty
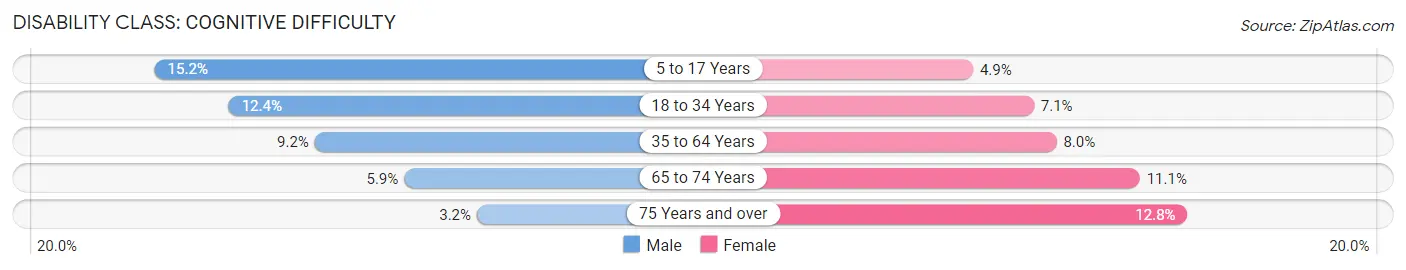
| Age Bracket | Male | Female |
| 5 to 17 Years | 232 (15.2%) | 98 (4.9%) |
| 18 to 34 Years | 291 (12.4%) | 199 (7.1%) |
| 35 to 64 Years | 358 (9.2%) | 376 (8.0%) |
| 65 to 74 Years | 58 (5.9%) | 135 (11.1%) |
| 75 Years and over | 27 (3.2%) | 166 (12.8%) |
Disability Class: Ambulatory Difficulty
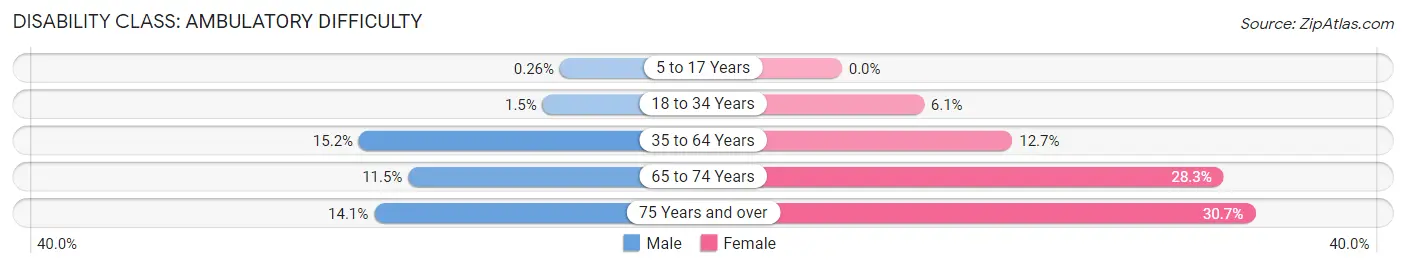
| Age Bracket | Male | Female |
| 5 to 17 Years | 4 (0.3%) | 0 (0.0%) |
| 18 to 34 Years | 36 (1.5%) | 170 (6.1%) |
| 35 to 64 Years | 589 (15.2%) | 597 (12.7%) |
| 65 to 74 Years | 113 (11.5%) | 346 (28.3%) |
| 75 Years and over | 118 (14.1%) | 397 (30.7%) |
Disability Class: Self-Care Difficulty
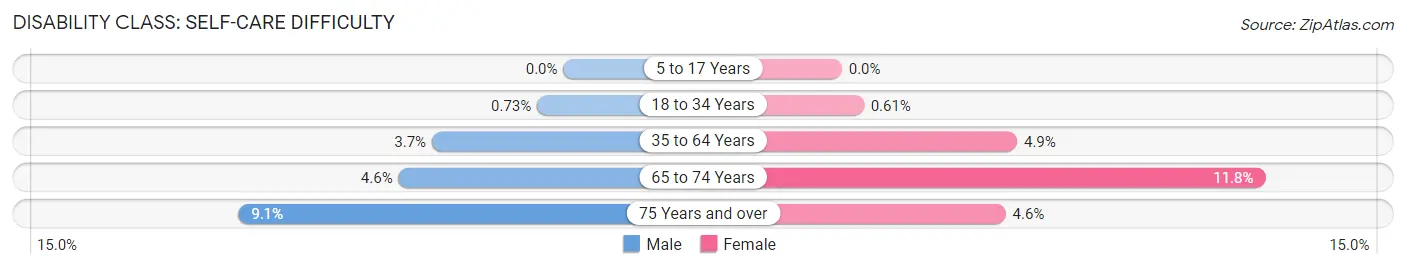
| Age Bracket | Male | Female |
| 5 to 17 Years | 0 (0.0%) | 0 (0.0%) |
| 18 to 34 Years | 17 (0.7%) | 17 (0.6%) |
| 35 to 64 Years | 142 (3.7%) | 230 (4.9%) |
| 65 to 74 Years | 45 (4.6%) | 144 (11.8%) |
| 75 Years and over | 76 (9.0%) | 59 (4.6%) |
Technology Access in Bellview
Computing Device Access in Bellview
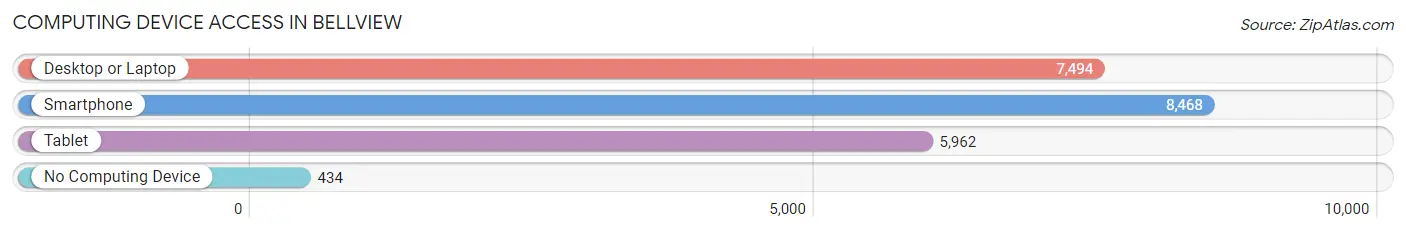
| Device Type | # Households | % Households |
| Desktop or Laptop | 7,494 | 77.5% |
| Smartphone | 8,468 | 87.6% |
| Tablet | 5,962 | 61.7% |
| No Computing Device | 434 | 4.5% |
| Total | 9,663 | 100.0% |
Internet Access in Bellview
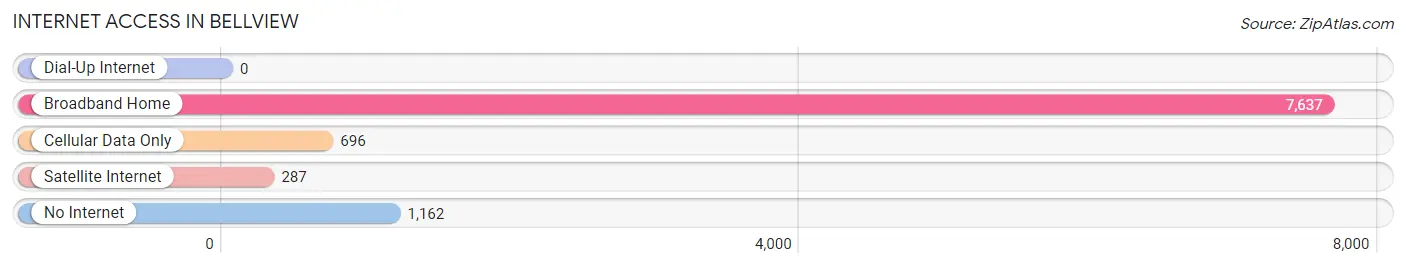
| Internet Type | # Households | % Households |
| Dial-Up Internet | 0 | 0.0% |
| Broadband Home | 7,637 | 79.0% |
| Cellular Data Only | 696 | 7.2% |
| Satellite Internet | 287 | 3.0% |
| No Internet | 1,162 | 12.0% |
| Total | 9,663 | 100.0% |
Bellview Summary
Bellview, FL is a small city located in Escambia County, Florida. It is situated on the western edge of the Florida Panhandle, just south of Pensacola. The city has a population of approximately 8,000 people and covers an area of 4.2 square miles.
History
Bellview was founded in 1887 by a group of settlers from Georgia. The town was named after the Bellview Plantation, which was owned by one of the settlers. The plantation was located near the present-day city limits. The town grew slowly over the years, and by the early 1900s, it had become a popular tourist destination.
In the 1920s, the town began to experience a period of growth and development. The first paved road was built in 1923, and the first school was built in 1925. The town also saw the construction of a number of churches, businesses, and other buildings.
In the 1950s, Bellview experienced a period of rapid growth. The population increased from 1,000 to 8,000 in just a few years. This growth was due in part to the construction of a number of military bases in the area. The town also saw the construction of a number of new homes and businesses.
Geography
Bellview is located in the western part of Escambia County, Florida. It is situated on the western edge of the Florida Panhandle, just south of Pensacola. The city is bordered by the Escambia River to the north and the Perdido River to the south. The city is located at an elevation of 30 feet above sea level.
The climate in Bellview is classified as humid subtropical. The average temperature in the summer is around 80 degrees Fahrenheit, and the average temperature in the winter is around 60 degrees Fahrenheit. The city receives an average of 54 inches of rain per year.
Economy
The economy of Bellview is largely based on tourism and the military. The city is home to several military bases, including Naval Air Station Pensacola and Eglin Air Force Base. These bases provide a significant number of jobs to the local economy.
The city is also home to a number of tourist attractions, including the Pensacola Beach Boardwalk, the National Naval Aviation Museum, and the Gulf Islands National Seashore. These attractions draw a large number of visitors to the city each year.
Demographics
As of the 2010 census, the population of Bellview was 8,000. The racial makeup of the city was 79.3% White, 14.2% African American, 0.7% Native American, 0.7% Asian, 0.1% Pacific Islander, and 4.9% from other races. The median household income was $37,000, and the median family income was $45,000.
The city is home to a number of churches, including Baptist, Methodist, and Catholic. The city also has a number of schools, including Bellview Elementary School, Bellview Middle School, and Bellview High School. The city is served by the Escambia County School District.
Conclusion
Bellview, FL is a small city located in Escambia County, Florida. It is situated on the western edge of the Florida Panhandle, just south of Pensacola. The city has a population of approximately 8,000 people and covers an area of 4.2 square miles. The economy of Bellview is largely based on tourism and the military, and the city is home to a number of tourist attractions. The racial makeup of the city is 79.3% White, 14.2% African American, 0.7% Native American, 0.7% Asian, 0.1% Pacific Islander, and 4.9% from other races. The median household income was $37,000, and the median family income was $45,000.
Common Questions
What is Per Capita Income in Bellview?
Per Capita income in Bellview is $30,094.
What is the Median Family Income in Bellview?
Median Family Income in Bellview is $69,600.
What is the Median Household income in Bellview?
Median Household Income in Bellview is $63,596.
What is Income or Wage Gap in Bellview?
Income or Wage Gap in Bellview is 25.0%.
Women in Bellview earn 75.0 cents for every dollar earned by a man.
What is Family Income Deficit in Bellview?
Family Income Deficit in Bellview is $8,707.
Families that are below poverty line in Bellview earn $8,707 less on average than the poverty threshold level.
What is Inequality or Gini Index in Bellview?
Inequality or Gini Index in Bellview is 0.36.
What is the Total Population of Bellview?
Total Population of Bellview is 24,035.
What is the Total Male Population of Bellview?
Total Male Population of Bellview is 11,183.
What is the Total Female Population of Bellview?
Total Female Population of Bellview is 12,852.
What is the Ratio of Males per 100 Females in Bellview?
There are 87.01 Males per 100 Females in Bellview.
What is the Ratio of Females per 100 Males in Bellview?
There are 114.92 Females per 100 Males in Bellview.
What is the Median Population Age in Bellview?
Median Population Age in Bellview is 38.9 Years.
What is the Average Family Size in Bellview
Average Family Size in Bellview is 3.0 People.
What is the Average Household Size in Bellview
Average Household Size in Bellview is 2.5 People.
How Large is the Labor Force in Bellview?
There are 11,754 People in the Labor Forcein in Bellview.
What is the Percentage of People in the Labor Force in Bellview?
61.8% of People are in the Labor Force in Bellview.
What is the Unemployment Rate in Bellview?
Unemployment Rate in Bellview is 5.5%.