Largo, FL Map & Demographics
Largo Map
Largo Overview
$35,314
PER CAPITA INCOME
$68,958
AVG FAMILY INCOME
$56,266
AVG HOUSEHOLD INCOME
17.5%
WAGE / INCOME GAP [ % ]
82.5¢/ $1
WAGE / INCOME GAP [ $ ]
$10,166
FAMILY INCOME DEFICIT
0.44
INEQUALITY / GINI INDEX
82,541
TOTAL POPULATION
39,496
MALE POPULATION
43,045
FEMALE POPULATION
91.76
MALES / 100 FEMALES
108.99
FEMALES / 100 MALES
48.9
MEDIAN AGE
3.0
AVG FAMILY SIZE
2.2
AVG HOUSEHOLD SIZE
41,880
LABOR FORCE [ PEOPLE ]
58.7%
PERCENT IN LABOR FORCE
5.0%
UNEMPLOYMENT RATE
Largo Area Codes
Income in Largo
Income Overview in Largo
Per Capita Income in Largo is $35,314, while median incomes of families and households are $68,958 and $56,266 respectively.
| Characteristic | Number | Measure |
| Per Capita Income | 82,541 | $35,314 |
| Median Family Income | 18,333 | $68,958 |
| Mean Family Income | 18,333 | $93,862 |
| Median Household Income | 36,972 | $56,266 |
| Mean Household Income | 36,972 | $74,303 |
| Income Deficit | 18,333 | $10,166 |
| Wage / Income Gap (%) | 82,541 | 17.54% |
| Wage / Income Gap ($) | 82,541 | 82.46¢ per $1 |
| Gini / Inequality Index | 82,541 | 0.44 |
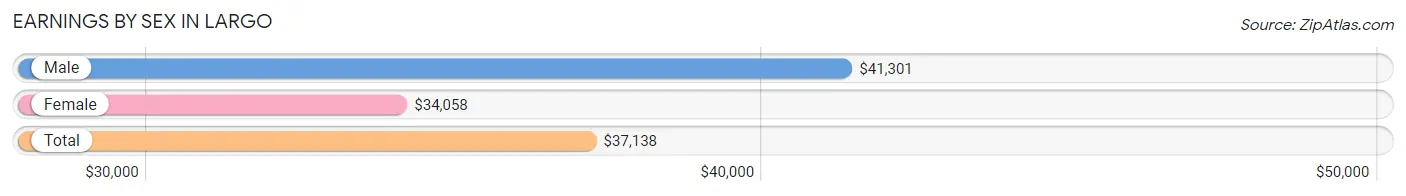
Earnings by Sex in Largo
Average Earnings in Largo are $37,138, $41,301 for men and $34,058 for women, a difference of 17.5%.
| Sex | Number | Average Earnings |
| Male | 21,206 (49.4%) | $41,301 |
| Female | 21,725 (50.6%) | $34,058 |
| Total | 42,931 (100.0%) | $37,138 |
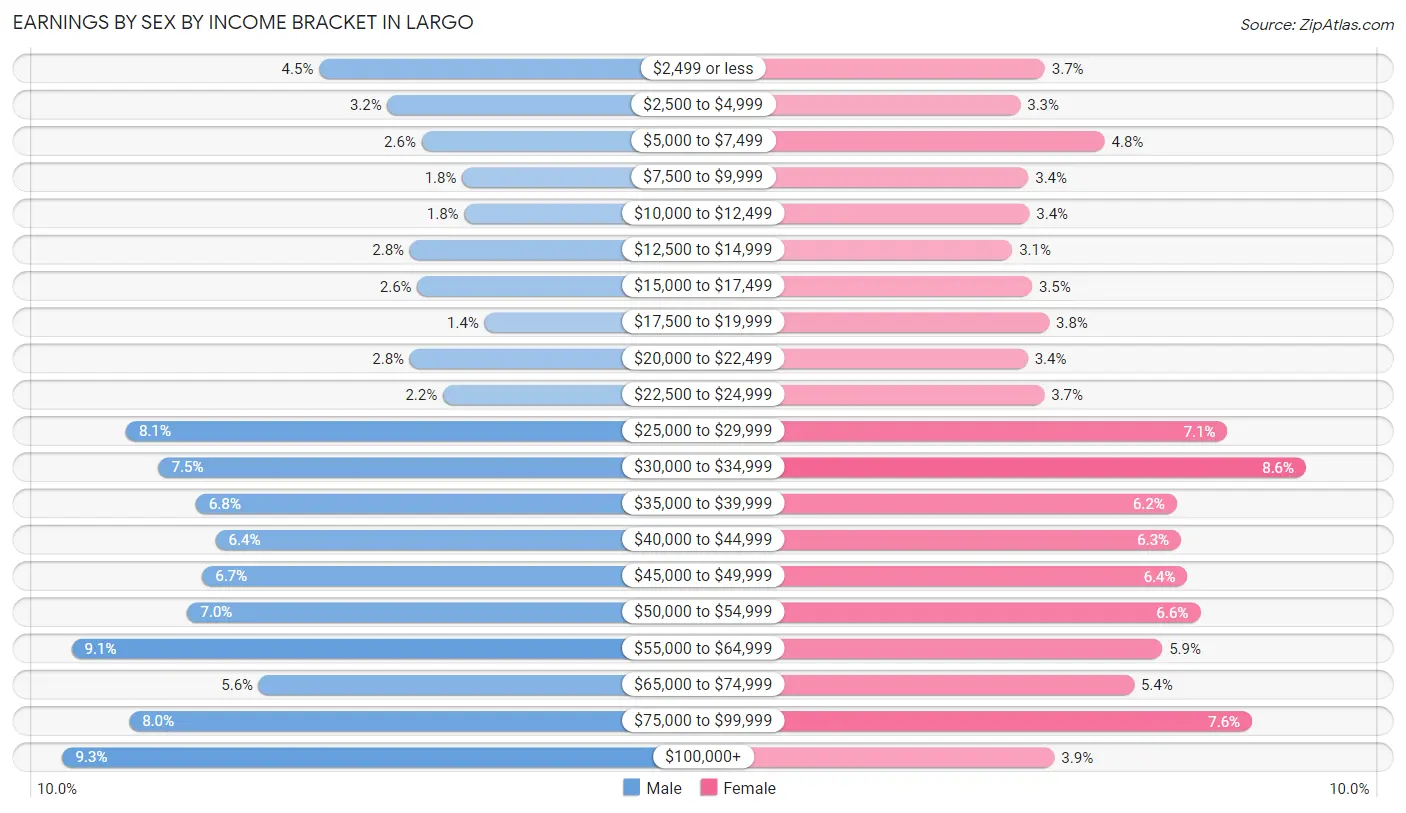
Earnings by Sex by Income Bracket in Largo
The most common earnings brackets in Largo are $100,000+ for men (1,971 | 9.3%) and $30,000 to $34,999 for women (1,868 | 8.6%).
| Income | Male | Female |
| $2,499 or less | 951 (4.5%) | 805 (3.7%) |
| $2,500 to $4,999 | 678 (3.2%) | 705 (3.3%) |
| $5,000 to $7,499 | 542 (2.6%) | 1,050 (4.8%) |
| $7,500 to $9,999 | 381 (1.8%) | 738 (3.4%) |
| $10,000 to $12,499 | 373 (1.8%) | 743 (3.4%) |
| $12,500 to $14,999 | 590 (2.8%) | 674 (3.1%) |
| $15,000 to $17,499 | 559 (2.6%) | 753 (3.5%) |
| $17,500 to $19,999 | 293 (1.4%) | 823 (3.8%) |
| $20,000 to $22,499 | 590 (2.8%) | 737 (3.4%) |
| $22,500 to $24,999 | 457 (2.2%) | 803 (3.7%) |
| $25,000 to $29,999 | 1,717 (8.1%) | 1,549 (7.1%) |
| $30,000 to $34,999 | 1,588 (7.5%) | 1,868 (8.6%) |
| $35,000 to $39,999 | 1,439 (6.8%) | 1,343 (6.2%) |
| $40,000 to $44,999 | 1,361 (6.4%) | 1,361 (6.3%) |
| $45,000 to $49,999 | 1,414 (6.7%) | 1,386 (6.4%) |
| $50,000 to $54,999 | 1,473 (7.0%) | 1,438 (6.6%) |
| $55,000 to $64,999 | 1,933 (9.1%) | 1,285 (5.9%) |
| $65,000 to $74,999 | 1,190 (5.6%) | 1,169 (5.4%) |
| $75,000 to $99,999 | 1,706 (8.0%) | 1,650 (7.6%) |
| $100,000+ | 1,971 (9.3%) | 845 (3.9%) |
| Total | 21,206 (100.0%) | 21,725 (100.0%) |
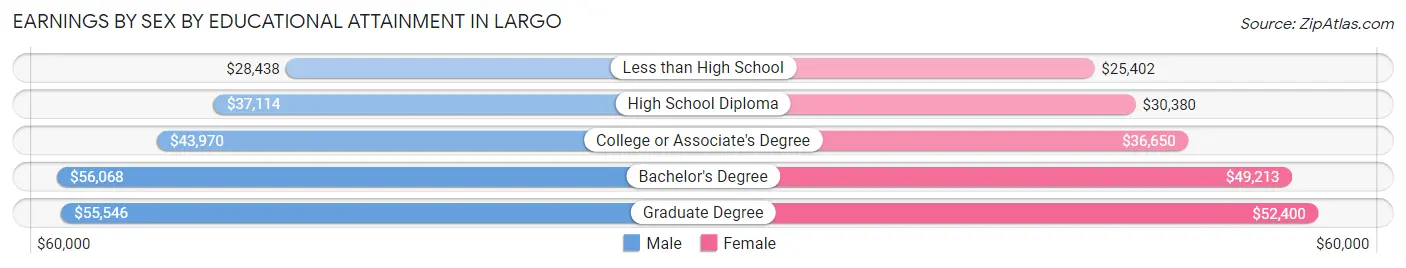
Earnings by Sex by Educational Attainment in Largo
Average earnings in Largo are $43,599 for men and $37,684 for women, a difference of 13.6%. Men with an educational attainment of bachelor's degree enjoy the highest average annual earnings of $56,068, while those with less than high school education earn the least with $28,438. Women with an educational attainment of graduate degree earn the most with the average annual earnings of $52,400, while those with less than high school education have the smallest earnings of $25,402.
| Educational Attainment | Male Income | Female Income |
| Less than High School | $28,438 | $25,402 |
| High School Diploma | $37,114 | $30,380 |
| College or Associate's Degree | $43,970 | $36,650 |
| Bachelor's Degree | $56,068 | $49,213 |
| Graduate Degree | $55,546 | $52,400 |
| Total | $43,599 | $37,684 |
Family Income in Largo
Family Income Brackets in Largo
According to the Largo family income data, there are 3,997 families falling into the $50,000 to $74,999 income range, which is the most common income bracket and makes up 21.8% of all families. Conversely, the $10,000 to $14,999 income bracket is the least frequent group with only 312 families (1.7%) belonging to this category.
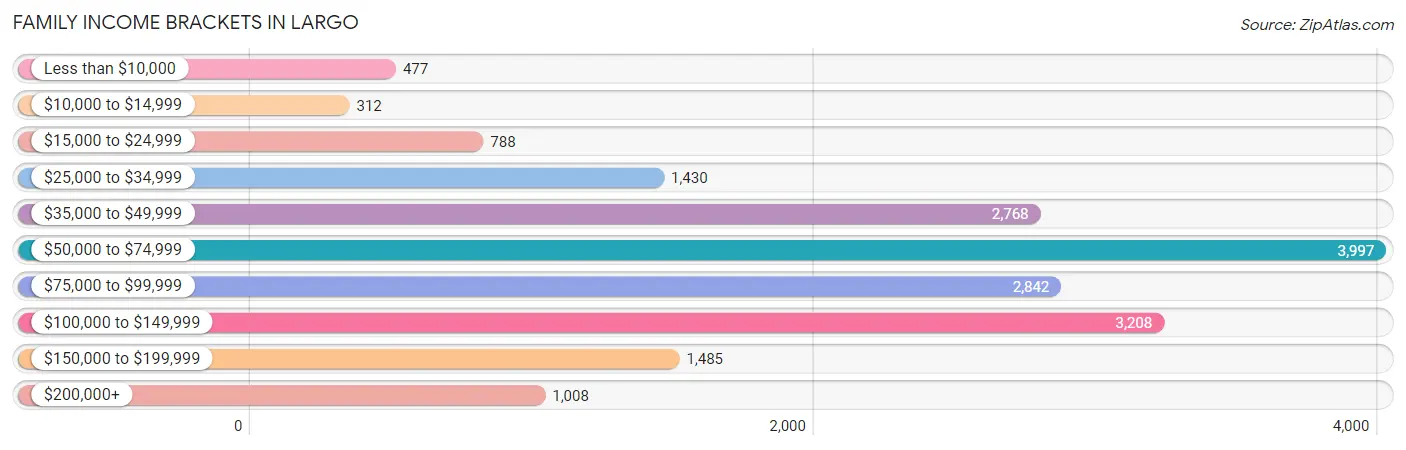
| Income Bracket | # Families | % Families |
| Less than $10,000 | 477 | 2.6% |
| $10,000 to $14,999 | 312 | 1.7% |
| $15,000 to $24,999 | 788 | 4.3% |
| $25,000 to $34,999 | 1,430 | 7.8% |
| $35,000 to $49,999 | 2,768 | 15.1% |
| $50,000 to $74,999 | 3,997 | 21.8% |
| $75,000 to $99,999 | 2,842 | 15.5% |
| $100,000 to $149,999 | 3,208 | 17.5% |
| $150,000 to $199,999 | 1,485 | 8.1% |
| $200,000+ | 1,008 | 5.5% |
Family Income by Famaliy Size in Largo
7+ person families (82 | 0.4%) account for the highest median family income in Largo with $114,722 per family, while 2-person families (10,920 | 59.6%) have the highest median income of $31,078 per family member.
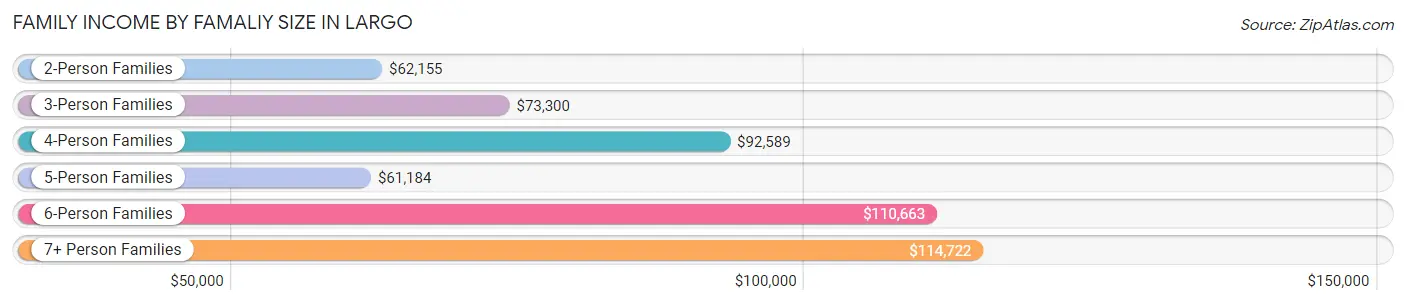
| Income Bracket | # Families | Median Income |
| 2-Person Families | 10,920 (59.6%) | $62,155 |
| 3-Person Families | 3,520 (19.2%) | $73,300 |
| 4-Person Families | 2,811 (15.3%) | $92,589 |
| 5-Person Families | 720 (3.9%) | $61,184 |
| 6-Person Families | 280 (1.5%) | $110,663 |
| 7+ Person Families | 82 (0.4%) | $114,722 |
| Total | 18,333 (100.0%) | $68,958 |
Family Income by Number of Earners in Largo
The median family income in Largo is $68,958, with families comprising 3+ earners (1,507) having the highest median family income of $110,125, while families with no earners (3,942) have the lowest median family income of $52,076, accounting for 8.2% and 21.5% of families, respectively.
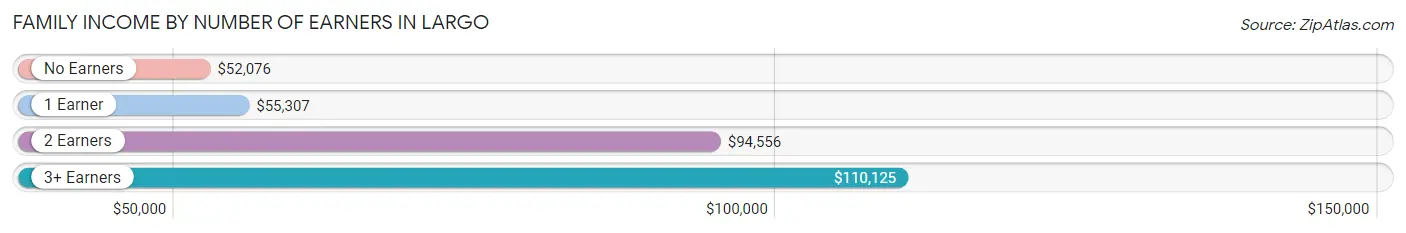
| Number of Earners | # Families | Median Income |
| No Earners | 3,942 (21.5%) | $52,076 |
| 1 Earner | 6,662 (36.3%) | $55,307 |
| 2 Earners | 6,222 (33.9%) | $94,556 |
| 3+ Earners | 1,507 (8.2%) | $110,125 |
| Total | 18,333 (100.0%) | $68,958 |
Household Income in Largo
Household Income Brackets in Largo
With 7,690 households falling in the category, the $50,000 to $74,999 income range is the most frequent in Largo, accounting for 20.8% of all households. In contrast, only 1,257 households (3.4%) fall into the $200,000+ income bracket, making it the least populous group.
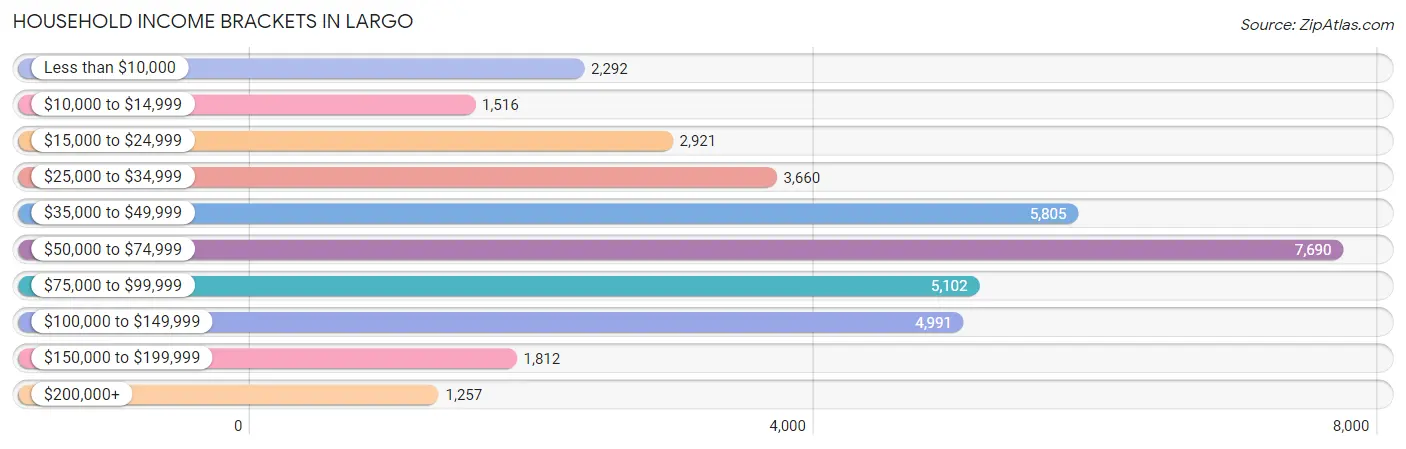
| Income Bracket | # Households | % Households |
| Less than $10,000 | 2,292 | 6.2% |
| $10,000 to $14,999 | 1,516 | 4.1% |
| $15,000 to $24,999 | 2,921 | 7.9% |
| $25,000 to $34,999 | 3,660 | 9.9% |
| $35,000 to $49,999 | 5,805 | 15.7% |
| $50,000 to $74,999 | 7,690 | 20.8% |
| $75,000 to $99,999 | 5,102 | 13.8% |
| $100,000 to $149,999 | 4,991 | 13.5% |
| $150,000 to $199,999 | 1,812 | 4.9% |
| $200,000+ | 1,257 | 3.4% |
Household Income by Householder Age in Largo
The median household income in Largo is $56,266, with the highest median household income of $68,476 found in the 25 to 44 years age bracket for the primary householder. A total of 9,329 households (25.2%) fall into this category. Meanwhile, the 65+ years age bracket for the primary householder has the lowest median household income of $43,807, with 14,060 households (38.0%) in this group.
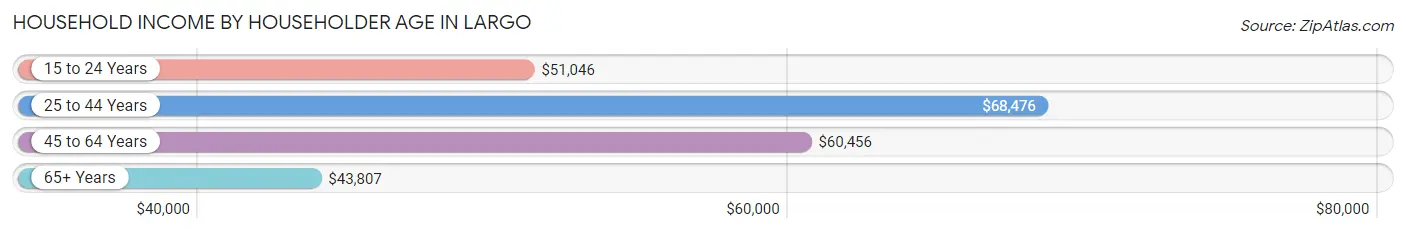
| Income Bracket | # Households | Median Income |
| 15 to 24 Years | 917 (2.5%) | $51,046 |
| 25 to 44 Years | 9,329 (25.2%) | $68,476 |
| 45 to 64 Years | 12,666 (34.3%) | $60,456 |
| 65+ Years | 14,060 (38.0%) | $43,807 |
| Total | 36,972 (100.0%) | $56,266 |
Poverty in Largo
Income Below Poverty by Sex and Age in Largo
With 10.6% poverty level for males and 14.3% for females among the residents of Largo, 6 to 11 year old males and under 5 year old females are the most vulnerable to poverty, with 363 males (19.2%) and 414 females (31.2%) in their respective age groups living below the poverty level.
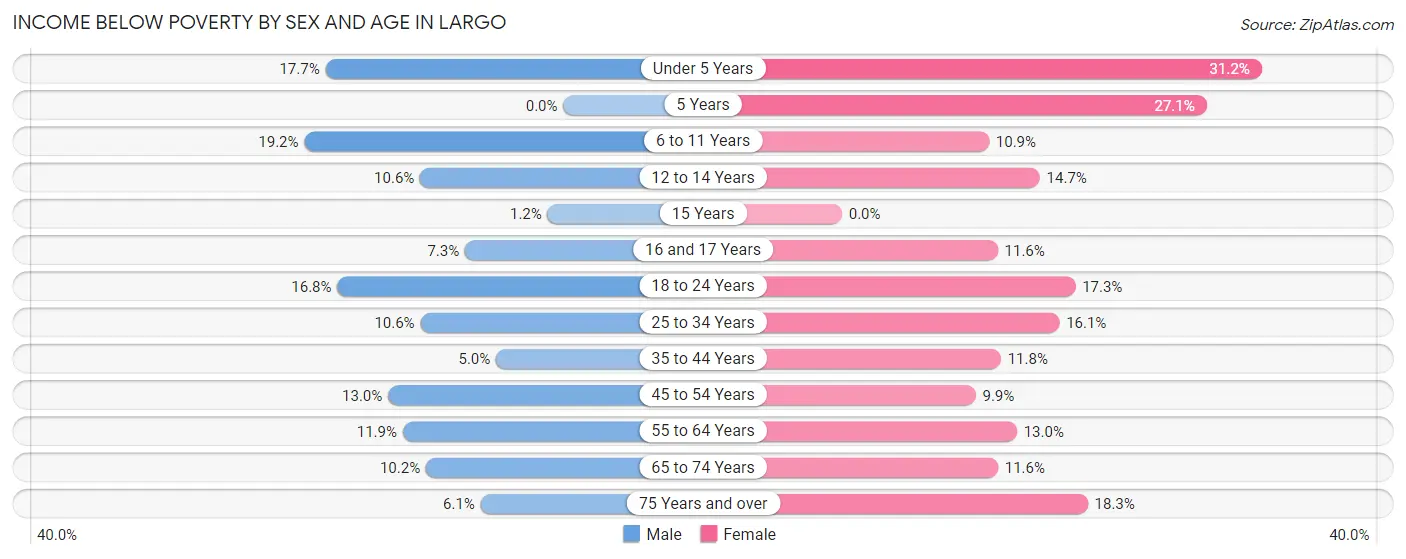
| Age Bracket | Male | Female |
| Under 5 Years | 266 (17.7%) | 414 (31.2%) |
| 5 Years | 0 (0.0%) | 91 (27.1%) |
| 6 to 11 Years | 363 (19.2%) | 253 (10.9%) |
| 12 to 14 Years | 132 (10.6%) | 120 (14.7%) |
| 15 Years | 8 (1.2%) | 0 (0.0%) |
| 16 and 17 Years | 42 (7.3%) | 92 (11.6%) |
| 18 to 24 Years | 410 (16.8%) | 526 (17.3%) |
| 25 to 34 Years | 604 (10.6%) | 854 (16.1%) |
| 35 to 44 Years | 216 (5.0%) | 536 (11.8%) |
| 45 to 54 Years | 632 (13.0%) | 464 (9.9%) |
| 55 to 64 Years | 697 (11.9%) | 900 (13.0%) |
| 65 to 74 Years | 475 (10.2%) | 654 (11.6%) |
| 75 Years and over | 283 (6.1%) | 1,109 (18.2%) |
| Total | 4,128 (10.6%) | 6,013 (14.3%) |
Income Above Poverty by Sex and Age in Largo
According to the poverty statistics in Largo, males aged 5 years and females aged 15 years are the age groups that are most secure financially, with 100.0% of males and 100.0% of females in these age groups living above the poverty line.
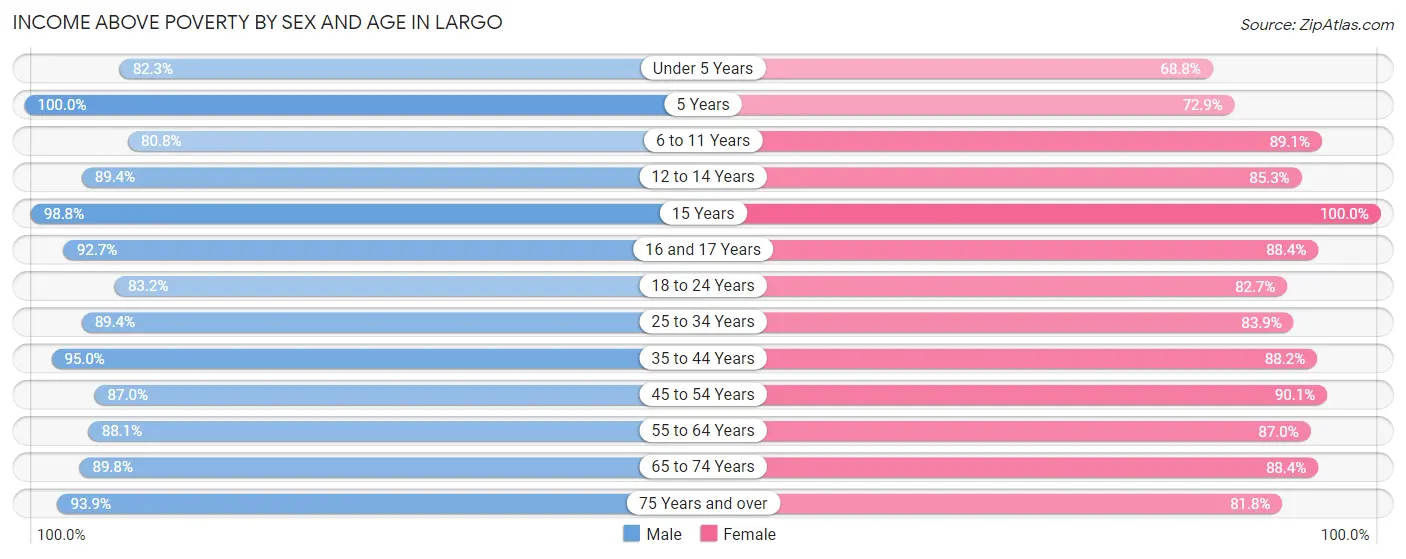
| Age Bracket | Male | Female |
| Under 5 Years | 1,240 (82.3%) | 914 (68.8%) |
| 5 Years | 412 (100.0%) | 245 (72.9%) |
| 6 to 11 Years | 1,525 (80.8%) | 2,063 (89.1%) |
| 12 to 14 Years | 1,110 (89.4%) | 697 (85.3%) |
| 15 Years | 677 (98.8%) | 316 (100.0%) |
| 16 and 17 Years | 533 (92.7%) | 703 (88.4%) |
| 18 to 24 Years | 2,033 (83.2%) | 2,510 (82.7%) |
| 25 to 34 Years | 5,091 (89.4%) | 4,437 (83.9%) |
| 35 to 44 Years | 4,115 (95.0%) | 4,006 (88.2%) |
| 45 to 54 Years | 4,226 (87.0%) | 4,211 (90.1%) |
| 55 to 64 Years | 5,151 (88.1%) | 6,028 (87.0%) |
| 65 to 74 Years | 4,182 (89.8%) | 4,993 (88.4%) |
| 75 Years and over | 4,324 (93.9%) | 4,969 (81.8%) |
| Total | 34,619 (89.3%) | 36,092 (85.7%) |
Income Below Poverty Among Married-Couple Families in Largo
The poverty statistics for married-couple families in Largo show that 3.4% or 420 of the total 12,383 families live below the poverty line. Families with 3 or 4 children have the highest poverty rate of 12.1%, comprising of 40 families. On the other hand, families with 5 or more children have the lowest poverty rate of 0.0%, which includes 0 families.
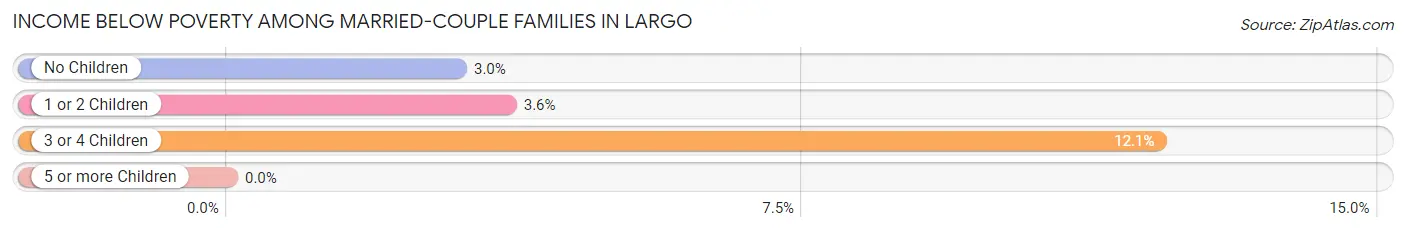
| Children | Above Poverty | Below Poverty |
| No Children | 8,552 (97.0%) | 264 (3.0%) |
| 1 or 2 Children | 3,072 (96.4%) | 116 (3.6%) |
| 3 or 4 Children | 290 (87.9%) | 40 (12.1%) |
| 5 or more Children | 49 (100.0%) | 0 (0.0%) |
| Total | 11,963 (96.6%) | 420 (3.4%) |
Income Below Poverty Among Single-Parent Households in Largo
According to the poverty data in Largo, 15.2% or 242 single-father households and 15.8% or 689 single-mother households are living below the poverty line. Among single-father households, those with 1 or 2 children have the highest poverty rate, with 175 households (29.1%) experiencing poverty. Likewise, among single-mother households, those with 5 or more children have the highest poverty rate, with 22 households (100.0%) falling below the poverty line.
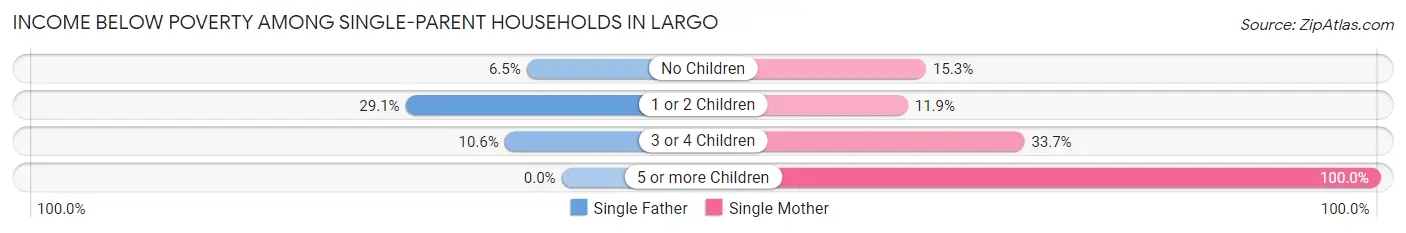
| Children | Single Father | Single Mother |
| No Children | 60 (6.5%) | 282 (15.3%) |
| 1 or 2 Children | 175 (29.1%) | 251 (11.9%) |
| 3 or 4 Children | 7 (10.6%) | 134 (33.7%) |
| 5 or more Children | 0 (0.0%) | 22 (100.0%) |
| Total | 242 (15.2%) | 689 (15.8%) |
Income Below Poverty Among Married-Couple vs Single-Parent Households in Largo
The poverty data for Largo shows that 420 of the married-couple family households (3.4%) and 931 of the single-parent households (15.7%) are living below the poverty level. Within the married-couple family households, those with 3 or 4 children have the highest poverty rate, with 40 households (12.1%) falling below the poverty line. Among the single-parent households, those with 5 or more children have the highest poverty rate, with 22 household (100.0%) living below poverty.
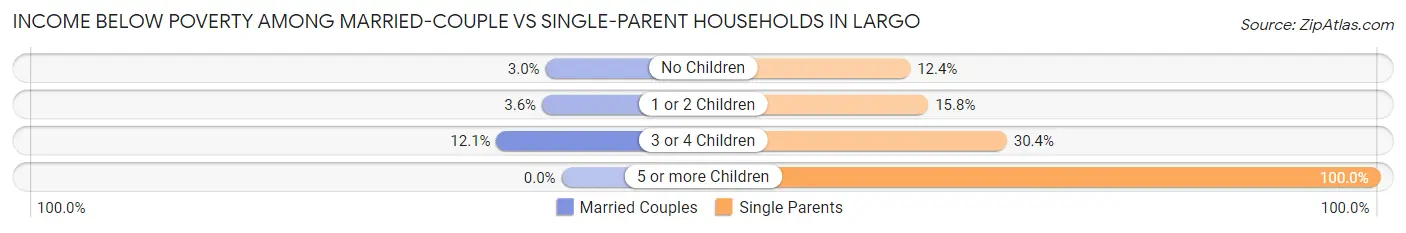
| Children | Married-Couple Families | Single-Parent Households |
| No Children | 264 (3.0%) | 342 (12.4%) |
| 1 or 2 Children | 116 (3.6%) | 426 (15.8%) |
| 3 or 4 Children | 40 (12.1%) | 141 (30.4%) |
| 5 or more Children | 0 (0.0%) | 22 (100.0%) |
| Total | 420 (3.4%) | 931 (15.7%) |
Race in Largo
The most populous races in Largo are White / Caucasian (64,184 | 77.8%), Hispanic or Latino (10,559 | 12.8%), and Black / African American (7,319 | 8.9%).
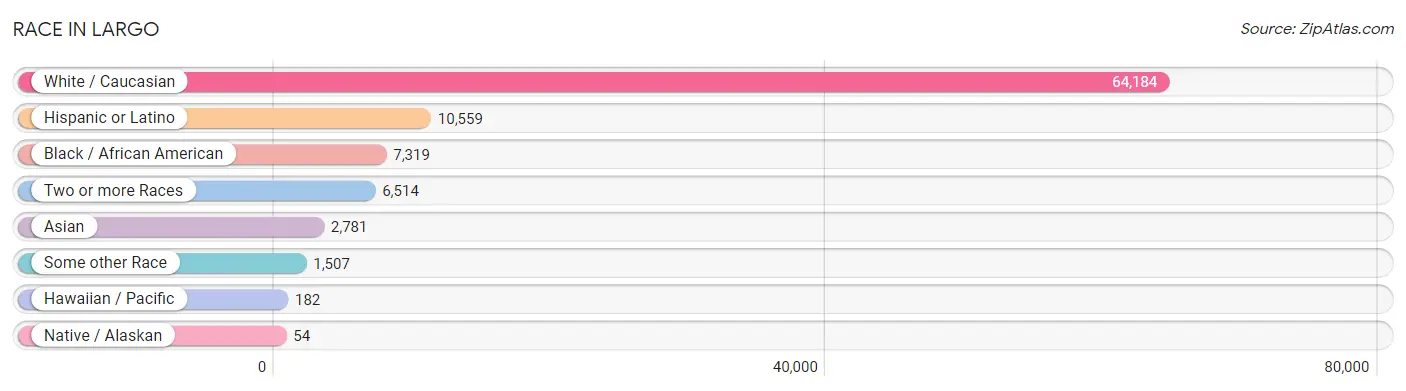
| Race | # Population | % Population |
| Asian | 2,781 | 3.4% |
| Black / African American | 7,319 | 8.9% |
| Hawaiian / Pacific | 182 | 0.2% |
| Hispanic or Latino | 10,559 | 12.8% |
| Native / Alaskan | 54 | 0.1% |
| White / Caucasian | 64,184 | 77.8% |
| Two or more Races | 6,514 | 7.9% |
| Some other Race | 1,507 | 1.8% |
| Total | 82,541 | 100.0% |
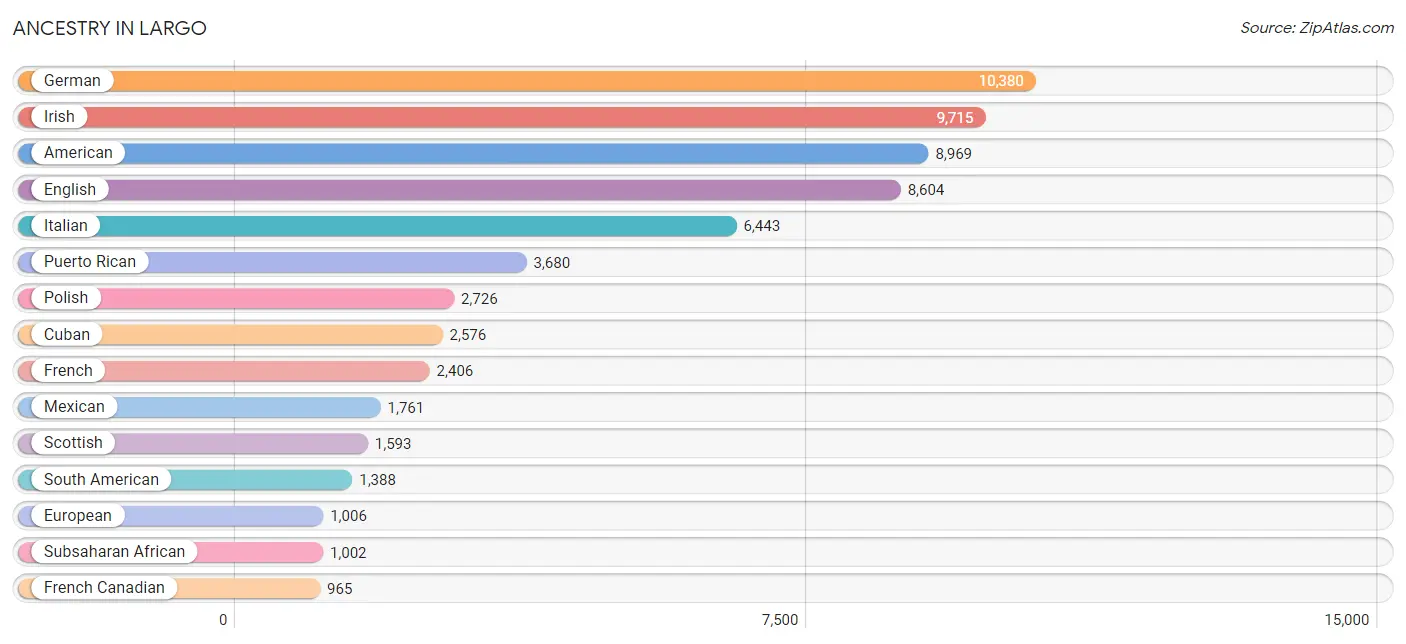
Ancestry in Largo
The most populous ancestries reported in Largo are German (10,380 | 12.6%), Irish (9,715 | 11.8%), American (8,969 | 10.9%), English (8,604 | 10.4%), and Italian (6,443 | 7.8%), together accounting for 53.4% of all Largo residents.
| Ancestry | # Population | % Population |
| African | 918 | 1.1% |
| Albanian | 209 | 0.3% |
| American | 8,969 | 10.9% |
| Arab | 235 | 0.3% |
| Argentinean | 63 | 0.1% |
| Armenian | 84 | 0.1% |
| Austrian | 184 | 0.2% |
| Bahamian | 9 | 0.0% |
| Belgian | 12 | 0.0% |
| Belizean | 9 | 0.0% |
| Bhutanese | 75 | 0.1% |
| Blackfeet | 3 | 0.0% |
| Bolivian | 35 | 0.0% |
| Brazilian | 211 | 0.3% |
| British | 586 | 0.7% |
| British West Indian | 34 | 0.0% |
| Bulgarian | 87 | 0.1% |
| Burmese | 376 | 0.5% |
| Cajun | 8 | 0.0% |
| Canadian | 337 | 0.4% |
| Cape Verdean | 55 | 0.1% |
| Central American | 188 | 0.2% |
| Central American Indian | 8 | 0.0% |
| Cherokee | 335 | 0.4% |
| Chickasaw | 16 | 0.0% |
| Chilean | 9 | 0.0% |
| Chinese | 4 | 0.0% |
| Chippewa | 8 | 0.0% |
| Colombian | 769 | 0.9% |
| Costa Rican | 91 | 0.1% |
| Croatian | 125 | 0.2% |
| Cuban | 2,576 | 3.1% |
| Czech | 111 | 0.1% |
| Czechoslovakian | 51 | 0.1% |
| Danish | 123 | 0.2% |
| Dominican | 300 | 0.4% |
| Dutch | 638 | 0.8% |
| Eastern European | 253 | 0.3% |
| Ecuadorian | 57 | 0.1% |
| Egyptian | 41 | 0.1% |
| English | 8,604 | 10.4% |
| European | 1,006 | 1.2% |
| Filipino | 13 | 0.0% |
| Finnish | 103 | 0.1% |
| French | 2,406 | 2.9% |
| French American Indian | 29 | 0.0% |
| French Canadian | 965 | 1.2% |
| German | 10,380 | 12.6% |
| Greek | 656 | 0.8% |
| Guyanese | 55 | 0.1% |
| Haitian | 378 | 0.5% |
| Honduran | 59 | 0.1% |
| Hungarian | 457 | 0.5% |
| Indian (Asian) | 421 | 0.5% |
| Inupiat | 3 | 0.0% |
| Irish | 9,715 | 11.8% |
| Israeli | 20 | 0.0% |
| Italian | 6,443 | 7.8% |
| Jamaican | 233 | 0.3% |
| Japanese | 13 | 0.0% |
| Jordanian | 7 | 0.0% |
| Kenyan | 14 | 0.0% |
| Korean | 922 | 1.1% |
| Laotian | 24 | 0.0% |
| Latvian | 12 | 0.0% |
| Lebanese | 54 | 0.1% |
| Lithuanian | 251 | 0.3% |
| Macedonian | 22 | 0.0% |
| Malaysian | 266 | 0.3% |
| Mexican | 1,761 | 2.1% |
| Mexican American Indian | 8 | 0.0% |
| Moroccan | 8 | 0.0% |
| Native Hawaiian | 74 | 0.1% |
| Nicaraguan | 26 | 0.0% |
| Northern European | 111 | 0.1% |
| Norwegian | 635 | 0.8% |
| Pakistani | 94 | 0.1% |
| Pennsylvania German | 11 | 0.0% |
| Peruvian | 55 | 0.1% |
| Polish | 2,726 | 3.3% |
| Portuguese | 565 | 0.7% |
| Puerto Rican | 3,680 | 4.5% |
| Romanian | 53 | 0.1% |
| Russian | 515 | 0.6% |
| Salvadoran | 12 | 0.0% |
| Scandinavian | 154 | 0.2% |
| Scotch-Irish | 753 | 0.9% |
| Scottish | 1,593 | 1.9% |
| Serbian | 91 | 0.1% |
| Sierra Leonean | 15 | 0.0% |
| Sioux | 7 | 0.0% |
| Slavic | 25 | 0.0% |
| Slovak | 218 | 0.3% |
| Slovene | 200 | 0.2% |
| South African | 15 | 0.0% |
| South American | 1,388 | 1.7% |
| South American Indian | 12 | 0.0% |
| Spaniard | 166 | 0.2% |
| Spanish | 125 | 0.2% |
| Sri Lankan | 473 | 0.6% |
| Subsaharan African | 1,002 | 1.2% |
| Swedish | 758 | 0.9% |
| Swiss | 93 | 0.1% |
| Syrian | 41 | 0.1% |
| Thai | 566 | 0.7% |
| Trinidadian and Tobagonian | 68 | 0.1% |
| Turkish | 23 | 0.0% |
| Ukrainian | 432 | 0.5% |
| Uruguayan | 48 | 0.1% |
| Venezuelan | 352 | 0.4% |
| Welsh | 452 | 0.5% |
| West Indian | 16 | 0.0% |
| Yugoslavian | 335 | 0.4% | View All 113 Rows |
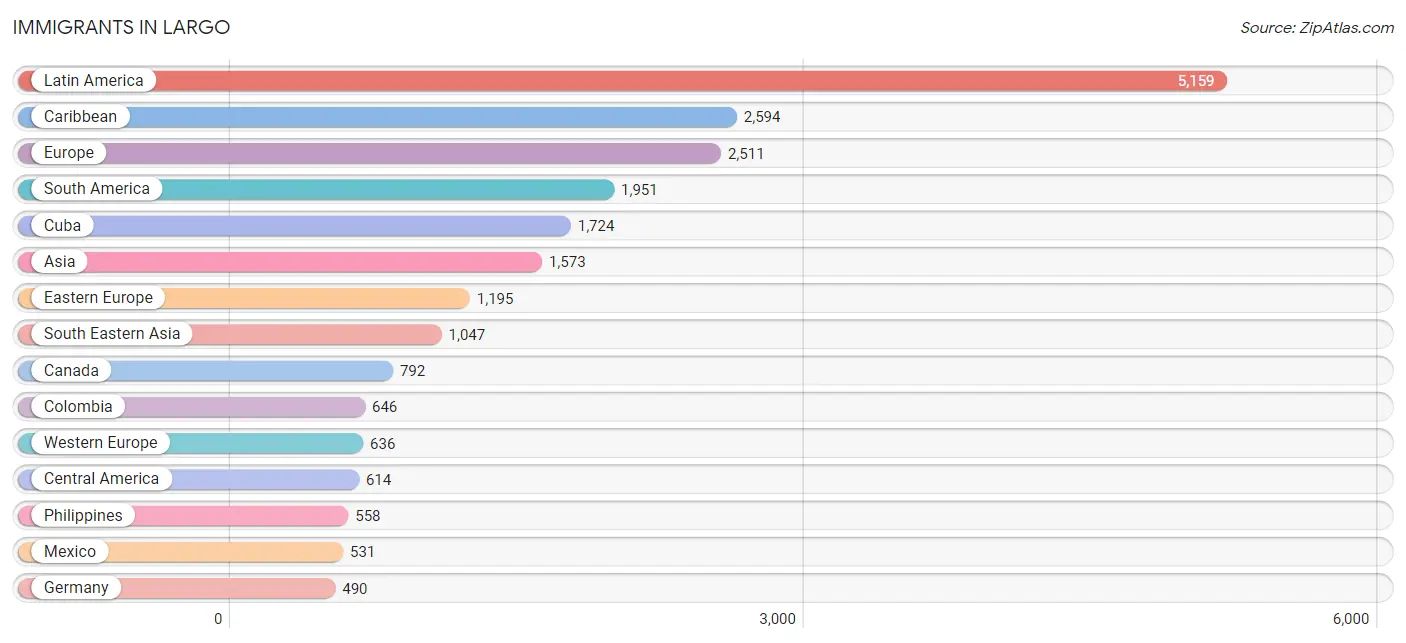
Immigrants in Largo
The most numerous immigrant groups reported in Largo came from Latin America (5,159 | 6.2%), Caribbean (2,594 | 3.1%), Europe (2,511 | 3.0%), South America (1,951 | 2.4%), and Cuba (1,724 | 2.1%), together accounting for 16.9% of all Largo residents.
| Immigration Origin | # Population | % Population |
| Africa | 134 | 0.2% |
| Albania | 174 | 0.2% |
| Armenia | 39 | 0.1% |
| Asia | 1,573 | 1.9% |
| Australia | 111 | 0.1% |
| Austria | 26 | 0.0% |
| Bolivia | 19 | 0.0% |
| Bosnia and Herzegovina | 273 | 0.3% |
| Brazil | 389 | 0.5% |
| Bulgaria | 14 | 0.0% |
| Canada | 792 | 1.0% |
| Caribbean | 2,594 | 3.1% |
| Central America | 614 | 0.7% |
| Chile | 15 | 0.0% |
| China | 98 | 0.1% |
| Colombia | 646 | 0.8% |
| Costa Rica | 17 | 0.0% |
| Croatia | 67 | 0.1% |
| Cuba | 1,724 | 2.1% |
| Denmark | 18 | 0.0% |
| Dominican Republic | 298 | 0.4% |
| Eastern Africa | 53 | 0.1% |
| Eastern Asia | 151 | 0.2% |
| Eastern Europe | 1,195 | 1.5% |
| Ecuador | 73 | 0.1% |
| Egypt | 41 | 0.1% |
| El Salvador | 12 | 0.0% |
| England | 141 | 0.2% |
| Europe | 2,511 | 3.0% |
| France | 18 | 0.0% |
| Germany | 490 | 0.6% |
| Greece | 73 | 0.1% |
| Guyana | 341 | 0.4% |
| Haiti | 431 | 0.5% |
| Honduras | 40 | 0.1% |
| Hungary | 139 | 0.2% |
| India | 238 | 0.3% |
| Indonesia | 8 | 0.0% |
| Ireland | 27 | 0.0% |
| Israel | 13 | 0.0% |
| Italy | 59 | 0.1% |
| Jamaica | 47 | 0.1% |
| Japan | 3 | 0.0% |
| Jordan | 16 | 0.0% |
| Kenya | 16 | 0.0% |
| Korea | 50 | 0.1% |
| Laos | 128 | 0.2% |
| Latin America | 5,159 | 6.2% |
| Mexico | 531 | 0.6% |
| Micronesia | 41 | 0.1% |
| Moldova | 45 | 0.1% |
| Morocco | 8 | 0.0% |
| Netherlands | 64 | 0.1% |
| Nicaragua | 14 | 0.0% |
| Nigeria | 17 | 0.0% |
| North Macedonia | 31 | 0.0% |
| Northern Africa | 49 | 0.1% |
| Northern Europe | 464 | 0.6% |
| Norway | 50 | 0.1% |
| Oceania | 152 | 0.2% |
| Pakistan | 13 | 0.0% |
| Peru | 71 | 0.1% |
| Philippines | 558 | 0.7% |
| Poland | 234 | 0.3% |
| Portugal | 84 | 0.1% |
| Romania | 12 | 0.0% |
| Russia | 130 | 0.2% |
| Saudi Arabia | 23 | 0.0% |
| Scotland | 93 | 0.1% |
| Serbia | 5 | 0.0% |
| Sierra Leone | 15 | 0.0% |
| South America | 1,951 | 2.4% |
| South Central Asia | 261 | 0.3% |
| South Eastern Asia | 1,047 | 1.3% |
| Southern Europe | 216 | 0.3% |
| Sri Lanka | 10 | 0.0% |
| Switzerland | 38 | 0.1% |
| Taiwan | 9 | 0.0% |
| Thailand | 94 | 0.1% |
| Trinidad and Tobago | 94 | 0.1% |
| Turkey | 23 | 0.0% |
| Ukraine | 31 | 0.0% |
| Uruguay | 48 | 0.1% |
| Venezuela | 349 | 0.4% |
| Vietnam | 259 | 0.3% |
| Western Africa | 32 | 0.0% |
| Western Asia | 114 | 0.1% |
| Western Europe | 636 | 0.8% | View All 88 Rows |
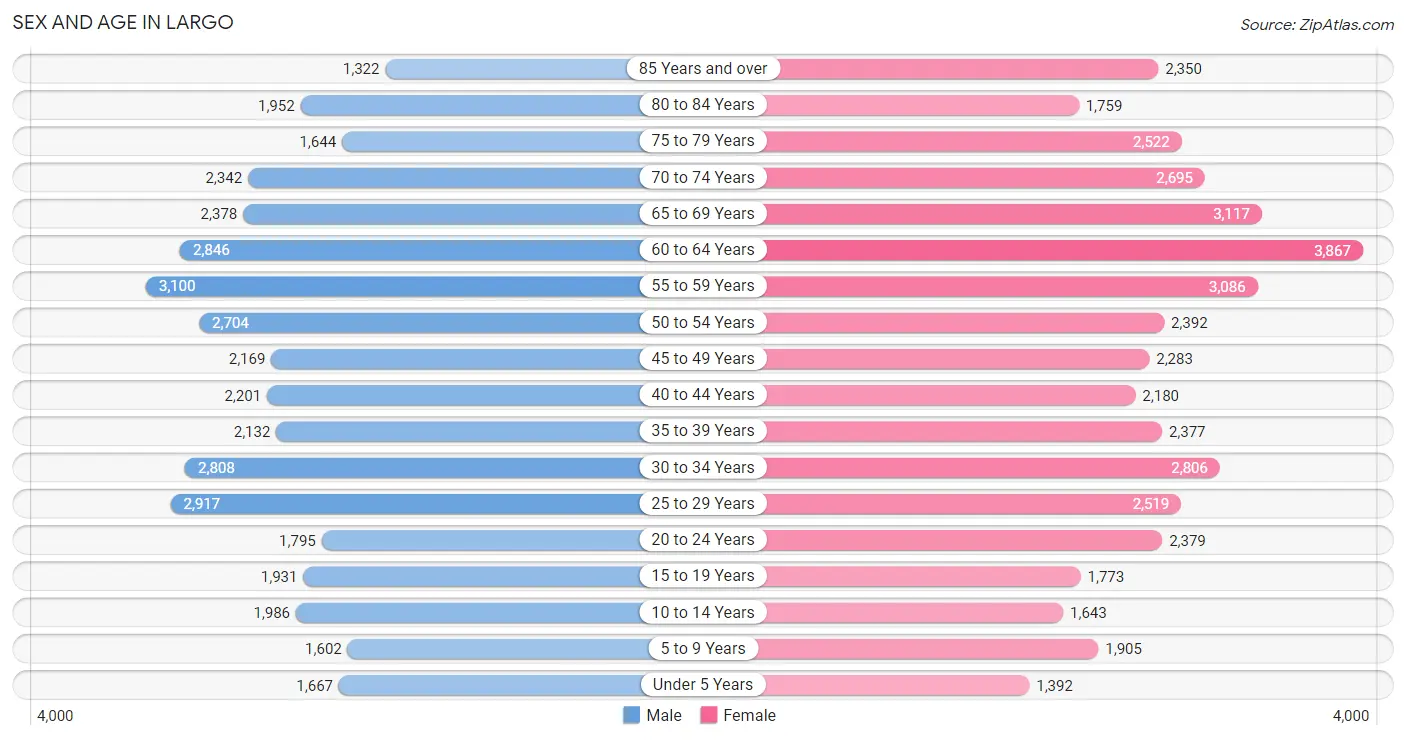
Sex and Age in Largo
Sex and Age in Largo
The most populous age groups in Largo are 55 to 59 Years (3,100 | 7.9%) for men and 60 to 64 Years (3,867 | 9.0%) for women.
| Age Bracket | Male | Female |
| Under 5 Years | 1,667 (4.2%) | 1,392 (3.2%) |
| 5 to 9 Years | 1,602 (4.1%) | 1,905 (4.4%) |
| 10 to 14 Years | 1,986 (5.0%) | 1,643 (3.8%) |
| 15 to 19 Years | 1,931 (4.9%) | 1,773 (4.1%) |
| 20 to 24 Years | 1,795 (4.5%) | 2,379 (5.5%) |
| 25 to 29 Years | 2,917 (7.4%) | 2,519 (5.9%) |
| 30 to 34 Years | 2,808 (7.1%) | 2,806 (6.5%) |
| 35 to 39 Years | 2,132 (5.4%) | 2,377 (5.5%) |
| 40 to 44 Years | 2,201 (5.6%) | 2,180 (5.1%) |
| 45 to 49 Years | 2,169 (5.5%) | 2,283 (5.3%) |
| 50 to 54 Years | 2,704 (6.9%) | 2,392 (5.6%) |
| 55 to 59 Years | 3,100 (7.9%) | 3,086 (7.2%) |
| 60 to 64 Years | 2,846 (7.2%) | 3,867 (9.0%) |
| 65 to 69 Years | 2,378 (6.0%) | 3,117 (7.2%) |
| 70 to 74 Years | 2,342 (5.9%) | 2,695 (6.3%) |
| 75 to 79 Years | 1,644 (4.2%) | 2,522 (5.9%) |
| 80 to 84 Years | 1,952 (4.9%) | 1,759 (4.1%) |
| 85 Years and over | 1,322 (3.4%) | 2,350 (5.5%) |
| Total | 39,496 (100.0%) | 43,045 (100.0%) |
Families and Households in Largo
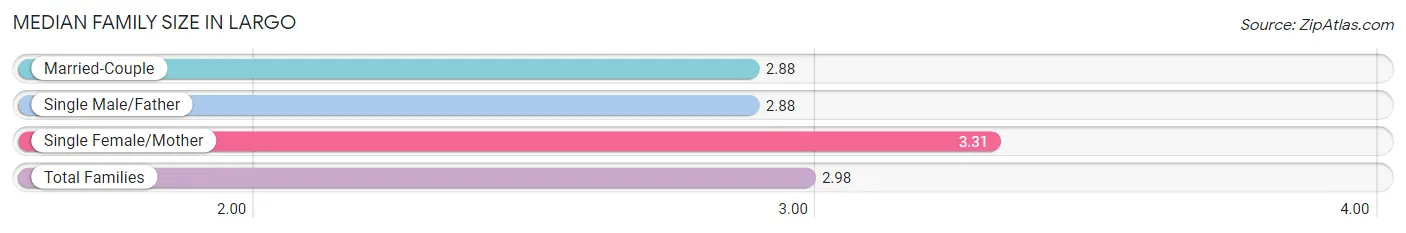
Median Family Size in Largo
The median family size in Largo is 2.98 persons per family, with single female/mother families (4,360 | 23.8%) accounting for the largest median family size of 3.31 persons per family. On the other hand, married-couple families (12,383 | 67.5%) represent the smallest median family size with 2.88 persons per family.
| Family Type | # Families | Family Size |
| Married-Couple | 12,383 (67.5%) | 2.88 |
| Single Male/Father | 1,590 (8.7%) | 2.88 |
| Single Female/Mother | 4,360 (23.8%) | 3.31 |
| Total Families | 18,333 (100.0%) | 2.98 |
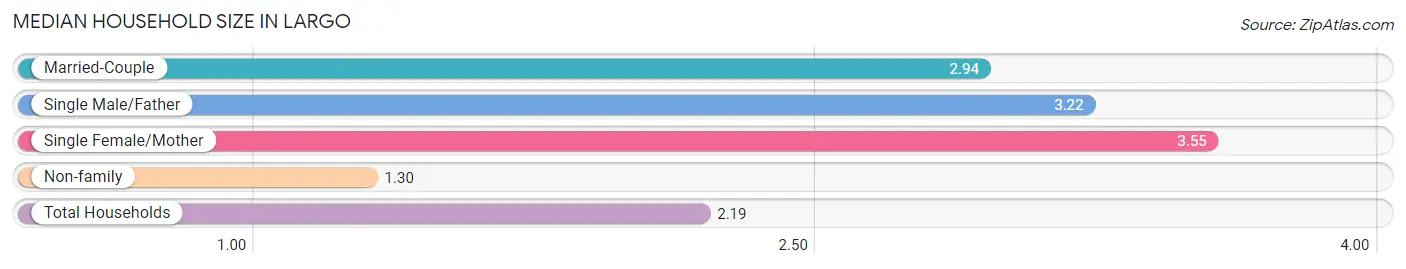
Median Household Size in Largo
The median household size in Largo is 2.19 persons per household, with single female/mother households (4,360 | 11.8%) accounting for the largest median household size of 3.55 persons per household. non-family households (18,639 | 50.4%) represent the smallest median household size with 1.30 persons per household.
| Household Type | # Households | Household Size |
| Married-Couple | 12,383 (33.5%) | 2.94 |
| Single Male/Father | 1,590 (4.3%) | 3.22 |
| Single Female/Mother | 4,360 (11.8%) | 3.55 |
| Non-family | 18,639 (50.4%) | 1.30 |
| Total Households | 36,972 (100.0%) | 2.19 |
Household Size by Marriage Status in Largo
Out of a total of 36,972 households in Largo, 18,333 (49.6%) are family households, while 18,639 (50.4%) are nonfamily households. The most numerous type of family households are 2-person households, comprising 10,123, and the most common type of nonfamily households are 1-person households, comprising 14,691.
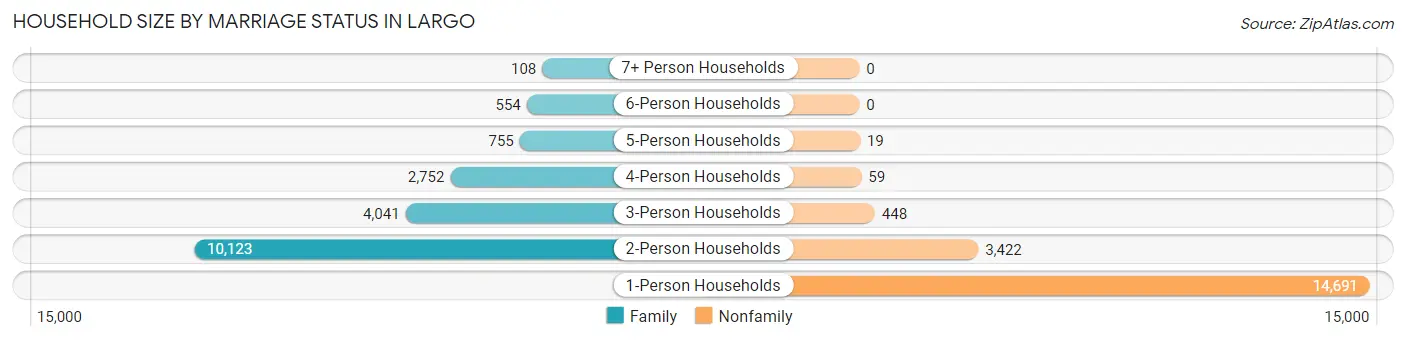
| Household Size | Family Households | Nonfamily Households |
| 1-Person Households | - | 14,691 (39.7%) |
| 2-Person Households | 10,123 (27.4%) | 3,422 (9.3%) |
| 3-Person Households | 4,041 (10.9%) | 448 (1.2%) |
| 4-Person Households | 2,752 (7.4%) | 59 (0.2%) |
| 5-Person Households | 755 (2.0%) | 19 (0.1%) |
| 6-Person Households | 554 (1.5%) | 0 (0.0%) |
| 7+ Person Households | 108 (0.3%) | 0 (0.0%) |
| Total | 18,333 (49.6%) | 18,639 (50.4%) |
Female Fertility in Largo
Fertility by Age in Largo
Average fertility rate in Largo is 57.0 births per 1,000 women. Women in the age bracket of 20 to 34 years have the highest fertility rate with 82.0 births per 1,000 women. Women in the age bracket of 20 to 34 years acount for 66.2% of all women with births.
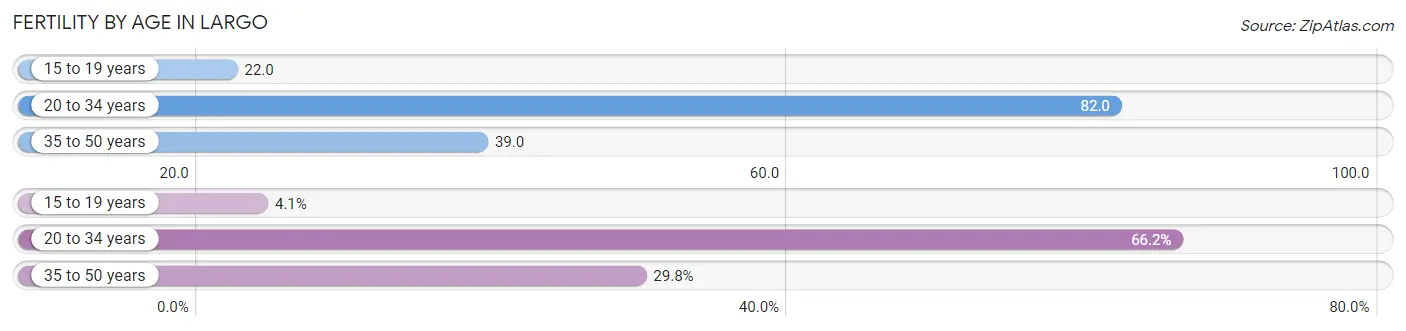
| Age Bracket | Women with Births | Births / 1,000 Women |
| 15 to 19 years | 39 (4.1%) | 22.0 |
| 20 to 34 years | 634 (66.2%) | 82.0 |
| 35 to 50 years | 285 (29.7%) | 39.0 |
| Total | 958 (100.0%) | 57.0 |
Fertility by Age by Marriage Status in Largo
42.5% of women with births (958) in Largo are married. The highest percentage of unmarried women with births falls into 15 to 19 years age bracket with 100.0% of them unmarried at the time of birth, while the lowest percentage of unmarried women with births belong to 35 to 50 years age bracket with 30.2% of them unmarried.
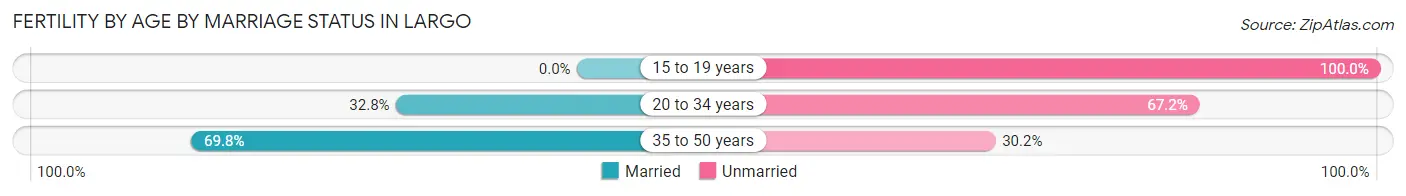
| Age Bracket | Married | Unmarried |
| 15 to 19 years | 0 (0.0%) | 39 (100.0%) |
| 20 to 34 years | 208 (32.8%) | 426 (67.2%) |
| 35 to 50 years | 199 (69.8%) | 86 (30.2%) |
| Total | 407 (42.5%) | 551 (57.5%) |
Fertility by Education in Largo
Average fertility rate in Largo is 57.0 births per 1,000 women. Women with the education attainment of bachelor's degree have the highest fertility rate of 94.0 births per 1,000 women, while women with the education attainment of less than high school have the lowest fertility at 16.0 births per 1,000 women. Women with the education attainment of bachelor's degree represent 39.0% of all women with births.
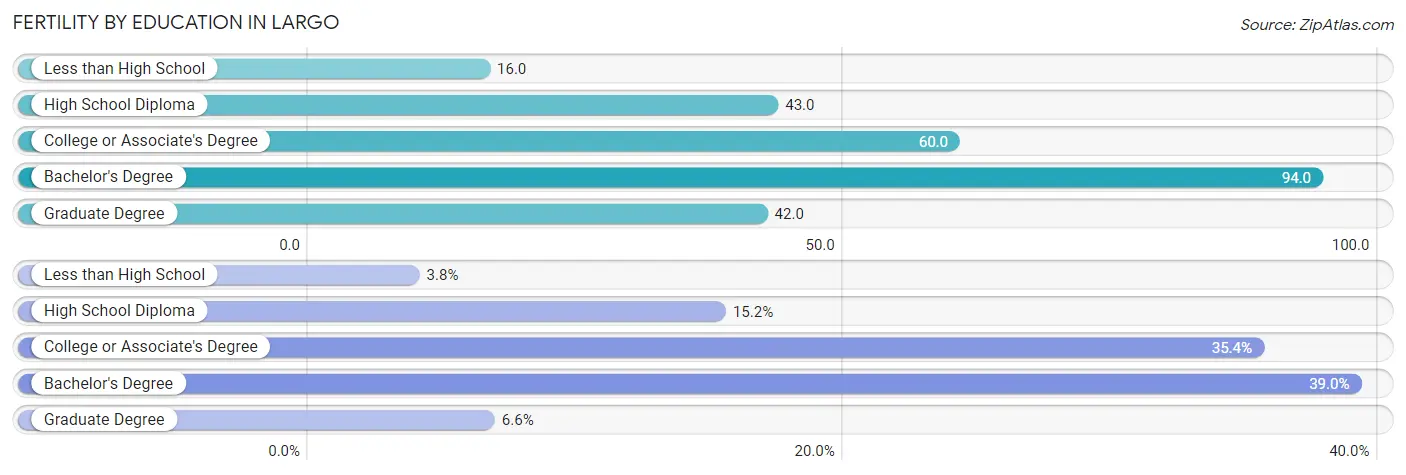
| Educational Attainment | Women with Births | Births / 1,000 Women |
| Less than High School | 36 (3.8%) | 16.0 |
| High School Diploma | 146 (15.2%) | 43.0 |
| College or Associate's Degree | 339 (35.4%) | 60.0 |
| Bachelor's Degree | 374 (39.0%) | 94.0 |
| Graduate Degree | 63 (6.6%) | 42.0 |
| Total | 958 (100.0%) | 57.0 |
Fertility by Education by Marriage Status in Largo
57.5% of women with births in Largo are unmarried. Women with the educational attainment of high school diploma are most likely to be married with 81.5% of them married at childbirth, while women with the educational attainment of less than high school are least likely to be married with 100.0% of them unmarried at childbirth.
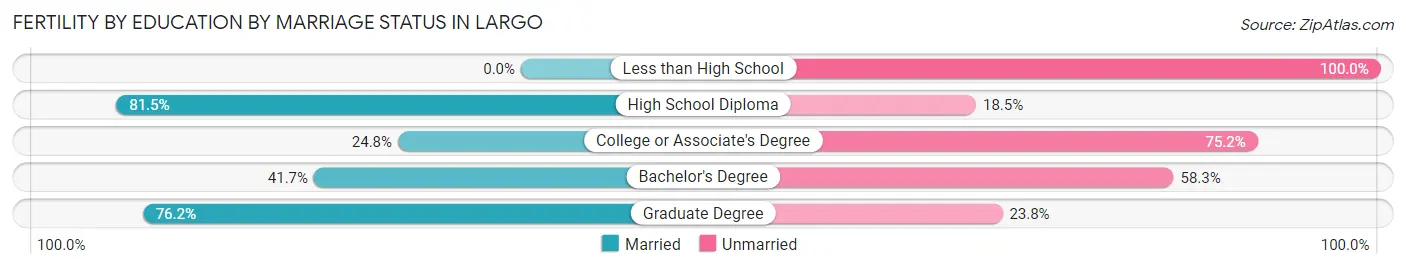
| Educational Attainment | Married | Unmarried |
| Less than High School | 0 (0.0%) | 36 (100.0%) |
| High School Diploma | 119 (81.5%) | 27 (18.5%) |
| College or Associate's Degree | 84 (24.8%) | 255 (75.2%) |
| Bachelor's Degree | 156 (41.7%) | 218 (58.3%) |
| Graduate Degree | 48 (76.2%) | 15 (23.8%) |
| Total | 407 (42.5%) | 551 (57.5%) |
Employment Characteristics in Largo
Employment by Class of Employer in Largo
Among the 38,991 employed individuals in Largo, private company employees (27,992 | 71.8%), not-for-profit organizations (2,710 | 7.0%), and local government employees (2,518 | 6.5%) make up the most common classes of employment.
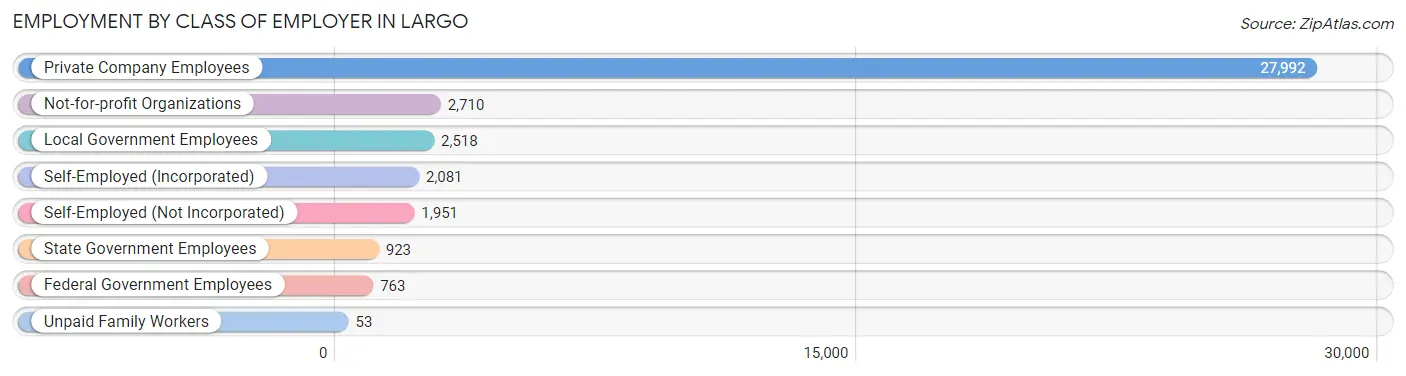
| Employer Class | # Employees | % Employees |
| Private Company Employees | 27,992 | 71.8% |
| Self-Employed (Incorporated) | 2,081 | 5.3% |
| Self-Employed (Not Incorporated) | 1,951 | 5.0% |
| Not-for-profit Organizations | 2,710 | 7.0% |
| Local Government Employees | 2,518 | 6.5% |
| State Government Employees | 923 | 2.4% |
| Federal Government Employees | 763 | 2.0% |
| Unpaid Family Workers | 53 | 0.1% |
| Total | 38,991 | 100.0% |
Employment Status by Age in Largo
According to the labor force statistics for Largo, out of the total population over 16 years of age (71,345), 58.7% or 41,880 individuals are in the labor force, with 5.0% or 2,094 of them unemployed. The age group with the highest labor force participation rate is 25 to 29 years, with 88.8% or 4,827 individuals in the labor force. Within the labor force, the 16 to 19 years age range has the highest percentage of unemployed individuals, with 22.5% or 279 of them being unemployed.
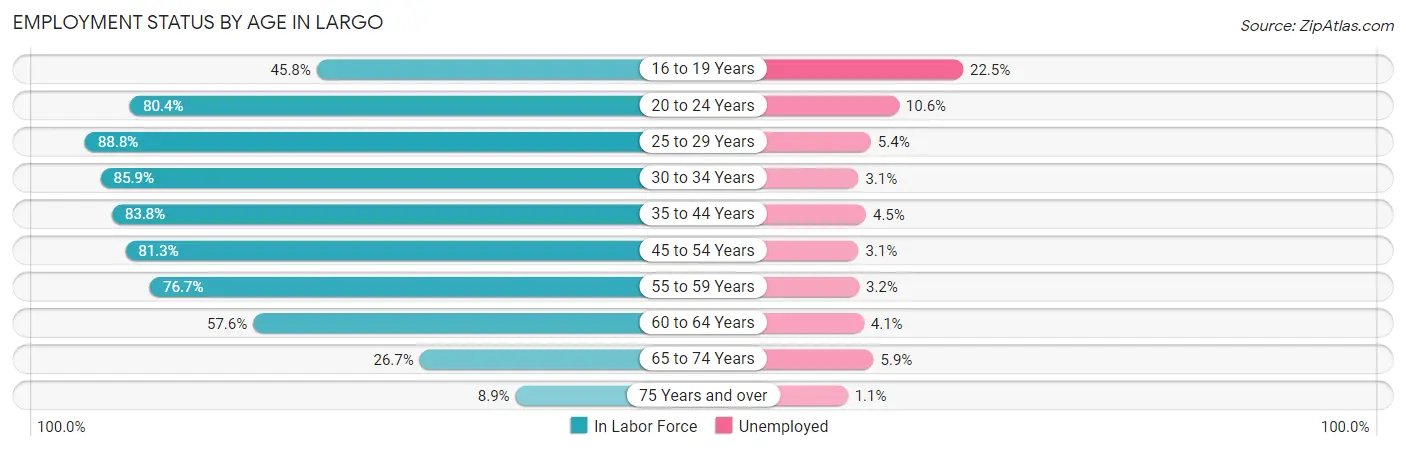
| Age Bracket | In Labor Force | Unemployed |
| 16 to 19 Years | 1,238 (45.8%) | 279 (22.5%) |
| 20 to 24 Years | 3,356 (80.4%) | 356 (10.6%) |
| 25 to 29 Years | 4,827 (88.8%) | 261 (5.4%) |
| 30 to 34 Years | 4,822 (85.9%) | 149 (3.1%) |
| 35 to 44 Years | 7,450 (83.8%) | 335 (4.5%) |
| 45 to 54 Years | 7,763 (81.3%) | 241 (3.1%) |
| 55 to 59 Years | 4,745 (76.7%) | 152 (3.2%) |
| 60 to 64 Years | 3,867 (57.6%) | 159 (4.1%) |
| 65 to 74 Years | 2,812 (26.7%) | 166 (5.9%) |
| 75 Years and over | 1,028 (8.9%) | 11 (1.1%) |
| Total | 41,880 (58.7%) | 2,094 (5.0%) |
Employment Status by Educational Attainment in Largo
According to labor force statistics for Largo, 79.0% of individuals (33,486) out of the total population between 25 and 64 years of age (42,387) are in the labor force, with 3.9% or 1,306 of them being unemployed. The group with the highest labor force participation rate are those with the educational attainment of bachelor's degree or higher, with 87.3% or 11,271 individuals in the labor force. Within the labor force, individuals with less than high school education have the highest percentage of unemployment, with 8.8% or 157 of them being unemployed.
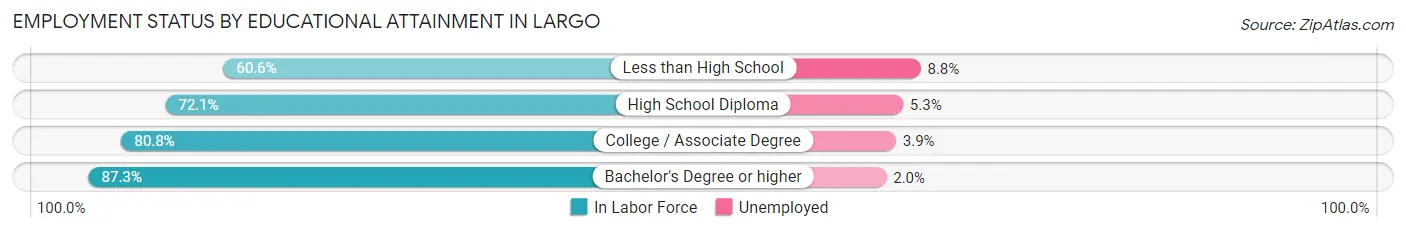
| Educational Attainment | In Labor Force | Unemployed |
| Less than High School | 1,779 (60.6%) | 258 (8.8%) |
| High School Diploma | 8,483 (72.1%) | 624 (5.3%) |
| College / Associate Degree | 11,938 (80.8%) | 576 (3.9%) |
| Bachelor's Degree or higher | 11,271 (87.3%) | 258 (2.0%) |
| Total | 33,486 (79.0%) | 1,653 (3.9%) |
Employment Occupations by Sex in Largo
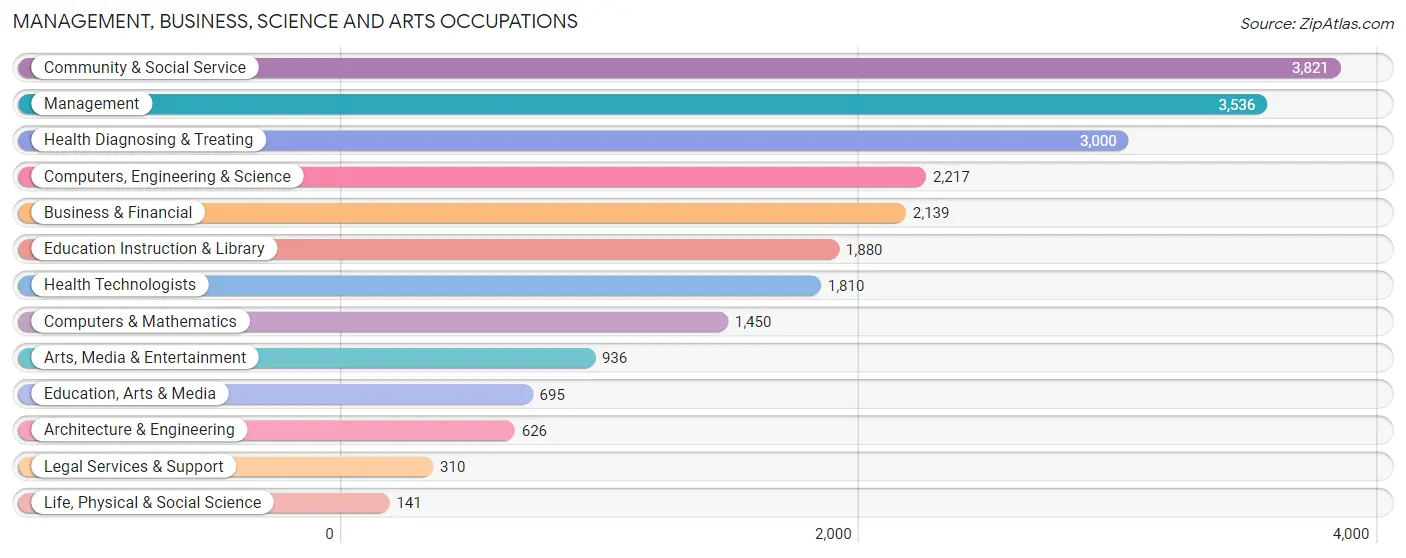
Management, Business, Science and Arts Occupations
The most common Management, Business, Science and Arts occupations in Largo are Community & Social Service (3,821 | 9.6%), Management (3,536 | 8.9%), Health Diagnosing & Treating (3,000 | 7.5%), Computers, Engineering & Science (2,217 | 5.6%), and Business & Financial (2,139 | 5.4%).
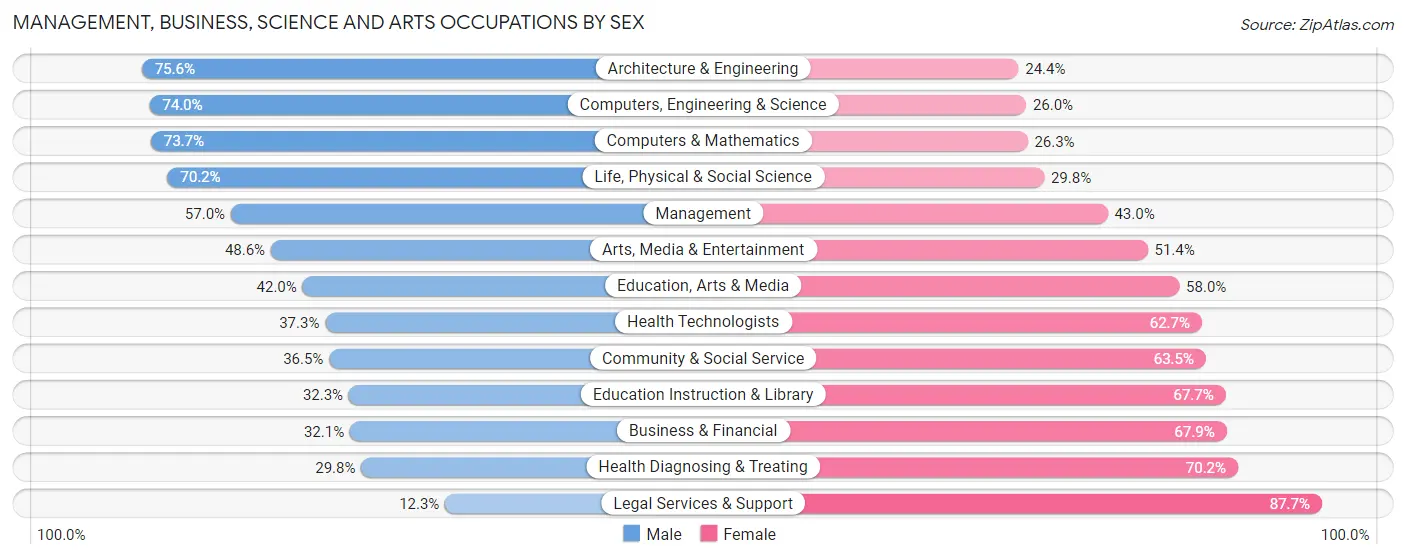
Management, Business, Science and Arts Occupations by Sex
Within the Management, Business, Science and Arts occupations in Largo, the most male-oriented occupations are Architecture & Engineering (75.6%), Computers, Engineering & Science (74.0%), and Computers & Mathematics (73.7%), while the most female-oriented occupations are Legal Services & Support (87.7%), Health Diagnosing & Treating (70.2%), and Business & Financial (67.9%).
| Occupation | Male | Female |
| Management | 2,014 (57.0%) | 1,522 (43.0%) |
| Business & Financial | 687 (32.1%) | 1,452 (67.9%) |
| Computers, Engineering & Science | 1,640 (74.0%) | 577 (26.0%) |
| Computers & Mathematics | 1,068 (73.7%) | 382 (26.3%) |
| Architecture & Engineering | 473 (75.6%) | 153 (24.4%) |
| Life, Physical & Social Science | 99 (70.2%) | 42 (29.8%) |
| Community & Social Service | 1,393 (36.5%) | 2,428 (63.5%) |
| Education, Arts & Media | 292 (42.0%) | 403 (58.0%) |
| Legal Services & Support | 38 (12.3%) | 272 (87.7%) |
| Education Instruction & Library | 608 (32.3%) | 1,272 (67.7%) |
| Arts, Media & Entertainment | 455 (48.6%) | 481 (51.4%) |
| Health Diagnosing & Treating | 893 (29.8%) | 2,107 (70.2%) |
| Health Technologists | 675 (37.3%) | 1,135 (62.7%) |
| Total (Category) | 6,627 (45.0%) | 8,086 (55.0%) |
| Total (Overall) | 19,541 (49.2%) | 20,172 (50.8%) |
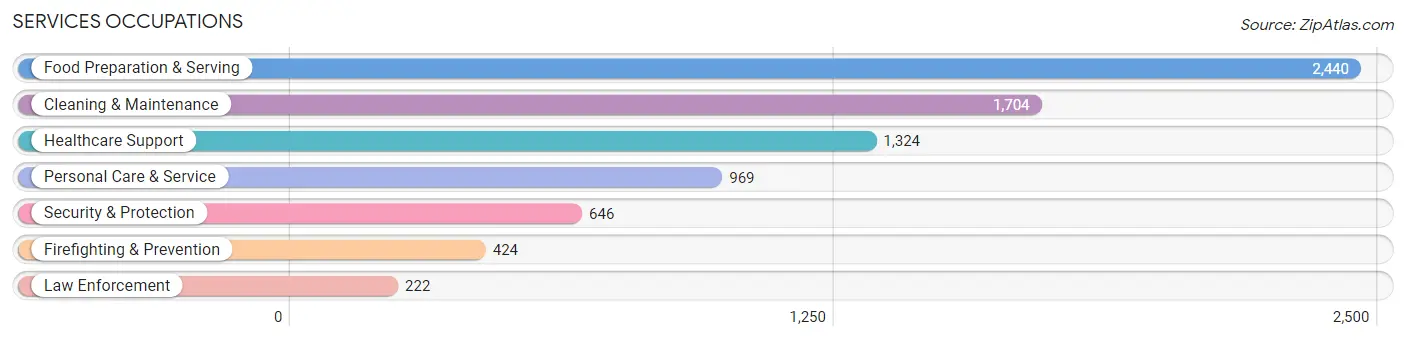
Services Occupations
The most common Services occupations in Largo are Food Preparation & Serving (2,440 | 6.1%), Cleaning & Maintenance (1,704 | 4.3%), Healthcare Support (1,324 | 3.3%), Personal Care & Service (969 | 2.4%), and Security & Protection (646 | 1.6%).
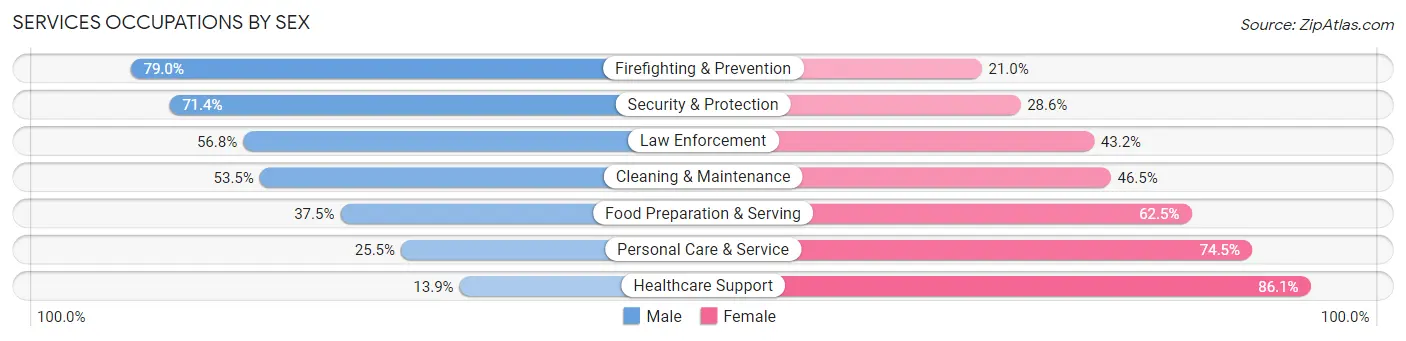
Services Occupations by Sex
Within the Services occupations in Largo, the most male-oriented occupations are Firefighting & Prevention (79.0%), Security & Protection (71.4%), and Law Enforcement (56.8%), while the most female-oriented occupations are Healthcare Support (86.1%), Personal Care & Service (74.5%), and Food Preparation & Serving (62.5%).
| Occupation | Male | Female |
| Healthcare Support | 184 (13.9%) | 1,140 (86.1%) |
| Security & Protection | 461 (71.4%) | 185 (28.6%) |
| Firefighting & Prevention | 335 (79.0%) | 89 (21.0%) |
| Law Enforcement | 126 (56.8%) | 96 (43.2%) |
| Food Preparation & Serving | 915 (37.5%) | 1,525 (62.5%) |
| Cleaning & Maintenance | 911 (53.5%) | 793 (46.5%) |
| Personal Care & Service | 247 (25.5%) | 722 (74.5%) |
| Total (Category) | 2,718 (38.4%) | 4,365 (61.6%) |
| Total (Overall) | 19,541 (49.2%) | 20,172 (50.8%) |
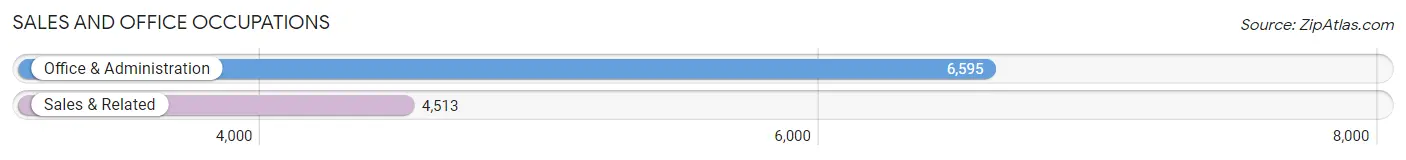
Sales and Office Occupations
The most common Sales and Office occupations in Largo are Office & Administration (6,595 | 16.6%), and Sales & Related (4,513 | 11.4%).
Sales and Office Occupations by Sex
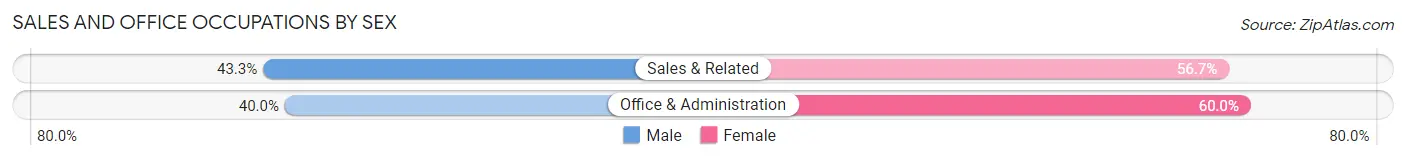
| Occupation | Male | Female |
| Sales & Related | 1,955 (43.3%) | 2,558 (56.7%) |
| Office & Administration | 2,636 (40.0%) | 3,959 (60.0%) |
| Total (Category) | 4,591 (41.3%) | 6,517 (58.7%) |
| Total (Overall) | 19,541 (49.2%) | 20,172 (50.8%) |
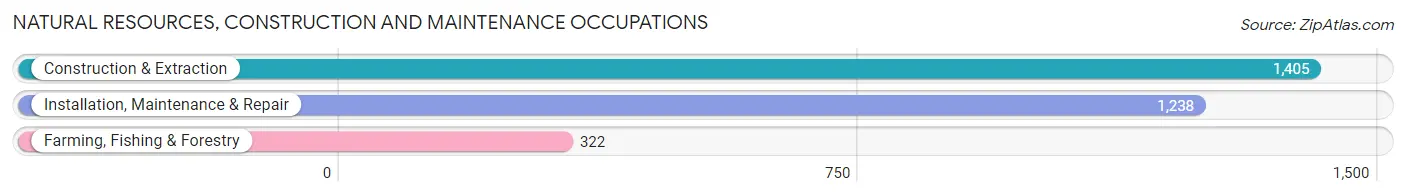
Natural Resources, Construction and Maintenance Occupations
The most common Natural Resources, Construction and Maintenance occupations in Largo are Construction & Extraction (1,405 | 3.5%), Installation, Maintenance & Repair (1,238 | 3.1%), and Farming, Fishing & Forestry (322 | 0.8%).
Natural Resources, Construction and Maintenance Occupations by Sex
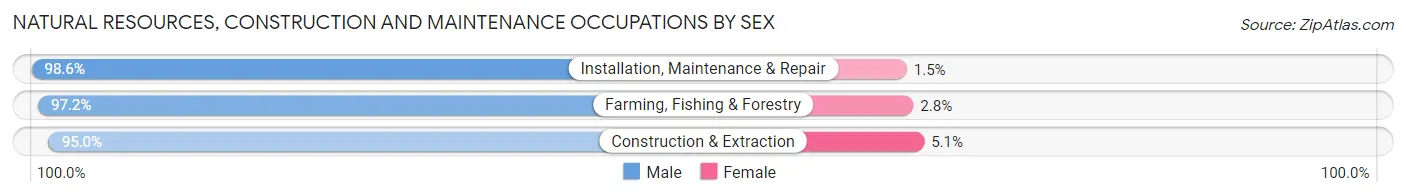
| Occupation | Male | Female |
| Farming, Fishing & Forestry | 313 (97.2%) | 9 (2.8%) |
| Construction & Extraction | 1,334 (95.0%) | 71 (5.1%) |
| Installation, Maintenance & Repair | 1,220 (98.6%) | 18 (1.5%) |
| Total (Category) | 2,867 (96.7%) | 98 (3.3%) |
| Total (Overall) | 19,541 (49.2%) | 20,172 (50.8%) |
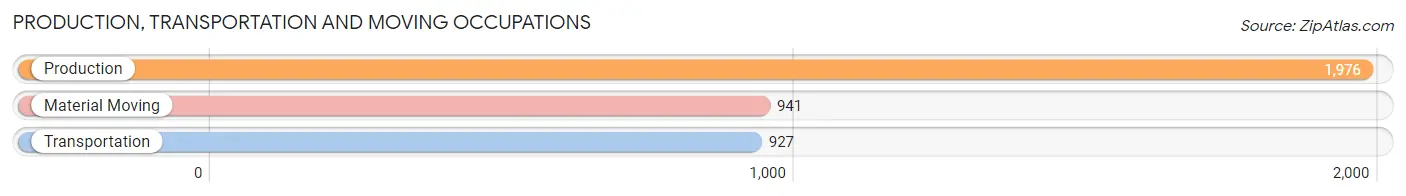
Production, Transportation and Moving Occupations
The most common Production, Transportation and Moving occupations in Largo are Production (1,976 | 5.0%), Material Moving (941 | 2.4%), and Transportation (927 | 2.3%).
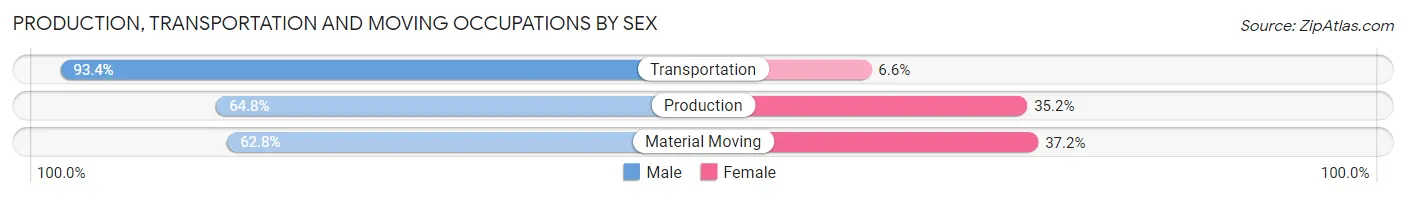
Production, Transportation and Moving Occupations by Sex
| Occupation | Male | Female |
| Production | 1,281 (64.8%) | 695 (35.2%) |
| Transportation | 866 (93.4%) | 61 (6.6%) |
| Material Moving | 591 (62.8%) | 350 (37.2%) |
| Total (Category) | 2,738 (71.2%) | 1,106 (28.8%) |
| Total (Overall) | 19,541 (49.2%) | 20,172 (50.8%) |
Employment Industries by Sex in Largo
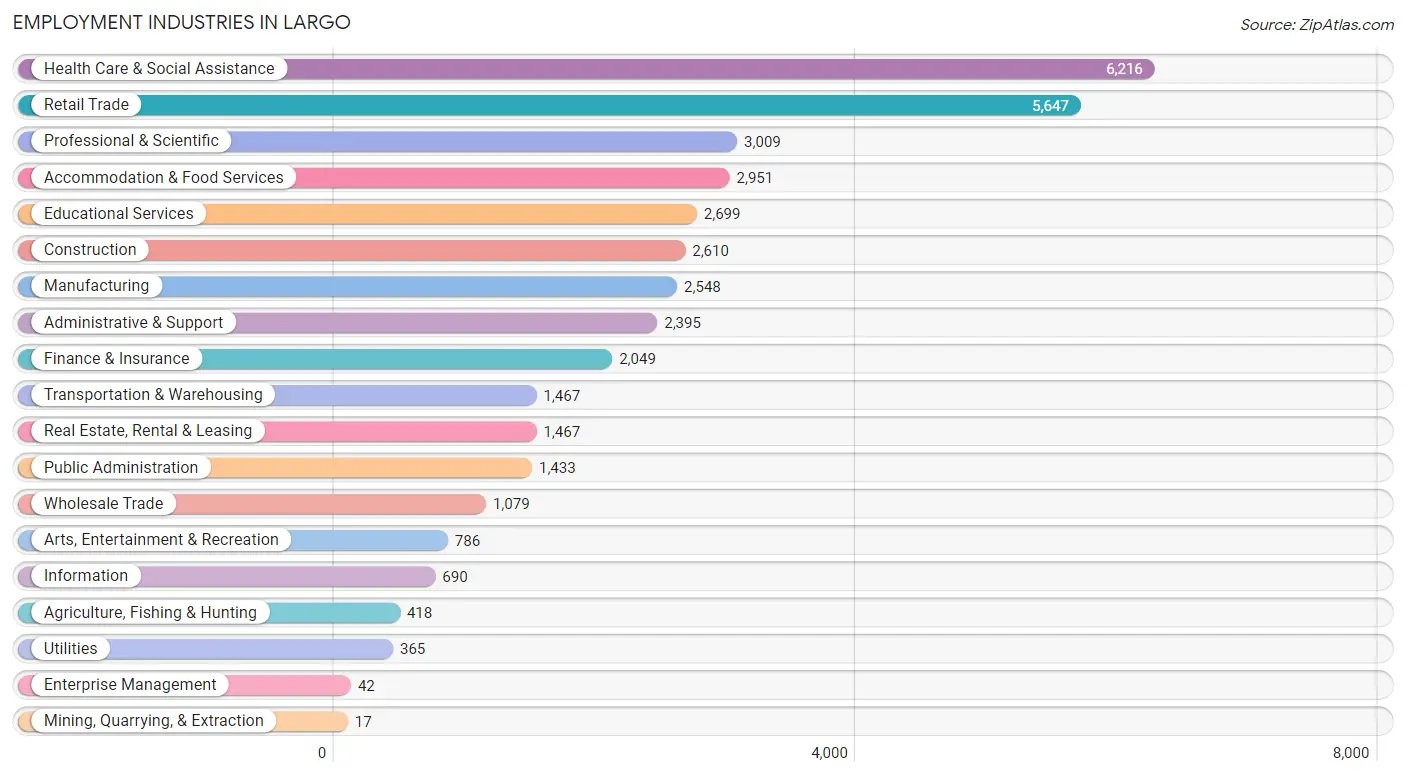
Employment Industries in Largo
The major employment industries in Largo include Health Care & Social Assistance (6,216 | 15.7%), Retail Trade (5,647 | 14.2%), Professional & Scientific (3,009 | 7.6%), Accommodation & Food Services (2,951 | 7.4%), and Educational Services (2,699 | 6.8%).
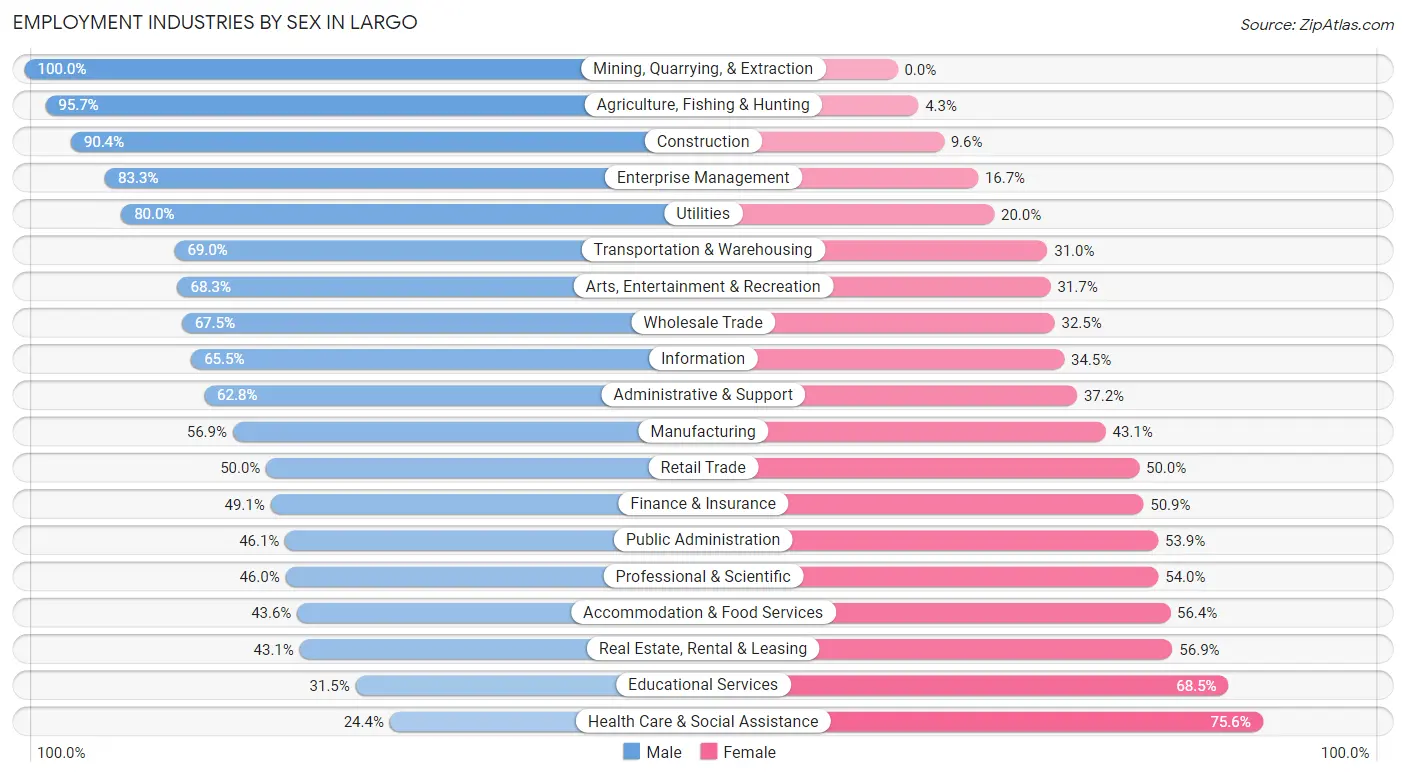
Employment Industries by Sex in Largo
The Largo industries that see more men than women are Mining, Quarrying, & Extraction (100.0%), Agriculture, Fishing & Hunting (95.7%), and Construction (90.4%), whereas the industries that tend to have a higher number of women are Health Care & Social Assistance (75.6%), Educational Services (68.5%), and Real Estate, Rental & Leasing (56.9%).
| Industry | Male | Female |
| Agriculture, Fishing & Hunting | 400 (95.7%) | 18 (4.3%) |
| Mining, Quarrying, & Extraction | 17 (100.0%) | 0 (0.0%) |
| Construction | 2,360 (90.4%) | 250 (9.6%) |
| Manufacturing | 1,450 (56.9%) | 1,098 (43.1%) |
| Wholesale Trade | 728 (67.5%) | 351 (32.5%) |
| Retail Trade | 2,823 (50.0%) | 2,824 (50.0%) |
| Transportation & Warehousing | 1,012 (69.0%) | 455 (31.0%) |
| Utilities | 292 (80.0%) | 73 (20.0%) |
| Information | 452 (65.5%) | 238 (34.5%) |
| Finance & Insurance | 1,006 (49.1%) | 1,043 (50.9%) |
| Real Estate, Rental & Leasing | 632 (43.1%) | 835 (56.9%) |
| Professional & Scientific | 1,384 (46.0%) | 1,625 (54.0%) |
| Enterprise Management | 35 (83.3%) | 7 (16.7%) |
| Administrative & Support | 1,505 (62.8%) | 890 (37.2%) |
| Educational Services | 850 (31.5%) | 1,849 (68.5%) |
| Health Care & Social Assistance | 1,518 (24.4%) | 4,698 (75.6%) |
| Arts, Entertainment & Recreation | 537 (68.3%) | 249 (31.7%) |
| Accommodation & Food Services | 1,286 (43.6%) | 1,665 (56.4%) |
| Public Administration | 660 (46.1%) | 773 (53.9%) |
| Total | 19,541 (49.2%) | 20,172 (50.8%) |
Education in Largo
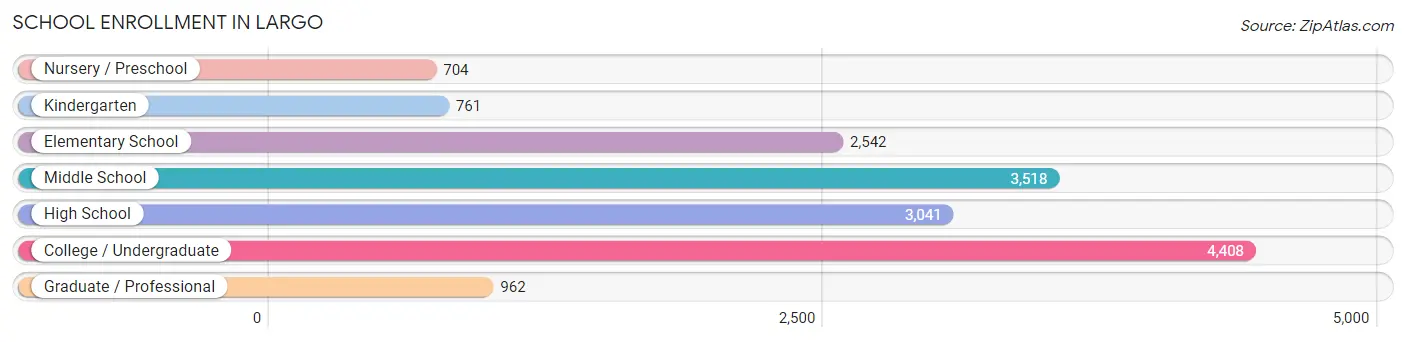
School Enrollment in Largo
The most common levels of schooling among the 15,936 students in Largo are college / undergraduate (4,408 | 27.7%), middle school (3,518 | 22.1%), and high school (3,041 | 19.1%).
| School Level | # Students | % Students |
| Nursery / Preschool | 704 | 4.4% |
| Kindergarten | 761 | 4.8% |
| Elementary School | 2,542 | 16.0% |
| Middle School | 3,518 | 22.1% |
| High School | 3,041 | 19.1% |
| College / Undergraduate | 4,408 | 27.7% |
| Graduate / Professional | 962 | 6.0% |
| Total | 15,936 | 100.0% |
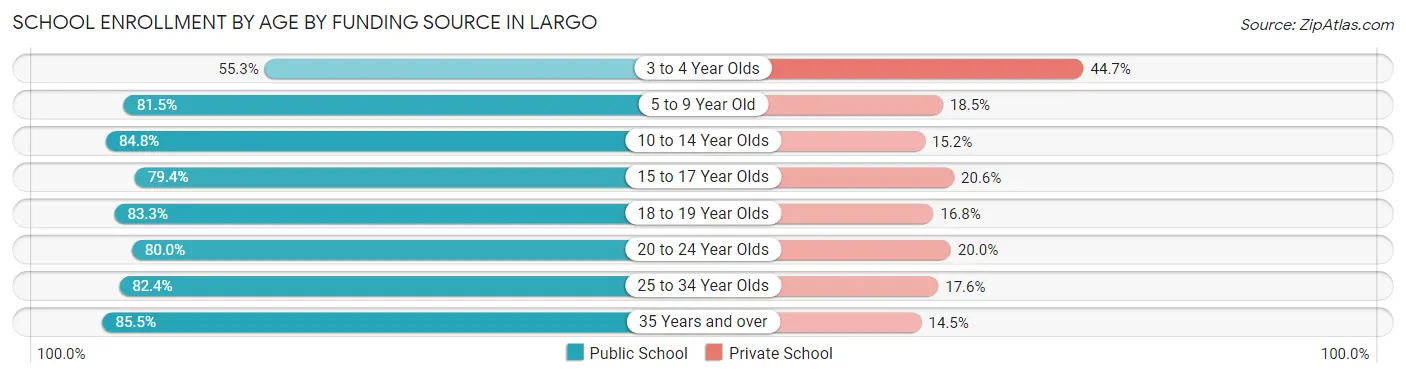
School Enrollment by Age by Funding Source in Largo
Out of a total of 15,936 students who are enrolled in schools in Largo, 2,900 (18.2%) attend a private institution, while the remaining 13,036 (81.8%) are enrolled in public schools. The age group of 3 to 4 year olds has the highest likelihood of being enrolled in private schools, with 223 (44.7% in the age bracket) enrolled. Conversely, the age group of 35 years and over has the lowest likelihood of being enrolled in a private school, with 2,220 (85.5% in the age bracket) attending a public institution.
| Age Bracket | Public School | Private School |
| 3 to 4 Year Olds | 276 (55.3%) | 223 (44.7%) |
| 5 to 9 Year Old | 2,566 (81.5%) | 582 (18.5%) |
| 10 to 14 Year Olds | 3,023 (84.8%) | 540 (15.2%) |
| 15 to 17 Year Olds | 1,687 (79.4%) | 437 (20.6%) |
| 18 to 19 Year Olds | 830 (83.3%) | 167 (16.8%) |
| 20 to 24 Year Olds | 1,449 (80.0%) | 362 (20.0%) |
| 25 to 34 Year Olds | 986 (82.4%) | 211 (17.6%) |
| 35 Years and over | 2,220 (85.5%) | 377 (14.5%) |
| Total | 13,036 (81.8%) | 2,900 (18.2%) |
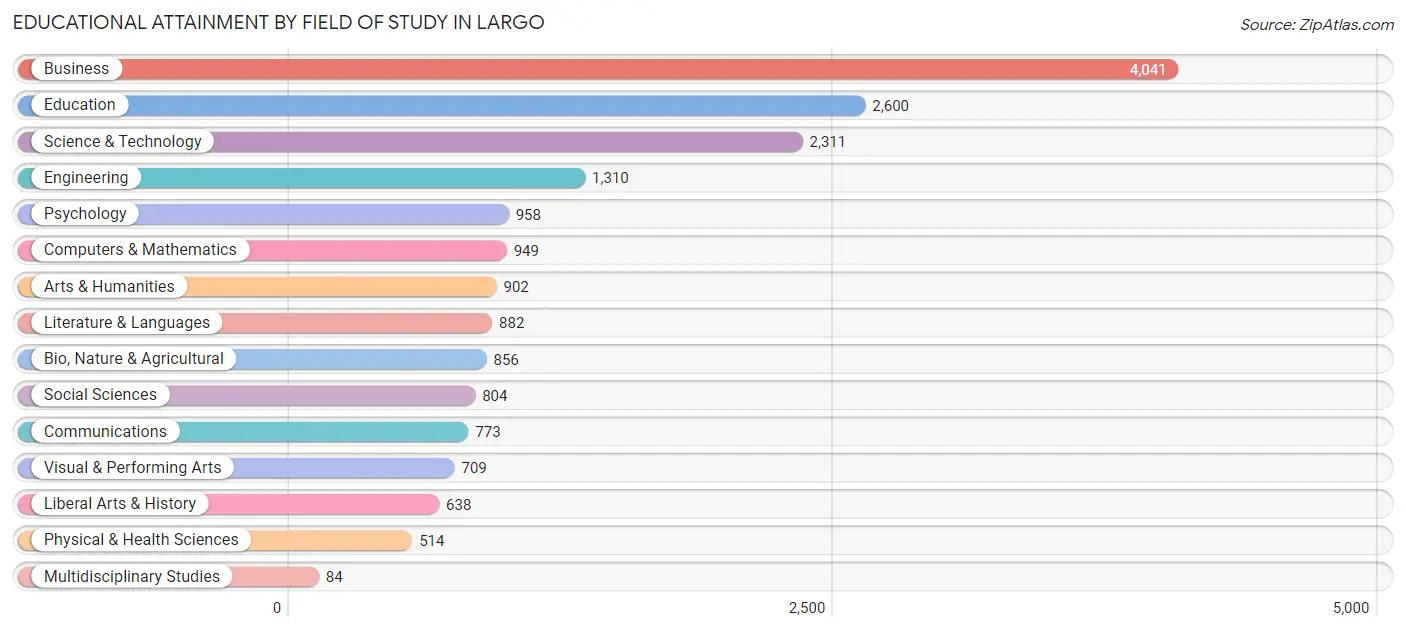
Educational Attainment by Field of Study in Largo
Business (4,041 | 22.0%), education (2,600 | 14.2%), science & technology (2,311 | 12.6%), engineering (1,310 | 7.1%), and psychology (958 | 5.2%) are the most common fields of study among 18,331 individuals in Largo who have obtained a bachelor's degree or higher.
| Field of Study | # Graduates | % Graduates |
| Computers & Mathematics | 949 | 5.2% |
| Bio, Nature & Agricultural | 856 | 4.7% |
| Physical & Health Sciences | 514 | 2.8% |
| Psychology | 958 | 5.2% |
| Social Sciences | 804 | 4.4% |
| Engineering | 1,310 | 7.1% |
| Multidisciplinary Studies | 84 | 0.5% |
| Science & Technology | 2,311 | 12.6% |
| Business | 4,041 | 22.0% |
| Education | 2,600 | 14.2% |
| Literature & Languages | 882 | 4.8% |
| Liberal Arts & History | 638 | 3.5% |
| Visual & Performing Arts | 709 | 3.9% |
| Communications | 773 | 4.2% |
| Arts & Humanities | 902 | 4.9% |
| Total | 18,331 | 100.0% |
Transportation & Commute in Largo
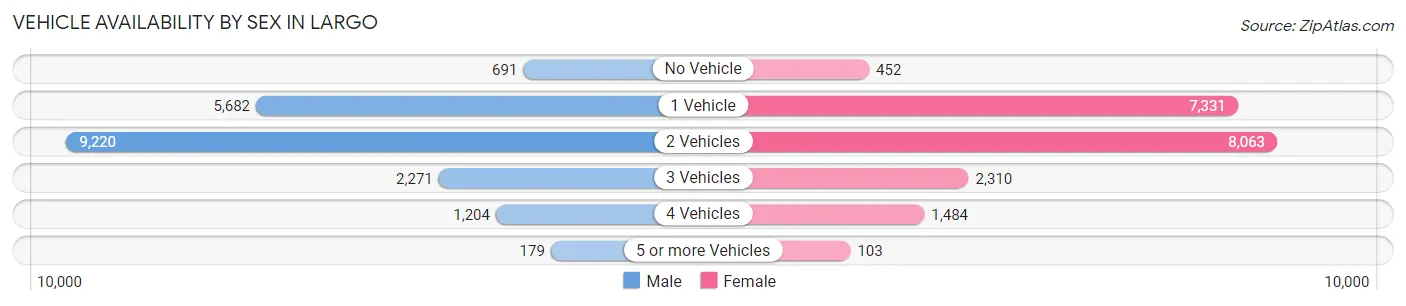
Vehicle Availability by Sex in Largo
The most prevalent vehicle ownership categories in Largo are males with 2 vehicles (9,220, accounting for 47.9%) and females with 2 vehicles (8,063, making up 46.7%).
| Vehicles Available | Male | Female |
| No Vehicle | 691 (3.6%) | 452 (2.3%) |
| 1 Vehicle | 5,682 (29.5%) | 7,331 (37.1%) |
| 2 Vehicles | 9,220 (47.9%) | 8,063 (40.8%) |
| 3 Vehicles | 2,271 (11.8%) | 2,310 (11.7%) |
| 4 Vehicles | 1,204 (6.3%) | 1,484 (7.5%) |
| 5 or more Vehicles | 179 (0.9%) | 103 (0.5%) |
| Total | 19,247 (100.0%) | 19,743 (100.0%) |
Commute Time in Largo
The most frequently occuring commute durations in Largo are 15 to 19 minutes (7,481 commuters, 21.2%), 20 to 24 minutes (5,535 commuters, 15.7%), and 10 to 14 minutes (5,305 commuters, 15.0%).
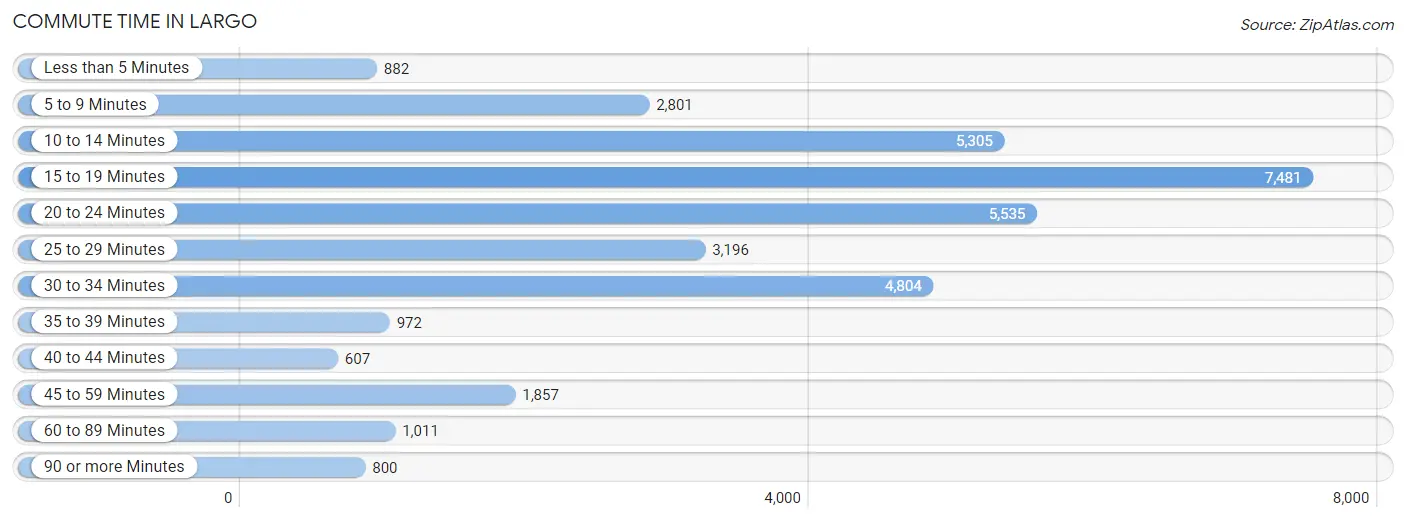
| Commute Time | # Commuters | % Commuters |
| Less than 5 Minutes | 882 | 2.5% |
| 5 to 9 Minutes | 2,801 | 8.0% |
| 10 to 14 Minutes | 5,305 | 15.0% |
| 15 to 19 Minutes | 7,481 | 21.2% |
| 20 to 24 Minutes | 5,535 | 15.7% |
| 25 to 29 Minutes | 3,196 | 9.1% |
| 30 to 34 Minutes | 4,804 | 13.6% |
| 35 to 39 Minutes | 972 | 2.8% |
| 40 to 44 Minutes | 607 | 1.7% |
| 45 to 59 Minutes | 1,857 | 5.3% |
| 60 to 89 Minutes | 1,011 | 2.9% |
| 90 or more Minutes | 800 | 2.3% |
Commute Time by Sex in Largo
The most common commute times in Largo are 15 to 19 minutes (4,182 commuters, 23.8%) for males and 15 to 19 minutes (3,299 commuters, 18.7%) for females.
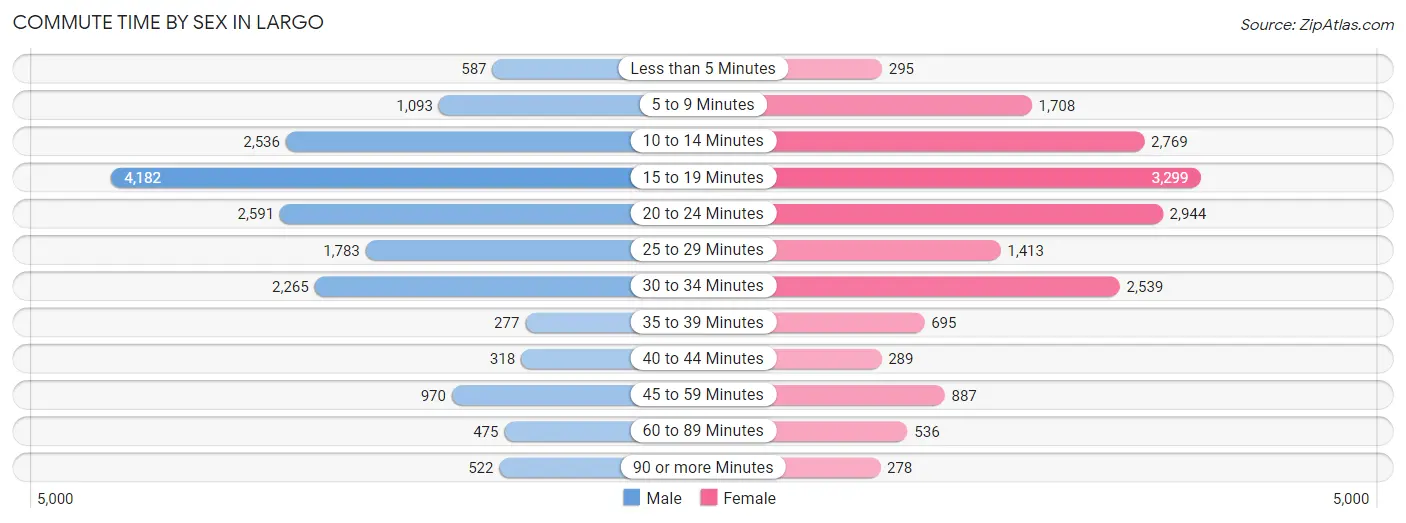
| Commute Time | Male | Female |
| Less than 5 Minutes | 587 (3.3%) | 295 (1.7%) |
| 5 to 9 Minutes | 1,093 (6.2%) | 1,708 (9.7%) |
| 10 to 14 Minutes | 2,536 (14.4%) | 2,769 (15.7%) |
| 15 to 19 Minutes | 4,182 (23.8%) | 3,299 (18.7%) |
| 20 to 24 Minutes | 2,591 (14.7%) | 2,944 (16.7%) |
| 25 to 29 Minutes | 1,783 (10.1%) | 1,413 (8.0%) |
| 30 to 34 Minutes | 2,265 (12.9%) | 2,539 (14.4%) |
| 35 to 39 Minutes | 277 (1.6%) | 695 (3.9%) |
| 40 to 44 Minutes | 318 (1.8%) | 289 (1.6%) |
| 45 to 59 Minutes | 970 (5.5%) | 887 (5.0%) |
| 60 to 89 Minutes | 475 (2.7%) | 536 (3.0%) |
| 90 or more Minutes | 522 (3.0%) | 278 (1.6%) |
Time of Departure to Work by Sex in Largo
The most frequent times of departure to work in Largo are 7:00 AM to 7:29 AM (2,491, 14.1%) for males and 7:00 AM to 7:29 AM (2,950, 16.7%) for females.
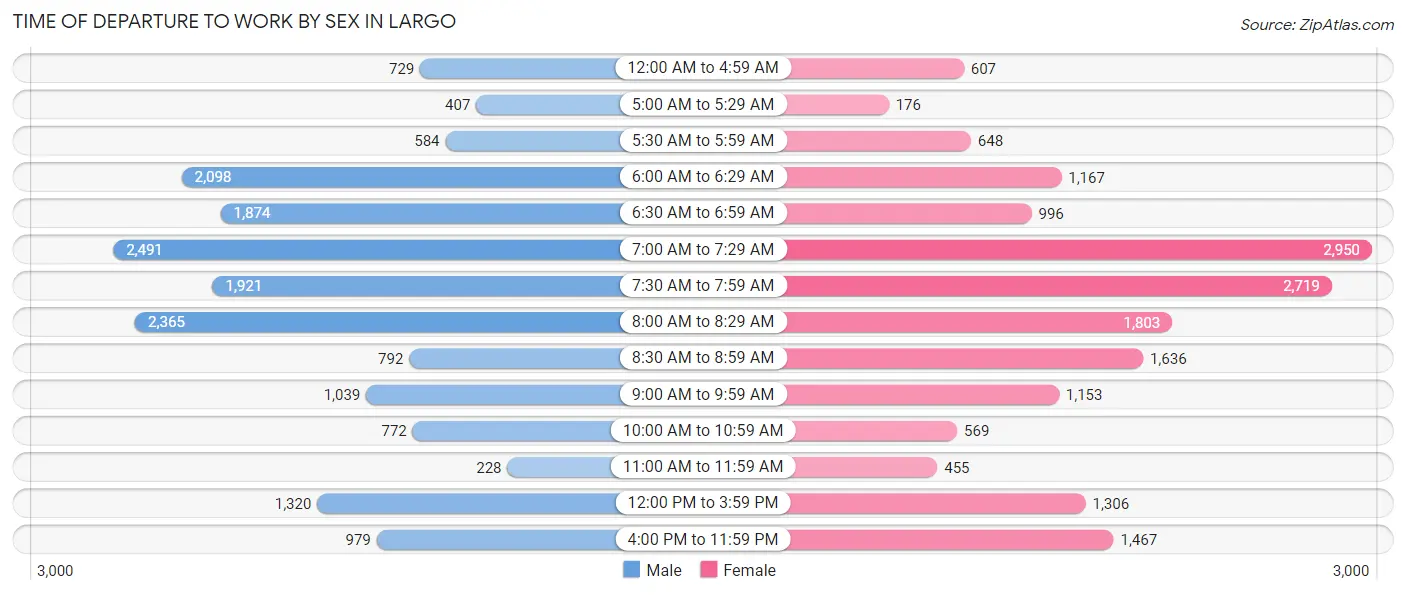
| Time of Departure | Male | Female |
| 12:00 AM to 4:59 AM | 729 (4.1%) | 607 (3.4%) |
| 5:00 AM to 5:29 AM | 407 (2.3%) | 176 (1.0%) |
| 5:30 AM to 5:59 AM | 584 (3.3%) | 648 (3.7%) |
| 6:00 AM to 6:29 AM | 2,098 (11.9%) | 1,167 (6.6%) |
| 6:30 AM to 6:59 AM | 1,874 (10.6%) | 996 (5.6%) |
| 7:00 AM to 7:29 AM | 2,491 (14.1%) | 2,950 (16.7%) |
| 7:30 AM to 7:59 AM | 1,921 (10.9%) | 2,719 (15.4%) |
| 8:00 AM to 8:29 AM | 2,365 (13.4%) | 1,803 (10.2%) |
| 8:30 AM to 8:59 AM | 792 (4.5%) | 1,636 (9.3%) |
| 9:00 AM to 9:59 AM | 1,039 (5.9%) | 1,153 (6.5%) |
| 10:00 AM to 10:59 AM | 772 (4.4%) | 569 (3.2%) |
| 11:00 AM to 11:59 AM | 228 (1.3%) | 455 (2.6%) |
| 12:00 PM to 3:59 PM | 1,320 (7.5%) | 1,306 (7.4%) |
| 4:00 PM to 11:59 PM | 979 (5.6%) | 1,467 (8.3%) |
| Total | 17,599 (100.0%) | 17,652 (100.0%) |
Housing Occupancy in Largo
Occupancy by Ownership in Largo
Of the total 36,972 dwellings in Largo, owner-occupied units account for 22,341 (60.4%), while renter-occupied units make up 14,631 (39.6%).
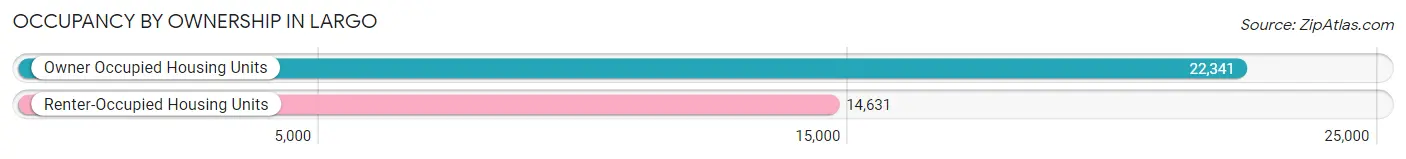
| Occupancy | # Housing Units | % Housing Units |
| Owner Occupied Housing Units | 22,341 | 60.4% |
| Renter-Occupied Housing Units | 14,631 | 39.6% |
| Total Occupied Housing Units | 36,972 | 100.0% |
Occupancy by Household Size in Largo
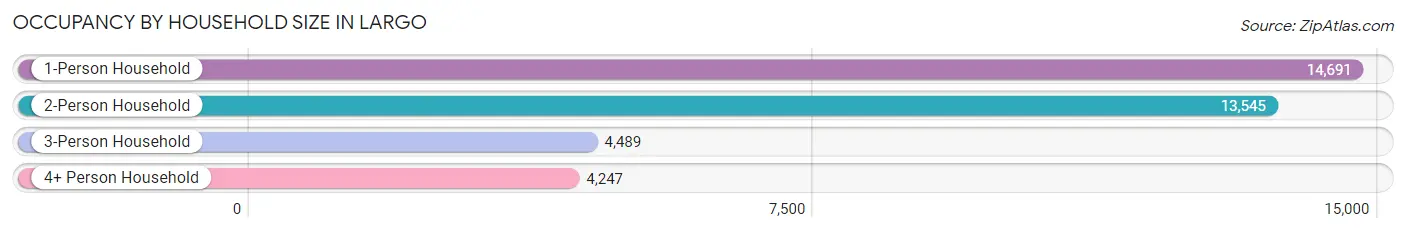
| Household Size | # Housing Units | % Housing Units |
| 1-Person Household | 14,691 | 39.7% |
| 2-Person Household | 13,545 | 36.6% |
| 3-Person Household | 4,489 | 12.1% |
| 4+ Person Household | 4,247 | 11.5% |
| Total Housing Units | 36,972 | 100.0% |
Occupancy by Ownership by Household Size in Largo
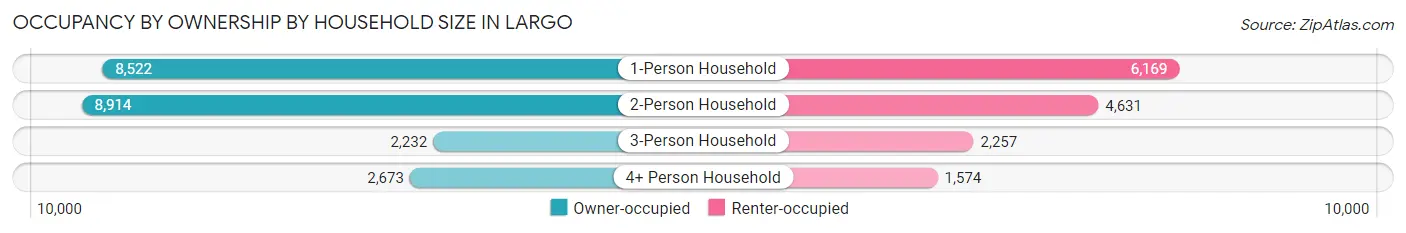
| Household Size | Owner-occupied | Renter-occupied |
| 1-Person Household | 8,522 (58.0%) | 6,169 (42.0%) |
| 2-Person Household | 8,914 (65.8%) | 4,631 (34.2%) |
| 3-Person Household | 2,232 (49.7%) | 2,257 (50.3%) |
| 4+ Person Household | 2,673 (62.9%) | 1,574 (37.1%) |
| Total Housing Units | 22,341 (60.4%) | 14,631 (39.6%) |
Occupancy by Educational Attainment in Largo
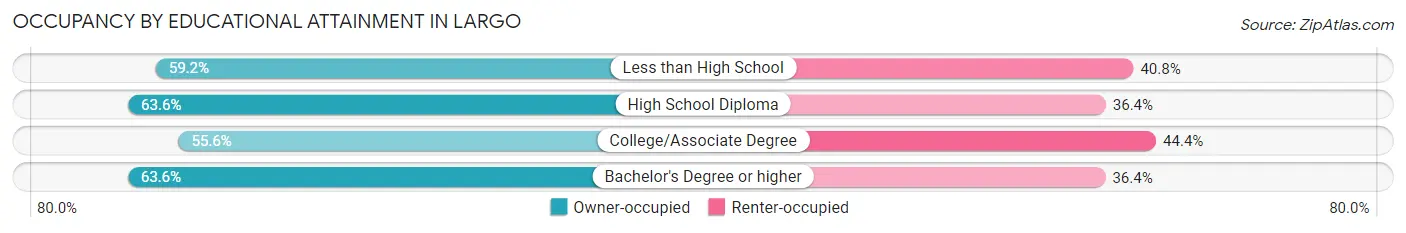
| Household Size | Owner-occupied | Renter-occupied |
| Less than High School | 1,620 (59.2%) | 1,117 (40.8%) |
| High School Diploma | 6,518 (63.6%) | 3,736 (36.4%) |
| College/Associate Degree | 7,299 (55.6%) | 5,832 (44.4%) |
| Bachelor's Degree or higher | 6,904 (63.6%) | 3,946 (36.4%) |
Occupancy by Age of Householder in Largo
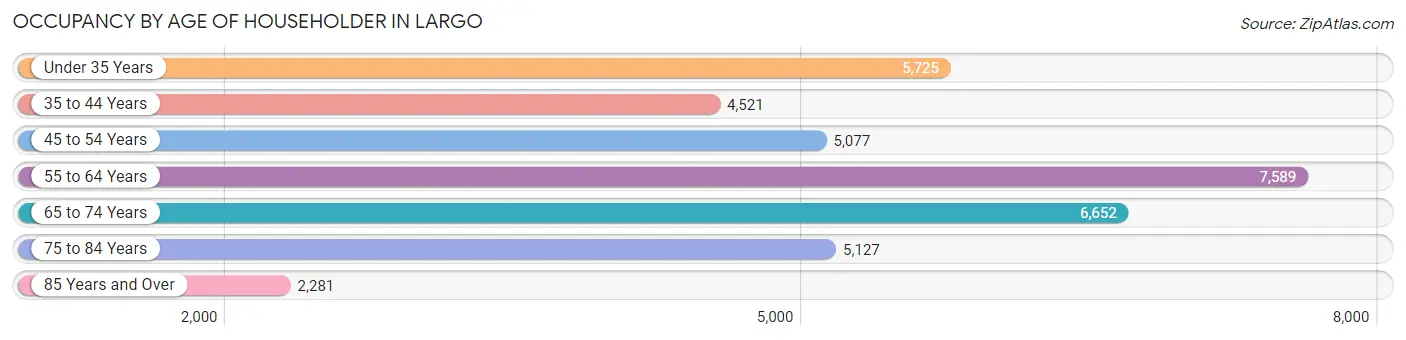
| Age Bracket | # Households | % Households |
| Under 35 Years | 5,725 | 15.5% |
| 35 to 44 Years | 4,521 | 12.2% |
| 45 to 54 Years | 5,077 | 13.7% |
| 55 to 64 Years | 7,589 | 20.5% |
| 65 to 74 Years | 6,652 | 18.0% |
| 75 to 84 Years | 5,127 | 13.9% |
| 85 Years and Over | 2,281 | 6.2% |
| Total | 36,972 | 100.0% |
Housing Finances in Largo
Median Income by Occupancy in Largo
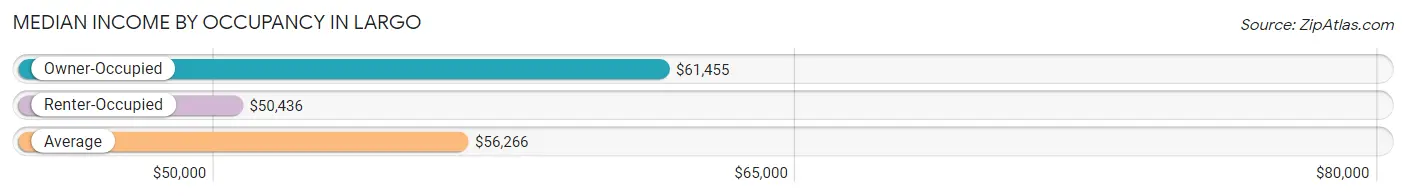
| Occupancy Type | # Households | Median Income |
| Owner-Occupied | 22,341 (60.4%) | $61,455 |
| Renter-Occupied | 14,631 (39.6%) | $50,436 |
| Average | 36,972 (100.0%) | $56,266 |
Occupancy by Householder Income Bracket in Largo
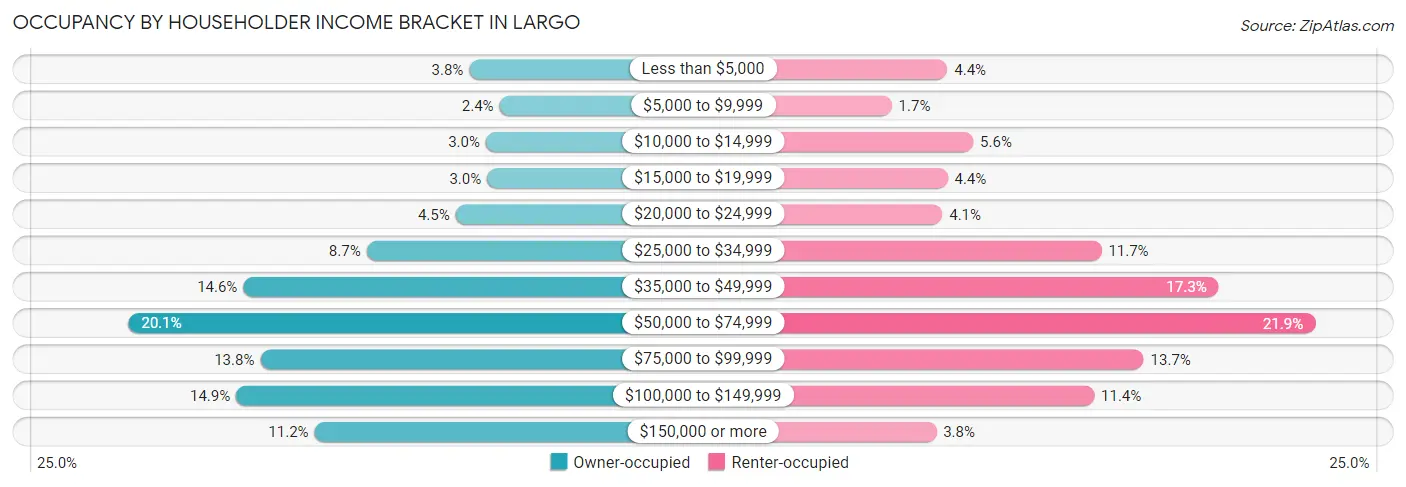
| Income Bracket | Owner-occupied | Renter-occupied |
| Less than $5,000 | 856 (3.8%) | 639 (4.4%) |
| $5,000 to $9,999 | 534 (2.4%) | 251 (1.7%) |
| $10,000 to $14,999 | 680 (3.0%) | 819 (5.6%) |
| $15,000 to $19,999 | 665 (3.0%) | 641 (4.4%) |
| $20,000 to $24,999 | 1,001 (4.5%) | 604 (4.1%) |
| $25,000 to $34,999 | 1,948 (8.7%) | 1,714 (11.7%) |
| $35,000 to $49,999 | 3,259 (14.6%) | 2,530 (17.3%) |
| $50,000 to $74,999 | 4,482 (20.1%) | 3,201 (21.9%) |
| $75,000 to $99,999 | 3,078 (13.8%) | 2,008 (13.7%) |
| $100,000 to $149,999 | 3,336 (14.9%) | 1,662 (11.4%) |
| $150,000 or more | 2,502 (11.2%) | 562 (3.8%) |
| Total | 22,341 (100.0%) | 14,631 (100.0%) |
Monthly Housing Cost Tiers in Largo
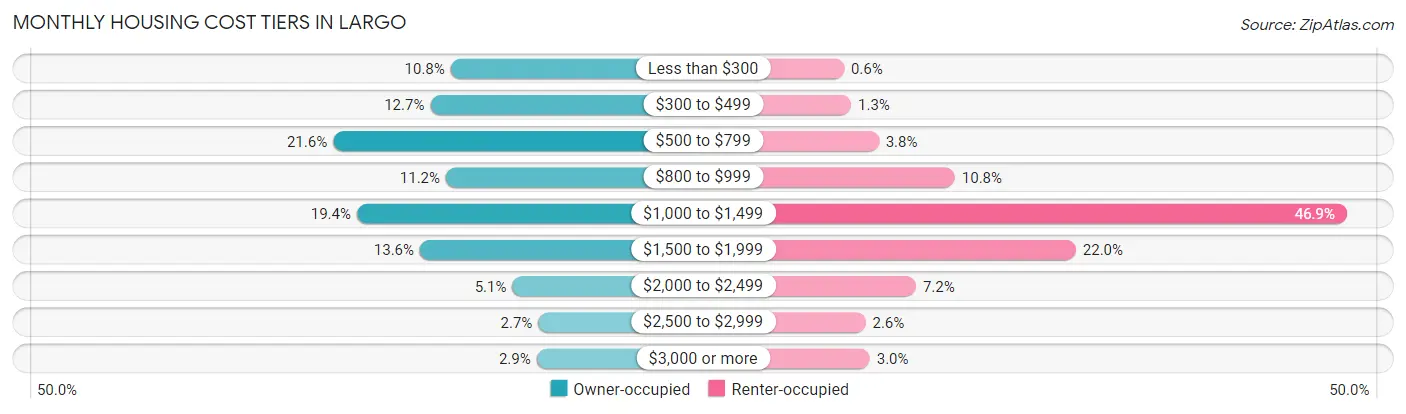
| Monthly Cost | Owner-occupied | Renter-occupied |
| Less than $300 | 2,409 (10.8%) | 88 (0.6%) |
| $300 to $499 | 2,829 (12.7%) | 184 (1.3%) |
| $500 to $799 | 4,829 (21.6%) | 556 (3.8%) |
| $800 to $999 | 2,506 (11.2%) | 1,581 (10.8%) |
| $1,000 to $1,499 | 4,339 (19.4%) | 6,860 (46.9%) |
| $1,500 to $1,999 | 3,041 (13.6%) | 3,211 (22.0%) |
| $2,000 to $2,499 | 1,139 (5.1%) | 1,058 (7.2%) |
| $2,500 to $2,999 | 608 (2.7%) | 379 (2.6%) |
| $3,000 or more | 641 (2.9%) | 436 (3.0%) |
| Total | 22,341 (100.0%) | 14,631 (100.0%) |
Physical Housing Characteristics in Largo
Housing Structures in Largo
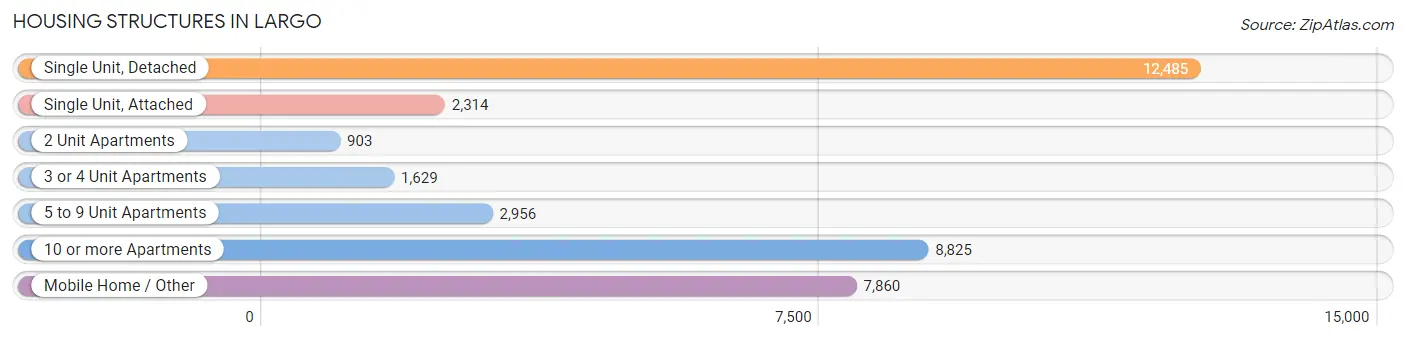
| Structure Type | # Housing Units | % Housing Units |
| Single Unit, Detached | 12,485 | 33.8% |
| Single Unit, Attached | 2,314 | 6.3% |
| 2 Unit Apartments | 903 | 2.4% |
| 3 or 4 Unit Apartments | 1,629 | 4.4% |
| 5 to 9 Unit Apartments | 2,956 | 8.0% |
| 10 or more Apartments | 8,825 | 23.9% |
| Mobile Home / Other | 7,860 | 21.3% |
| Total | 36,972 | 100.0% |
Housing Structures by Occupancy in Largo
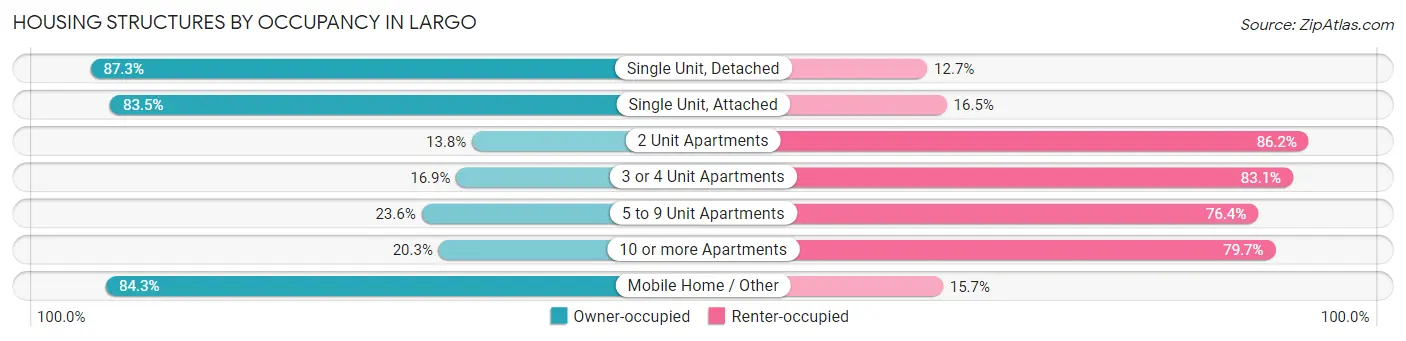
| Structure Type | Owner-occupied | Renter-occupied |
| Single Unit, Detached | 10,898 (87.3%) | 1,587 (12.7%) |
| Single Unit, Attached | 1,933 (83.5%) | 381 (16.5%) |
| 2 Unit Apartments | 125 (13.8%) | 778 (86.2%) |
| 3 or 4 Unit Apartments | 275 (16.9%) | 1,354 (83.1%) |
| 5 to 9 Unit Apartments | 697 (23.6%) | 2,259 (76.4%) |
| 10 or more Apartments | 1,788 (20.3%) | 7,037 (79.7%) |
| Mobile Home / Other | 6,625 (84.3%) | 1,235 (15.7%) |
| Total | 22,341 (60.4%) | 14,631 (39.6%) |
Housing Structures by Number of Rooms in Largo
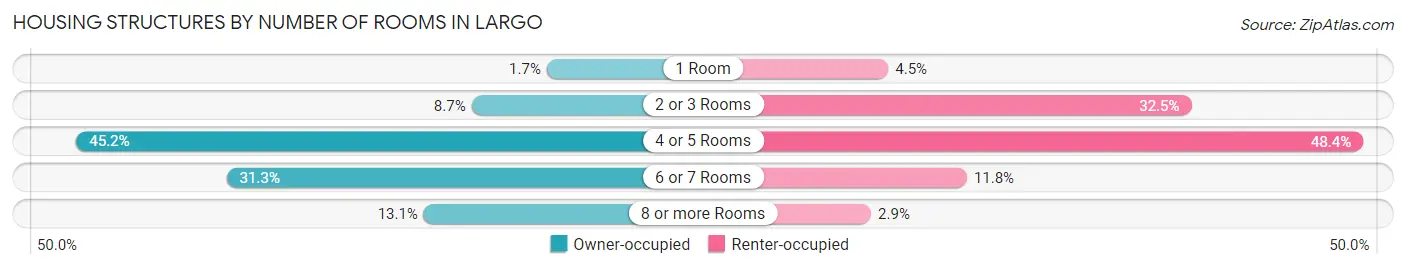
| Number of Rooms | Owner-occupied | Renter-occupied |
| 1 Room | 383 (1.7%) | 656 (4.5%) |
| 2 or 3 Rooms | 1,936 (8.7%) | 4,755 (32.5%) |
| 4 or 5 Rooms | 10,100 (45.2%) | 7,078 (48.4%) |
| 6 or 7 Rooms | 6,998 (31.3%) | 1,719 (11.7%) |
| 8 or more Rooms | 2,924 (13.1%) | 423 (2.9%) |
| Total | 22,341 (100.0%) | 14,631 (100.0%) |
Housing Structure by Heating Type in Largo
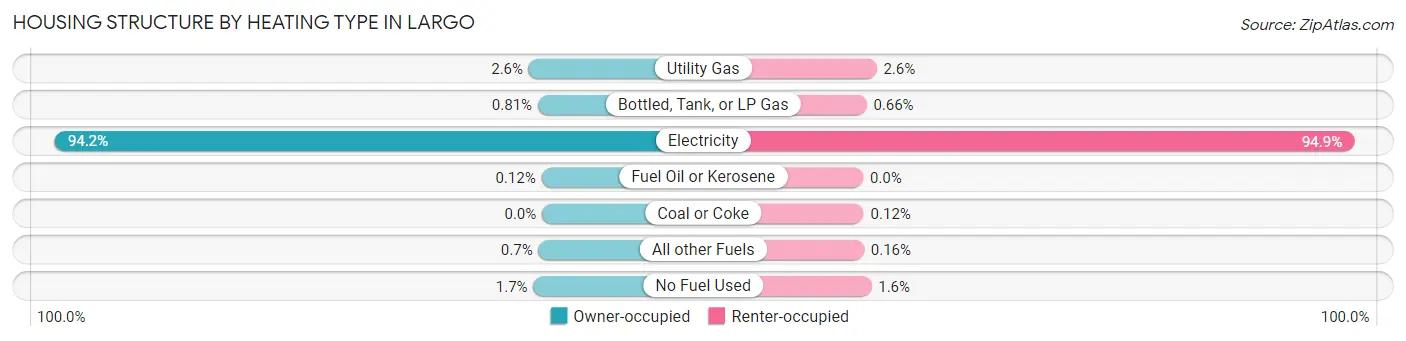
| Heating Type | Owner-occupied | Renter-occupied |
| Utility Gas | 571 (2.6%) | 380 (2.6%) |
| Bottled, Tank, or LP Gas | 182 (0.8%) | 97 (0.7%) |
| Electricity | 21,033 (94.2%) | 13,879 (94.9%) |
| Fuel Oil or Kerosene | 27 (0.1%) | 0 (0.0%) |
| Coal or Coke | 0 (0.0%) | 18 (0.1%) |
| All other Fuels | 156 (0.7%) | 24 (0.2%) |
| No Fuel Used | 372 (1.7%) | 233 (1.6%) |
| Total | 22,341 (100.0%) | 14,631 (100.0%) |
Household Vehicle Usage in Largo
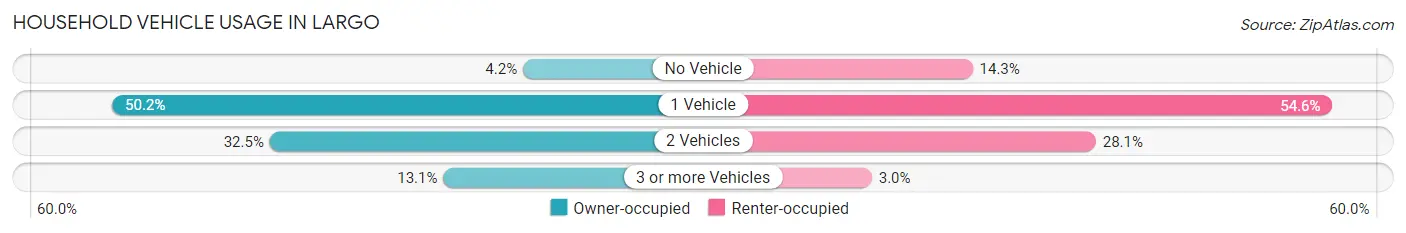
| Vehicles per Household | Owner-occupied | Renter-occupied |
| No Vehicle | 931 (4.2%) | 2,092 (14.3%) |
| 1 Vehicle | 11,214 (50.2%) | 7,988 (54.6%) |
| 2 Vehicles | 7,269 (32.5%) | 4,111 (28.1%) |
| 3 or more Vehicles | 2,927 (13.1%) | 440 (3.0%) |
| Total | 22,341 (100.0%) | 14,631 (100.0%) |
Real Estate & Mortgages in Largo
Real Estate and Mortgage Overview in Largo
| Characteristic | Without Mortgage | With Mortgage |
| Housing Units | 12,463 | 9,878 |
| Median Property Value | $91,300 | $250,800 |
| Median Household Income | $49,649 | $1,613 |
| Monthly Housing Costs | $583 | $493 |
| Real Estate Taxes | $1,003 | $393 |
Property Value by Mortgage Status in Largo
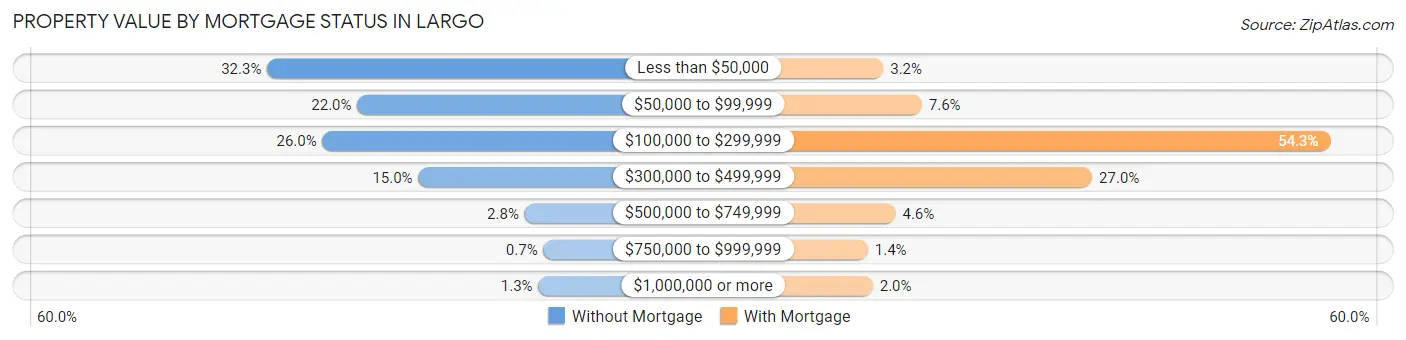
| Property Value | Without Mortgage | With Mortgage |
| Less than $50,000 | 4,022 (32.3%) | 313 (3.2%) |
| $50,000 to $99,999 | 2,738 (22.0%) | 749 (7.6%) |
| $100,000 to $299,999 | 3,234 (26.0%) | 5,360 (54.3%) |
| $300,000 to $499,999 | 1,868 (15.0%) | 2,671 (27.0%) |
| $500,000 to $749,999 | 354 (2.8%) | 451 (4.6%) |
| $750,000 to $999,999 | 87 (0.7%) | 139 (1.4%) |
| $1,000,000 or more | 160 (1.3%) | 195 (2.0%) |
| Total | 12,463 (100.0%) | 9,878 (100.0%) |
Household Income by Mortgage Status in Largo
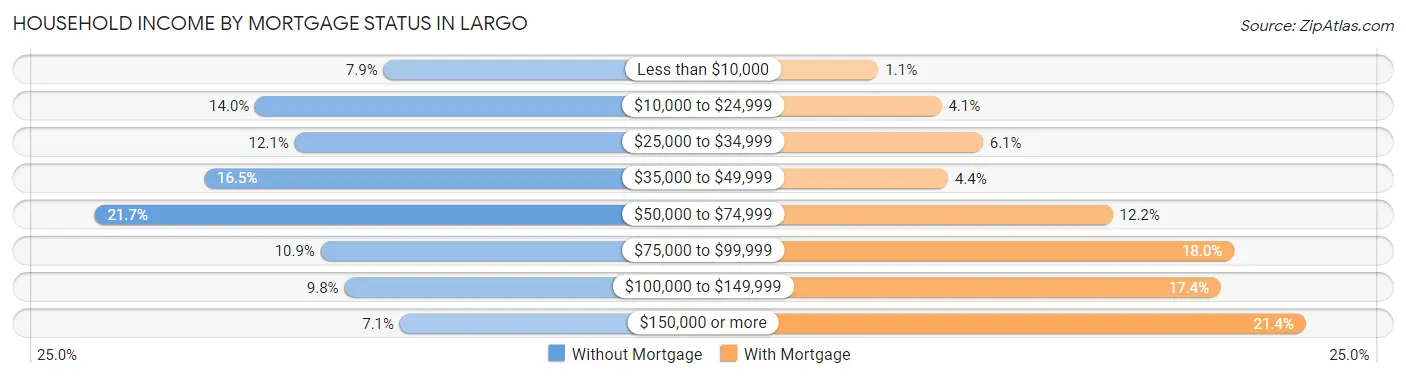
| Household Income | Without Mortgage | With Mortgage |
| Less than $10,000 | 986 (7.9%) | 108 (1.1%) |
| $10,000 to $24,999 | 1,747 (14.0%) | 404 (4.1%) |
| $25,000 to $34,999 | 1,513 (12.1%) | 599 (6.1%) |
| $35,000 to $49,999 | 2,050 (16.5%) | 435 (4.4%) |
| $50,000 to $74,999 | 2,701 (21.7%) | 1,209 (12.2%) |
| $75,000 to $99,999 | 1,359 (10.9%) | 1,781 (18.0%) |
| $100,000 to $149,999 | 1,218 (9.8%) | 1,719 (17.4%) |
| $150,000 or more | 889 (7.1%) | 2,118 (21.4%) |
| Total | 12,463 (100.0%) | 9,878 (100.0%) |
Property Value to Household Income Ratio in Largo
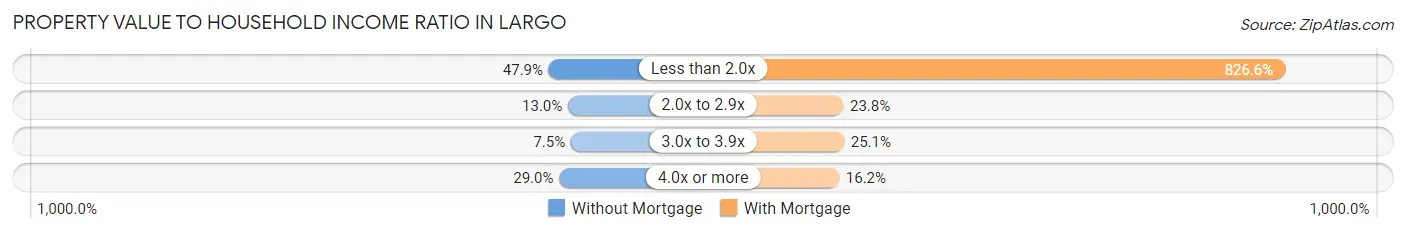
| Value-to-Income Ratio | Without Mortgage | With Mortgage |
| Less than 2.0x | 5,965 (47.9%) | 81,655 (826.6%) |
| 2.0x to 2.9x | 1,614 (13.0%) | 2,350 (23.8%) |
| 3.0x to 3.9x | 939 (7.5%) | 2,481 (25.1%) |
| 4.0x or more | 3,608 (28.9%) | 1,598 (16.2%) |
| Total | 12,463 (100.0%) | 9,878 (100.0%) |
Real Estate Taxes by Mortgage Status in Largo
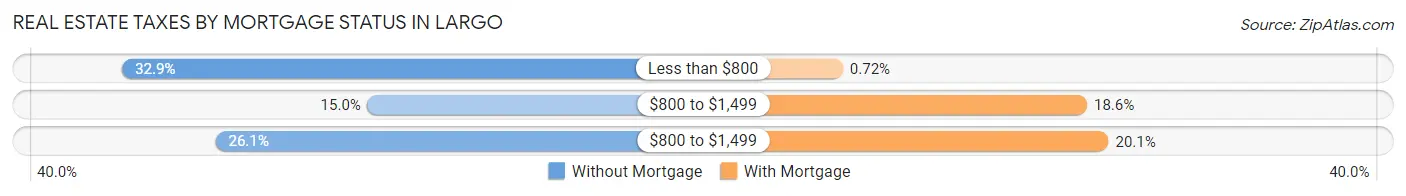
| Property Taxes | Without Mortgage | With Mortgage |
| Less than $800 | 4,096 (32.9%) | 71 (0.7%) |
| $800 to $1,499 | 1,871 (15.0%) | 1,833 (18.6%) |
| $800 to $1,499 | 3,246 (26.1%) | 1,988 (20.1%) |
| Total | 12,463 (100.0%) | 9,878 (100.0%) |
Health & Disability in Largo
Health Insurance Coverage by Age in Largo
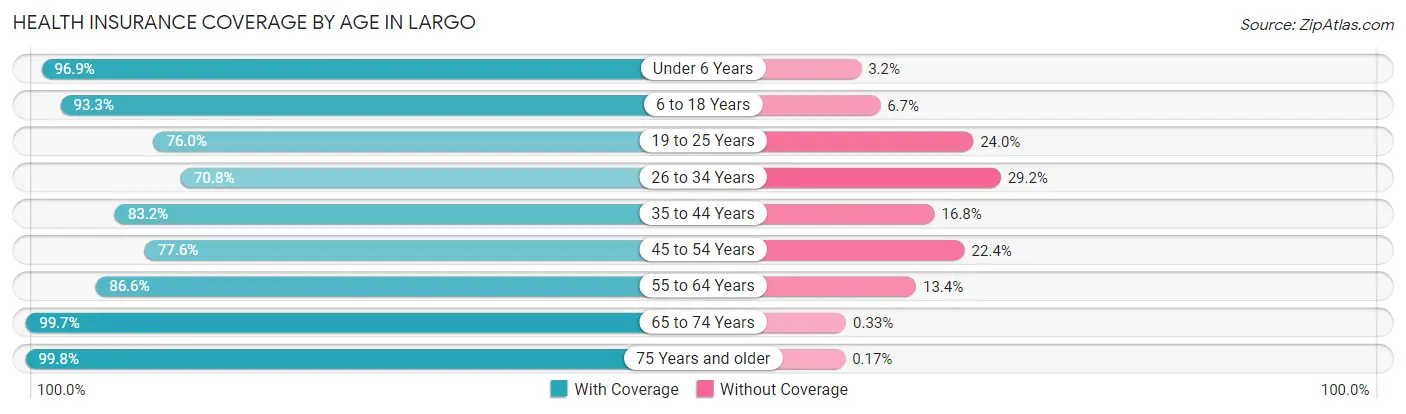
| Age Bracket | With Coverage | Without Coverage |
| Under 6 Years | 3,687 (96.9%) | 120 (3.2%) |
| 6 to 18 Years | 8,680 (93.3%) | 623 (6.7%) |
| 19 to 25 Years | 4,742 (76.0%) | 1,501 (24.0%) |
| 26 to 34 Years | 6,824 (70.8%) | 2,810 (29.2%) |
| 35 to 44 Years | 7,379 (83.2%) | 1,494 (16.8%) |
| 45 to 54 Years | 7,357 (77.6%) | 2,128 (22.4%) |
| 55 to 64 Years | 11,067 (86.6%) | 1,709 (13.4%) |
| 65 to 74 Years | 10,270 (99.7%) | 34 (0.3%) |
| 75 Years and older | 10,667 (99.8%) | 18 (0.2%) |
| Total | 70,673 (87.1%) | 10,437 (12.9%) |
Health Insurance Coverage by Citizenship Status in Largo
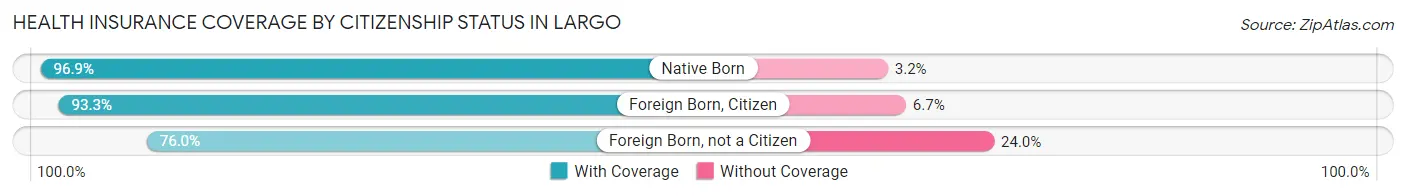
| Citizenship Status | With Coverage | Without Coverage |
| Native Born | 3,687 (96.9%) | 120 (3.2%) |
| Foreign Born, Citizen | 8,680 (93.3%) | 623 (6.7%) |
| Foreign Born, not a Citizen | 4,742 (76.0%) | 1,501 (24.0%) |
Health Insurance Coverage by Household Income in Largo
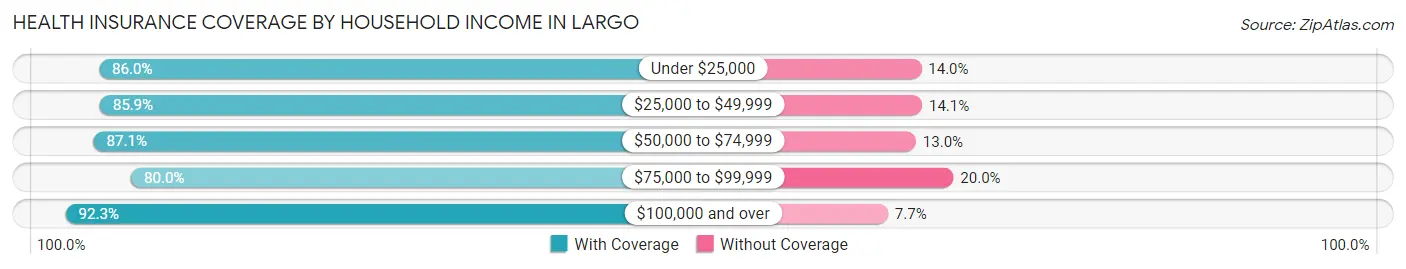
| Household Income | With Coverage | Without Coverage |
| Under $25,000 | 8,216 (86.0%) | 1,334 (14.0%) |
| $25,000 to $49,999 | 15,747 (85.9%) | 2,584 (14.1%) |
| $50,000 to $74,999 | 14,157 (87.1%) | 2,106 (13.0%) |
| $75,000 to $99,999 | 10,205 (80.0%) | 2,547 (20.0%) |
| $100,000 and over | 22,261 (92.3%) | 1,858 (7.7%) |
Public vs Private Health Insurance Coverage by Age in Largo
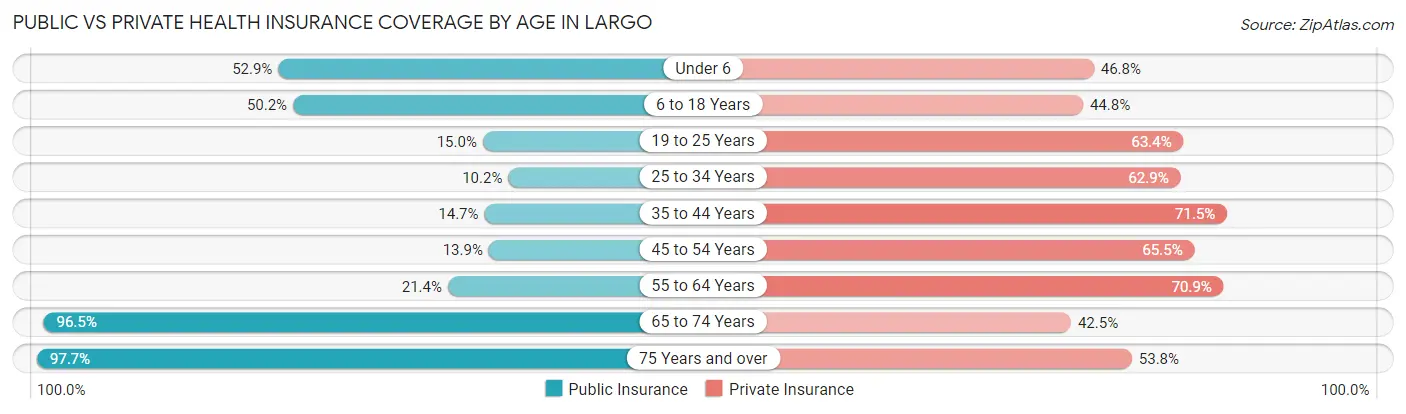
| Age Bracket | Public Insurance | Private Insurance |
| Under 6 | 2,015 (52.9%) | 1,781 (46.8%) |
| 6 to 18 Years | 4,669 (50.2%) | 4,165 (44.8%) |
| 19 to 25 Years | 934 (15.0%) | 3,960 (63.4%) |
| 25 to 34 Years | 986 (10.2%) | 6,056 (62.9%) |
| 35 to 44 Years | 1,301 (14.7%) | 6,346 (71.5%) |
| 45 to 54 Years | 1,314 (13.9%) | 6,209 (65.5%) |
| 55 to 64 Years | 2,739 (21.4%) | 9,055 (70.9%) |
| 65 to 74 Years | 9,941 (96.5%) | 4,383 (42.5%) |
| 75 Years and over | 10,441 (97.7%) | 5,753 (53.8%) |
| Total | 34,340 (42.3%) | 47,708 (58.8%) |
Disability Status by Sex by Age in Largo
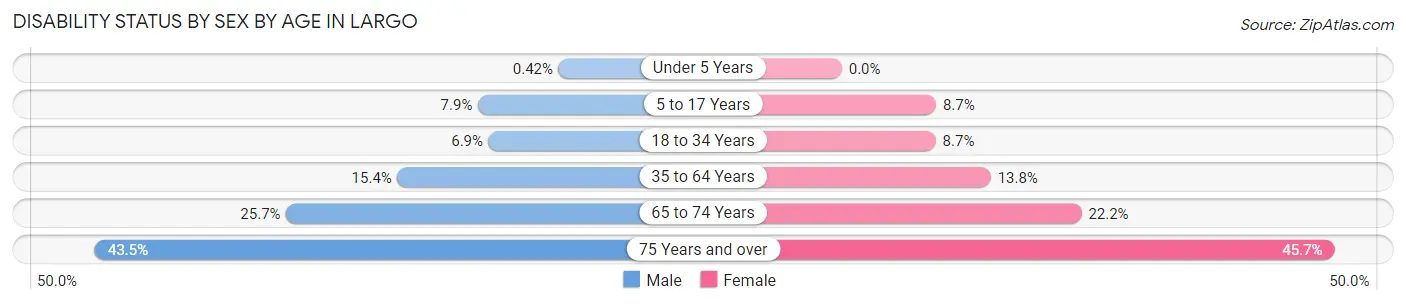
| Age Bracket | Male | Female |
| Under 5 Years | 7 (0.4%) | 0 (0.0%) |
| 5 to 17 Years | 383 (7.9%) | 407 (8.7%) |
| 18 to 34 Years | 562 (6.9%) | 722 (8.7%) |
| 35 to 64 Years | 2,306 (15.4%) | 2,231 (13.8%) |
| 65 to 74 Years | 1,197 (25.7%) | 1,256 (22.2%) |
| 75 Years and over | 2,003 (43.5%) | 2,779 (45.7%) |
Disability Class by Sex by Age in Largo
Disability Class: Hearing Difficulty
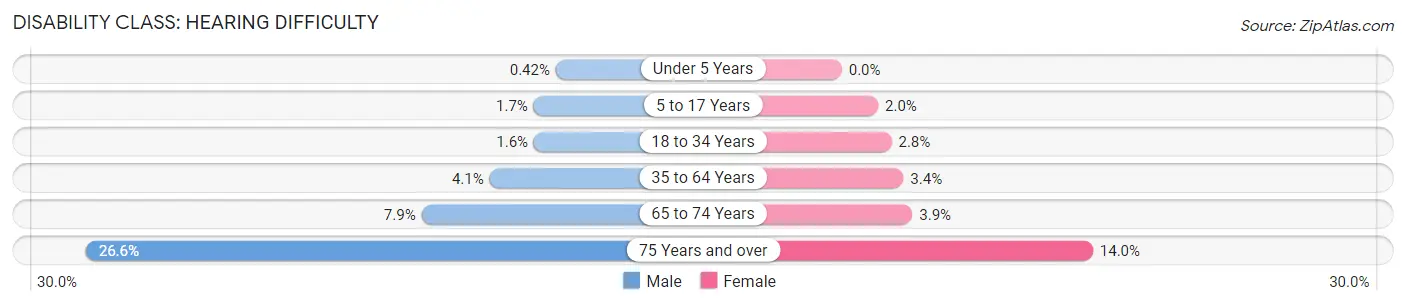
| Age Bracket | Male | Female |
| Under 5 Years | 7 (0.4%) | 0 (0.0%) |
| 5 to 17 Years | 80 (1.7%) | 94 (2.0%) |
| 18 to 34 Years | 133 (1.6%) | 230 (2.8%) |
| 35 to 64 Years | 616 (4.1%) | 553 (3.4%) |
| 65 to 74 Years | 368 (7.9%) | 222 (3.9%) |
| 75 Years and over | 1,225 (26.6%) | 850 (14.0%) |
Disability Class: Vision Difficulty
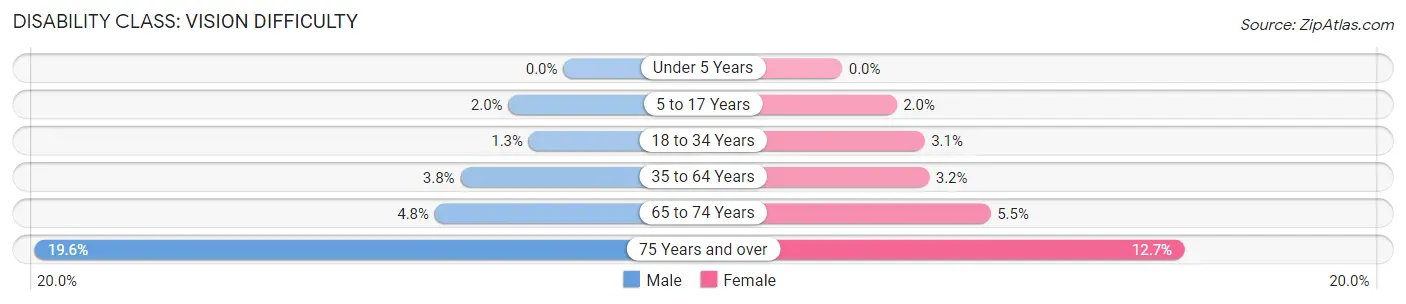
| Age Bracket | Male | Female |
| Under 5 Years | 0 (0.0%) | 0 (0.0%) |
| 5 to 17 Years | 99 (2.0%) | 94 (2.0%) |
| 18 to 34 Years | 104 (1.3%) | 254 (3.1%) |
| 35 to 64 Years | 572 (3.8%) | 522 (3.2%) |
| 65 to 74 Years | 222 (4.8%) | 311 (5.5%) |
| 75 Years and over | 904 (19.6%) | 772 (12.7%) |
Disability Class: Cognitive Difficulty
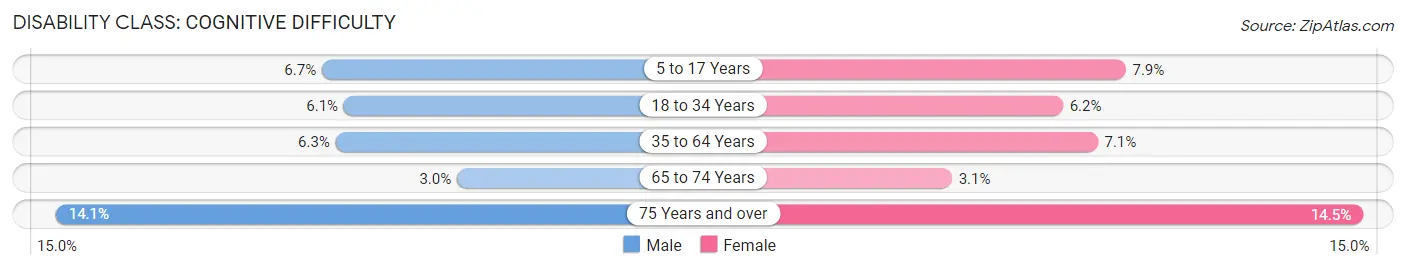
| Age Bracket | Male | Female |
| 5 to 17 Years | 326 (6.7%) | 368 (7.9%) |
| 18 to 34 Years | 497 (6.1%) | 510 (6.1%) |
| 35 to 64 Years | 951 (6.3%) | 1,149 (7.1%) |
| 65 to 74 Years | 138 (3.0%) | 173 (3.1%) |
| 75 Years and over | 651 (14.1%) | 882 (14.5%) |
Disability Class: Ambulatory Difficulty
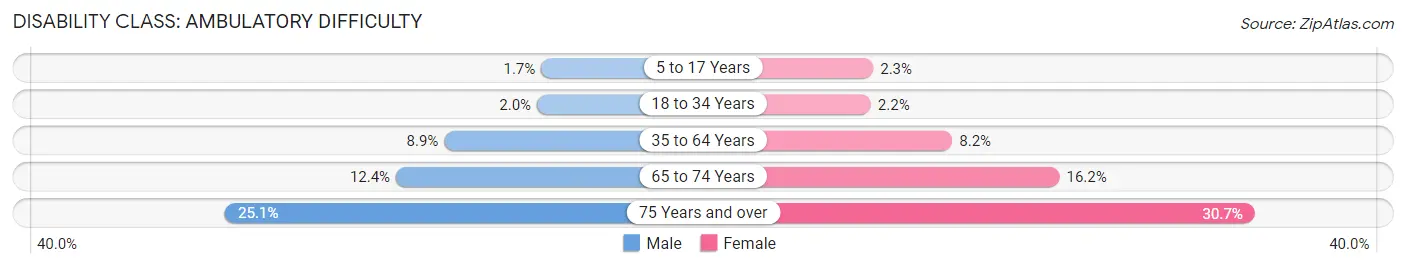
| Age Bracket | Male | Female |
| 5 to 17 Years | 80 (1.7%) | 109 (2.3%) |
| 18 to 34 Years | 159 (2.0%) | 179 (2.2%) |
| 35 to 64 Years | 1,327 (8.8%) | 1,325 (8.2%) |
| 65 to 74 Years | 579 (12.4%) | 913 (16.2%) |
| 75 Years and over | 1,157 (25.1%) | 1,863 (30.6%) |
Disability Class: Self-Care Difficulty
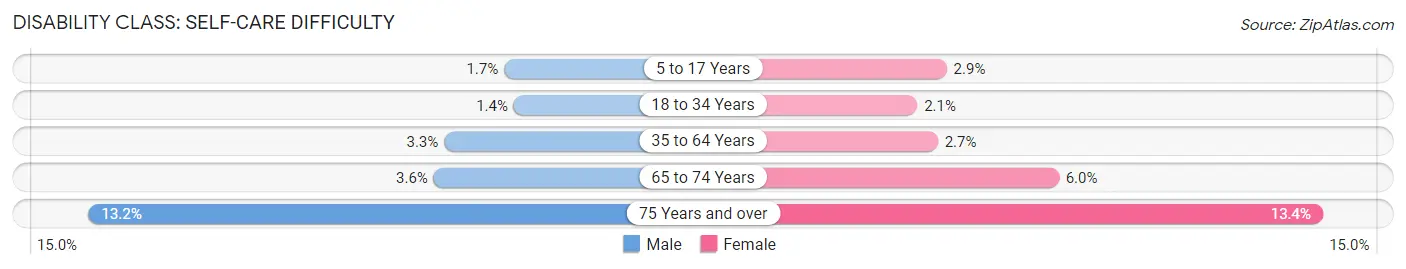
| Age Bracket | Male | Female |
| 5 to 17 Years | 80 (1.7%) | 136 (2.9%) |
| 18 to 34 Years | 112 (1.4%) | 174 (2.1%) |
| 35 to 64 Years | 498 (3.3%) | 431 (2.7%) |
| 65 to 74 Years | 168 (3.6%) | 341 (6.0%) |
| 75 Years and over | 609 (13.2%) | 814 (13.4%) |
Technology Access in Largo
Computing Device Access in Largo
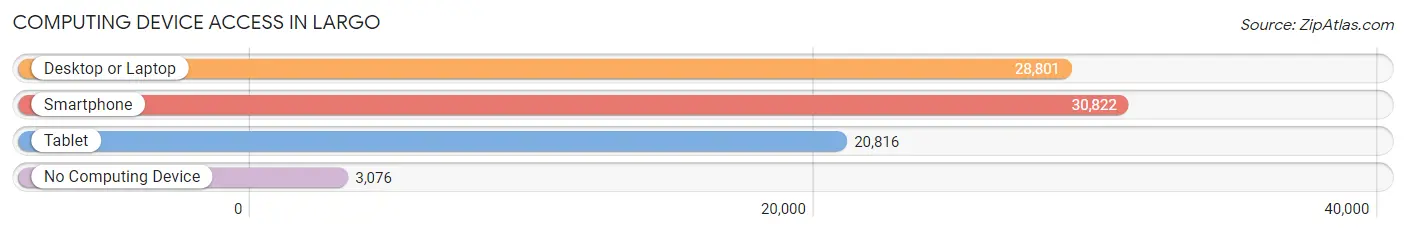
| Device Type | # Households | % Households |
| Desktop or Laptop | 28,801 | 77.9% |
| Smartphone | 30,822 | 83.4% |
| Tablet | 20,816 | 56.3% |
| No Computing Device | 3,076 | 8.3% |
| Total | 36,972 | 100.0% |
Internet Access in Largo
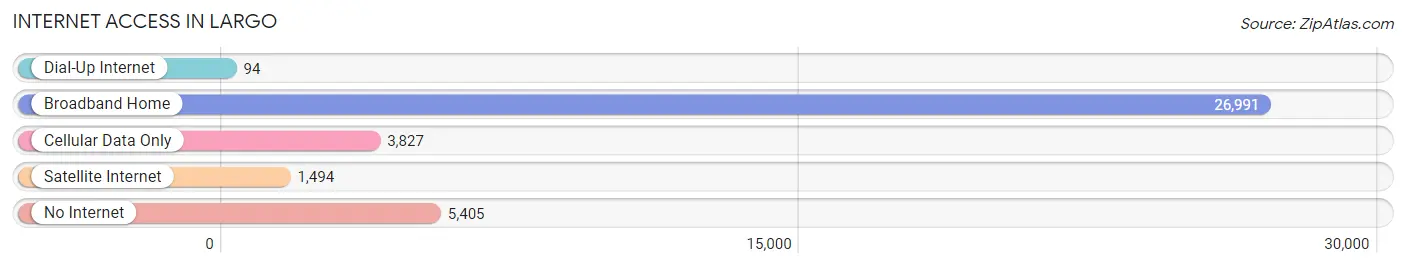
| Internet Type | # Households | % Households |
| Dial-Up Internet | 94 | 0.3% |
| Broadband Home | 26,991 | 73.0% |
| Cellular Data Only | 3,827 | 10.3% |
| Satellite Internet | 1,494 | 4.0% |
| No Internet | 5,405 | 14.6% |
| Total | 36,972 | 100.0% |
Largo Summary
Largo, Florida is a city located in Pinellas County, Florida, United States. It is the third largest city in the Tampa Bay Area, with a population of 77,648 as of the 2010 census. The city is part of the Tampa-St. Petersburg-Clearwater metropolitan area, which is the second largest metropolitan area in the state and the fourth largest in the Southeastern United States.
Geography
Largo is located in central Pinellas County, approximately 20 miles west of Tampa and 25 miles north of St. Petersburg. It is bordered by Clearwater to the west, Seminole to the north, Pinellas Park to the east, and the Gulf of Mexico to the south. The city covers an area of approximately 20 square miles, with a total land area of 18.2 square miles.
The city is situated on a flat coastal plain, with elevations ranging from sea level to about 25 feet. The highest point in the city is located at the intersection of East Bay Drive and Seminole Boulevard, which is approximately 25 feet above sea level. The city is located on the western edge of Tampa Bay, and is home to several small lakes and ponds, including Lake Seminole, Lake Largo, and Lake Taylor.
Climate
Largo has a humid subtropical climate, with hot, humid summers and mild, dry winters. The average annual temperature is 73.2°F, with an average high of 81.2°F in July and an average low of 64.2°F in January. The average annual precipitation is 51.2 inches, with an average of 6.2 inches of snowfall per year.
Demographics
As of the 2010 census, the population of Largo was 77,648, with a population density of 4,092 people per square mile. The racial makeup of the city was 74.2% White, 14.3% African American, 0.5% Native American, 3.2% Asian, 0.1% Pacific Islander, 5.2% from other races, and 2.5% from two or more races. Hispanic or Latino of any race were 14.3% of the population.
The median household income in Largo was $45,845, and the median family income was $54,845. The per capita income for the city was $25,845. About 11.2% of families and 14.3% of the population were below the poverty line, including 19.2% of those under age 18 and 8.2% of those age 65 or over.
Economy
Largo is home to a diverse economy, with a variety of industries represented. The largest employers in the city are BayCare Health System, Pinellas County Schools, and the City of Largo. Other major employers include Publix Super Markets, Walmart, and the Pinellas County Sheriff's Office.
The city is also home to a number of retail and entertainment venues, including the Largo Mall, the Largo Cultural Center, and the Largo Public Library. The city is also home to a number of parks and recreational facilities, including the Largo Central Park, the Largo Nature Preserve, and the Largo Sports Complex.
Conclusion
Largo, Florida is a vibrant city located in Pinellas County, Florida. It is the third largest city in the Tampa Bay Area, with a population of 77,648 as of the 2010 census. The city is part of the Tampa-St. Petersburg-Clearwater metropolitan area, and is home to a diverse economy, with a variety of industries represented. The city is also home to a number of retail and entertainment venues, parks and recreational facilities, and is a popular destination for tourists and residents alike.
Common Questions
What is Per Capita Income in Largo?
Per Capita income in Largo is $35,314.
What is the Median Family Income in Largo?
Median Family Income in Largo is $68,958.
What is the Median Household income in Largo?
Median Household Income in Largo is $56,266.
What is Income or Wage Gap in Largo?
Income or Wage Gap in Largo is 17.5%.
Women in Largo earn 82.5 cents for every dollar earned by a man.
What is Family Income Deficit in Largo?
Family Income Deficit in Largo is $10,166.
Families that are below poverty line in Largo earn $10,166 less on average than the poverty threshold level.
What is Inequality or Gini Index in Largo?
Inequality or Gini Index in Largo is 0.44.
What is the Total Population of Largo?
Total Population of Largo is 82,541.
What is the Total Male Population of Largo?
Total Male Population of Largo is 39,496.
What is the Total Female Population of Largo?
Total Female Population of Largo is 43,045.
What is the Ratio of Males per 100 Females in Largo?
There are 91.76 Males per 100 Females in Largo.
What is the Ratio of Females per 100 Males in Largo?
There are 108.99 Females per 100 Males in Largo.
What is the Median Population Age in Largo?
Median Population Age in Largo is 48.9 Years.
What is the Average Family Size in Largo
Average Family Size in Largo is 3.0 People.
What is the Average Household Size in Largo
Average Household Size in Largo is 2.2 People.
How Large is the Labor Force in Largo?
There are 41,880 People in the Labor Forcein in Largo.
What is the Percentage of People in the Labor Force in Largo?
58.7% of People are in the Labor Force in Largo.
What is the Unemployment Rate in Largo?
Unemployment Rate in Largo is 5.0%.