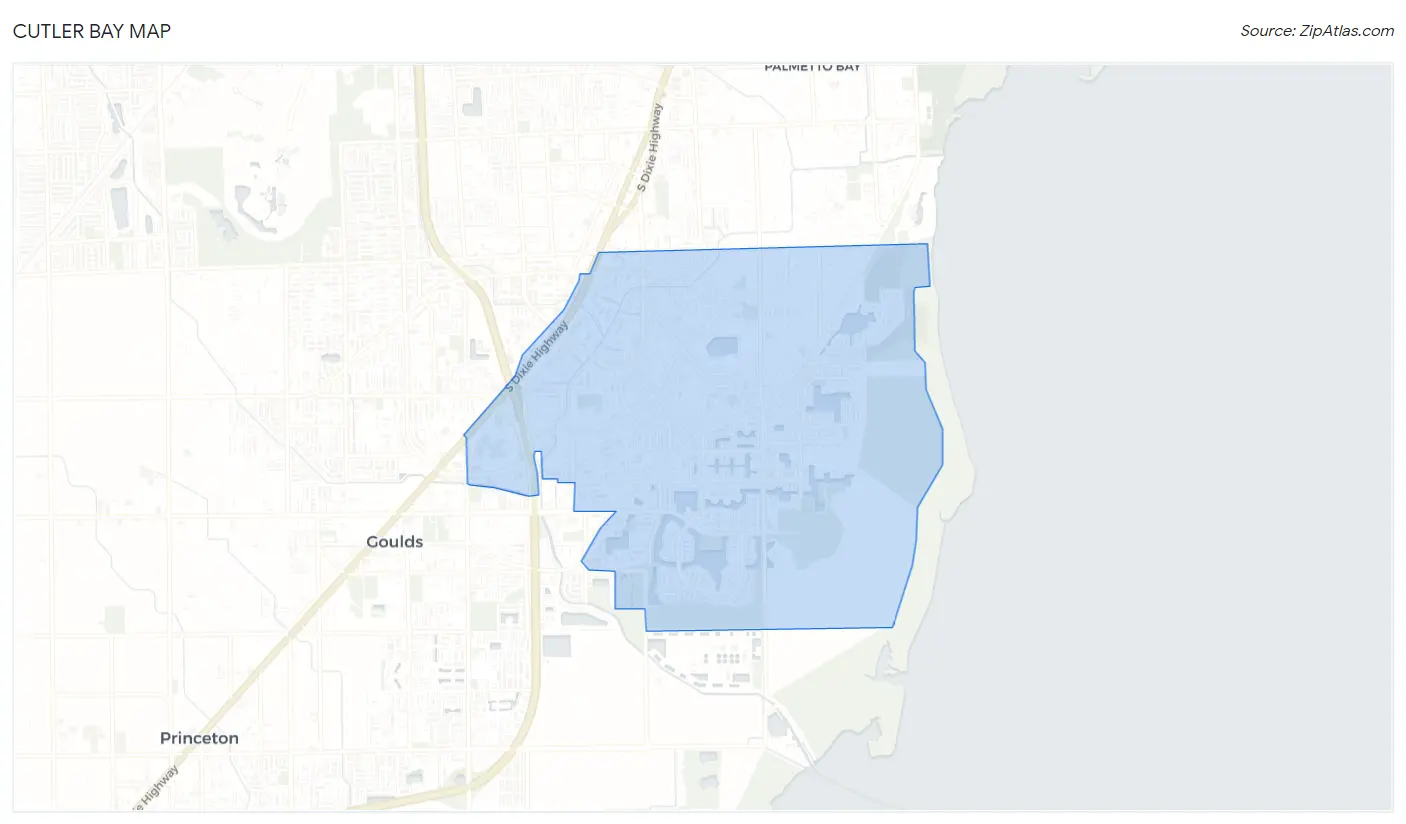
Cutler Bay, FL Map & Demographics
Cutler Bay Map
Cutler Bay Overview
$32,576
PER CAPITA INCOME
$83,518
AVG FAMILY INCOME
$78,569
AVG HOUSEHOLD INCOME
22.6%
WAGE / INCOME GAP [ % ]
77.4¢/ $1
WAGE / INCOME GAP [ $ ]
0.41
INEQUALITY / GINI INDEX
44,738
TOTAL POPULATION
21,408
MALE POPULATION
23,330
FEMALE POPULATION
91.76
MALES / 100 FEMALES
108.98
FEMALES / 100 MALES
40.9
MEDIAN AGE
3.4
AVG FAMILY SIZE
3.1
AVG HOUSEHOLD SIZE
24,098
LABOR FORCE [ PEOPLE ]
66.8%
PERCENT IN LABOR FORCE
4.4%
UNEMPLOYMENT RATE
Income in Cutler Bay
Income Overview in Cutler Bay
Per Capita Income in Cutler Bay is $32,576, while median incomes of families and households are $83,518 and $78,569 respectively.
| Characteristic | Number | Measure |
| Per Capita Income | 44,738 | $32,576 |
| Median Family Income | 11,377 | $83,518 |
| Mean Family Income | 11,377 | $101,766 |
| Median Household Income | 14,366 | $78,569 |
| Mean Household Income | 14,366 | $96,944 |
| Income Deficit | 11,377 | $0 |
| Wage / Income Gap (%) | 44,738 | 22.56% |
| Wage / Income Gap ($) | 44,738 | 77.44¢ per $1 |
| Gini / Inequality Index | 44,738 | 0.41 |
Earnings by Sex in Cutler Bay
Average Earnings in Cutler Bay are $40,709, $44,355 for men and $34,348 for women, a difference of 22.6%.
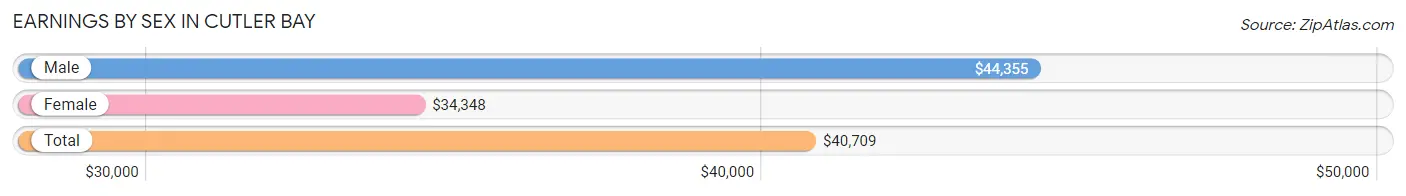
| Sex | Number | Average Earnings |
| Male | 12,846 (52.6%) | $44,355 |
| Female | 11,581 (47.4%) | $34,348 |
| Total | 24,427 (100.0%) | $40,709 |
Earnings by Sex by Income Bracket in Cutler Bay
The most common earnings brackets in Cutler Bay are $100,000+ for men (1,954 | 15.2%) and $25,000 to $29,999 for women (1,162 | 10.0%).
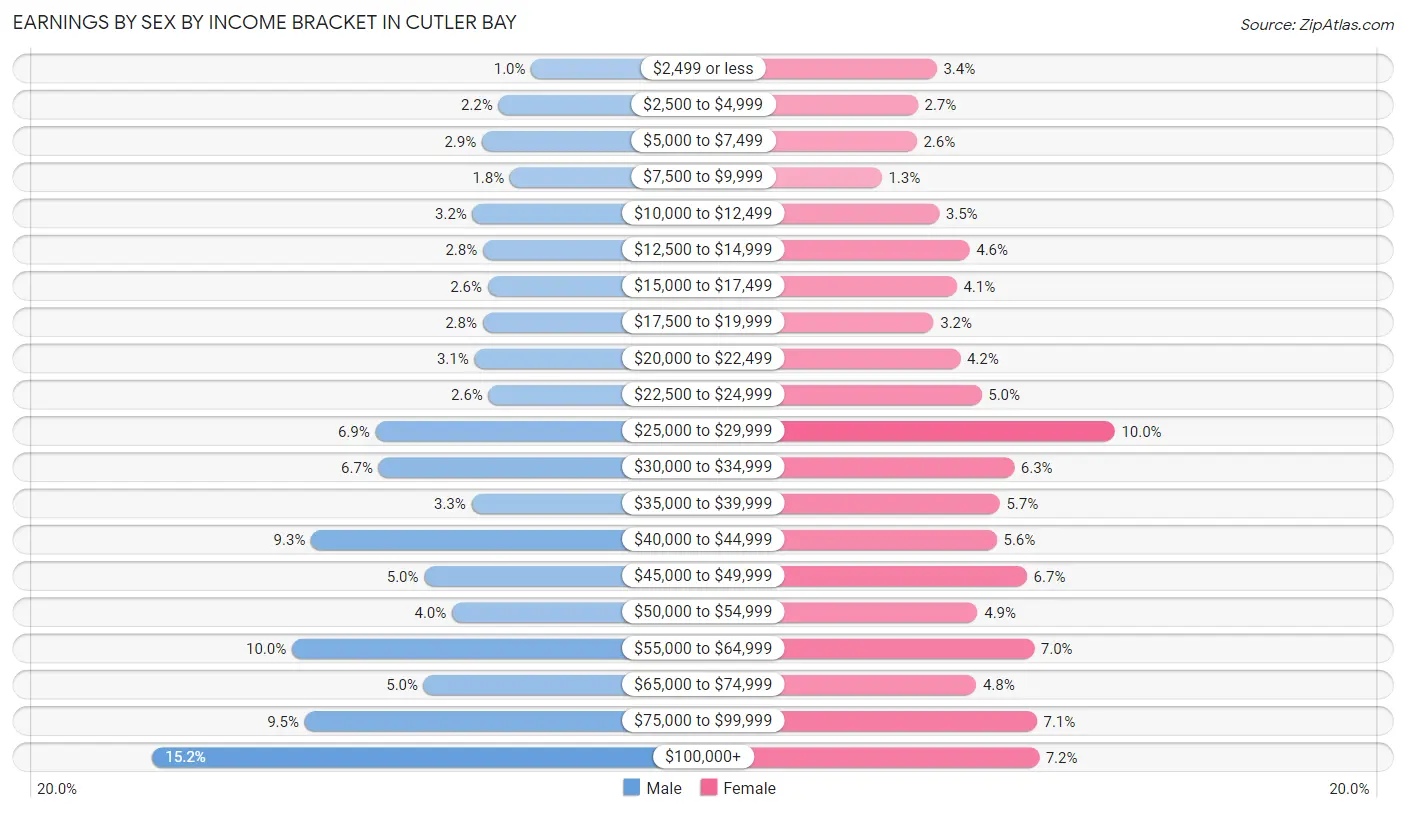
| Income | Male | Female |
| $2,499 or less | 130 (1.0%) | 389 (3.4%) |
| $2,500 to $4,999 | 288 (2.2%) | 307 (2.6%) |
| $5,000 to $7,499 | 367 (2.9%) | 302 (2.6%) |
| $7,500 to $9,999 | 233 (1.8%) | 151 (1.3%) |
| $10,000 to $12,499 | 412 (3.2%) | 399 (3.5%) |
| $12,500 to $14,999 | 362 (2.8%) | 532 (4.6%) |
| $15,000 to $17,499 | 339 (2.6%) | 476 (4.1%) |
| $17,500 to $19,999 | 363 (2.8%) | 375 (3.2%) |
| $20,000 to $22,499 | 404 (3.1%) | 491 (4.2%) |
| $22,500 to $24,999 | 335 (2.6%) | 584 (5.0%) |
| $25,000 to $29,999 | 880 (6.9%) | 1,162 (10.0%) |
| $30,000 to $34,999 | 864 (6.7%) | 725 (6.3%) |
| $35,000 to $39,999 | 418 (3.3%) | 663 (5.7%) |
| $40,000 to $44,999 | 1,190 (9.3%) | 650 (5.6%) |
| $45,000 to $49,999 | 645 (5.0%) | 781 (6.7%) |
| $50,000 to $54,999 | 511 (4.0%) | 566 (4.9%) |
| $55,000 to $64,999 | 1,282 (10.0%) | 812 (7.0%) |
| $65,000 to $74,999 | 648 (5.0%) | 560 (4.8%) |
| $75,000 to $99,999 | 1,221 (9.5%) | 823 (7.1%) |
| $100,000+ | 1,954 (15.2%) | 833 (7.2%) |
| Total | 12,846 (100.0%) | 11,581 (100.0%) |
Earnings by Sex by Educational Attainment in Cutler Bay
Average earnings in Cutler Bay are $46,633 for men and $39,077 for women, a difference of 16.2%. Men with an educational attainment of graduate degree enjoy the highest average annual earnings of $92,500, while those with less than high school education earn the least with $42,724. Women with an educational attainment of graduate degree earn the most with the average annual earnings of $81,445, while those with less than high school education have the smallest earnings of $23,031.
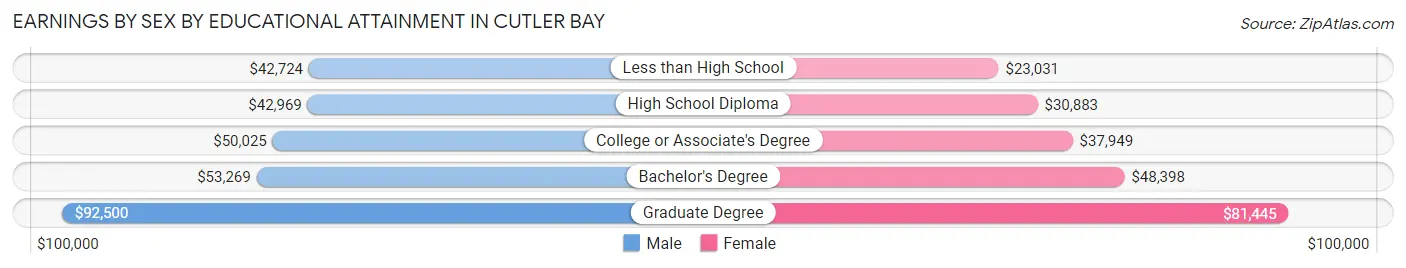
| Educational Attainment | Male Income | Female Income |
| Less than High School | $42,724 | $23,031 |
| High School Diploma | $42,969 | $30,883 |
| College or Associate's Degree | $50,025 | $37,949 |
| Bachelor's Degree | $53,269 | $48,398 |
| Graduate Degree | $92,500 | $81,445 |
| Total | $46,633 | $39,077 |
Family Income in Cutler Bay
Family Income Brackets in Cutler Bay
According to the Cutler Bay family income data, there are 2,355 families falling into the $100,000 to $149,999 income range, which is the most common income bracket and makes up 20.7% of all families. Conversely, the less than $10,000 income bracket is the least frequent group with only 284 families (2.5%) belonging to this category.
| Income Bracket | # Families | % Families |
| Less than $10,000 | 284 | 2.5% |
| $10,000 to $14,999 | 307 | 2.7% |
| $15,000 to $24,999 | 557 | 4.9% |
| $25,000 to $34,999 | 956 | 8.4% |
| $35,000 to $49,999 | 1,331 | 11.7% |
| $50,000 to $74,999 | 1,775 | 15.6% |
| $75,000 to $99,999 | 1,672 | 14.7% |
| $100,000 to $149,999 | 2,355 | 20.7% |
| $150,000 to $199,999 | 910 | 8.0% |
| $200,000+ | 1,229 | 10.8% |
Family Income by Famaliy Size in Cutler Bay
7+ person families (128 | 1.1%) account for the highest median family income in Cutler Bay with $124,179 per family, while 2-person families (4,342 | 38.2%) have the highest median income of $33,676 per family member.
| Income Bracket | # Families | Median Income |
| 2-Person Families | 4,342 (38.2%) | $67,351 |
| 3-Person Families | 3,231 (28.4%) | $89,861 |
| 4-Person Families | 2,489 (21.9%) | $88,856 |
| 5-Person Families | 897 (7.9%) | $107,113 |
| 6-Person Families | 290 (2.5%) | $86,518 |
| 7+ Person Families | 128 (1.1%) | $124,179 |
| Total | 11,377 (100.0%) | $83,518 |
Family Income by Number of Earners in Cutler Bay
The median family income in Cutler Bay is $83,518, with families comprising 3+ earners (1,689) having the highest median family income of $123,875, while families with no earners (1,167) have the lowest median family income of $29,539, accounting for 14.8% and 10.3% of families, respectively.
| Number of Earners | # Families | Median Income |
| No Earners | 1,167 (10.3%) | $29,539 |
| 1 Earner | 3,699 (32.5%) | $48,198 |
| 2 Earners | 4,822 (42.4%) | $104,845 |
| 3+ Earners | 1,689 (14.8%) | $123,875 |
| Total | 11,377 (100.0%) | $83,518 |
Household Income in Cutler Bay
Household Income Brackets in Cutler Bay
With 3,031 households falling in the category, the $100,000 to $149,999 income range is the most frequent in Cutler Bay, accounting for 21.1% of all households. In contrast, only 445 households (3.1%) fall into the less than $10,000 income bracket, making it the least populous group.
| Income Bracket | # Households | % Households |
| Less than $10,000 | 445 | 3.1% |
| $10,000 to $14,999 | 532 | 3.7% |
| $15,000 to $24,999 | 747 | 5.2% |
| $25,000 to $34,999 | 1,135 | 7.9% |
| $35,000 to $49,999 | 1,882 | 13.1% |
| $50,000 to $74,999 | 2,227 | 15.5% |
| $75,000 to $99,999 | 1,954 | 13.6% |
| $100,000 to $149,999 | 3,031 | 21.1% |
| $150,000 to $199,999 | 1,077 | 7.5% |
| $200,000+ | 1,350 | 9.4% |
Household Income by Householder Age in Cutler Bay
The median household income in Cutler Bay is $78,569, with the highest median household income of $92,043 found in the 25 to 44 years age bracket for the primary householder. A total of 4,385 households (30.5%) fall into this category. Meanwhile, the 65+ years age bracket for the primary householder has the lowest median household income of $34,895, with 3,562 households (24.8%) in this group.
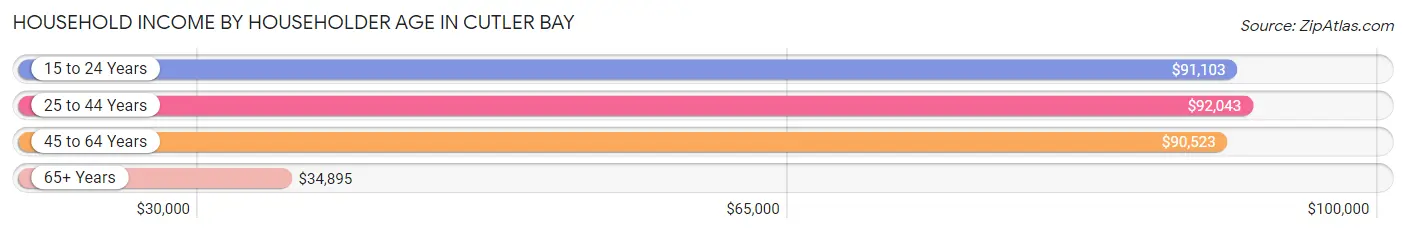
| Income Bracket | # Households | Median Income |
| 15 to 24 Years | 67 (0.5%) | $91,103 |
| 25 to 44 Years | 4,385 (30.5%) | $92,043 |
| 45 to 64 Years | 6,352 (44.2%) | $90,523 |
| 65+ Years | 3,562 (24.8%) | $34,895 |
| Total | 14,366 (100.0%) | $78,569 |
Poverty in Cutler Bay
Income Below Poverty by Sex and Age in Cutler Bay
With 8.2% poverty level for males and 12.4% for females among the residents of Cutler Bay, 5 year old males and 16 and 17 year old females are the most vulnerable to poverty, with 90 males (34.9%) and 357 females (37.4%) in their respective age groups living below the poverty level.
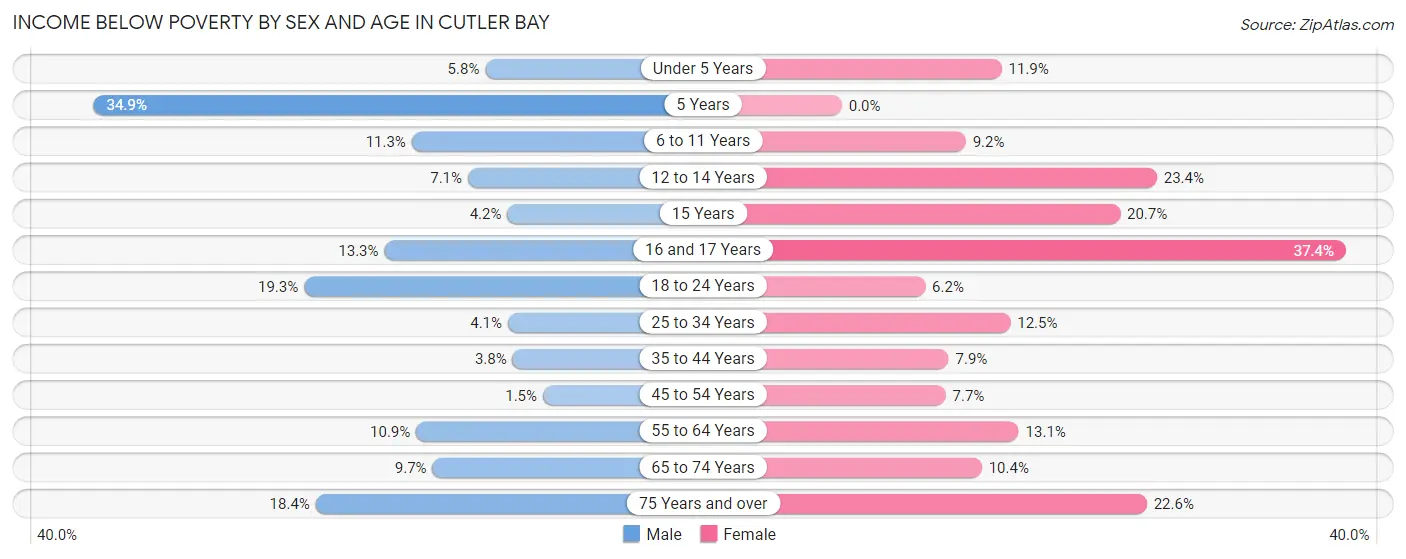
| Age Bracket | Male | Female |
| Under 5 Years | 76 (5.8%) | 120 (11.9%) |
| 5 Years | 90 (34.9%) | 0 (0.0%) |
| 6 to 11 Years | 138 (11.3%) | 170 (9.2%) |
| 12 to 14 Years | 74 (7.1%) | 182 (23.4%) |
| 15 Years | 15 (4.2%) | 75 (20.7%) |
| 16 and 17 Years | 61 (13.3%) | 357 (37.4%) |
| 18 to 24 Years | 302 (19.3%) | 113 (6.2%) |
| 25 to 34 Years | 128 (4.1%) | 300 (12.5%) |
| 35 to 44 Years | 115 (3.8%) | 225 (7.9%) |
| 45 to 54 Years | 45 (1.5%) | 324 (7.7%) |
| 55 to 64 Years | 324 (10.9%) | 331 (13.1%) |
| 65 to 74 Years | 164 (9.7%) | 225 (10.4%) |
| 75 Years and over | 194 (18.4%) | 435 (22.6%) |
| Total | 1,726 (8.2%) | 2,857 (12.4%) |
Income Above Poverty by Sex and Age in Cutler Bay
According to the poverty statistics in Cutler Bay, males aged 45 to 54 years and females aged 5 years are the age groups that are most secure financially, with 98.5% of males and 100.0% of females in these age groups living above the poverty line.
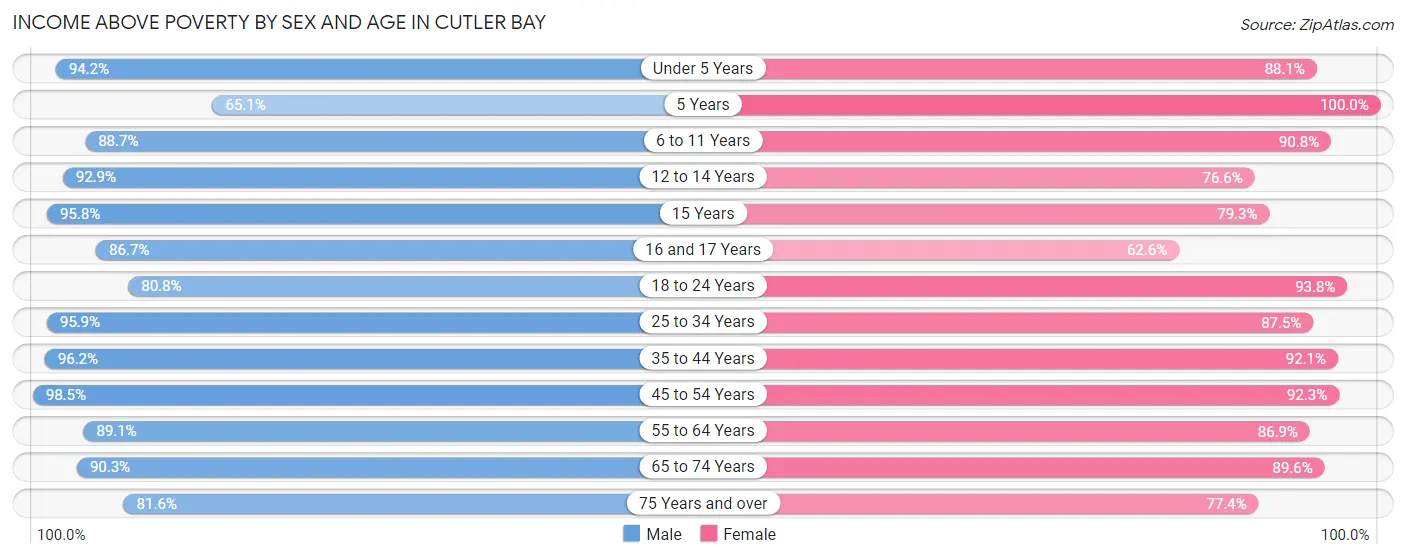
| Age Bracket | Male | Female |
| Under 5 Years | 1,235 (94.2%) | 892 (88.1%) |
| 5 Years | 168 (65.1%) | 213 (100.0%) |
| 6 to 11 Years | 1,088 (88.7%) | 1,678 (90.8%) |
| 12 to 14 Years | 969 (92.9%) | 596 (76.6%) |
| 15 Years | 346 (95.8%) | 288 (79.3%) |
| 16 and 17 Years | 398 (86.7%) | 597 (62.6%) |
| 18 to 24 Years | 1,267 (80.7%) | 1,712 (93.8%) |
| 25 to 34 Years | 2,980 (95.9%) | 2,098 (87.5%) |
| 35 to 44 Years | 2,935 (96.2%) | 2,611 (92.1%) |
| 45 to 54 Years | 2,917 (98.5%) | 3,881 (92.3%) |
| 55 to 64 Years | 2,639 (89.1%) | 2,190 (86.9%) |
| 65 to 74 Years | 1,523 (90.3%) | 1,941 (89.6%) |
| 75 Years and over | 861 (81.6%) | 1,486 (77.4%) |
| Total | 19,326 (91.8%) | 20,183 (87.6%) |
Income Below Poverty Among Married-Couple Families in Cutler Bay
The poverty statistics for married-couple families in Cutler Bay show that 4.5% or 347 of the total 7,759 families live below the poverty line. Families with 5 or more children have the highest poverty rate of 100.0%, comprising of 16 families. On the other hand, families with 3 or 4 children have the lowest poverty rate of 0.3%, which includes 1 families.
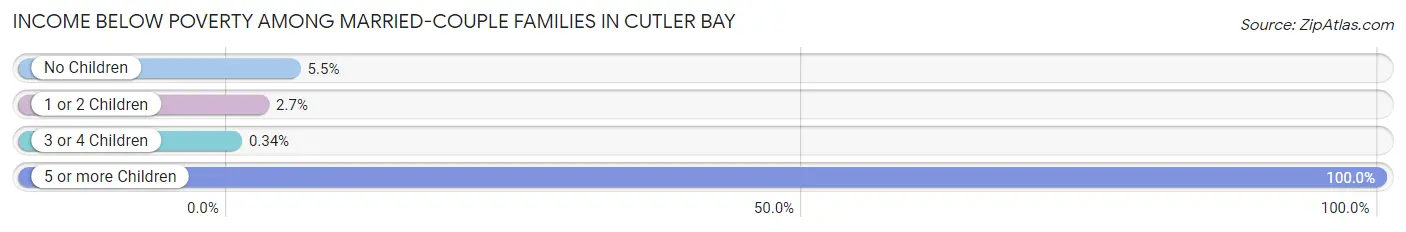
| Children | Above Poverty | Below Poverty |
| No Children | 4,424 (94.6%) | 255 (5.4%) |
| 1 or 2 Children | 2,694 (97.3%) | 75 (2.7%) |
| 3 or 4 Children | 294 (99.7%) | 1 (0.3%) |
| 5 or more Children | 0 (0.0%) | 16 (100.0%) |
| Total | 7,412 (95.5%) | 347 (4.5%) |
Income Below Poverty Among Single-Parent Households in Cutler Bay
According to the poverty data in Cutler Bay, 1.1% or 11 single-father households and 22.8% or 604 single-mother households are living below the poverty line. Among single-father households, those with 1 or 2 children have the highest poverty rate, with 11 households (2.9%) experiencing poverty. Likewise, among single-mother households, those with 1 or 2 children have the highest poverty rate, with 507 households (32.5%) falling below the poverty line.
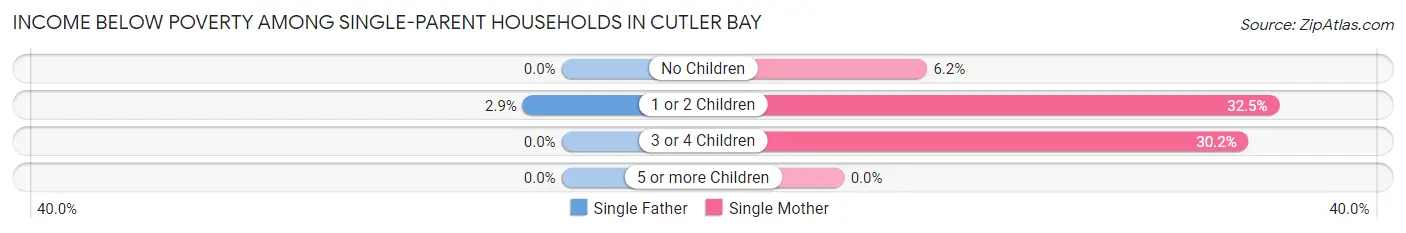
| Children | Single Father | Single Mother |
| No Children | 0 (0.0%) | 59 (6.2%) |
| 1 or 2 Children | 11 (2.9%) | 507 (32.5%) |
| 3 or 4 Children | 0 (0.0%) | 38 (30.2%) |
| 5 or more Children | 0 (0.0%) | 0 (0.0%) |
| Total | 11 (1.1%) | 604 (22.8%) |
Income Below Poverty Among Married-Couple vs Single-Parent Households in Cutler Bay
The poverty data for Cutler Bay shows that 347 of the married-couple family households (4.5%) and 615 of the single-parent households (17.0%) are living below the poverty level. Within the married-couple family households, those with 5 or more children have the highest poverty rate, with 16 households (100.0%) falling below the poverty line. Among the single-parent households, those with 1 or 2 children have the highest poverty rate, with 518 household (26.7%) living below poverty.
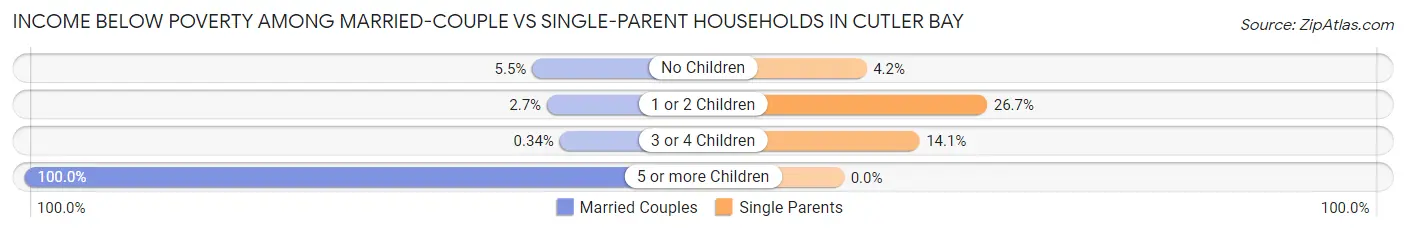
| Children | Married-Couple Families | Single-Parent Households |
| No Children | 255 (5.4%) | 59 (4.2%) |
| 1 or 2 Children | 75 (2.7%) | 518 (26.7%) |
| 3 or 4 Children | 1 (0.3%) | 38 (14.1%) |
| 5 or more Children | 16 (100.0%) | 0 (0.0%) |
| Total | 347 (4.5%) | 615 (17.0%) |
Race in Cutler Bay
The most populous races in Cutler Bay are Hispanic or Latino (28,589 | 63.9%), White / Caucasian (22,917 | 51.2%), and Two or more Races (14,184 | 31.7%).
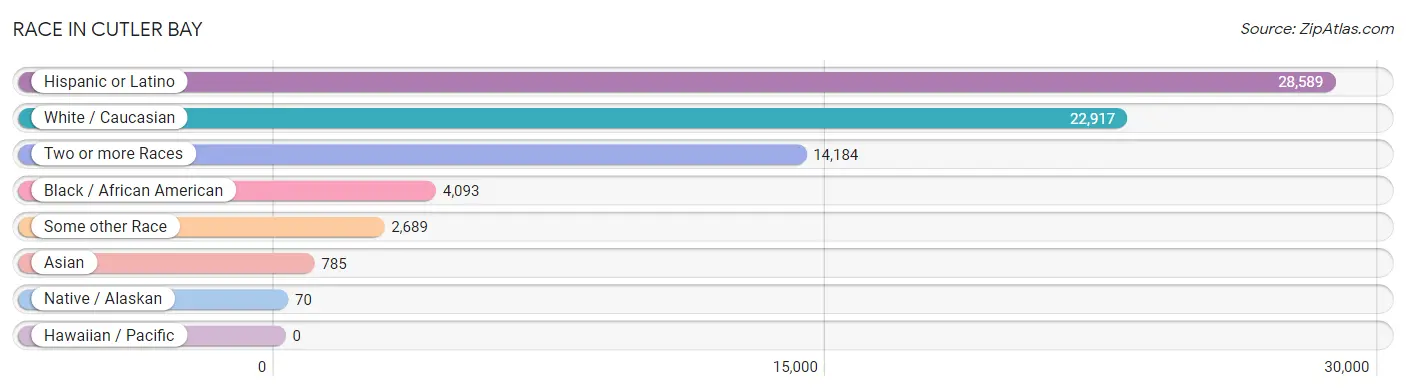
| Race | # Population | % Population |
| Asian | 785 | 1.8% |
| Black / African American | 4,093 | 9.1% |
| Hawaiian / Pacific | 0 | 0.0% |
| Hispanic or Latino | 28,589 | 63.9% |
| Native / Alaskan | 70 | 0.2% |
| White / Caucasian | 22,917 | 51.2% |
| Two or more Races | 14,184 | 31.7% |
| Some other Race | 2,689 | 6.0% |
| Total | 44,738 | 100.0% |
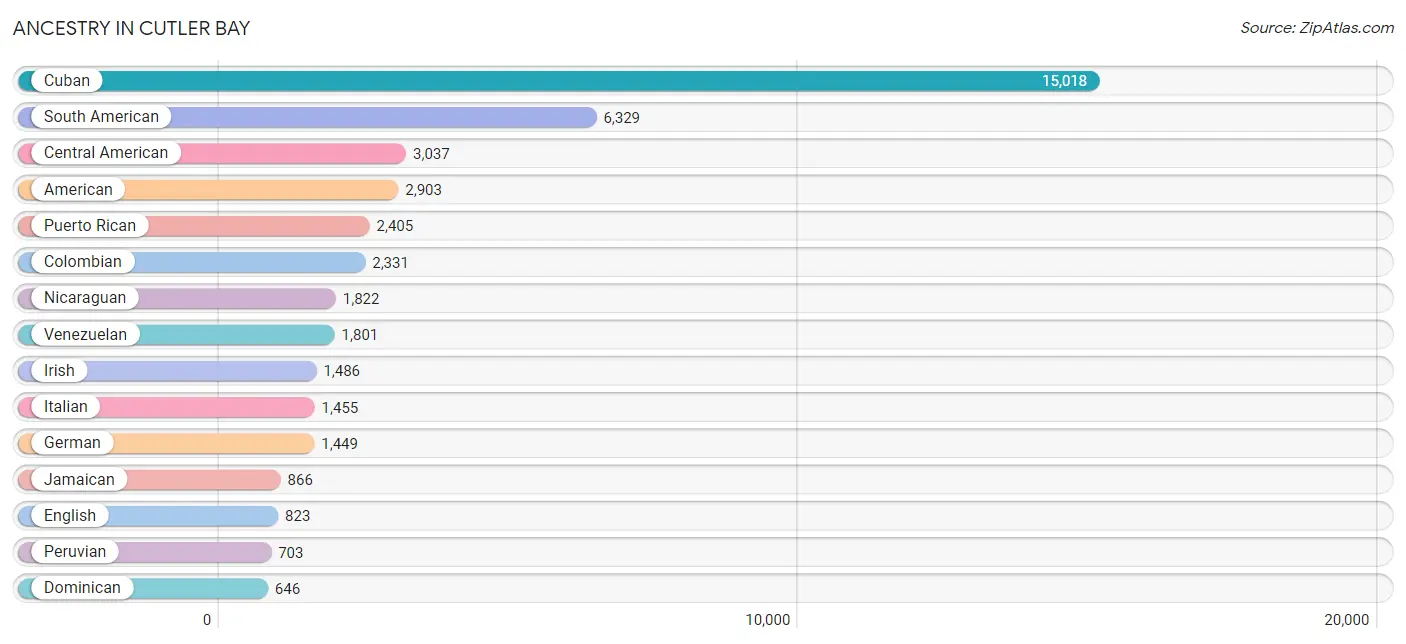
Ancestry in Cutler Bay
The most populous ancestries reported in Cutler Bay are Cuban (15,018 | 33.6%), South American (6,329 | 14.1%), Central American (3,037 | 6.8%), American (2,903 | 6.5%), and Puerto Rican (2,405 | 5.4%), together accounting for 66.4% of all Cutler Bay residents.
| Ancestry | # Population | % Population |
| African | 79 | 0.2% |
| American | 2,903 | 6.5% |
| Arab | 217 | 0.5% |
| Argentinean | 464 | 1.0% |
| Australian | 9 | 0.0% |
| Austrian | 19 | 0.0% |
| Barbadian | 6 | 0.0% |
| Basque | 61 | 0.1% |
| Bermudan | 13 | 0.0% |
| Bhutanese | 79 | 0.2% |
| Bolivian | 33 | 0.1% |
| Brazilian | 402 | 0.9% |
| British | 61 | 0.1% |
| British West Indian | 40 | 0.1% |
| Bulgarian | 66 | 0.2% |
| Burmese | 371 | 0.8% |
| Canadian | 18 | 0.0% |
| Celtic | 6 | 0.0% |
| Central American | 3,037 | 6.8% |
| Central American Indian | 102 | 0.2% |
| Cherokee | 32 | 0.1% |
| Chilean | 461 | 1.0% |
| Colombian | 2,331 | 5.2% |
| Costa Rican | 44 | 0.1% |
| Croatian | 8 | 0.0% |
| Cuban | 15,018 | 33.6% |
| Czech | 55 | 0.1% |
| Danish | 52 | 0.1% |
| Dominican | 646 | 1.4% |
| Dutch | 126 | 0.3% |
| Dutch West Indian | 87 | 0.2% |
| Eastern European | 124 | 0.3% |
| Ecuadorian | 474 | 1.1% |
| English | 823 | 1.8% |
| Ethiopian | 65 | 0.2% |
| European | 167 | 0.4% |
| French | 284 | 0.6% |
| French Canadian | 55 | 0.1% |
| German | 1,449 | 3.2% |
| Greek | 47 | 0.1% |
| Guatemalan | 256 | 0.6% |
| Guyanese | 140 | 0.3% |
| Haitian | 592 | 1.3% |
| Honduran | 435 | 1.0% |
| Hungarian | 27 | 0.1% |
| Indian (Asian) | 402 | 0.9% |
| Iranian | 42 | 0.1% |
| Irish | 1,486 | 3.3% |
| Italian | 1,455 | 3.3% |
| Jamaican | 866 | 1.9% |
| Korean | 127 | 0.3% |
| Lebanese | 193 | 0.4% |
| Lithuanian | 25 | 0.1% |
| Mexican | 530 | 1.2% |
| Moroccan | 11 | 0.0% |
| Nicaraguan | 1,822 | 4.1% |
| Nigerian | 200 | 0.4% |
| Norwegian | 105 | 0.2% |
| Pakistani | 138 | 0.3% |
| Panamanian | 222 | 0.5% |
| Peruvian | 703 | 1.6% |
| Polish | 439 | 1.0% |
| Portuguese | 177 | 0.4% |
| Puerto Rican | 2,405 | 5.4% |
| Romanian | 17 | 0.0% |
| Russian | 365 | 0.8% |
| Salvadoran | 258 | 0.6% |
| Scandinavian | 30 | 0.1% |
| Scotch-Irish | 81 | 0.2% |
| Scottish | 380 | 0.9% |
| Slavic | 8 | 0.0% |
| Slovak | 15 | 0.0% |
| South American | 6,329 | 14.1% |
| South American Indian | 46 | 0.1% |
| Spaniard | 265 | 0.6% |
| Spanish | 36 | 0.1% |
| Sri Lankan | 54 | 0.1% |
| Subsaharan African | 356 | 0.8% |
| Swedish | 260 | 0.6% |
| Swiss | 39 | 0.1% |
| Syrian | 14 | 0.0% |
| Thai | 175 | 0.4% |
| Trinidadian and Tobagonian | 94 | 0.2% |
| Turkish | 85 | 0.2% |
| Uruguayan | 62 | 0.1% |
| Venezuelan | 1,801 | 4.0% |
| Welsh | 37 | 0.1% |
| West Indian | 55 | 0.1% | View All 88 Rows |
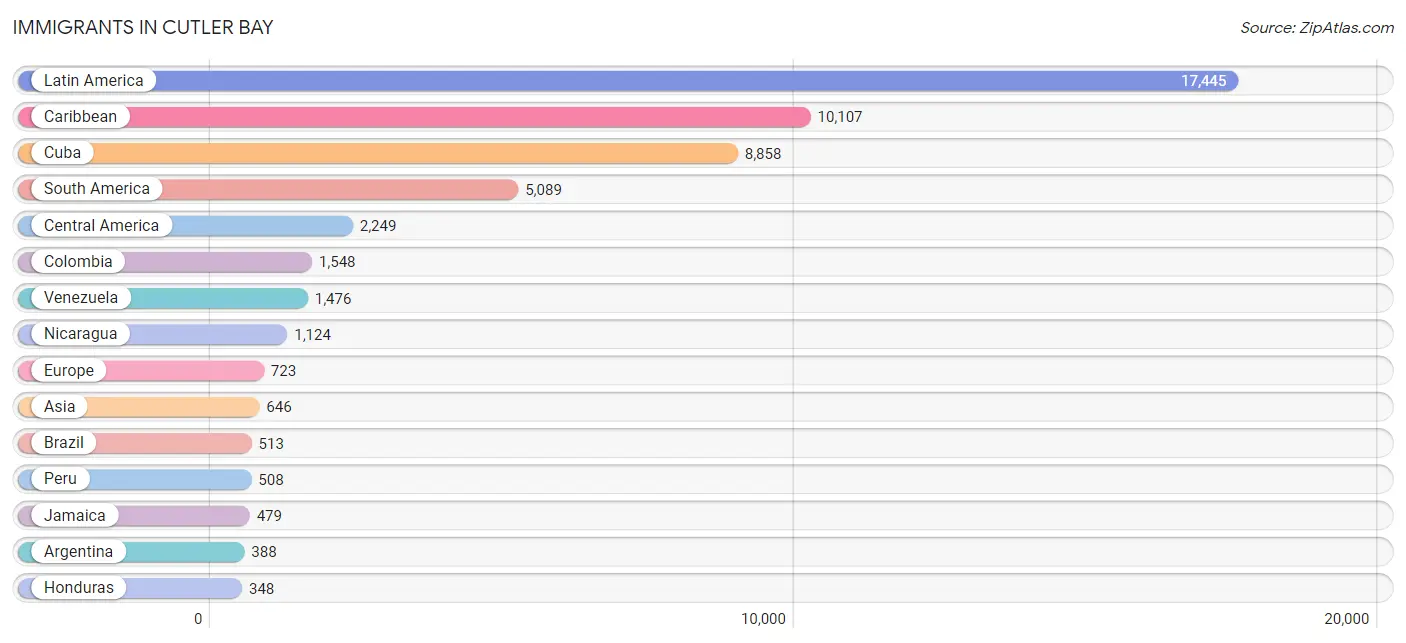
Immigrants in Cutler Bay
The most numerous immigrant groups reported in Cutler Bay came from Latin America (17,445 | 39.0%), Caribbean (10,107 | 22.6%), Cuba (8,858 | 19.8%), South America (5,089 | 11.4%), and Central America (2,249 | 5.0%), together accounting for 97.8% of all Cutler Bay residents.
| Immigration Origin | # Population | % Population |
| Africa | 255 | 0.6% |
| Argentina | 388 | 0.9% |
| Asia | 646 | 1.4% |
| Australia | 9 | 0.0% |
| Austria | 9 | 0.0% |
| Belarus | 16 | 0.0% |
| Bolivia | 18 | 0.0% |
| Brazil | 513 | 1.1% |
| Bulgaria | 28 | 0.1% |
| Canada | 18 | 0.0% |
| Caribbean | 10,107 | 22.6% |
| Central America | 2,249 | 5.0% |
| Chile | 200 | 0.4% |
| China | 55 | 0.1% |
| Colombia | 1,548 | 3.5% |
| Cuba | 8,858 | 19.8% |
| Czechoslovakia | 22 | 0.1% |
| Dominica | 30 | 0.1% |
| Dominican Republic | 261 | 0.6% |
| Eastern Africa | 80 | 0.2% |
| Eastern Asia | 252 | 0.6% |
| Eastern Europe | 163 | 0.4% |
| Ecuador | 311 | 0.7% |
| El Salvador | 193 | 0.4% |
| England | 45 | 0.1% |
| Ethiopia | 65 | 0.2% |
| Europe | 723 | 1.6% |
| Germany | 101 | 0.2% |
| Guatemala | 168 | 0.4% |
| Guyana | 86 | 0.2% |
| Haiti | 193 | 0.4% |
| Honduras | 348 | 0.8% |
| Indonesia | 11 | 0.0% |
| Iran | 42 | 0.1% |
| Israel | 18 | 0.0% |
| Italy | 227 | 0.5% |
| Jamaica | 479 | 1.1% |
| Kenya | 7 | 0.0% |
| Korea | 197 | 0.4% |
| Latin America | 17,445 | 39.0% |
| Latvia | 6 | 0.0% |
| Mexico | 245 | 0.5% |
| Middle Africa | 10 | 0.0% |
| Morocco | 7 | 0.0% |
| Netherlands | 8 | 0.0% |
| Nicaragua | 1,124 | 2.5% |
| Nigeria | 44 | 0.1% |
| Northern Africa | 80 | 0.2% |
| Northern Europe | 157 | 0.4% |
| Norway | 28 | 0.1% |
| Oceania | 9 | 0.0% |
| Pakistan | 43 | 0.1% |
| Panama | 171 | 0.4% |
| Peru | 508 | 1.1% |
| Philippines | 79 | 0.2% |
| Portugal | 22 | 0.1% |
| Russia | 83 | 0.2% |
| South Africa | 41 | 0.1% |
| South America | 5,089 | 11.4% |
| South Central Asia | 102 | 0.2% |
| South Eastern Asia | 243 | 0.5% |
| Southern Europe | 285 | 0.6% |
| Spain | 36 | 0.1% |
| Sri Lanka | 17 | 0.0% |
| Taiwan | 24 | 0.1% |
| Thailand | 135 | 0.3% |
| Trinidad and Tobago | 266 | 0.6% |
| Turkey | 31 | 0.1% |
| Uganda | 8 | 0.0% |
| Uruguay | 41 | 0.1% |
| Venezuela | 1,476 | 3.3% |
| Vietnam | 18 | 0.0% |
| West Indies | 10 | 0.0% |
| Western Africa | 44 | 0.1% |
| Western Asia | 49 | 0.1% |
| Western Europe | 118 | 0.3% |
| Zaire | 10 | 0.0% | View All 77 Rows |
Sex and Age in Cutler Bay
Sex and Age in Cutler Bay
The most populous age groups in Cutler Bay are 55 to 59 Years (1,873 | 8.7%) for men and 45 to 49 Years (2,272 | 9.7%) for women.
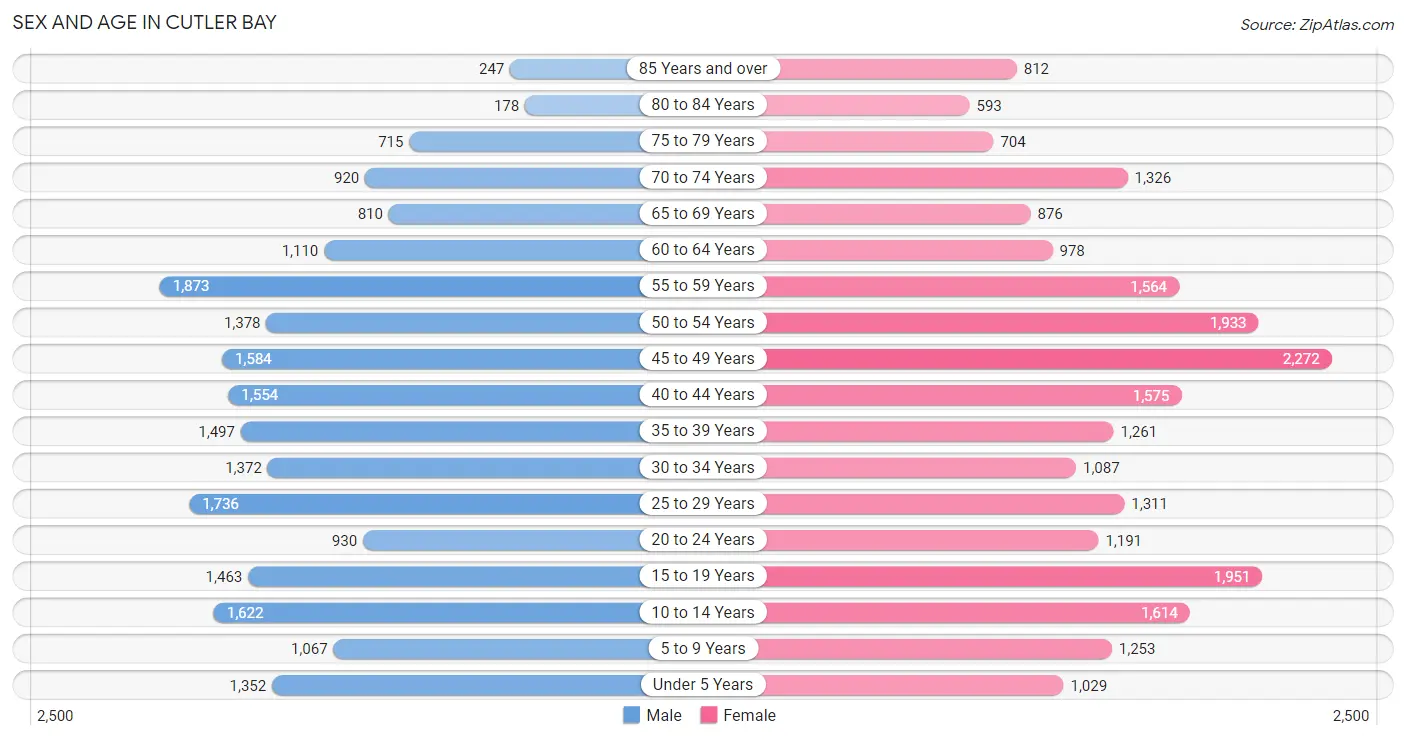
| Age Bracket | Male | Female |
| Under 5 Years | 1,352 (6.3%) | 1,029 (4.4%) |
| 5 to 9 Years | 1,067 (5.0%) | 1,253 (5.4%) |
| 10 to 14 Years | 1,622 (7.6%) | 1,614 (6.9%) |
| 15 to 19 Years | 1,463 (6.8%) | 1,951 (8.4%) |
| 20 to 24 Years | 930 (4.3%) | 1,191 (5.1%) |
| 25 to 29 Years | 1,736 (8.1%) | 1,311 (5.6%) |
| 30 to 34 Years | 1,372 (6.4%) | 1,087 (4.7%) |
| 35 to 39 Years | 1,497 (7.0%) | 1,261 (5.4%) |
| 40 to 44 Years | 1,554 (7.3%) | 1,575 (6.8%) |
| 45 to 49 Years | 1,584 (7.4%) | 2,272 (9.7%) |
| 50 to 54 Years | 1,378 (6.4%) | 1,933 (8.3%) |
| 55 to 59 Years | 1,873 (8.7%) | 1,564 (6.7%) |
| 60 to 64 Years | 1,110 (5.2%) | 978 (4.2%) |
| 65 to 69 Years | 810 (3.8%) | 876 (3.7%) |
| 70 to 74 Years | 920 (4.3%) | 1,326 (5.7%) |
| 75 to 79 Years | 715 (3.3%) | 704 (3.0%) |
| 80 to 84 Years | 178 (0.8%) | 593 (2.5%) |
| 85 Years and over | 247 (1.1%) | 812 (3.5%) |
| Total | 21,408 (100.0%) | 23,330 (100.0%) |
Families and Households in Cutler Bay
Median Family Size in Cutler Bay
The median family size in Cutler Bay is 3.36 persons per family, with single male/father families (973 | 8.6%) accounting for the largest median family size of 3.5 persons per family. On the other hand, single female/mother families (2,645 | 23.3%) represent the smallest median family size with 3.18 persons per family.
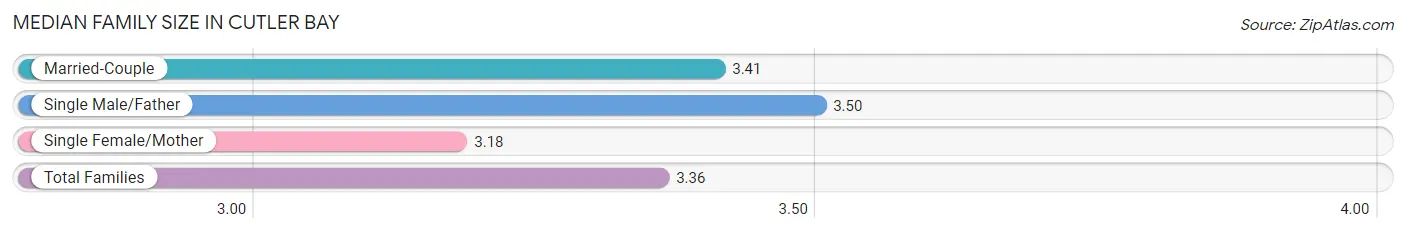
| Family Type | # Families | Family Size |
| Married-Couple | 7,759 (68.2%) | 3.41 |
| Single Male/Father | 973 (8.6%) | 3.50 |
| Single Female/Mother | 2,645 (23.3%) | 3.18 |
| Total Families | 11,377 (100.0%) | 3.36 |
Median Household Size in Cutler Bay
The median household size in Cutler Bay is 3.08 persons per household, with single male/father households (973 | 6.8%) accounting for the largest median household size of 3.89 persons per household. non-family households (2,989 | 20.8%) represent the smallest median household size with 1.41 persons per household.
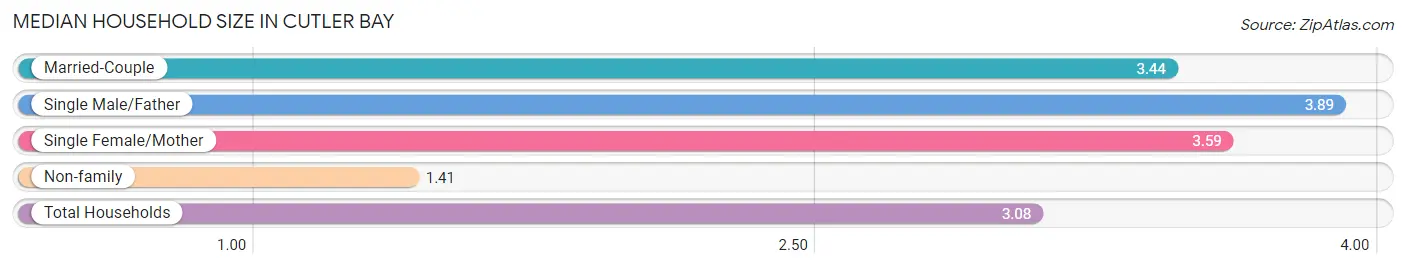
| Household Type | # Households | Household Size |
| Married-Couple | 7,759 (54.0%) | 3.44 |
| Single Male/Father | 973 (6.8%) | 3.89 |
| Single Female/Mother | 2,645 (18.4%) | 3.59 |
| Non-family | 2,989 (20.8%) | 1.41 |
| Total Households | 14,366 (100.0%) | 3.08 |
Household Size by Marriage Status in Cutler Bay
Out of a total of 14,366 households in Cutler Bay, 11,377 (79.2%) are family households, while 2,989 (20.8%) are nonfamily households. The most numerous type of family households are 2-person households, comprising 3,734, and the most common type of nonfamily households are 1-person households, comprising 2,141.
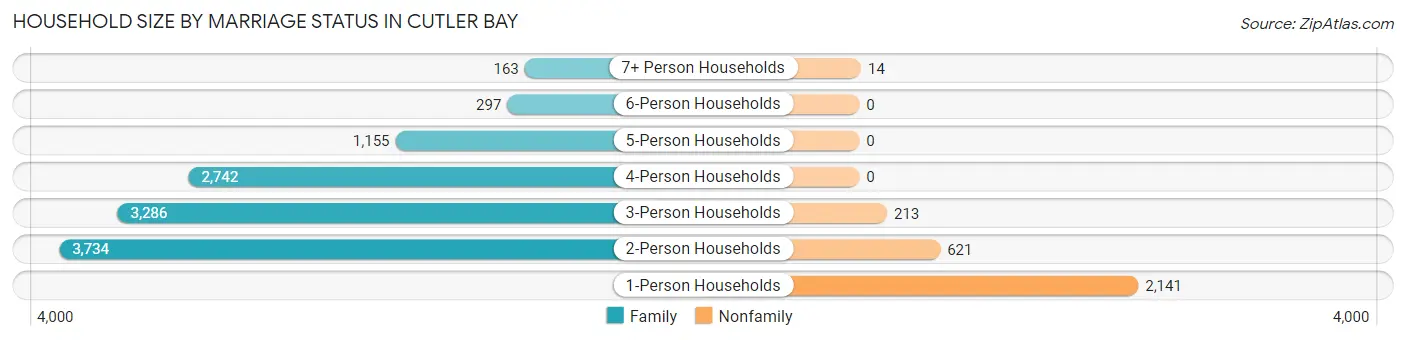
| Household Size | Family Households | Nonfamily Households |
| 1-Person Households | - | 2,141 (14.9%) |
| 2-Person Households | 3,734 (26.0%) | 621 (4.3%) |
| 3-Person Households | 3,286 (22.9%) | 213 (1.5%) |
| 4-Person Households | 2,742 (19.1%) | 0 (0.0%) |
| 5-Person Households | 1,155 (8.0%) | 0 (0.0%) |
| 6-Person Households | 297 (2.1%) | 0 (0.0%) |
| 7+ Person Households | 163 (1.1%) | 14 (0.1%) |
| Total | 11,377 (79.2%) | 2,989 (20.8%) |
Female Fertility in Cutler Bay
Fertility by Age in Cutler Bay
Average fertility rate in Cutler Bay is 30.0 births per 1,000 women. Women in the age bracket of 20 to 34 years have the highest fertility rate with 48.0 births per 1,000 women. Women in the age bracket of 20 to 34 years acount for 52.4% of all women with births.
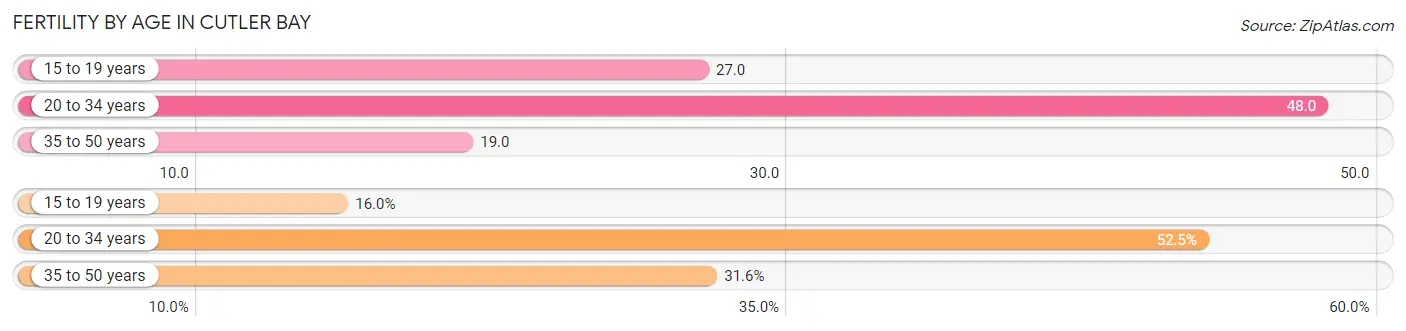
| Age Bracket | Women with Births | Births / 1,000 Women |
| 15 to 19 years | 52 (16.0%) | 27.0 |
| 20 to 34 years | 171 (52.4%) | 48.0 |
| 35 to 50 years | 103 (31.6%) | 19.0 |
| Total | 326 (100.0%) | 30.0 |
Fertility by Age by Marriage Status in Cutler Bay
25.5% of women with births (326) in Cutler Bay are married. The highest percentage of unmarried women with births falls into 15 to 19 years age bracket with 100.0% of them unmarried at the time of birth, while the lowest percentage of unmarried women with births belong to 35 to 50 years age bracket with 39.8% of them unmarried.
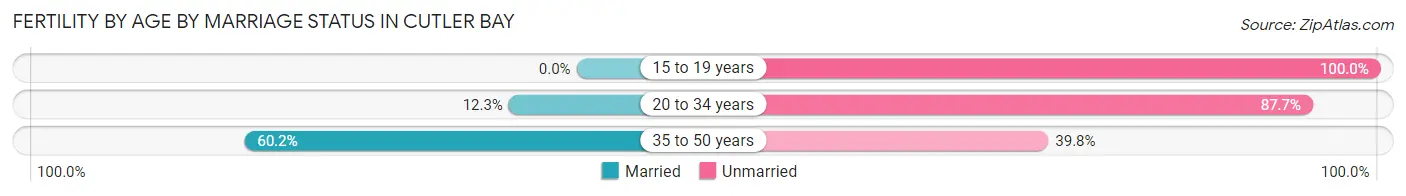
| Age Bracket | Married | Unmarried |
| 15 to 19 years | 0 (0.0%) | 52 (100.0%) |
| 20 to 34 years | 21 (12.3%) | 150 (87.7%) |
| 35 to 50 years | 62 (60.2%) | 41 (39.8%) |
| Total | 83 (25.5%) | 243 (74.5%) |
Fertility by Education in Cutler Bay
Average fertility rate in Cutler Bay is 30.0 births per 1,000 women. Women with the education attainment of college or associate's degree have the highest fertility rate of 49.0 births per 1,000 women, while women with the education attainment of bachelor's degree have the lowest fertility at 10.0 births per 1,000 women. Women with the education attainment of college or associate's degree represent 51.2% of all women with births.
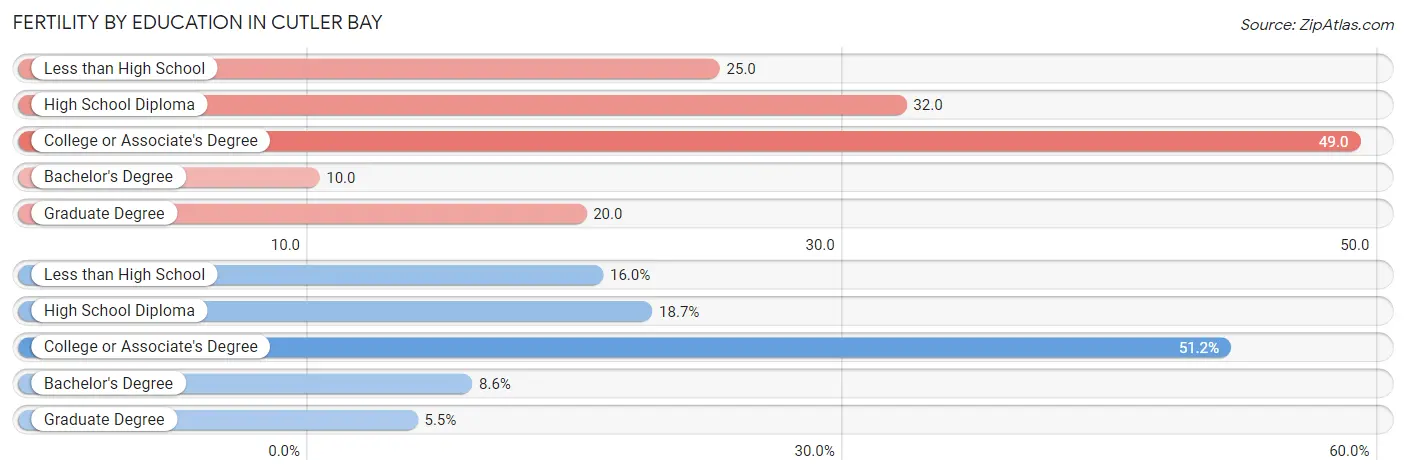
| Educational Attainment | Women with Births | Births / 1,000 Women |
| Less than High School | 52 (16.0%) | 25.0 |
| High School Diploma | 61 (18.7%) | 32.0 |
| College or Associate's Degree | 167 (51.2%) | 49.0 |
| Bachelor's Degree | 28 (8.6%) | 10.0 |
| Graduate Degree | 18 (5.5%) | 20.0 |
| Total | 326 (100.0%) | 30.0 |
Fertility by Education by Marriage Status in Cutler Bay
74.5% of women with births in Cutler Bay are unmarried. Women with the educational attainment of bachelor's degree are most likely to be married with 100.0% of them married at childbirth, while women with the educational attainment of less than high school are least likely to be married with 100.0% of them unmarried at childbirth.
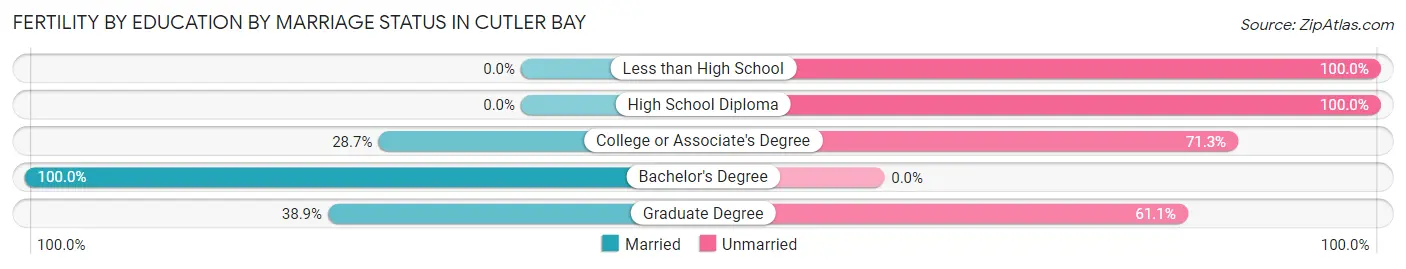
| Educational Attainment | Married | Unmarried |
| Less than High School | 0 (0.0%) | 52 (100.0%) |
| High School Diploma | 0 (0.0%) | 61 (100.0%) |
| College or Associate's Degree | 48 (28.7%) | 119 (71.3%) |
| Bachelor's Degree | 28 (100.0%) | 0 (0.0%) |
| Graduate Degree | 7 (38.9%) | 11 (61.1%) |
| Total | 83 (25.5%) | 243 (74.5%) |
Employment Characteristics in Cutler Bay
Employment by Class of Employer in Cutler Bay
Among the 22,472 employed individuals in Cutler Bay, private company employees (14,629 | 65.1%), local government employees (1,942 | 8.6%), and self-employed (not incorporated) (1,694 | 7.5%) make up the most common classes of employment.
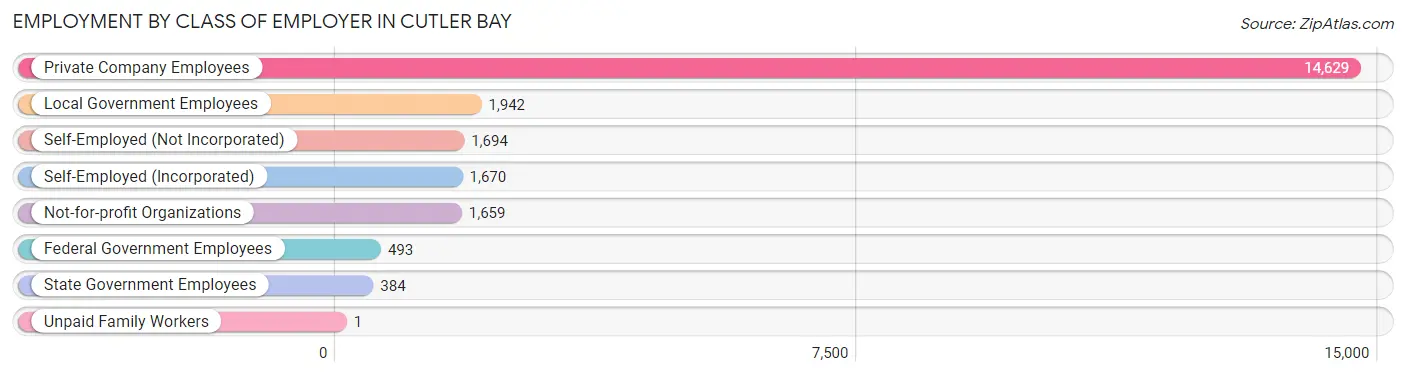
| Employer Class | # Employees | % Employees |
| Private Company Employees | 14,629 | 65.1% |
| Self-Employed (Incorporated) | 1,670 | 7.4% |
| Self-Employed (Not Incorporated) | 1,694 | 7.5% |
| Not-for-profit Organizations | 1,659 | 7.4% |
| Local Government Employees | 1,942 | 8.6% |
| State Government Employees | 384 | 1.7% |
| Federal Government Employees | 493 | 2.2% |
| Unpaid Family Workers | 1 | 0.0% |
| Total | 22,472 | 100.0% |
Employment Status by Age in Cutler Bay
According to the labor force statistics for Cutler Bay, out of the total population over 16 years of age (36,075), 66.8% or 24,098 individuals are in the labor force, with 4.4% or 1,060 of them unemployed. The age group with the highest labor force participation rate is 35 to 44 years, with 90.6% or 5,334 individuals in the labor force. Within the labor force, the 75 years and over age range has the highest percentage of unemployed individuals, with 14.2% or 32 of them being unemployed.
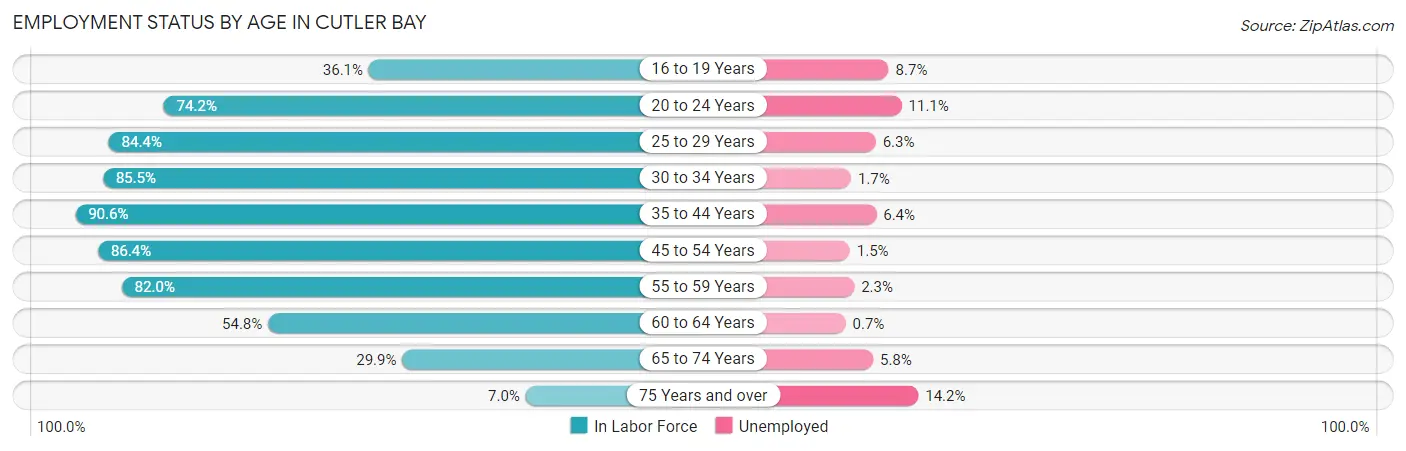
| Age Bracket | In Labor Force | Unemployed |
| 16 to 19 Years | 970 (36.1%) | 84 (8.7%) |
| 20 to 24 Years | 1,574 (74.2%) | 175 (11.1%) |
| 25 to 29 Years | 2,572 (84.4%) | 162 (6.3%) |
| 30 to 34 Years | 2,102 (85.5%) | 36 (1.7%) |
| 35 to 44 Years | 5,334 (90.6%) | 341 (6.4%) |
| 45 to 54 Years | 6,192 (86.4%) | 93 (1.5%) |
| 55 to 59 Years | 2,818 (82.0%) | 65 (2.3%) |
| 60 to 64 Years | 1,144 (54.8%) | 8 (0.7%) |
| 65 to 74 Years | 1,176 (29.9%) | 68 (5.8%) |
| 75 Years and over | 227 (7.0%) | 32 (14.2%) |
| Total | 24,098 (66.8%) | 1,060 (4.4%) |
Employment Status by Educational Attainment in Cutler Bay
According to labor force statistics for Cutler Bay, 83.7% of individuals (20,159) out of the total population between 25 and 64 years of age (24,085) are in the labor force, with 3.5% or 706 of them being unemployed. The group with the highest labor force participation rate are those with the educational attainment of bachelor's degree or higher, with 90.2% or 7,366 individuals in the labor force. Within the labor force, individuals with college / associate degree education have the highest percentage of unemployment, with 6.1% or 358 of them being unemployed.
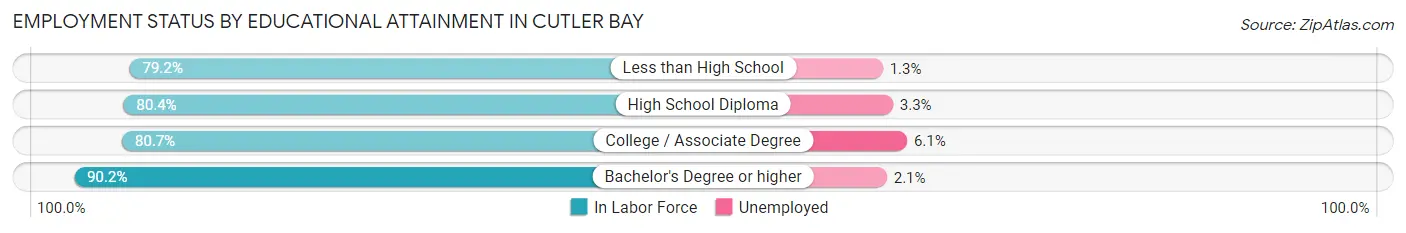
| Educational Attainment | In Labor Force | Unemployed |
| Less than High School | 1,592 (79.2%) | 26 (1.3%) |
| High School Diploma | 5,336 (80.4%) | 219 (3.3%) |
| College / Associate Degree | 5,869 (80.7%) | 444 (6.1%) |
| Bachelor's Degree or higher | 7,366 (90.2%) | 171 (2.1%) |
| Total | 20,159 (83.7%) | 843 (3.5%) |
Employment Occupations by Sex in Cutler Bay
Management, Business, Science and Arts Occupations
The most common Management, Business, Science and Arts occupations in Cutler Bay are Management (2,807 | 12.2%), Community & Social Service (2,459 | 10.7%), Business & Financial (1,775 | 7.7%), Education Instruction & Library (1,447 | 6.3%), and Health Diagnosing & Treating (1,151 | 5.0%).
Management, Business, Science and Arts Occupations by Sex
Within the Management, Business, Science and Arts occupations in Cutler Bay, the most male-oriented occupations are Architecture & Engineering (100.0%), Computers, Engineering & Science (75.9%), and Computers & Mathematics (71.2%), while the most female-oriented occupations are Legal Services & Support (87.8%), Education Instruction & Library (76.6%), and Health Technologists (72.3%).
| Occupation | Male | Female |
| Management | 1,668 (59.4%) | 1,139 (40.6%) |
| Business & Financial | 943 (53.1%) | 832 (46.9%) |
| Computers, Engineering & Science | 698 (75.9%) | 222 (24.1%) |
| Computers & Mathematics | 319 (71.2%) | 129 (28.8%) |
| Architecture & Engineering | 310 (100.0%) | 0 (0.0%) |
| Life, Physical & Social Science | 69 (42.6%) | 93 (57.4%) |
| Community & Social Service | 772 (31.4%) | 1,687 (68.6%) |
| Education, Arts & Media | 164 (55.0%) | 134 (45.0%) |
| Legal Services & Support | 46 (12.2%) | 331 (87.8%) |
| Education Instruction & Library | 339 (23.4%) | 1,108 (76.6%) |
| Arts, Media & Entertainment | 223 (66.2%) | 114 (33.8%) |
| Health Diagnosing & Treating | 408 (35.4%) | 743 (64.5%) |
| Health Technologists | 206 (27.7%) | 538 (72.3%) |
| Total (Category) | 4,489 (49.3%) | 4,623 (50.7%) |
| Total (Overall) | 12,142 (52.7%) | 10,890 (47.3%) |
Services Occupations
The most common Services occupations in Cutler Bay are Cleaning & Maintenance (1,070 | 4.6%), Food Preparation & Serving (853 | 3.7%), Security & Protection (699 | 3.0%), Healthcare Support (642 | 2.8%), and Personal Care & Service (621 | 2.7%).
Services Occupations by Sex
Within the Services occupations in Cutler Bay, the most male-oriented occupations are Firefighting & Prevention (94.7%), Security & Protection (90.7%), and Law Enforcement (83.3%), while the most female-oriented occupations are Healthcare Support (89.9%), Personal Care & Service (62.2%), and Food Preparation & Serving (53.6%).
| Occupation | Male | Female |
| Healthcare Support | 65 (10.1%) | 577 (89.9%) |
| Security & Protection | 634 (90.7%) | 65 (9.3%) |
| Firefighting & Prevention | 430 (94.7%) | 24 (5.3%) |
| Law Enforcement | 204 (83.3%) | 41 (16.7%) |
| Food Preparation & Serving | 396 (46.4%) | 457 (53.6%) |
| Cleaning & Maintenance | 545 (50.9%) | 525 (49.1%) |
| Personal Care & Service | 235 (37.8%) | 386 (62.2%) |
| Total (Category) | 1,875 (48.3%) | 2,010 (51.7%) |
| Total (Overall) | 12,142 (52.7%) | 10,890 (47.3%) |
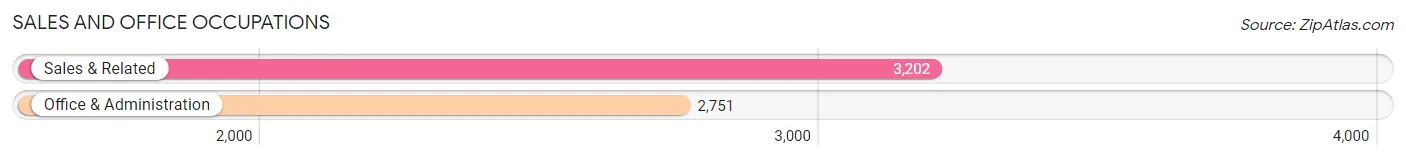
Sales and Office Occupations
The most common Sales and Office occupations in Cutler Bay are Sales & Related (3,202 | 13.9%), and Office & Administration (2,751 | 11.9%).
Sales and Office Occupations by Sex
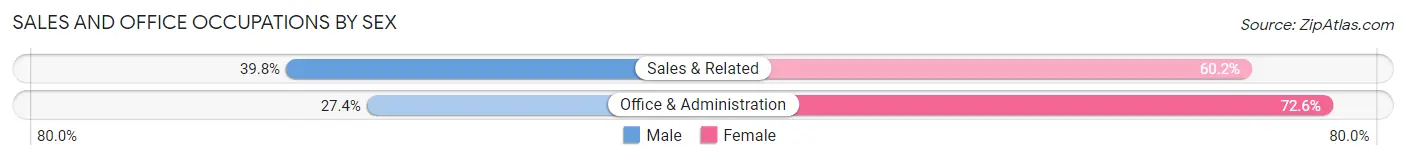
| Occupation | Male | Female |
| Sales & Related | 1,274 (39.8%) | 1,928 (60.2%) |
| Office & Administration | 753 (27.4%) | 1,998 (72.6%) |
| Total (Category) | 2,027 (34.1%) | 3,926 (65.9%) |
| Total (Overall) | 12,142 (52.7%) | 10,890 (47.3%) |
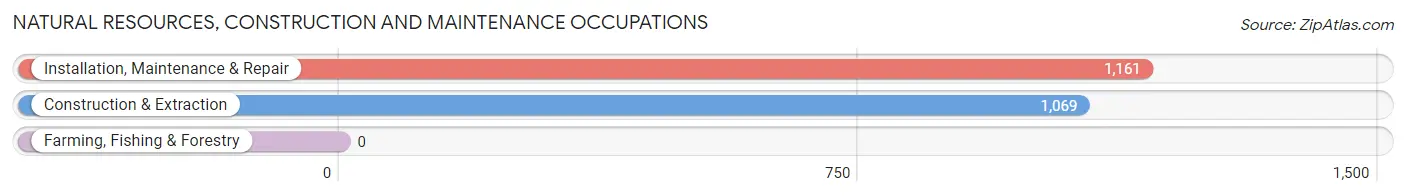
Natural Resources, Construction and Maintenance Occupations
The most common Natural Resources, Construction and Maintenance occupations in Cutler Bay are Installation, Maintenance & Repair (1,161 | 5.0%), and Construction & Extraction (1,069 | 4.6%).
Natural Resources, Construction and Maintenance Occupations by Sex
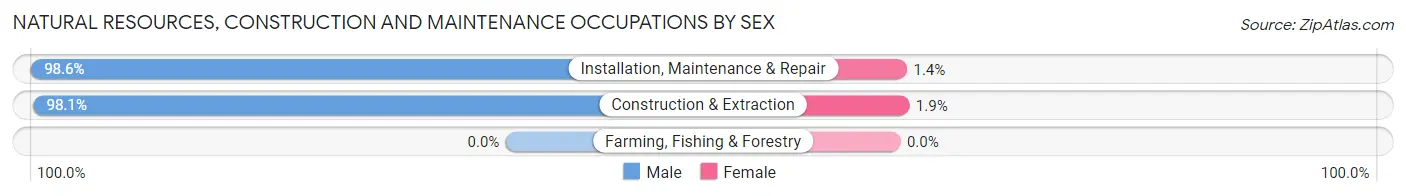
| Occupation | Male | Female |
| Farming, Fishing & Forestry | 0 (0.0%) | 0 (0.0%) |
| Construction & Extraction | 1,049 (98.1%) | 20 (1.9%) |
| Installation, Maintenance & Repair | 1,145 (98.6%) | 16 (1.4%) |
| Total (Category) | 2,194 (98.4%) | 36 (1.6%) |
| Total (Overall) | 12,142 (52.7%) | 10,890 (47.3%) |
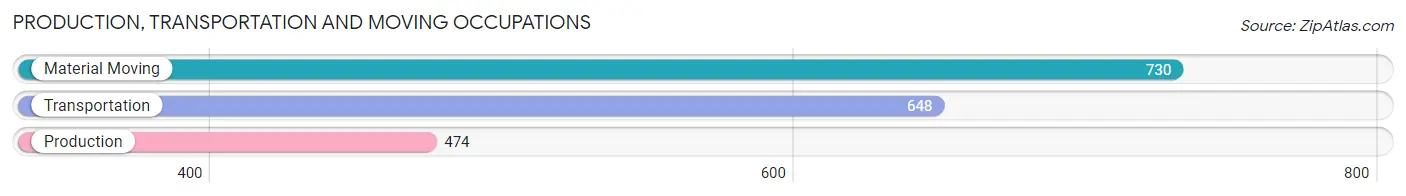
Production, Transportation and Moving Occupations
The most common Production, Transportation and Moving occupations in Cutler Bay are Material Moving (730 | 3.2%), Transportation (648 | 2.8%), and Production (474 | 2.1%).
Production, Transportation and Moving Occupations by Sex
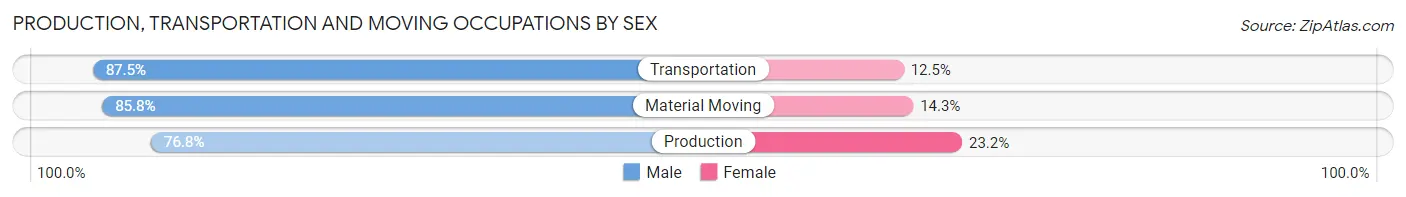
| Occupation | Male | Female |
| Production | 364 (76.8%) | 110 (23.2%) |
| Transportation | 567 (87.5%) | 81 (12.5%) |
| Material Moving | 626 (85.8%) | 104 (14.2%) |
| Total (Category) | 1,557 (84.1%) | 295 (15.9%) |
| Total (Overall) | 12,142 (52.7%) | 10,890 (47.3%) |
Employment Industries by Sex in Cutler Bay
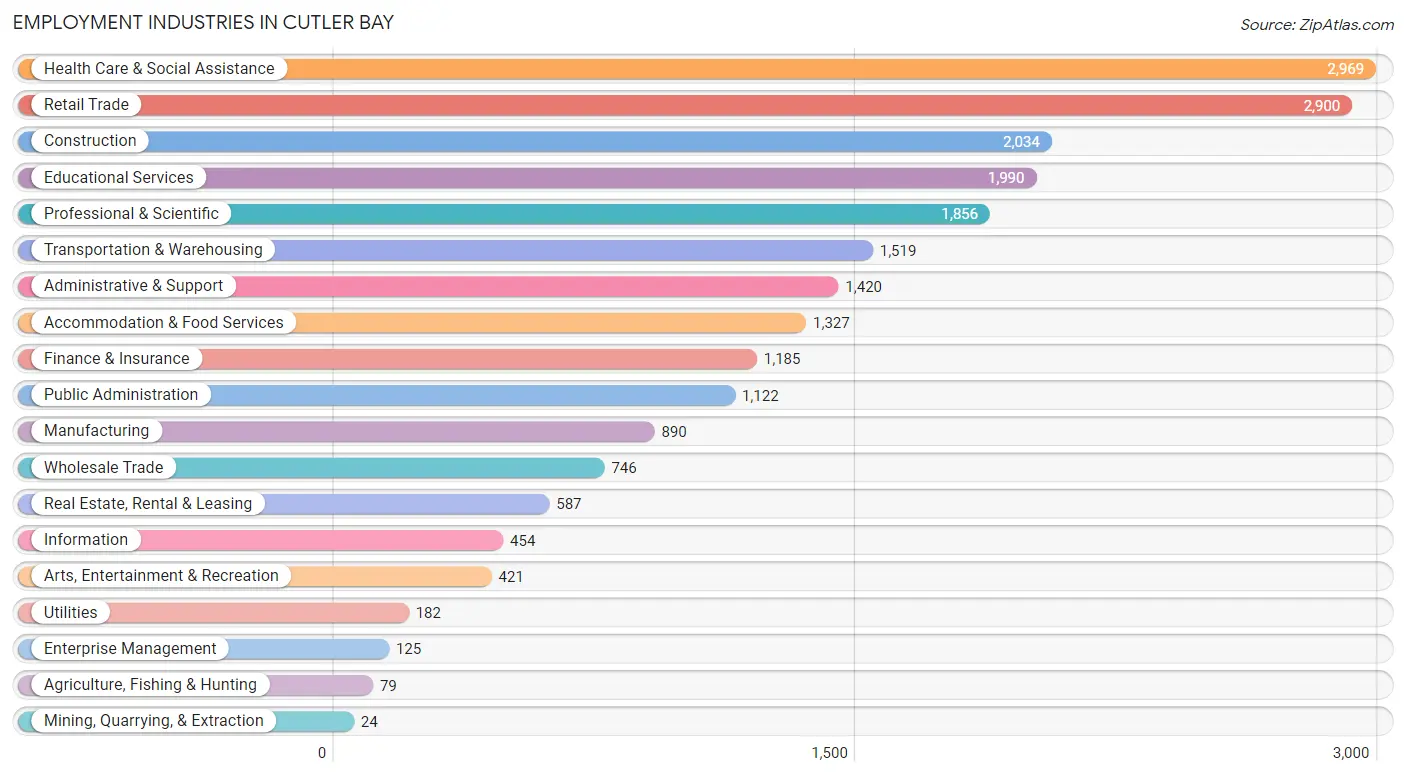
Employment Industries in Cutler Bay
The major employment industries in Cutler Bay include Health Care & Social Assistance (2,969 | 12.9%), Retail Trade (2,900 | 12.6%), Construction (2,034 | 8.8%), Educational Services (1,990 | 8.6%), and Professional & Scientific (1,856 | 8.1%).
Employment Industries by Sex in Cutler Bay
The Cutler Bay industries that see more men than women are Mining, Quarrying, & Extraction (100.0%), Agriculture, Fishing & Hunting (86.1%), and Construction (84.6%), whereas the industries that tend to have a higher number of women are Health Care & Social Assistance (70.3%), Enterprise Management (66.4%), and Educational Services (66.1%).
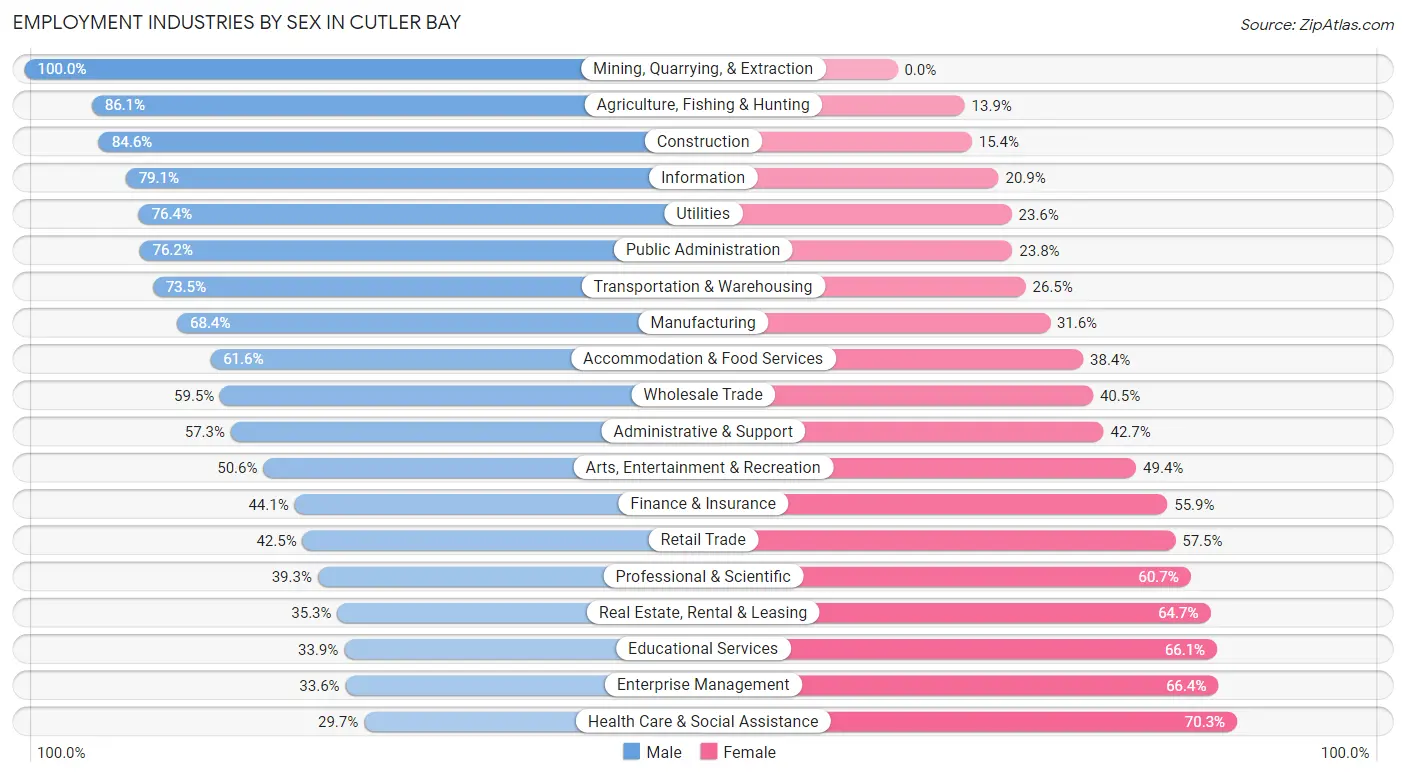
| Industry | Male | Female |
| Agriculture, Fishing & Hunting | 68 (86.1%) | 11 (13.9%) |
| Mining, Quarrying, & Extraction | 24 (100.0%) | 0 (0.0%) |
| Construction | 1,721 (84.6%) | 313 (15.4%) |
| Manufacturing | 609 (68.4%) | 281 (31.6%) |
| Wholesale Trade | 444 (59.5%) | 302 (40.5%) |
| Retail Trade | 1,232 (42.5%) | 1,668 (57.5%) |
| Transportation & Warehousing | 1,116 (73.5%) | 403 (26.5%) |
| Utilities | 139 (76.4%) | 43 (23.6%) |
| Information | 359 (79.1%) | 95 (20.9%) |
| Finance & Insurance | 523 (44.1%) | 662 (55.9%) |
| Real Estate, Rental & Leasing | 207 (35.3%) | 380 (64.7%) |
| Professional & Scientific | 730 (39.3%) | 1,126 (60.7%) |
| Enterprise Management | 42 (33.6%) | 83 (66.4%) |
| Administrative & Support | 814 (57.3%) | 606 (42.7%) |
| Educational Services | 674 (33.9%) | 1,316 (66.1%) |
| Health Care & Social Assistance | 883 (29.7%) | 2,086 (70.3%) |
| Arts, Entertainment & Recreation | 213 (50.6%) | 208 (49.4%) |
| Accommodation & Food Services | 817 (61.6%) | 510 (38.4%) |
| Public Administration | 855 (76.2%) | 267 (23.8%) |
| Total | 12,142 (52.7%) | 10,890 (47.3%) |
Education in Cutler Bay
School Enrollment in Cutler Bay
The most common levels of schooling among the 11,904 students in Cutler Bay are middle school (2,690 | 22.6%), high school (2,666 | 22.4%), and college / undergraduate (2,582 | 21.7%).
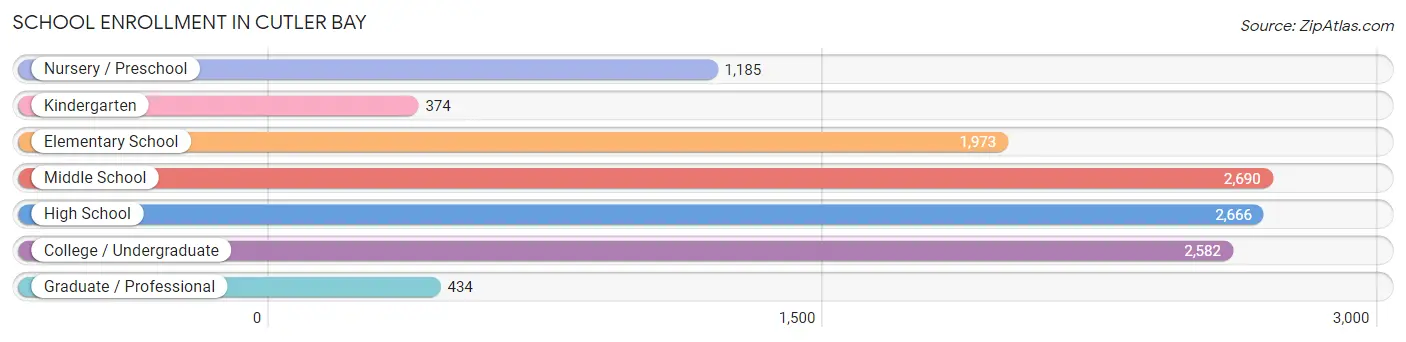
| School Level | # Students | % Students |
| Nursery / Preschool | 1,185 | 10.0% |
| Kindergarten | 374 | 3.1% |
| Elementary School | 1,973 | 16.6% |
| Middle School | 2,690 | 22.6% |
| High School | 2,666 | 22.4% |
| College / Undergraduate | 2,582 | 21.7% |
| Graduate / Professional | 434 | 3.6% |
| Total | 11,904 | 100.0% |
School Enrollment by Age by Funding Source in Cutler Bay
Out of a total of 11,904 students who are enrolled in schools in Cutler Bay, 2,488 (20.9%) attend a private institution, while the remaining 9,416 (79.1%) are enrolled in public schools. The age group of 3 to 4 year olds has the highest likelihood of being enrolled in private schools, with 585 (61.9% in the age bracket) enrolled. Conversely, the age group of 5 to 9 year old has the lowest likelihood of being enrolled in a private school, with 2,046 (88.8% in the age bracket) attending a public institution.
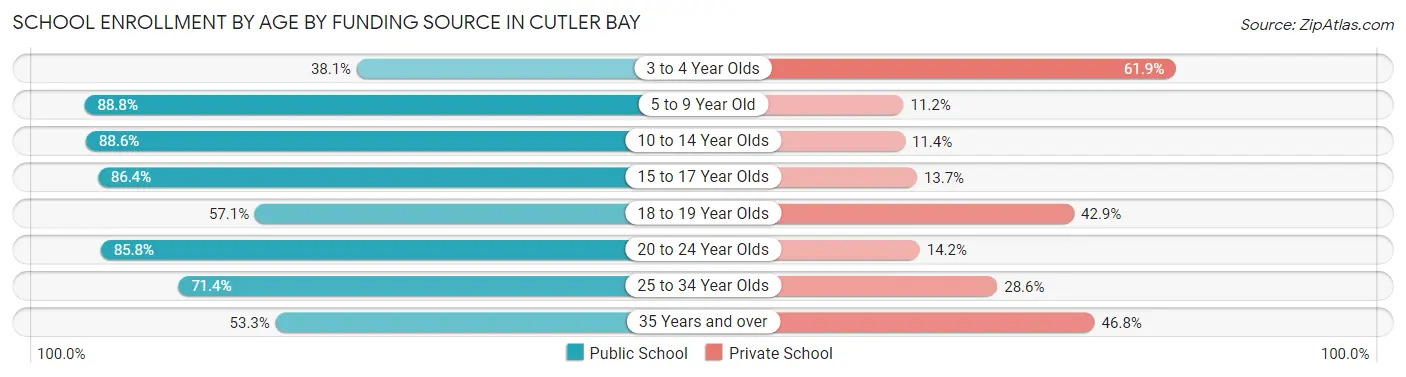
| Age Bracket | Public School | Private School |
| 3 to 4 Year Olds | 360 (38.1%) | 585 (61.9%) |
| 5 to 9 Year Old | 2,046 (88.8%) | 257 (11.2%) |
| 10 to 14 Year Olds | 2,866 (88.6%) | 370 (11.4%) |
| 15 to 17 Year Olds | 1,816 (86.4%) | 287 (13.7%) |
| 18 to 19 Year Olds | 524 (57.1%) | 394 (42.9%) |
| 20 to 24 Year Olds | 962 (85.8%) | 159 (14.2%) |
| 25 to 34 Year Olds | 616 (71.4%) | 247 (28.6%) |
| 35 Years and over | 221 (53.2%) | 194 (46.8%) |
| Total | 9,416 (79.1%) | 2,488 (20.9%) |
Educational Attainment by Field of Study in Cutler Bay
Business (2,387 | 23.1%), science & technology (1,067 | 10.3%), education (1,037 | 10.0%), social sciences (822 | 7.9%), and arts & humanities (819 | 7.9%) are the most common fields of study among 10,354 individuals in Cutler Bay who have obtained a bachelor's degree or higher.
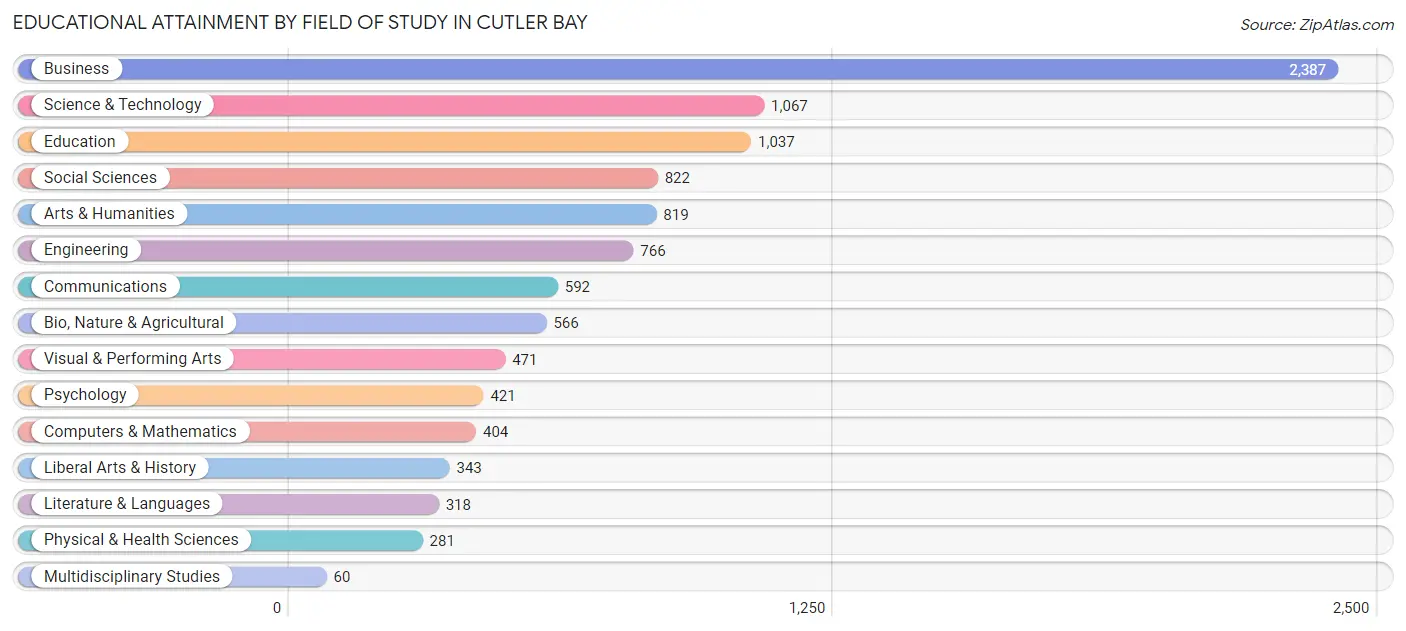
| Field of Study | # Graduates | % Graduates |
| Computers & Mathematics | 404 | 3.9% |
| Bio, Nature & Agricultural | 566 | 5.5% |
| Physical & Health Sciences | 281 | 2.7% |
| Psychology | 421 | 4.1% |
| Social Sciences | 822 | 7.9% |
| Engineering | 766 | 7.4% |
| Multidisciplinary Studies | 60 | 0.6% |
| Science & Technology | 1,067 | 10.3% |
| Business | 2,387 | 23.1% |
| Education | 1,037 | 10.0% |
| Literature & Languages | 318 | 3.1% |
| Liberal Arts & History | 343 | 3.3% |
| Visual & Performing Arts | 471 | 4.5% |
| Communications | 592 | 5.7% |
| Arts & Humanities | 819 | 7.9% |
| Total | 10,354 | 100.0% |
Transportation & Commute in Cutler Bay
Vehicle Availability by Sex in Cutler Bay
The most prevalent vehicle ownership categories in Cutler Bay are males with 2 vehicles (5,801, accounting for 48.9%) and females with 2 vehicles (4,570, making up 54.7%).
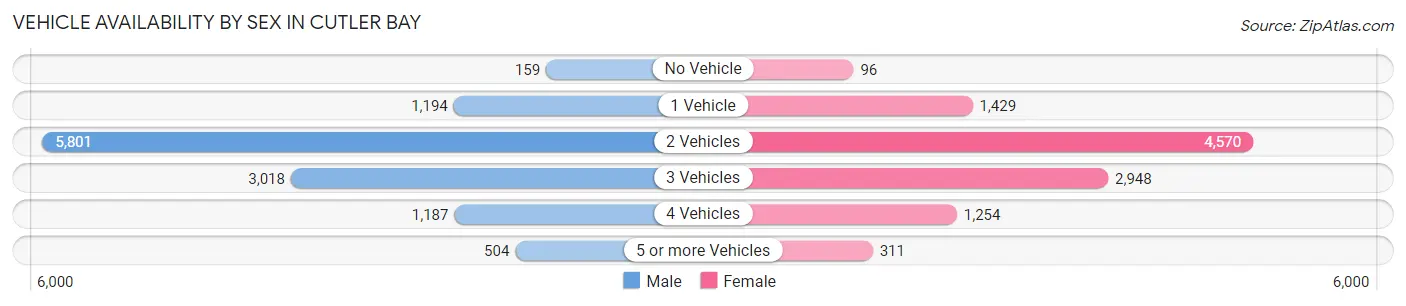
| Vehicles Available | Male | Female |
| No Vehicle | 159 (1.3%) | 96 (0.9%) |
| 1 Vehicle | 1,194 (10.1%) | 1,429 (13.5%) |
| 2 Vehicles | 5,801 (48.9%) | 4,570 (43.1%) |
| 3 Vehicles | 3,018 (25.4%) | 2,948 (27.8%) |
| 4 Vehicles | 1,187 (10.0%) | 1,254 (11.8%) |
| 5 or more Vehicles | 504 (4.3%) | 311 (2.9%) |
| Total | 11,863 (100.0%) | 10,608 (100.0%) |
Commute Time in Cutler Bay
The most frequently occuring commute durations in Cutler Bay are 45 to 59 minutes (3,616 commuters, 18.4%), 60 to 89 minutes (3,426 commuters, 17.5%), and 30 to 34 minutes (3,007 commuters, 15.3%).
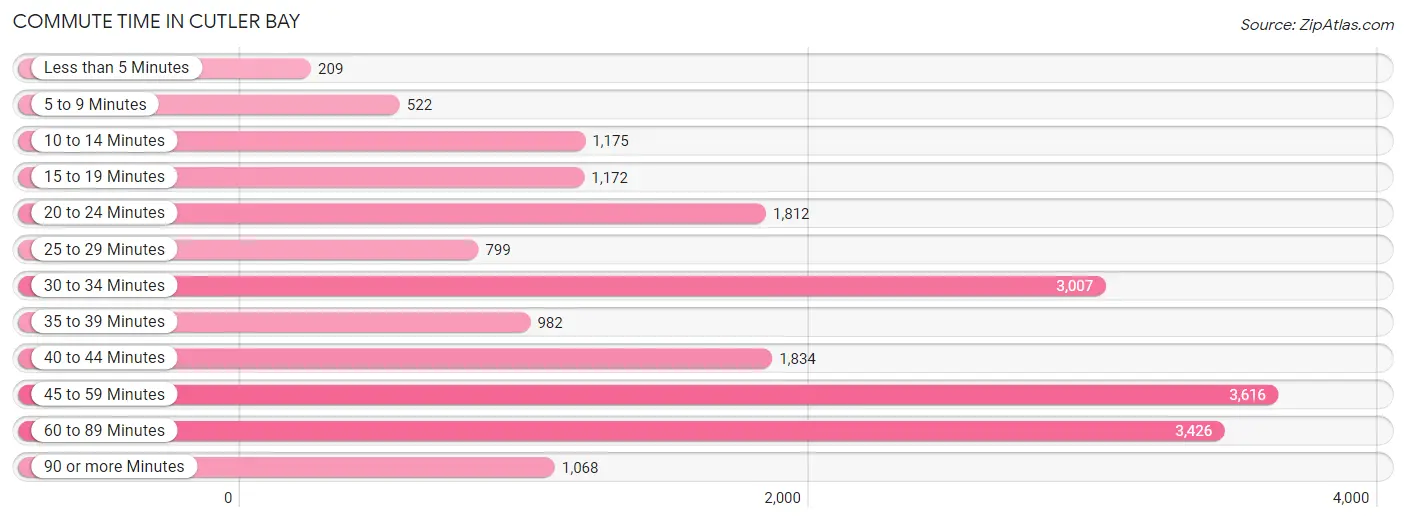
| Commute Time | # Commuters | % Commuters |
| Less than 5 Minutes | 209 | 1.1% |
| 5 to 9 Minutes | 522 | 2.7% |
| 10 to 14 Minutes | 1,175 | 6.0% |
| 15 to 19 Minutes | 1,172 | 6.0% |
| 20 to 24 Minutes | 1,812 | 9.2% |
| 25 to 29 Minutes | 799 | 4.1% |
| 30 to 34 Minutes | 3,007 | 15.3% |
| 35 to 39 Minutes | 982 | 5.0% |
| 40 to 44 Minutes | 1,834 | 9.3% |
| 45 to 59 Minutes | 3,616 | 18.4% |
| 60 to 89 Minutes | 3,426 | 17.5% |
| 90 or more Minutes | 1,068 | 5.4% |
Commute Time by Sex in Cutler Bay
The most common commute times in Cutler Bay are 45 to 59 minutes (2,007 commuters, 19.1%) for males and 60 to 89 minutes (1,634 commuters, 17.9%) for females.
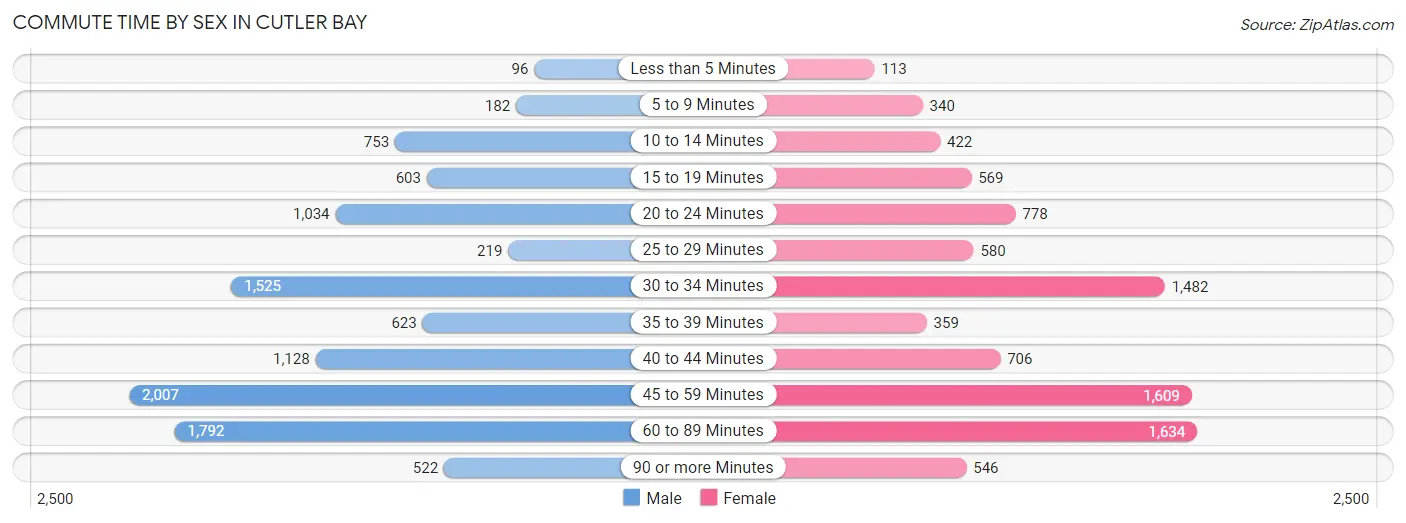
| Commute Time | Male | Female |
| Less than 5 Minutes | 96 (0.9%) | 113 (1.2%) |
| 5 to 9 Minutes | 182 (1.7%) | 340 (3.7%) |
| 10 to 14 Minutes | 753 (7.2%) | 422 (4.6%) |
| 15 to 19 Minutes | 603 (5.8%) | 569 (6.2%) |
| 20 to 24 Minutes | 1,034 (9.9%) | 778 (8.5%) |
| 25 to 29 Minutes | 219 (2.1%) | 580 (6.4%) |
| 30 to 34 Minutes | 1,525 (14.5%) | 1,482 (16.2%) |
| 35 to 39 Minutes | 623 (5.9%) | 359 (3.9%) |
| 40 to 44 Minutes | 1,128 (10.8%) | 706 (7.7%) |
| 45 to 59 Minutes | 2,007 (19.1%) | 1,609 (17.6%) |
| 60 to 89 Minutes | 1,792 (17.1%) | 1,634 (17.9%) |
| 90 or more Minutes | 522 (5.0%) | 546 (6.0%) |
Time of Departure to Work by Sex in Cutler Bay
The most frequent times of departure to work in Cutler Bay are 7:00 AM to 7:29 AM (1,507, 14.4%) for males and 7:00 AM to 7:29 AM (2,193, 24.0%) for females.
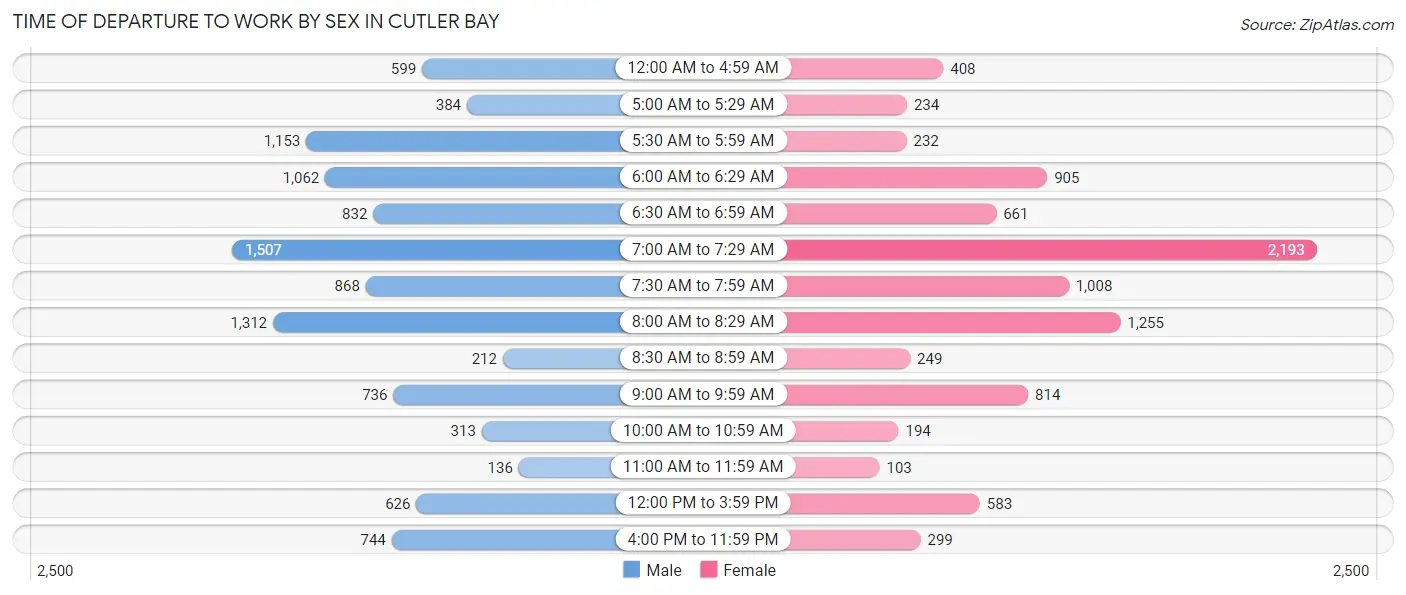
| Time of Departure | Male | Female |
| 12:00 AM to 4:59 AM | 599 (5.7%) | 408 (4.5%) |
| 5:00 AM to 5:29 AM | 384 (3.7%) | 234 (2.6%) |
| 5:30 AM to 5:59 AM | 1,153 (11.0%) | 232 (2.5%) |
| 6:00 AM to 6:29 AM | 1,062 (10.1%) | 905 (9.9%) |
| 6:30 AM to 6:59 AM | 832 (7.9%) | 661 (7.2%) |
| 7:00 AM to 7:29 AM | 1,507 (14.4%) | 2,193 (24.0%) |
| 7:30 AM to 7:59 AM | 868 (8.3%) | 1,008 (11.0%) |
| 8:00 AM to 8:29 AM | 1,312 (12.5%) | 1,255 (13.7%) |
| 8:30 AM to 8:59 AM | 212 (2.0%) | 249 (2.7%) |
| 9:00 AM to 9:59 AM | 736 (7.0%) | 814 (8.9%) |
| 10:00 AM to 10:59 AM | 313 (3.0%) | 194 (2.1%) |
| 11:00 AM to 11:59 AM | 136 (1.3%) | 103 (1.1%) |
| 12:00 PM to 3:59 PM | 626 (6.0%) | 583 (6.4%) |
| 4:00 PM to 11:59 PM | 744 (7.1%) | 299 (3.3%) |
| Total | 10,484 (100.0%) | 9,138 (100.0%) |
Housing Occupancy in Cutler Bay
Occupancy by Ownership in Cutler Bay
Of the total 14,366 dwellings in Cutler Bay, owner-occupied units account for 9,416 (65.5%), while renter-occupied units make up 4,950 (34.5%).
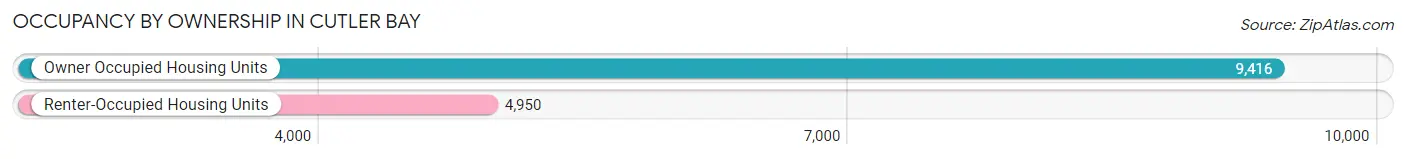
| Occupancy | # Housing Units | % Housing Units |
| Owner Occupied Housing Units | 9,416 | 65.5% |
| Renter-Occupied Housing Units | 4,950 | 34.5% |
| Total Occupied Housing Units | 14,366 | 100.0% |
Occupancy by Household Size in Cutler Bay
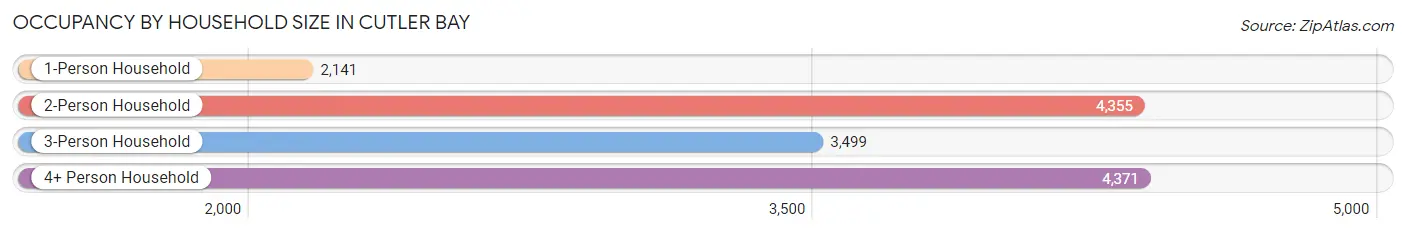
| Household Size | # Housing Units | % Housing Units |
| 1-Person Household | 2,141 | 14.9% |
| 2-Person Household | 4,355 | 30.3% |
| 3-Person Household | 3,499 | 24.4% |
| 4+ Person Household | 4,371 | 30.4% |
| Total Housing Units | 14,366 | 100.0% |
Occupancy by Ownership by Household Size in Cutler Bay
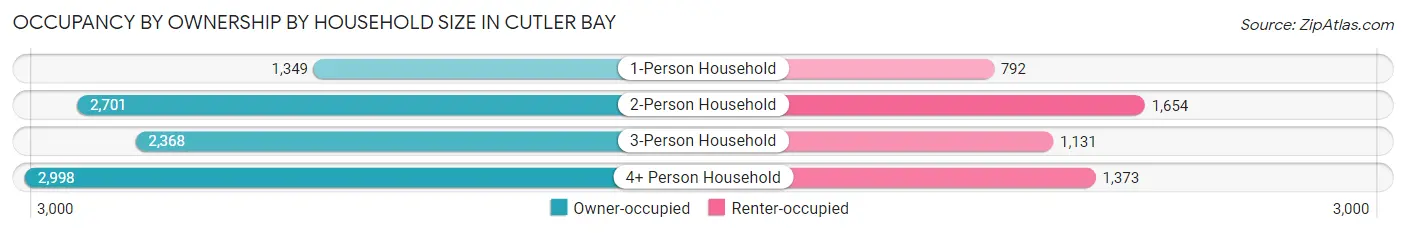
| Household Size | Owner-occupied | Renter-occupied |
| 1-Person Household | 1,349 (63.0%) | 792 (37.0%) |
| 2-Person Household | 2,701 (62.0%) | 1,654 (38.0%) |
| 3-Person Household | 2,368 (67.7%) | 1,131 (32.3%) |
| 4+ Person Household | 2,998 (68.6%) | 1,373 (31.4%) |
| Total Housing Units | 9,416 (65.5%) | 4,950 (34.5%) |
Occupancy by Educational Attainment in Cutler Bay
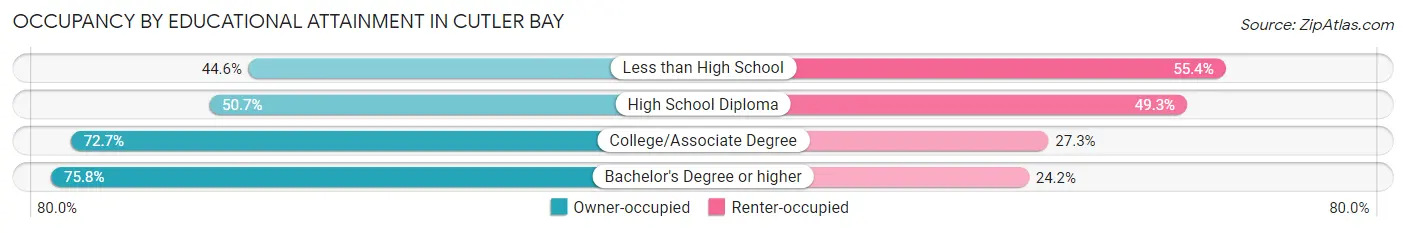
| Household Size | Owner-occupied | Renter-occupied |
| Less than High School | 520 (44.6%) | 646 (55.4%) |
| High School Diploma | 1,965 (50.7%) | 1,909 (49.3%) |
| College/Associate Degree | 3,209 (72.7%) | 1,206 (27.3%) |
| Bachelor's Degree or higher | 3,722 (75.8%) | 1,189 (24.2%) |
Occupancy by Age of Householder in Cutler Bay
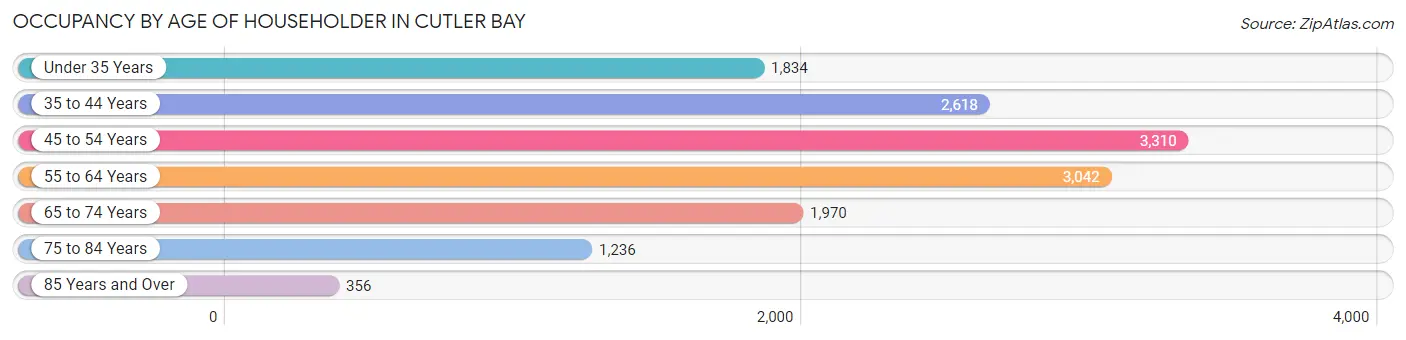
| Age Bracket | # Households | % Households |
| Under 35 Years | 1,834 | 12.8% |
| 35 to 44 Years | 2,618 | 18.2% |
| 45 to 54 Years | 3,310 | 23.0% |
| 55 to 64 Years | 3,042 | 21.2% |
| 65 to 74 Years | 1,970 | 13.7% |
| 75 to 84 Years | 1,236 | 8.6% |
| 85 Years and Over | 356 | 2.5% |
| Total | 14,366 | 100.0% |
Housing Finances in Cutler Bay
Median Income by Occupancy in Cutler Bay
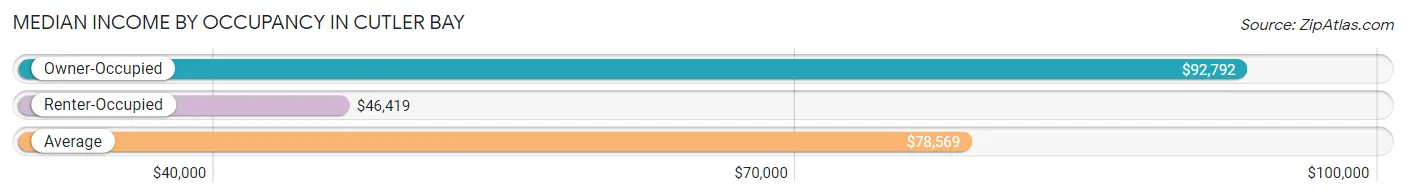
| Occupancy Type | # Households | Median Income |
| Owner-Occupied | 9,416 (65.5%) | $92,792 |
| Renter-Occupied | 4,950 (34.5%) | $46,419 |
| Average | 14,366 (100.0%) | $78,569 |
Occupancy by Householder Income Bracket in Cutler Bay
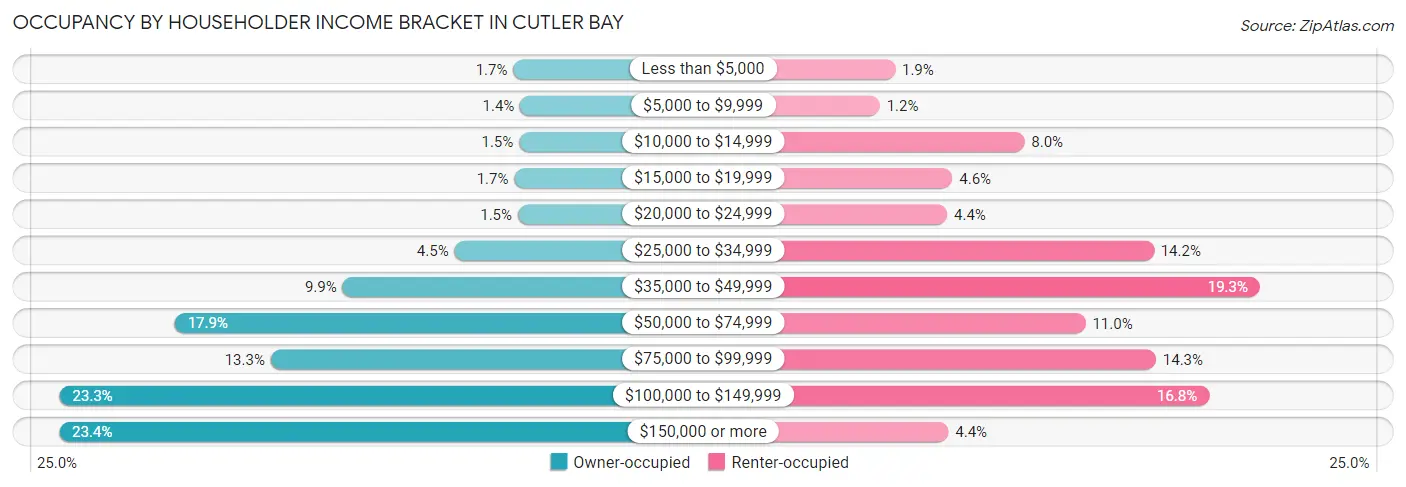
| Income Bracket | Owner-occupied | Renter-occupied |
| Less than $5,000 | 163 (1.7%) | 93 (1.9%) |
| $5,000 to $9,999 | 132 (1.4%) | 57 (1.1%) |
| $10,000 to $14,999 | 137 (1.5%) | 398 (8.0%) |
| $15,000 to $19,999 | 158 (1.7%) | 228 (4.6%) |
| $20,000 to $24,999 | 142 (1.5%) | 216 (4.4%) |
| $25,000 to $34,999 | 427 (4.5%) | 703 (14.2%) |
| $35,000 to $49,999 | 928 (9.9%) | 953 (19.3%) |
| $50,000 to $74,999 | 1,681 (17.8%) | 542 (11.0%) |
| $75,000 to $99,999 | 1,250 (13.3%) | 708 (14.3%) |
| $100,000 to $149,999 | 2,198 (23.3%) | 833 (16.8%) |
| $150,000 or more | 2,200 (23.4%) | 219 (4.4%) |
| Total | 9,416 (100.0%) | 4,950 (100.0%) |
Monthly Housing Cost Tiers in Cutler Bay
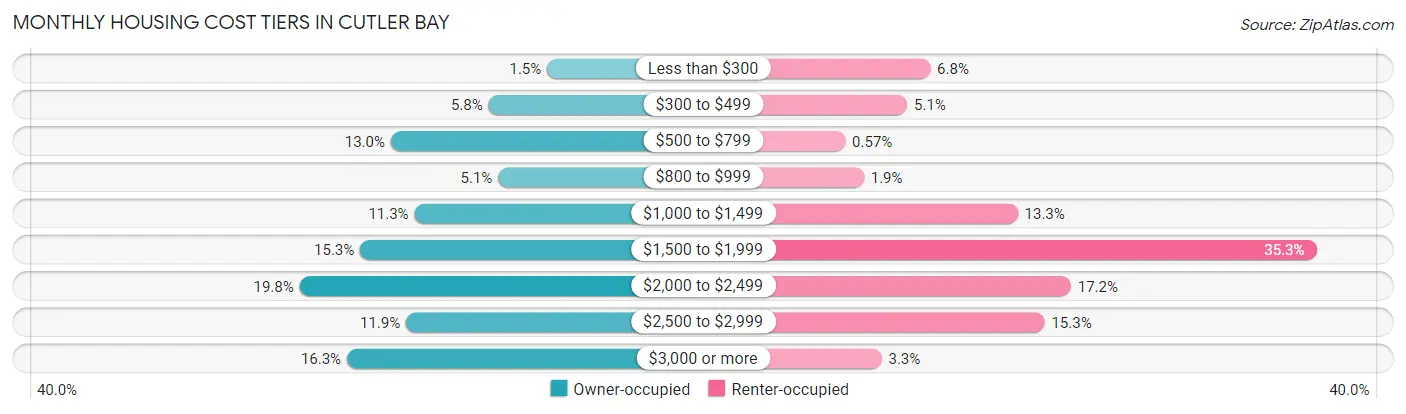
| Monthly Cost | Owner-occupied | Renter-occupied |
| Less than $300 | 143 (1.5%) | 338 (6.8%) |
| $300 to $499 | 549 (5.8%) | 254 (5.1%) |
| $500 to $799 | 1,227 (13.0%) | 28 (0.6%) |
| $800 to $999 | 482 (5.1%) | 96 (1.9%) |
| $1,000 to $1,499 | 1,063 (11.3%) | 657 (13.3%) |
| $1,500 to $1,999 | 1,440 (15.3%) | 1,746 (35.3%) |
| $2,000 to $2,499 | 1,860 (19.8%) | 851 (17.2%) |
| $2,500 to $2,999 | 1,121 (11.9%) | 755 (15.2%) |
| $3,000 or more | 1,531 (16.3%) | 161 (3.3%) |
| Total | 9,416 (100.0%) | 4,950 (100.0%) |
Physical Housing Characteristics in Cutler Bay
Housing Structures in Cutler Bay
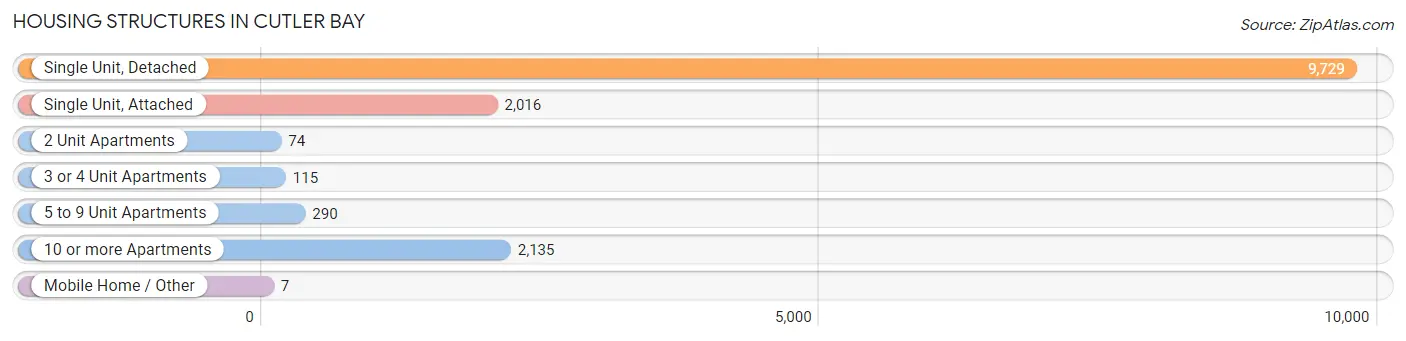
| Structure Type | # Housing Units | % Housing Units |
| Single Unit, Detached | 9,729 | 67.7% |
| Single Unit, Attached | 2,016 | 14.0% |
| 2 Unit Apartments | 74 | 0.5% |
| 3 or 4 Unit Apartments | 115 | 0.8% |
| 5 to 9 Unit Apartments | 290 | 2.0% |
| 10 or more Apartments | 2,135 | 14.9% |
| Mobile Home / Other | 7 | 0.1% |
| Total | 14,366 | 100.0% |
Housing Structures by Occupancy in Cutler Bay
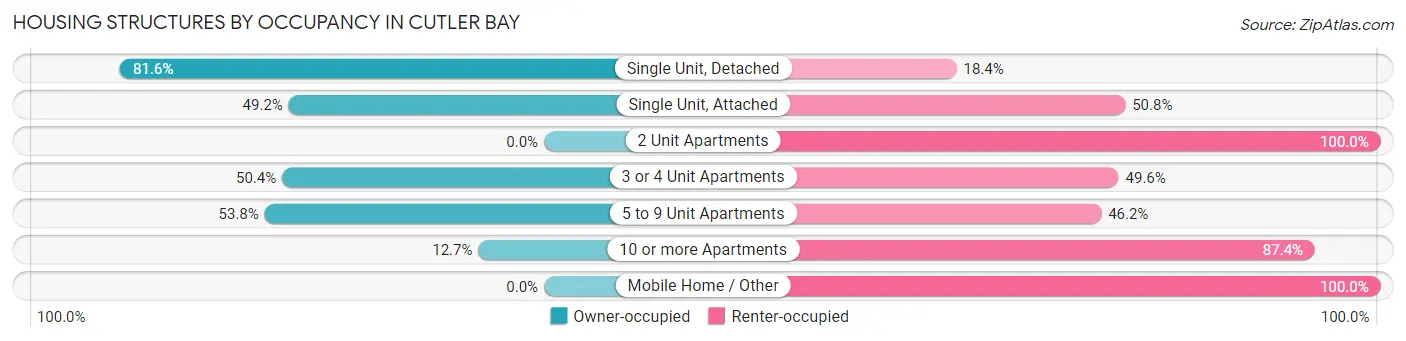
| Structure Type | Owner-occupied | Renter-occupied |
| Single Unit, Detached | 7,941 (81.6%) | 1,788 (18.4%) |
| Single Unit, Attached | 991 (49.2%) | 1,025 (50.8%) |
| 2 Unit Apartments | 0 (0.0%) | 74 (100.0%) |
| 3 or 4 Unit Apartments | 58 (50.4%) | 57 (49.6%) |
| 5 to 9 Unit Apartments | 156 (53.8%) | 134 (46.2%) |
| 10 or more Apartments | 270 (12.7%) | 1,865 (87.4%) |
| Mobile Home / Other | 0 (0.0%) | 7 (100.0%) |
| Total | 9,416 (65.5%) | 4,950 (34.5%) |
Housing Structures by Number of Rooms in Cutler Bay
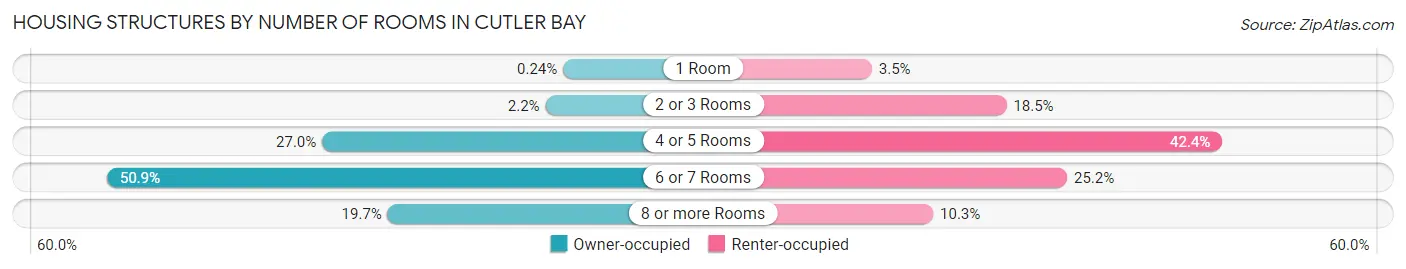
| Number of Rooms | Owner-occupied | Renter-occupied |
| 1 Room | 23 (0.2%) | 175 (3.5%) |
| 2 or 3 Rooms | 207 (2.2%) | 915 (18.5%) |
| 4 or 5 Rooms | 2,540 (27.0%) | 2,100 (42.4%) |
| 6 or 7 Rooms | 4,790 (50.9%) | 1,248 (25.2%) |
| 8 or more Rooms | 1,856 (19.7%) | 512 (10.3%) |
| Total | 9,416 (100.0%) | 4,950 (100.0%) |
Housing Structure by Heating Type in Cutler Bay
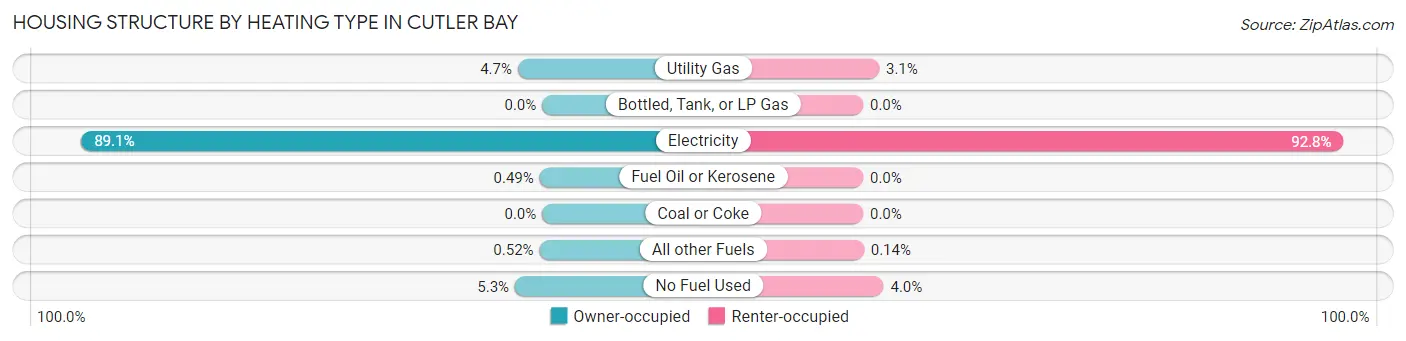
| Heating Type | Owner-occupied | Renter-occupied |
| Utility Gas | 442 (4.7%) | 153 (3.1%) |
| Bottled, Tank, or LP Gas | 0 (0.0%) | 0 (0.0%) |
| Electricity | 8,385 (89.0%) | 4,594 (92.8%) |
| Fuel Oil or Kerosene | 46 (0.5%) | 0 (0.0%) |
| Coal or Coke | 0 (0.0%) | 0 (0.0%) |
| All other Fuels | 49 (0.5%) | 7 (0.1%) |
| No Fuel Used | 494 (5.2%) | 196 (4.0%) |
| Total | 9,416 (100.0%) | 4,950 (100.0%) |
Household Vehicle Usage in Cutler Bay
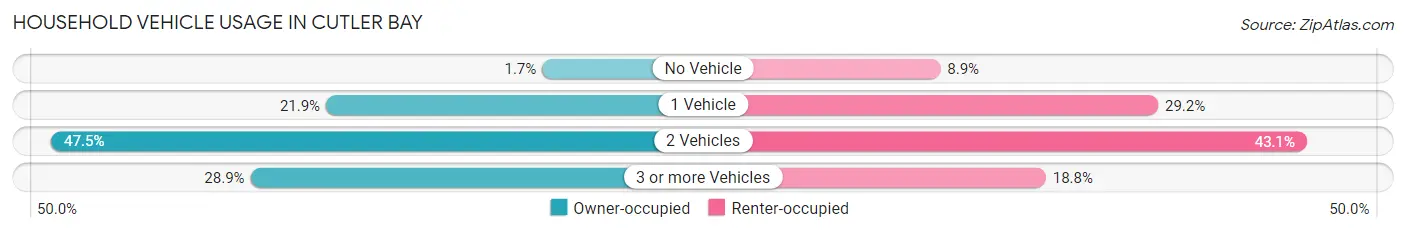
| Vehicles per Household | Owner-occupied | Renter-occupied |
| No Vehicle | 159 (1.7%) | 441 (8.9%) |
| 1 Vehicle | 2,059 (21.9%) | 1,447 (29.2%) |
| 2 Vehicles | 4,475 (47.5%) | 2,134 (43.1%) |
| 3 or more Vehicles | 2,723 (28.9%) | 928 (18.8%) |
| Total | 9,416 (100.0%) | 4,950 (100.0%) |
Real Estate & Mortgages in Cutler Bay
Real Estate and Mortgage Overview in Cutler Bay
| Characteristic | Without Mortgage | With Mortgage |
| Housing Units | 2,708 | 6,708 |
| Median Property Value | $372,800 | $381,600 |
| Median Household Income | $80,938 | $1,593 |
| Monthly Housing Costs | $690 | $1,531 |
| Real Estate Taxes | $2,778 | $154 |
Property Value by Mortgage Status in Cutler Bay
| Property Value | Without Mortgage | With Mortgage |
| Less than $50,000 | 21 (0.8%) | 159 (2.4%) |
| $50,000 to $99,999 | 46 (1.7%) | 0 (0.0%) |
| $100,000 to $299,999 | 526 (19.4%) | 1,310 (19.5%) |
| $300,000 to $499,999 | 1,717 (63.4%) | 3,740 (55.7%) |
| $500,000 to $749,999 | 310 (11.5%) | 1,290 (19.2%) |
| $750,000 to $999,999 | 39 (1.4%) | 99 (1.5%) |
| $1,000,000 or more | 49 (1.8%) | 110 (1.6%) |
| Total | 2,708 (100.0%) | 6,708 (100.0%) |
Household Income by Mortgage Status in Cutler Bay
| Household Income | Without Mortgage | With Mortgage |
| Less than $10,000 | 48 (1.8%) | 69 (1.0%) |
| $10,000 to $24,999 | 246 (9.1%) | 247 (3.7%) |
| $25,000 to $34,999 | 269 (9.9%) | 191 (2.9%) |
| $35,000 to $49,999 | 310 (11.5%) | 158 (2.4%) |
| $50,000 to $74,999 | 434 (16.0%) | 618 (9.2%) |
| $75,000 to $99,999 | 249 (9.2%) | 1,247 (18.6%) |
| $100,000 to $149,999 | 545 (20.1%) | 1,001 (14.9%) |
| $150,000 or more | 607 (22.4%) | 1,653 (24.6%) |
| Total | 2,708 (100.0%) | 6,708 (100.0%) |
Property Value to Household Income Ratio in Cutler Bay
| Value-to-Income Ratio | Without Mortgage | With Mortgage |
| Less than 2.0x | 259 (9.6%) | 96,250 (1,434.8%) |
| 2.0x to 2.9x | 645 (23.8%) | 847 (12.6%) |
| 3.0x to 3.9x | 292 (10.8%) | 1,509 (22.5%) |
| 4.0x or more | 1,500 (55.4%) | 1,030 (15.3%) |
| Total | 2,708 (100.0%) | 6,708 (100.0%) |
Real Estate Taxes by Mortgage Status in Cutler Bay
| Property Taxes | Without Mortgage | With Mortgage |
| Less than $800 | 93 (3.4%) | 121 (1.8%) |
| $800 to $1,499 | 256 (9.5%) | 134 (2.0%) |
| $800 to $1,499 | 2,327 (85.9%) | 451 (6.7%) |
| Total | 2,708 (100.0%) | 6,708 (100.0%) |
Health & Disability in Cutler Bay
Health Insurance Coverage by Age in Cutler Bay
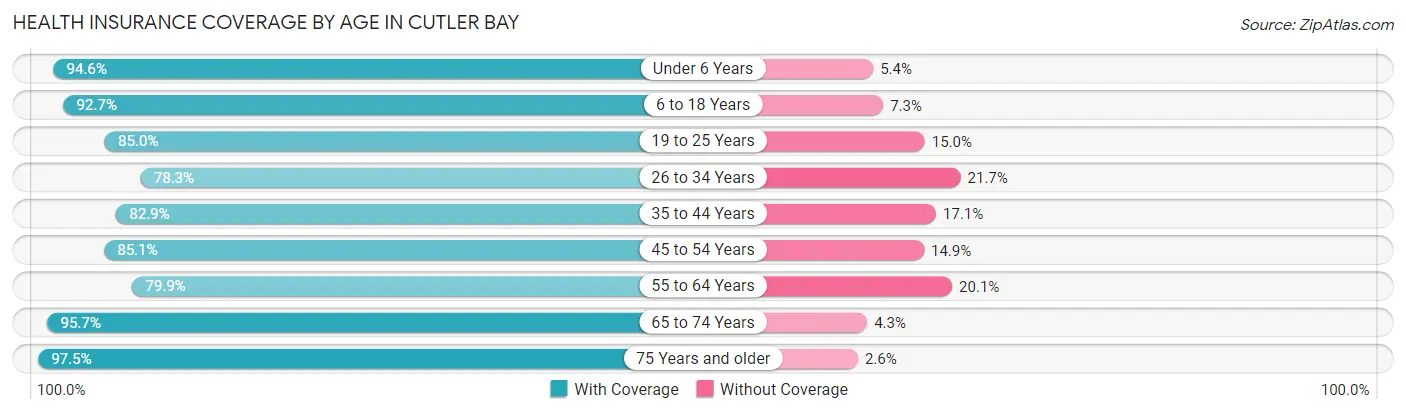
| Age Bracket | With Coverage | Without Coverage |
| Under 6 Years | 2,698 (94.6%) | 154 (5.4%) |
| 6 to 18 Years | 7,188 (92.7%) | 563 (7.3%) |
| 19 to 25 Years | 2,907 (85.0%) | 514 (15.0%) |
| 26 to 34 Years | 3,875 (78.3%) | 1,073 (21.7%) |
| 35 to 44 Years | 4,864 (82.9%) | 1,005 (17.1%) |
| 45 to 54 Years | 6,101 (85.1%) | 1,066 (14.9%) |
| 55 to 64 Years | 4,381 (79.9%) | 1,103 (20.1%) |
| 65 to 74 Years | 3,688 (95.7%) | 165 (4.3%) |
| 75 Years and older | 2,900 (97.5%) | 76 (2.5%) |
| Total | 38,602 (87.1%) | 5,719 (12.9%) |
Health Insurance Coverage by Citizenship Status in Cutler Bay
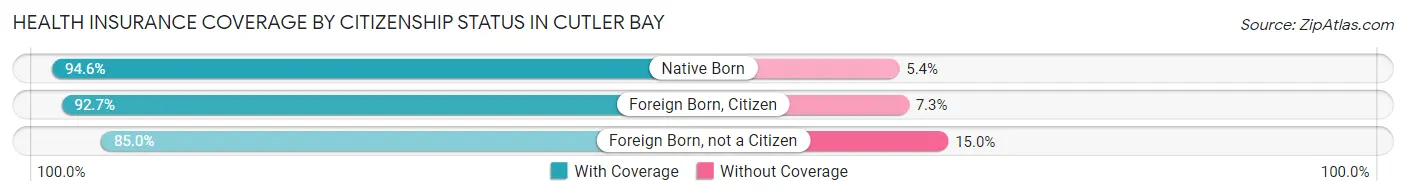
| Citizenship Status | With Coverage | Without Coverage |
| Native Born | 2,698 (94.6%) | 154 (5.4%) |
| Foreign Born, Citizen | 7,188 (92.7%) | 563 (7.3%) |
| Foreign Born, not a Citizen | 2,907 (85.0%) | 514 (15.0%) |
Health Insurance Coverage by Household Income in Cutler Bay
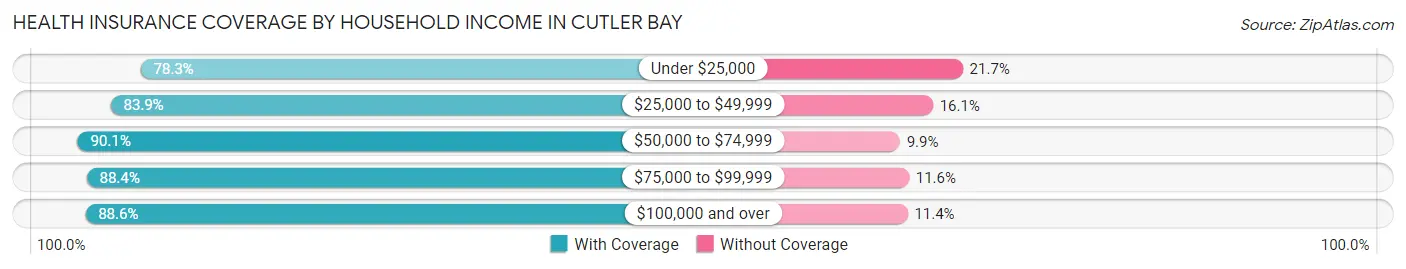
| Household Income | With Coverage | Without Coverage |
| Under $25,000 | 2,542 (78.3%) | 705 (21.7%) |
| $25,000 to $49,999 | 6,964 (83.9%) | 1,335 (16.1%) |
| $50,000 to $74,999 | 5,807 (90.1%) | 639 (9.9%) |
| $75,000 to $99,999 | 5,670 (88.4%) | 745 (11.6%) |
| $100,000 and over | 17,536 (88.6%) | 2,247 (11.4%) |
Public vs Private Health Insurance Coverage by Age in Cutler Bay
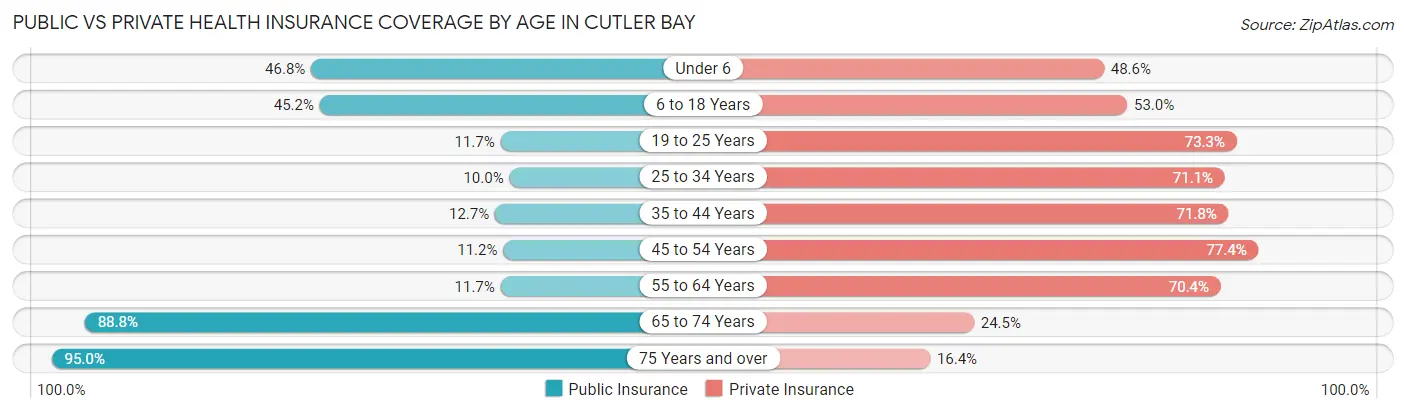
| Age Bracket | Public Insurance | Private Insurance |
| Under 6 | 1,335 (46.8%) | 1,387 (48.6%) |
| 6 to 18 Years | 3,504 (45.2%) | 4,104 (52.9%) |
| 19 to 25 Years | 399 (11.7%) | 2,508 (73.3%) |
| 25 to 34 Years | 495 (10.0%) | 3,518 (71.1%) |
| 35 to 44 Years | 744 (12.7%) | 4,214 (71.8%) |
| 45 to 54 Years | 799 (11.2%) | 5,545 (77.4%) |
| 55 to 64 Years | 639 (11.7%) | 3,858 (70.4%) |
| 65 to 74 Years | 3,423 (88.8%) | 944 (24.5%) |
| 75 Years and over | 2,827 (95.0%) | 487 (16.4%) |
| Total | 14,165 (32.0%) | 26,565 (59.9%) |
Disability Status by Sex by Age in Cutler Bay
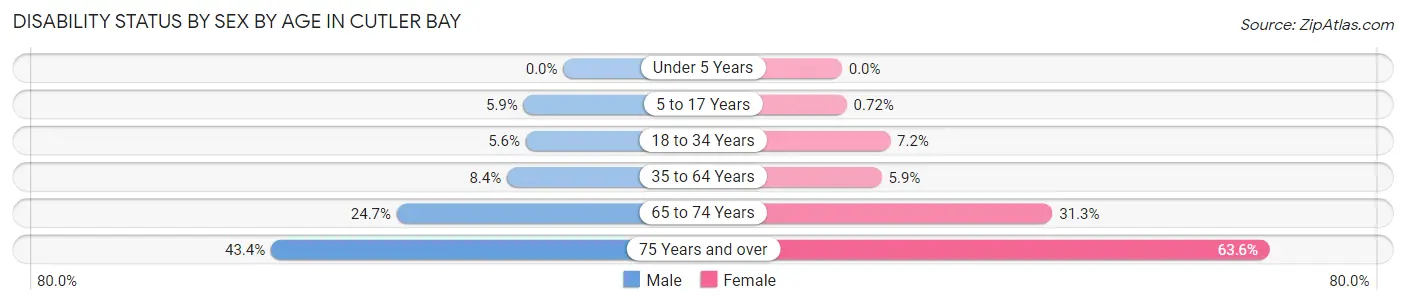
| Age Bracket | Male | Female |
| Under 5 Years | 0 (0.0%) | 0 (0.0%) |
| 5 to 17 Years | 207 (5.9%) | 30 (0.7%) |
| 18 to 34 Years | 261 (5.6%) | 303 (7.2%) |
| 35 to 64 Years | 749 (8.4%) | 565 (5.9%) |
| 65 to 74 Years | 417 (24.7%) | 677 (31.3%) |
| 75 Years and over | 458 (43.4%) | 1,221 (63.6%) |
Disability Class by Sex by Age in Cutler Bay
Disability Class: Hearing Difficulty
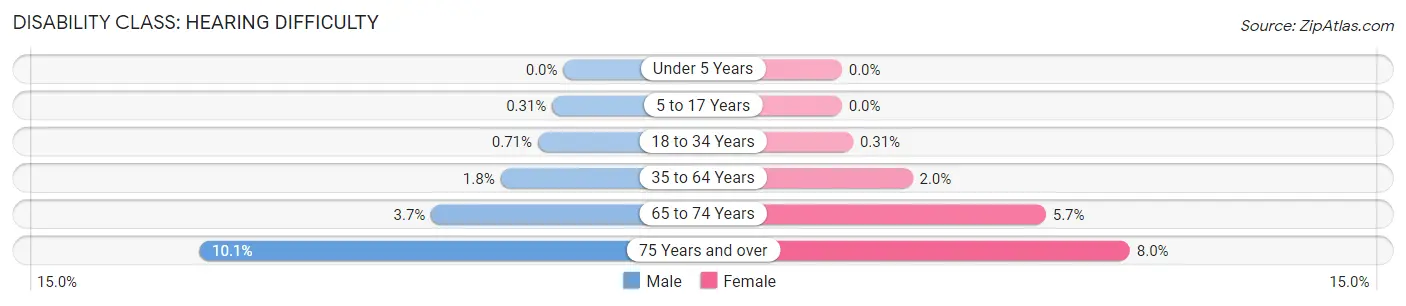
| Age Bracket | Male | Female |
| Under 5 Years | 0 (0.0%) | 0 (0.0%) |
| 5 to 17 Years | 11 (0.3%) | 0 (0.0%) |
| 18 to 34 Years | 33 (0.7%) | 13 (0.3%) |
| 35 to 64 Years | 157 (1.8%) | 188 (2.0%) |
| 65 to 74 Years | 62 (3.7%) | 123 (5.7%) |
| 75 Years and over | 107 (10.1%) | 154 (8.0%) |
Disability Class: Vision Difficulty
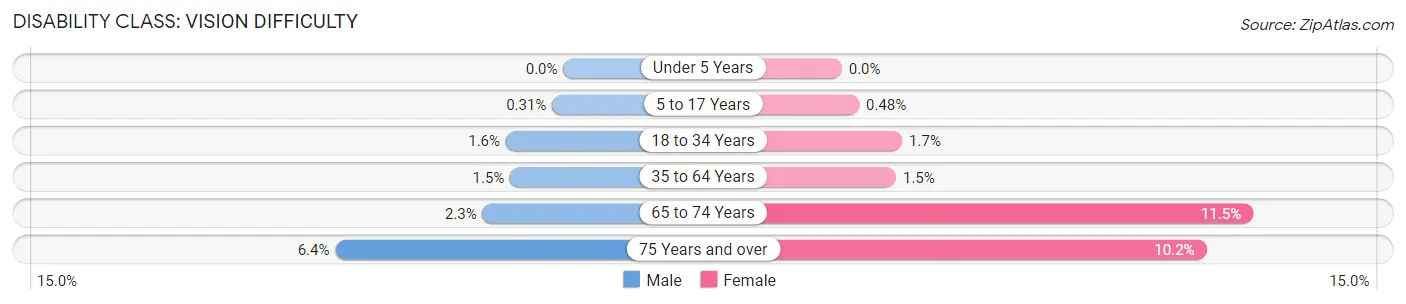
| Age Bracket | Male | Female |
| Under 5 Years | 0 (0.0%) | 0 (0.0%) |
| 5 to 17 Years | 11 (0.3%) | 20 (0.5%) |
| 18 to 34 Years | 75 (1.6%) | 71 (1.7%) |
| 35 to 64 Years | 133 (1.5%) | 144 (1.5%) |
| 65 to 74 Years | 38 (2.2%) | 248 (11.5%) |
| 75 Years and over | 67 (6.4%) | 195 (10.2%) |
Disability Class: Cognitive Difficulty
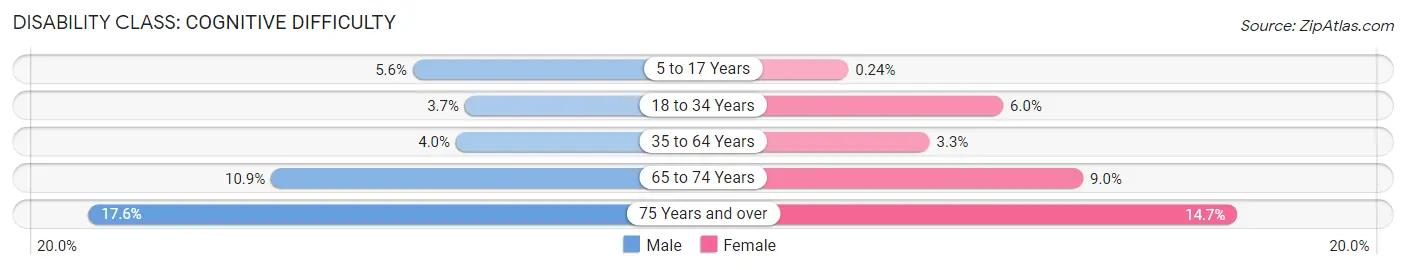
| Age Bracket | Male | Female |
| 5 to 17 Years | 196 (5.6%) | 10 (0.2%) |
| 18 to 34 Years | 171 (3.7%) | 253 (6.0%) |
| 35 to 64 Years | 357 (4.0%) | 312 (3.3%) |
| 65 to 74 Years | 183 (10.8%) | 194 (9.0%) |
| 75 Years and over | 186 (17.6%) | 282 (14.7%) |
Disability Class: Ambulatory Difficulty
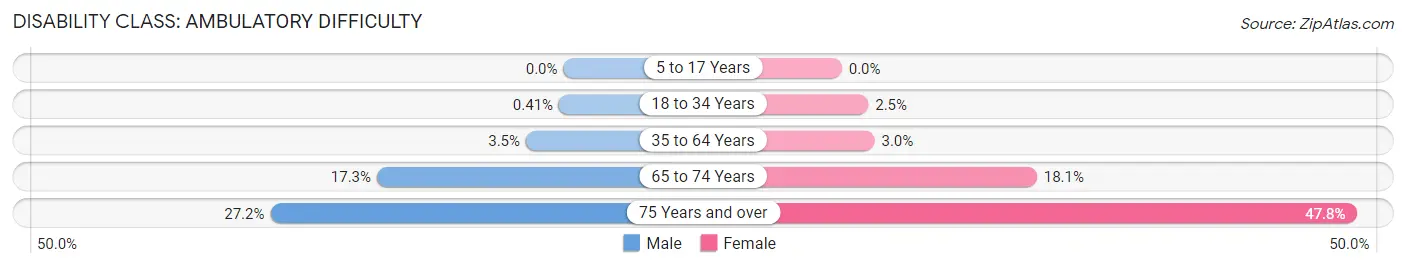
| Age Bracket | Male | Female |
| 5 to 17 Years | 0 (0.0%) | 0 (0.0%) |
| 18 to 34 Years | 19 (0.4%) | 104 (2.5%) |
| 35 to 64 Years | 312 (3.5%) | 291 (3.0%) |
| 65 to 74 Years | 292 (17.3%) | 392 (18.1%) |
| 75 Years and over | 287 (27.2%) | 919 (47.8%) |
Disability Class: Self-Care Difficulty
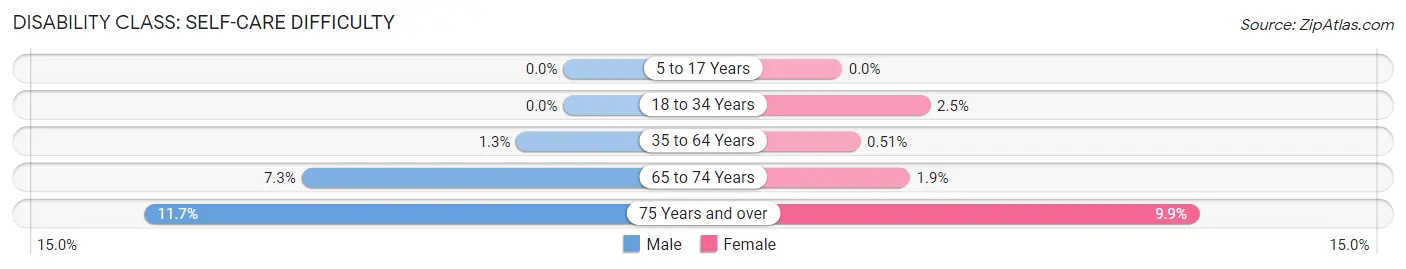
| Age Bracket | Male | Female |
| 5 to 17 Years | 0 (0.0%) | 0 (0.0%) |
| 18 to 34 Years | 0 (0.0%) | 104 (2.5%) |
| 35 to 64 Years | 117 (1.3%) | 49 (0.5%) |
| 65 to 74 Years | 123 (7.3%) | 41 (1.9%) |
| 75 Years and over | 123 (11.7%) | 191 (9.9%) |
Technology Access in Cutler Bay
Computing Device Access in Cutler Bay
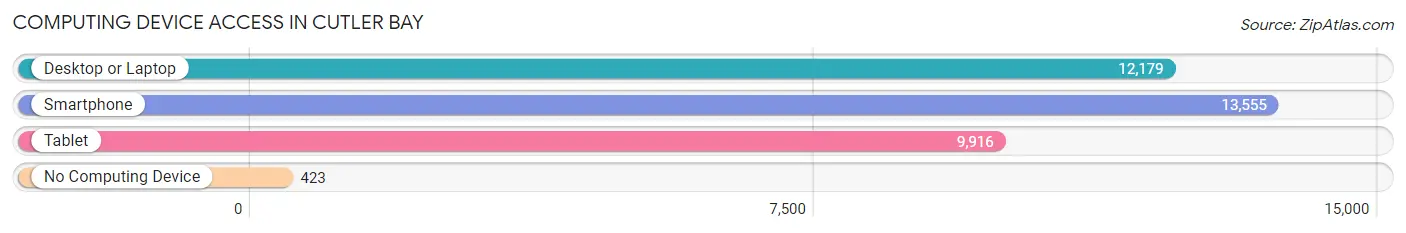
| Device Type | # Households | % Households |
| Desktop or Laptop | 12,179 | 84.8% |
| Smartphone | 13,555 | 94.4% |
| Tablet | 9,916 | 69.0% |
| No Computing Device | 423 | 2.9% |
| Total | 14,366 | 100.0% |
Internet Access in Cutler Bay
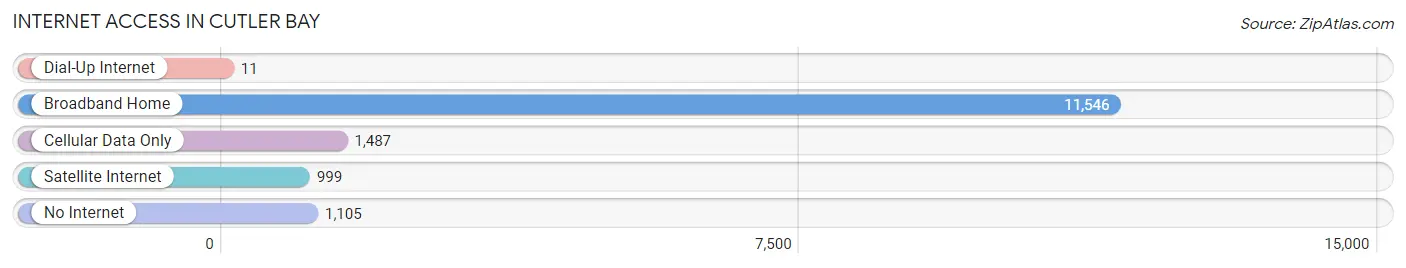
| Internet Type | # Households | % Households |
| Dial-Up Internet | 11 | 0.1% |
| Broadband Home | 11,546 | 80.4% |
| Cellular Data Only | 1,487 | 10.3% |
| Satellite Internet | 999 | 7.0% |
| No Internet | 1,105 | 7.7% |
| Total | 14,366 | 100.0% |
Cutler Bay Summary
Cutler Bay is a town located in Miami-Dade County, Florida. It is situated in the southeastern part of the county, just south of Miami and north of Homestead. The town was incorporated in 2005 and is part of the Miami metropolitan area. As of the 2010 census, the population of Cutler Bay was 44,300.
History
The area that is now Cutler Bay was originally inhabited by the Tequesta Indians. The first European settlers arrived in the area in the late 19th century. The area was originally known as Cutler Ridge, named after William F. Cutler, who was a surveyor for the Florida East Coast Railway. In the early 20th century, the area was developed as a farming community.
In the 1950s, the area began to experience rapid growth as the population of Miami increased. The area was annexed by the City of Miami in 1959. In 2005, the area was incorporated as the Town of Cutler Bay.
Geography
Cutler Bay is located in southeastern Miami-Dade County, just south of Miami and north of Homestead. It is bordered by the cities of Miami, Palmetto Bay, and Homestead. The town has a total area of 15.2 square miles, of which 14.9 square miles is land and 0.3 square miles is water.
The town is located on the Atlantic Coastal Ridge, which is a ridge of limestone that runs along the eastern coast of Florida. The ridge is the highest point in Miami-Dade County, reaching an elevation of 25 feet above sea level.
Economy
The economy of Cutler Bay is largely based on tourism and retail. The town is home to several shopping centers, including the Cutler Ridge Mall and the Cutler Bay Town Center. The town is also home to several restaurants, hotels, and other businesses.
The town is also home to several industrial and manufacturing businesses. The largest employer in the town is the Cutler Bay Business Park, which is home to several companies, including a Coca-Cola bottling plant and a FedEx distribution center.
Demographics
As of the 2010 census, the population of Cutler Bay was 44,300. The racial makeup of the town was 57.3% White, 28.2% Hispanic or Latino, 10.2% African American, 1.3% Asian, 0.3% Native American, and 2.9% from other races.
The median household income in Cutler Bay was $50,945, and the median family income was $54,945. The per capita income in the town was $25,945. About 11.3% of the population was below the poverty line.
Common Questions
What is Per Capita Income in Cutler Bay?
Per Capita income in Cutler Bay is $32,576.
What is the Median Family Income in Cutler Bay?
Median Family Income in Cutler Bay is $83,518.
What is the Median Household income in Cutler Bay?
Median Household Income in Cutler Bay is $78,569.
What is Income or Wage Gap in Cutler Bay?
Income or Wage Gap in Cutler Bay is 22.6%.
Women in Cutler Bay earn 77.4 cents for every dollar earned by a man.
What is Inequality or Gini Index in Cutler Bay?
Inequality or Gini Index in Cutler Bay is 0.41.
What is the Total Population of Cutler Bay?
Total Population of Cutler Bay is 44,738.
What is the Total Male Population of Cutler Bay?
Total Male Population of Cutler Bay is 21,408.
What is the Total Female Population of Cutler Bay?
Total Female Population of Cutler Bay is 23,330.
What is the Ratio of Males per 100 Females in Cutler Bay?
There are 91.76 Males per 100 Females in Cutler Bay.
What is the Ratio of Females per 100 Males in Cutler Bay?
There are 108.98 Females per 100 Males in Cutler Bay.
What is the Median Population Age in Cutler Bay?
Median Population Age in Cutler Bay is 40.9 Years.
What is the Average Family Size in Cutler Bay
Average Family Size in Cutler Bay is 3.4 People.
What is the Average Household Size in Cutler Bay
Average Household Size in Cutler Bay is 3.1 People.
How Large is the Labor Force in Cutler Bay?
There are 24,098 People in the Labor Forcein in Cutler Bay.
What is the Percentage of People in the Labor Force in Cutler Bay?
66.8% of People are in the Labor Force in Cutler Bay.
What is the Unemployment Rate in Cutler Bay?
Unemployment Rate in Cutler Bay is 4.4%.