Zip Codes with the Most Immigrants from Latin America in Denver, CO
RELATED REPORTS & OPTIONS
Latin America
Denver
Compare Zip Codes
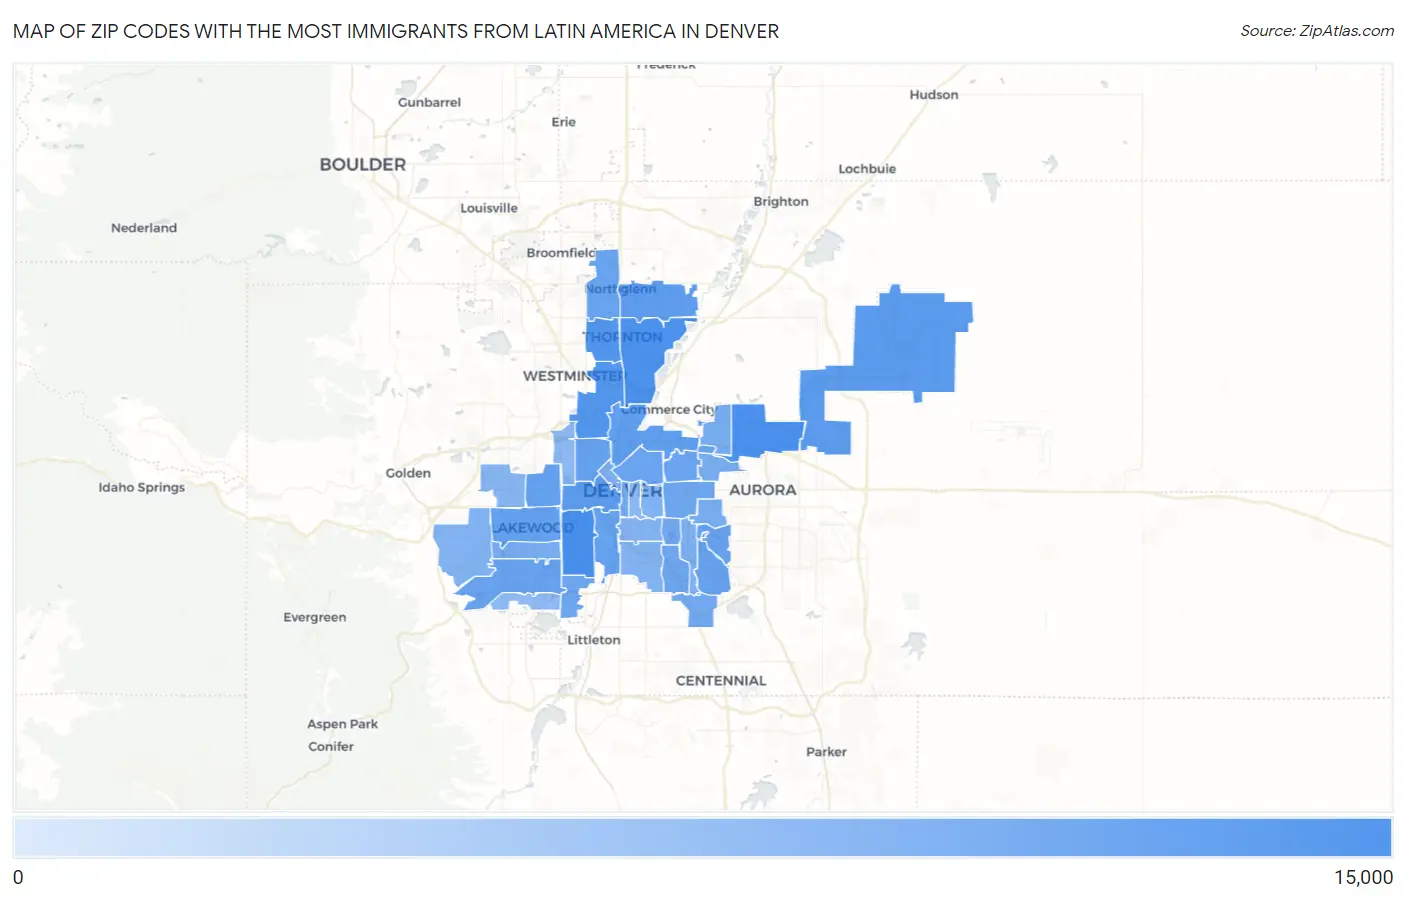
Map of Zip Codes with the Most Immigrants from Latin America in Denver
152
13,440
Zip Codes with the Most Immigrants from Latin America in Denver, CO
| Zip Code | Latin America | vs State | vs National | |
| 1. | 80219 | 13,440 | 276,863(4.85%)#1 | 22,649,518(0.06%)#299 |
| 2. | 80239 | 11,550 | 276,863(4.17%)#2 | 22,649,518(0.05%)#371 |
| 3. | 80229 | 9,895 | 276,863(3.57%)#4 | 22,649,518(0.04%)#494 |
| 4. | 80260 | 6,526 | 276,863(2.36%)#9 | 22,649,518(0.03%)#849 |
| 5. | 80221 | 6,048 | 276,863(2.18%)#10 | 22,649,518(0.03%)#935 |
| 6. | 80249 | 4,284 | 276,863(1.55%)#13 | 22,649,518(0.02%)#1,318 |
| 7. | 80204 | 3,688 | 276,863(1.33%)#15 | 22,649,518(0.02%)#1,531 |
| 8. | 80233 | 3,291 | 276,863(1.19%)#18 | 22,649,518(0.01%)#1,713 |
| 9. | 80216 | 2,669 | 276,863(0.96%)#22 | 22,649,518(0.01%)#2,053 |
| 10. | 80226 | 2,185 | 276,863(0.79%)#28 | 22,649,518(0.01%)#2,454 |
| 11. | 80214 | 2,131 | 276,863(0.77%)#30 | 22,649,518(0.01%)#2,494 |
| 12. | 80223 | 1,954 | 276,863(0.71%)#31 | 22,649,518(0.01%)#2,642 |
| 13. | 80211 | 1,922 | 276,863(0.69%)#32 | 22,649,518(0.01%)#2,682 |
| 14. | 80247 | 1,731 | 276,863(0.63%)#37 | 22,649,518(0.01%)#2,894 |
| 15. | 80227 | 1,631 | 276,863(0.59%)#41 | 22,649,518(0.01%)#3,025 |
| 16. | 80231 | 1,625 | 276,863(0.59%)#42 | 22,649,518(0.01%)#3,035 |
| 17. | 80205 | 1,526 | 276,863(0.55%)#43 | 22,649,518(0.01%)#3,168 |
| 18. | 80234 | 1,434 | 276,863(0.52%)#45 | 22,649,518(0.01%)#3,311 |
| 19. | 80207 | 1,251 | 276,863(0.45%)#51 | 22,649,518(0.01%)#3,631 |
| 20. | 80220 | 1,150 | 276,863(0.42%)#58 | 22,649,518(0.01%)#3,854 |
| 21. | 80236 | 1,078 | 276,863(0.39%)#62 | 22,649,518(0.00%)#4,030 |
| 22. | 80222 | 1,077 | 276,863(0.39%)#63 | 22,649,518(0.00%)#4,034 |
| 23. | 80237 | 868 | 276,863(0.31%)#75 | 22,649,518(0.00%)#4,628 |
| 24. | 80203 | 848 | 276,863(0.31%)#76 | 22,649,518(0.00%)#4,672 |
| 25. | 80246 | 815 | 276,863(0.29%)#81 | 22,649,518(0.00%)#4,781 |
| 26. | 80232 | 665 | 276,863(0.24%)#98 | 22,649,518(0.00%)#5,307 |
| 27. | 80230 | 650 | 276,863(0.23%)#100 | 22,649,518(0.00%)#5,379 |
| 28. | 80238 | 609 | 276,863(0.22%)#111 | 22,649,518(0.00%)#5,569 |
| 29. | 80202 | 472 | 276,863(0.17%)#133 | 22,649,518(0.00%)#6,287 |
| 30. | 80224 | 381 | 276,863(0.14%)#148 | 22,649,518(0.00%)#6,973 |
| 31. | 80228 | 351 | 276,863(0.13%)#154 | 22,649,518(0.00%)#7,217 |
| 32. | 80210 | 334 | 276,863(0.12%)#158 | 22,649,518(0.00%)#7,373 |
| 33. | 80206 | 329 | 276,863(0.12%)#159 | 22,649,518(0.00%)#7,428 |
| 34. | 80209 | 297 | 276,863(0.11%)#166 | 22,649,518(0.00%)#7,748 |
| 35. | 80215 | 213 | 276,863(0.08%)#188 | 22,649,518(0.00%)#8,814 |
| 36. | 80218 | 186 | 276,863(0.07%)#197 | 22,649,518(0.00%)#9,255 |
| 37. | 80212 | 170 | 276,863(0.06%)#205 | 22,649,518(0.00%)#9,547 |
| 38. | 80235 | 152 | 276,863(0.05%)#210 | 22,649,518(0.00%)#9,901 |
1
Common Questions
What are the Top 10 Zip Codes with the Most Immigrants from Latin America in Denver, CO?
Top 10 Zip Codes with the Most Immigrants from Latin America in Denver, CO are:
What zip code has the Most Immigrants from Latin America in Denver, CO?
80219 has the Most Immigrants from Latin America in Denver, CO with 13,440.
What is the Total Immigrants from Latin America in Denver, CO?
Total Immigrants from Latin America in Denver is 55,331.
What is the Total Immigrants from Latin America in Colorado?
Total Immigrants from Latin America in Colorado is 276,863.
What is the Total Immigrants from Latin America in the United States?
Total Immigrants from Latin America in the United States is 22,649,518.