Zip Codes with the Highest Percentage of Households with Income Below $10,000 in Castle Rock, CO
RELATED REPORTS & OPTIONS
Household Income | $0-10k
Castle Rock
Compare Zip Codes
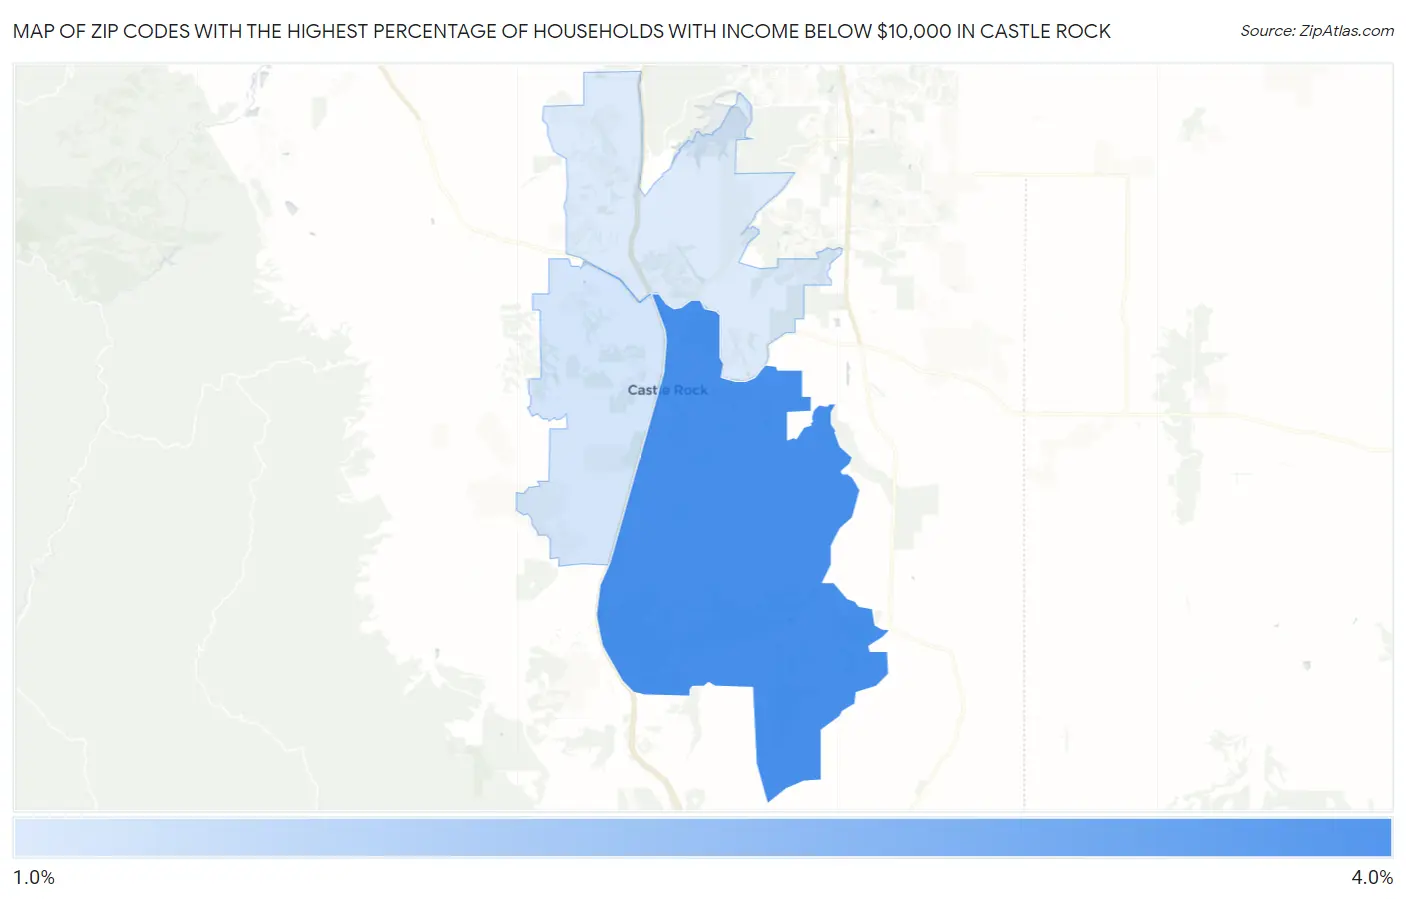
Map of Zip Codes with the Highest Percentage of Households with Income Below $10,000 in Castle Rock
1.3%
3.1%
Zip Codes with the Highest Percentage of Households with Income Below $10,000 in Castle Rock, CO
| Zip Code | Households with Income < $10k | vs State | vs National | |
| 1. | 80104 | 3.1% | 3.9%(-0.800)#265 | 4.9%(-1.80)#18,902 |
| 2. | 80109 | 1.4% | 3.9%(-2.50)#369 | 4.9%(-3.50)#25,721 |
| 3. | 80108 | 1.3% | 3.9%(-2.60)#375 | 4.9%(-3.60)#26,007 |
1
Common Questions
What are the Top Zip Codes with the Highest Percentage of Households with Income Below $10,000 in Castle Rock, CO?
Top Zip Codes with the Highest Percentage of Households with Income Below $10,000 in Castle Rock, CO are:
What zip code has the Highest Percentage of Households with Income Below $10,000 in Castle Rock, CO?
80104 has the Highest Percentage of Households with Income Below $10,000 in Castle Rock, CO with 3.1%.
What is the Percentage of Households with Income Below $10,000 in Castle Rock, CO?
Percentage of Households with Income Below $10,000 in Castle Rock is 2.2%.
What is the Percentage of Households with Income Below $10,000 in Colorado?
Percentage of Households with Income Below $10,000 in Colorado is 3.9%.
What is the Percentage of Households with Income Below $10,000 in the United States?
Percentage of Households with Income Below $10,000 in the United States is 4.9%.