Zip Codes with the Highest Percentage of Households with Income Below $10,000 in Denver, CO
RELATED REPORTS & OPTIONS
Household Income | $0-10k
Denver
Compare Zip Codes
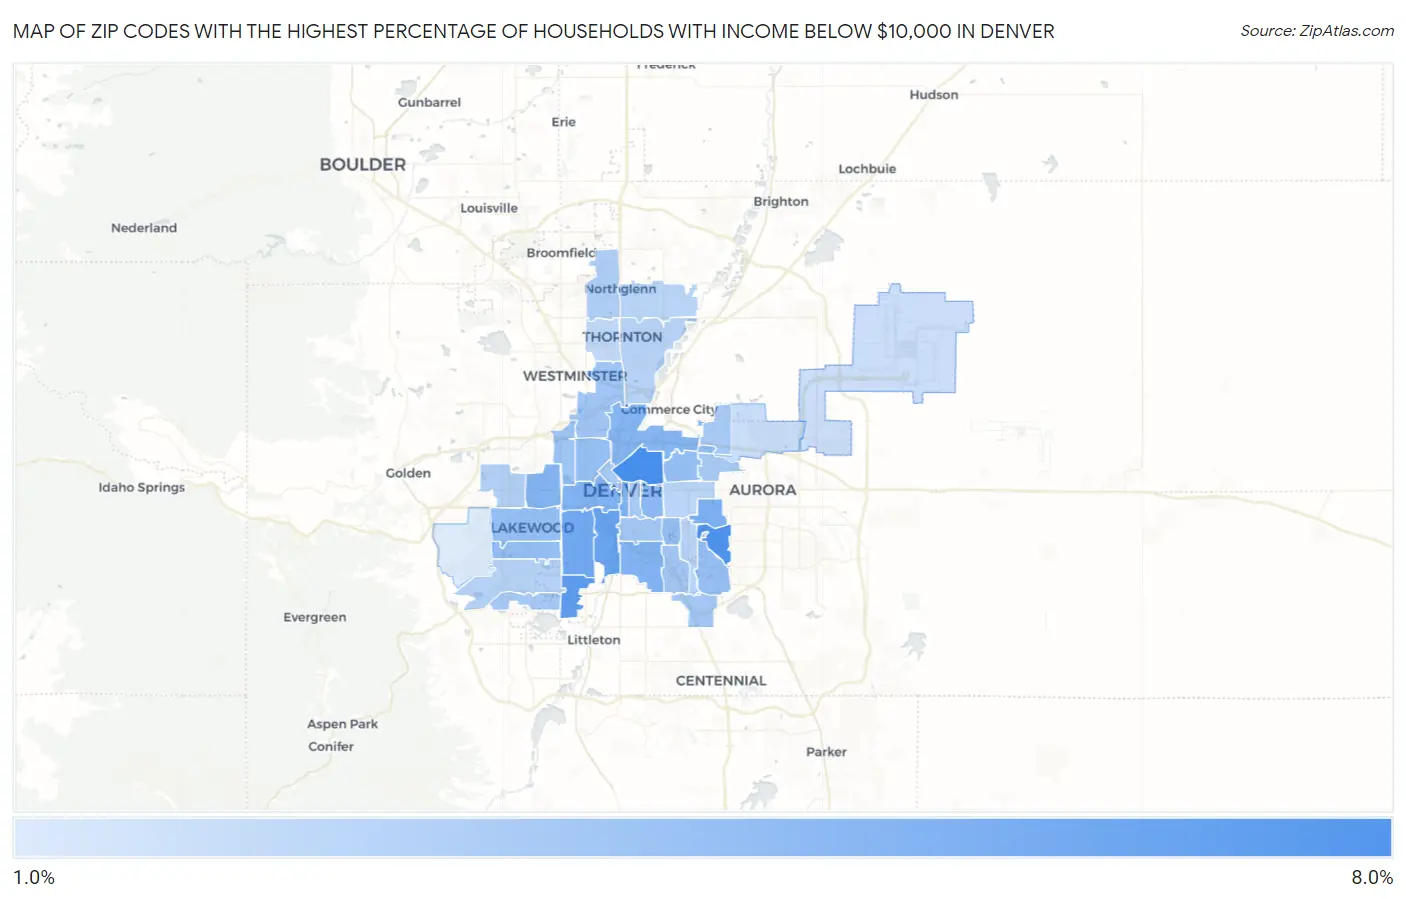
Map of Zip Codes with the Highest Percentage of Households with Income Below $10,000 in Denver
1.7%
7.8%
Zip Codes with the Highest Percentage of Households with Income Below $10,000 in Denver, CO
| Zip Code | Households with Income < $10k | vs State | vs National | |
| 1. | 80205 | 7.8% | 3.9%(+3.90)#66 | 4.9%(+2.90)#5,801 |
| 2. | 80247 | 7.5% | 3.9%(+3.60)#73 | 4.9%(+2.60)#6,206 |
| 3. | 80236 | 6.8% | 3.9%(+2.90)#83 | 4.9%(+1.90)#7,357 |
| 4. | 80223 | 6.5% | 3.9%(+2.60)#87 | 4.9%(+1.60)#7,923 |
| 5. | 80219 | 6.1% | 3.9%(+2.20)#98 | 4.9%(+1.20)#8,715 |
| 6. | 80230 | 5.6% | 3.9%(+1.70)#120 | 4.9%(+0.700)#10,032 |
| 7. | 80210 | 5.4% | 3.9%(+1.50)#129 | 4.9%(+0.500)#10,447 |
| 8. | 80204 | 5.4% | 3.9%(+1.50)#130 | 4.9%(+0.500)#10,458 |
| 9. | 80203 | 5.4% | 3.9%(+1.50)#133 | 4.9%(+0.500)#10,490 |
| 10. | 80214 | 5.3% | 3.9%(+1.40)#137 | 4.9%(+0.400)#10,767 |
| 11. | 80216 | 5.2% | 3.9%(+1.30)#144 | 4.9%(+0.300)#11,120 |
| 12. | 80206 | 4.9% | 3.9%(+1.00)#153 | 4.9%(=0.000)#12,028 |
| 13. | 80211 | 4.6% | 3.9%(+0.700)#168 | 4.9%(-0.300)#12,997 |
| 14. | 80226 | 4.6% | 3.9%(+0.700)#169 | 4.9%(-0.300)#13,012 |
| 15. | 80232 | 4.6% | 3.9%(+0.700)#170 | 4.9%(-0.300)#13,047 |
| 16. | 80207 | 4.6% | 3.9%(+0.700)#171 | 4.9%(-0.300)#13,048 |
| 17. | 80246 | 4.6% | 3.9%(+0.700)#172 | 4.9%(-0.300)#13,089 |
| 18. | 80231 | 4.5% | 3.9%(+0.600)#176 | 4.9%(-0.400)#13,355 |
| 19. | 80212 | 4.2% | 3.9%(+0.300)#188 | 4.9%(-0.700)#14,530 |
| 20. | 80221 | 4.1% | 3.9%(+0.200)#191 | 4.9%(-0.800)#14,822 |
| 21. | 80209 | 4.0% | 3.9%(+0.100)#197 | 4.9%(-0.900)#15,271 |
| 22. | 80222 | 4.0% | 3.9%(+0.100)#198 | 4.9%(-0.900)#15,276 |
| 23. | 80237 | 4.0% | 3.9%(+0.100)#199 | 4.9%(-0.900)#15,284 |
| 24. | 80235 | 3.9% | 3.9%(=0.000)#204 | 4.9%(-1.00)#15,742 |
| 25. | 80238 | 3.8% | 3.9%(-0.100)#209 | 4.9%(-1.10)#16,028 |
| 26. | 80218 | 3.8% | 3.9%(-0.100)#211 | 4.9%(-1.10)#16,078 |
| 27. | 80202 | 3.8% | 3.9%(-0.100)#212 | 4.9%(-1.10)#16,081 |
| 28. | 80234 | 3.5% | 3.9%(-0.400)#232 | 4.9%(-1.40)#17,245 |
| 29. | 80215 | 3.4% | 3.9%(-0.500)#240 | 4.9%(-1.50)#17,726 |
| 30. | 80227 | 3.3% | 3.9%(-0.600)#246 | 4.9%(-1.60)#18,075 |
| 31. | 80229 | 3.2% | 3.9%(-0.700)#250 | 4.9%(-1.70)#18,442 |
| 32. | 80224 | 3.2% | 3.9%(-0.700)#251 | 4.9%(-1.70)#18,570 |
| 33. | 80233 | 3.1% | 3.9%(-0.800)#263 | 4.9%(-1.80)#18,872 |
| 34. | 80220 | 3.1% | 3.9%(-0.800)#264 | 4.9%(-1.80)#18,901 |
| 35. | 80260 | 2.8% | 3.9%(-1.10)#284 | 4.9%(-2.10)#20,264 |
| 36. | 80239 | 2.5% | 3.9%(-1.40)#303 | 4.9%(-2.40)#21,544 |
| 37. | 80249 | 2.4% | 3.9%(-1.50)#312 | 4.9%(-2.50)#22,001 |
| 38. | 80228 | 1.7% | 3.9%(-2.20)#351 | 4.9%(-3.20)#24,701 |
1
Common Questions
What are the Top 10 Zip Codes with the Highest Percentage of Households with Income Below $10,000 in Denver, CO?
Top 10 Zip Codes with the Highest Percentage of Households with Income Below $10,000 in Denver, CO are:
What zip code has the Highest Percentage of Households with Income Below $10,000 in Denver, CO?
80205 has the Highest Percentage of Households with Income Below $10,000 in Denver, CO with 7.8%.
What is the Percentage of Households with Income Below $10,000 in Denver, CO?
Percentage of Households with Income Below $10,000 in Denver is 4.7%.
What is the Percentage of Households with Income Below $10,000 in Colorado?
Percentage of Households with Income Below $10,000 in Colorado is 3.9%.
What is the Percentage of Households with Income Below $10,000 in the United States?
Percentage of Households with Income Below $10,000 in the United States is 4.9%.