Cowarts, AL Map & Demographics
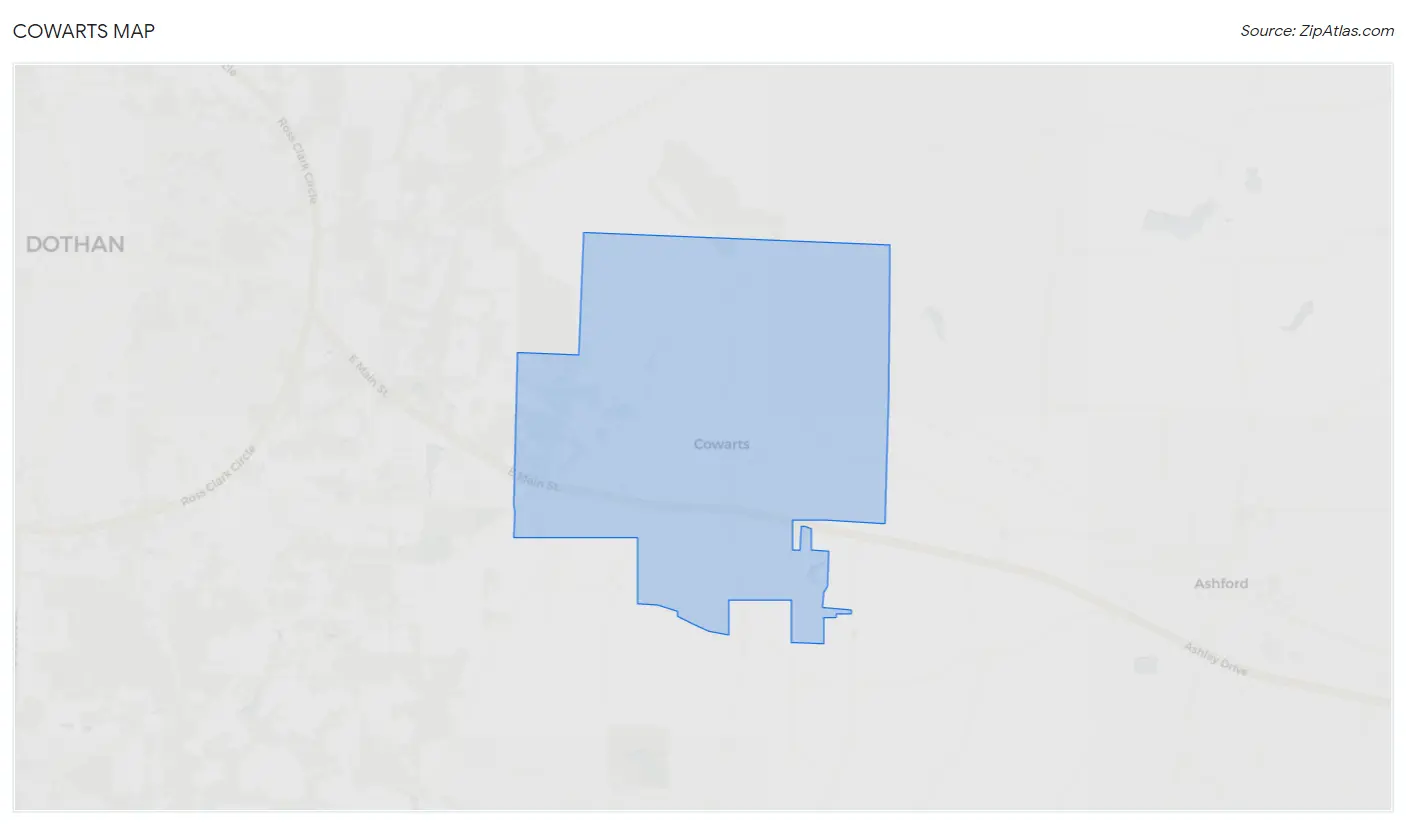
Cowarts Map
Cowarts Overview
$23,736
PER CAPITA INCOME
$57,423
AVG FAMILY INCOME
$56,845
AVG HOUSEHOLD INCOME
41.0%
WAGE / INCOME GAP [ % ]
59.0¢/ $1
WAGE / INCOME GAP [ $ ]
0.37
INEQUALITY / GINI INDEX
2,174
TOTAL POPULATION
1,084
MALE POPULATION
1,090
FEMALE POPULATION
99.45
MALES / 100 FEMALES
100.55
FEMALES / 100 MALES
39.4
MEDIAN AGE
3.0
AVG FAMILY SIZE
2.7
AVG HOUSEHOLD SIZE
880
LABOR FORCE [ PEOPLE ]
51.7%
PERCENT IN LABOR FORCE
3.1%
UNEMPLOYMENT RATE
Cowarts Zip Codes
Cowarts Area Codes
Income in Cowarts
Income Overview in Cowarts
Per Capita Income in Cowarts is $23,736, while median incomes of families and households are $57,423 and $56,845 respectively.
| Characteristic | Number | Measure |
| Per Capita Income | 2,174 | $23,736 |
| Median Family Income | 626 | $57,423 |
| Mean Family Income | 626 | $66,464 |
| Median Household Income | 801 | $56,845 |
| Mean Household Income | 801 | $60,036 |
| Income Deficit | 626 | $0 |
| Wage / Income Gap (%) | 2,174 | 41.04% |
| Wage / Income Gap ($) | 2,174 | 58.96¢ per $1 |
| Gini / Inequality Index | 2,174 | 0.37 |
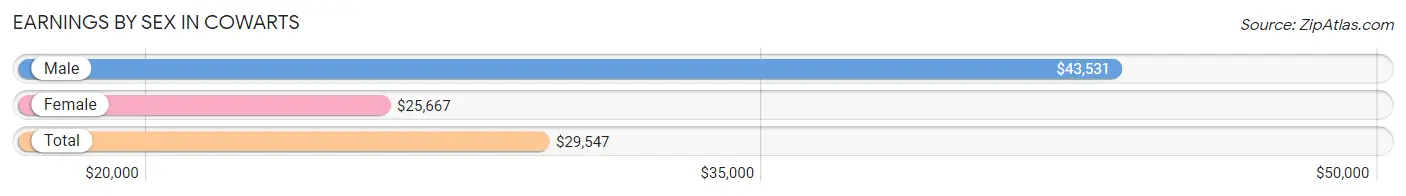
Earnings by Sex in Cowarts
Average Earnings in Cowarts are $29,547, $43,531 for men and $25,667 for women, a difference of 41.0%.
| Sex | Number | Average Earnings |
| Male | 507 (52.8%) | $43,531 |
| Female | 454 (47.2%) | $25,667 |
| Total | 961 (100.0%) | $29,547 |
Earnings by Sex by Income Bracket in Cowarts
The most common earnings brackets in Cowarts are $55,000 to $64,999 for men (99 | 19.5%) and $25,000 to $29,999 for women (80 | 17.6%).
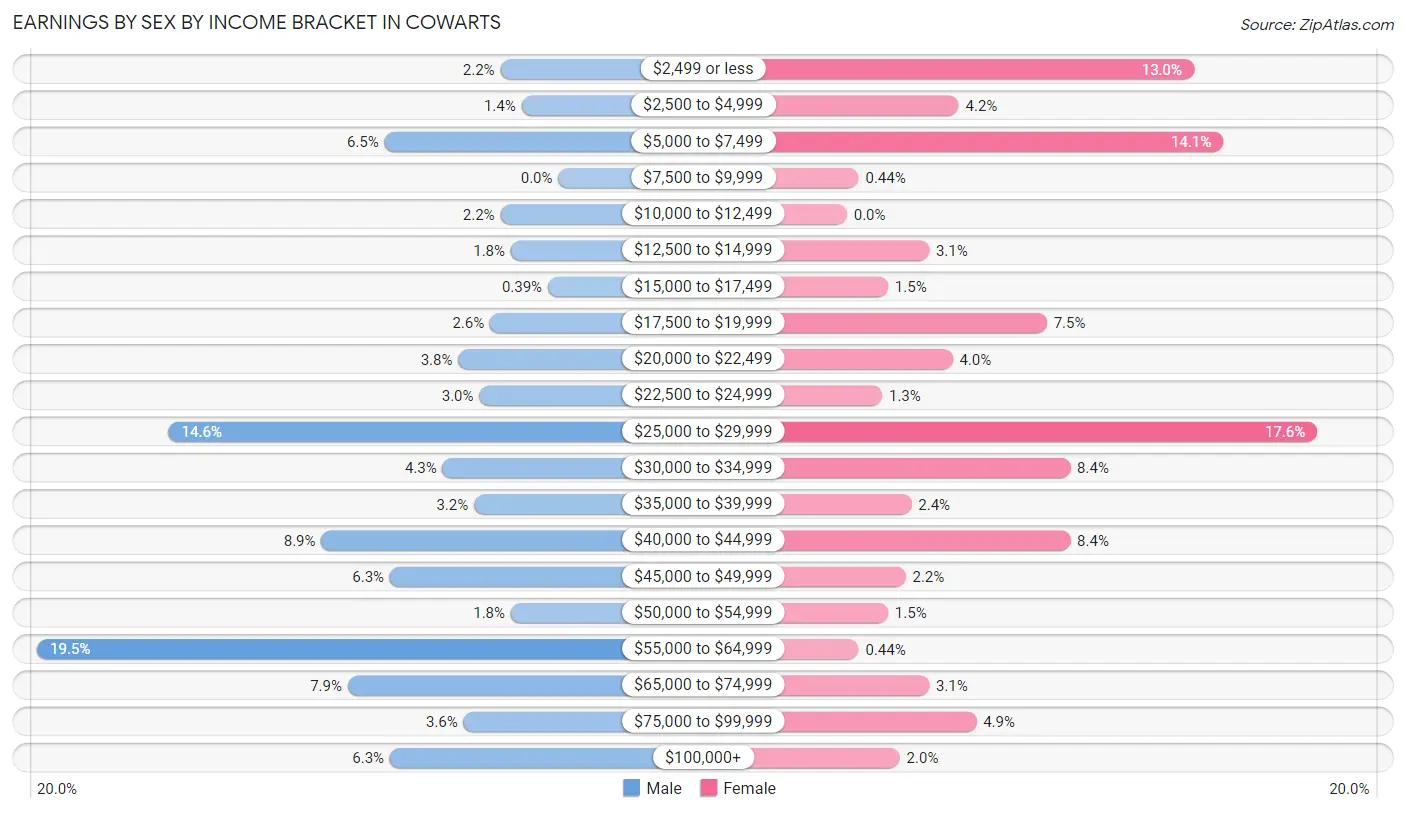
| Income | Male | Female |
| $2,499 or less | 11 (2.2%) | 59 (13.0%) |
| $2,500 to $4,999 | 7 (1.4%) | 19 (4.2%) |
| $5,000 to $7,499 | 33 (6.5%) | 64 (14.1%) |
| $7,500 to $9,999 | 0 (0.0%) | 2 (0.4%) |
| $10,000 to $12,499 | 11 (2.2%) | 0 (0.0%) |
| $12,500 to $14,999 | 9 (1.8%) | 14 (3.1%) |
| $15,000 to $17,499 | 2 (0.4%) | 7 (1.5%) |
| $17,500 to $19,999 | 13 (2.6%) | 34 (7.5%) |
| $20,000 to $22,499 | 19 (3.7%) | 18 (4.0%) |
| $22,500 to $24,999 | 15 (3.0%) | 6 (1.3%) |
| $25,000 to $29,999 | 74 (14.6%) | 80 (17.6%) |
| $30,000 to $34,999 | 22 (4.3%) | 38 (8.4%) |
| $35,000 to $39,999 | 16 (3.2%) | 11 (2.4%) |
| $40,000 to $44,999 | 45 (8.9%) | 38 (8.4%) |
| $45,000 to $49,999 | 32 (6.3%) | 10 (2.2%) |
| $50,000 to $54,999 | 9 (1.8%) | 7 (1.5%) |
| $55,000 to $64,999 | 99 (19.5%) | 2 (0.4%) |
| $65,000 to $74,999 | 40 (7.9%) | 14 (3.1%) |
| $75,000 to $99,999 | 18 (3.5%) | 22 (4.9%) |
| $100,000+ | 32 (6.3%) | 9 (2.0%) |
| Total | 507 (100.0%) | 454 (100.0%) |
Earnings by Sex by Educational Attainment in Cowarts
Average earnings in Cowarts are $45,685 for men and $28,058 for women, a difference of 38.6%. Men with an educational attainment of graduate degree enjoy the highest average annual earnings of $130,417, while those with high school diploma education earn the least with $42,750. Women with an educational attainment of graduate degree earn the most with the average annual earnings of $67,917, while those with high school diploma education have the smallest earnings of $19,250.
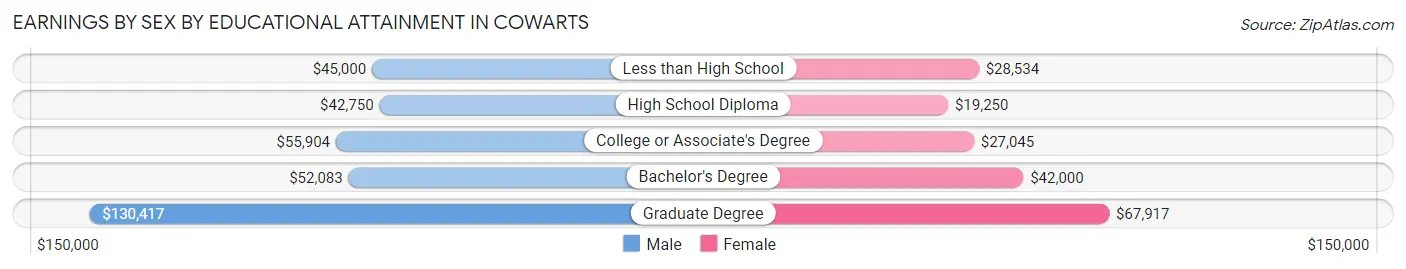
| Educational Attainment | Male Income | Female Income |
| Less than High School | $45,000 | $28,534 |
| High School Diploma | $42,750 | $19,250 |
| College or Associate's Degree | $55,904 | $27,045 |
| Bachelor's Degree | $52,083 | $42,000 |
| Graduate Degree | $130,417 | $67,917 |
| Total | $45,685 | $28,058 |
Family Income in Cowarts
Family Income Brackets in Cowarts
According to the Cowarts family income data, there are 204 families falling into the $50,000 to $74,999 income range, which is the most common income bracket and makes up 32.6% of all families. Conversely, the $200,000+ income bracket is the least frequent group with only 9 families (1.4%) belonging to this category.
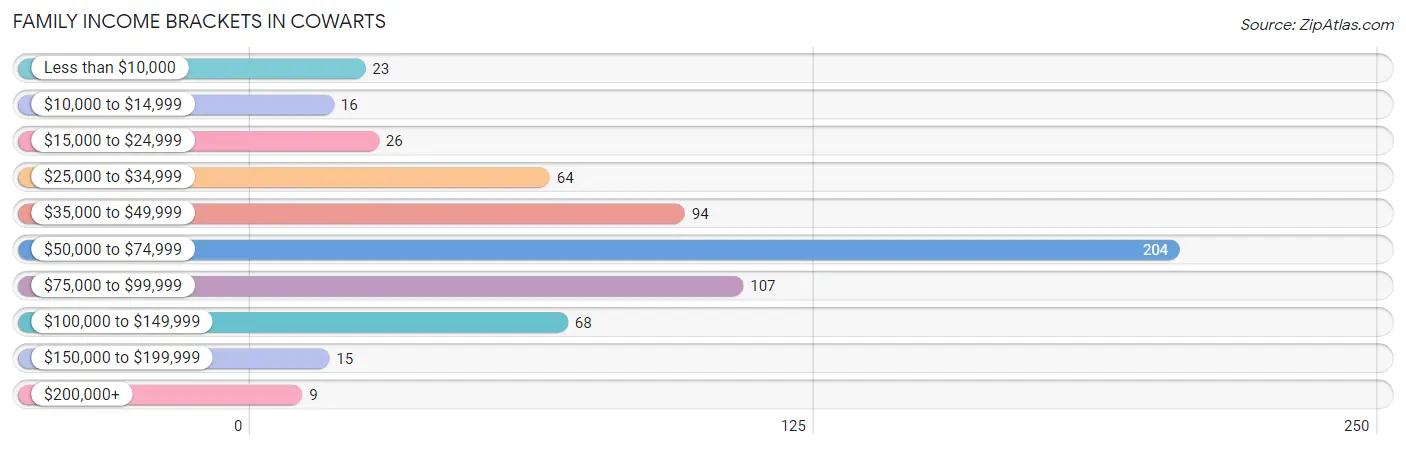
| Income Bracket | # Families | % Families |
| Less than $10,000 | 23 | 3.7% |
| $10,000 to $14,999 | 16 | 2.6% |
| $15,000 to $24,999 | 26 | 4.2% |
| $25,000 to $34,999 | 64 | 10.2% |
| $35,000 to $49,999 | 94 | 15.0% |
| $50,000 to $74,999 | 204 | 32.6% |
| $75,000 to $99,999 | 107 | 17.1% |
| $100,000 to $149,999 | 68 | 10.9% |
| $150,000 to $199,999 | 15 | 2.4% |
| $200,000+ | 9 | 1.4% |
Family Income by Famaliy Size in Cowarts
4-person families (69 | 11.0%) account for the highest median family income in Cowarts with $61,736 per family, while 2-person families (332 | 53.0%) have the highest median income of $29,792 per family member.
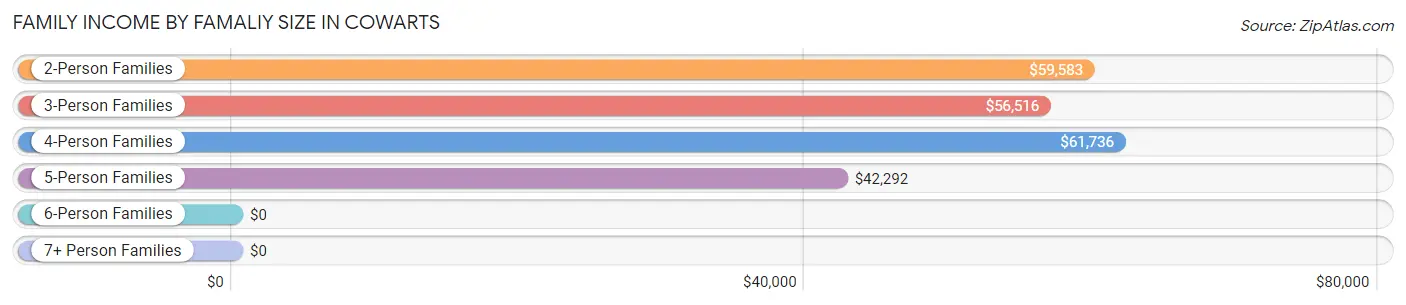
| Income Bracket | # Families | Median Income |
| 2-Person Families | 332 (53.0%) | $59,583 |
| 3-Person Families | 197 (31.5%) | $56,516 |
| 4-Person Families | 69 (11.0%) | $61,736 |
| 5-Person Families | 23 (3.7%) | $42,292 |
| 6-Person Families | 5 (0.8%) | $0 |
| 7+ Person Families | 0 (0.0%) | $0 |
| Total | 626 (100.0%) | $57,423 |
Family Income by Number of Earners in Cowarts
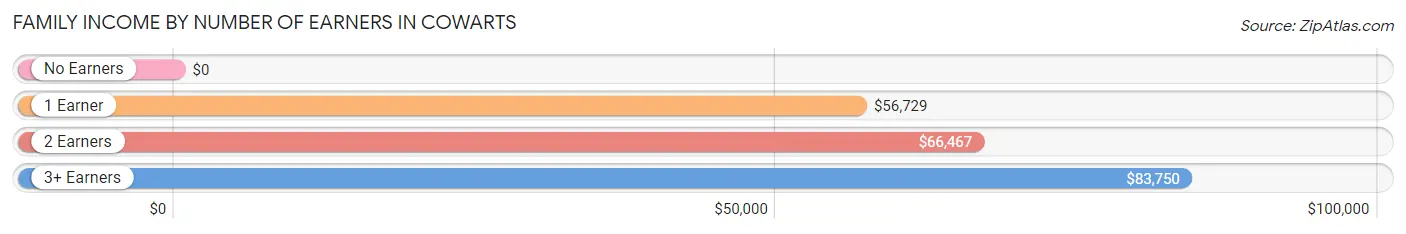
| Number of Earners | # Families | Median Income |
| No Earners | 150 (24.0%) | $0 |
| 1 Earner | 229 (36.6%) | $56,729 |
| 2 Earners | 229 (36.6%) | $66,467 |
| 3+ Earners | 18 (2.9%) | $83,750 |
| Total | 626 (100.0%) | $57,423 |
Household Income in Cowarts
Household Income Brackets in Cowarts
With 228 households falling in the category, the $50,000 to $74,999 income range is the most frequent in Cowarts, accounting for 28.5% of all households. In contrast, only 9 households (1.1%) fall into the $200,000+ income bracket, making it the least populous group.
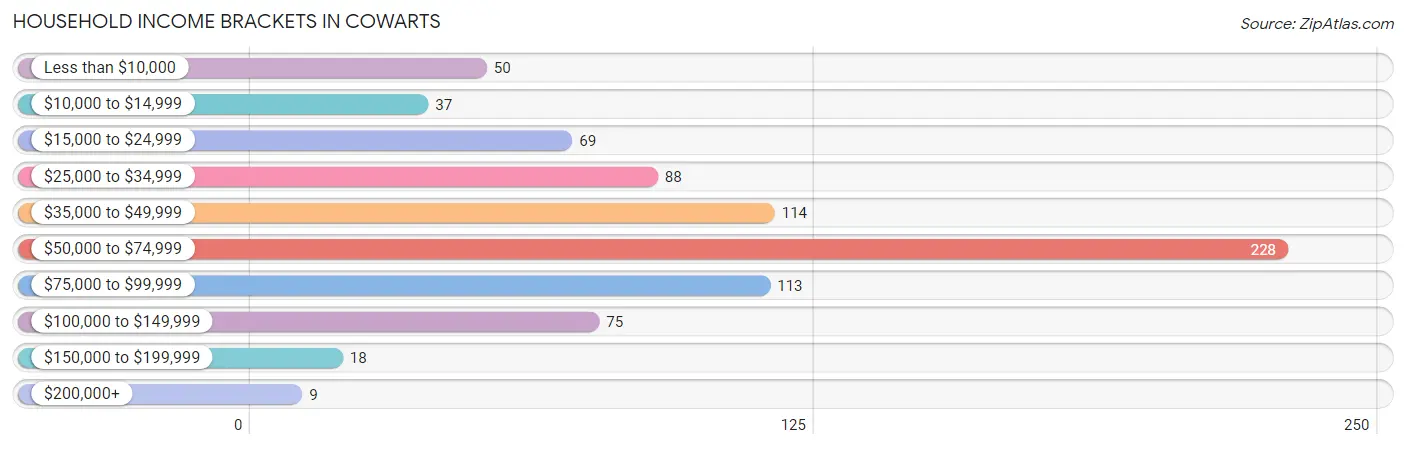
| Income Bracket | # Households | % Households |
| Less than $10,000 | 50 | 6.2% |
| $10,000 to $14,999 | 37 | 4.6% |
| $15,000 to $24,999 | 69 | 8.6% |
| $25,000 to $34,999 | 88 | 11.0% |
| $35,000 to $49,999 | 114 | 14.2% |
| $50,000 to $74,999 | 228 | 28.5% |
| $75,000 to $99,999 | 113 | 14.1% |
| $100,000 to $149,999 | 75 | 9.4% |
| $150,000 to $199,999 | 18 | 2.2% |
| $200,000+ | 9 | 1.1% |
Household Income by Householder Age in Cowarts
The median household income in Cowarts is $56,845, with the highest median household income of $62,045 found in the 45 to 64 years age bracket for the primary householder. A total of 248 households (31.0%) fall into this category. Meanwhile, the 15 to 24 years age bracket for the primary householder has the lowest median household income of $0, with 13 households (1.6%) in this group.
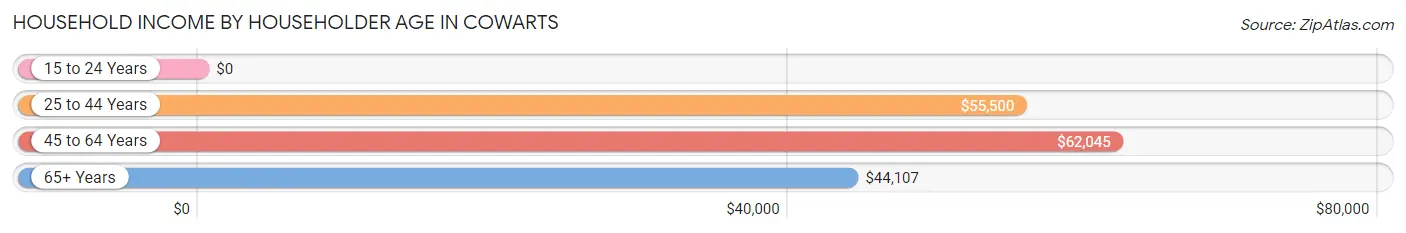
| Income Bracket | # Households | Median Income |
| 15 to 24 Years | 13 (1.6%) | $0 |
| 25 to 44 Years | 260 (32.5%) | $55,500 |
| 45 to 64 Years | 248 (31.0%) | $62,045 |
| 65+ Years | 280 (35.0%) | $44,107 |
| Total | 801 (100.0%) | $56,845 |
Poverty in Cowarts
Income Below Poverty by Sex and Age in Cowarts
With 11.2% poverty level for males and 15.8% for females among the residents of Cowarts, 15 year old males and 6 to 11 year old females are the most vulnerable to poverty, with 6 males (100.0%) and 20 females (36.4%) in their respective age groups living below the poverty level.
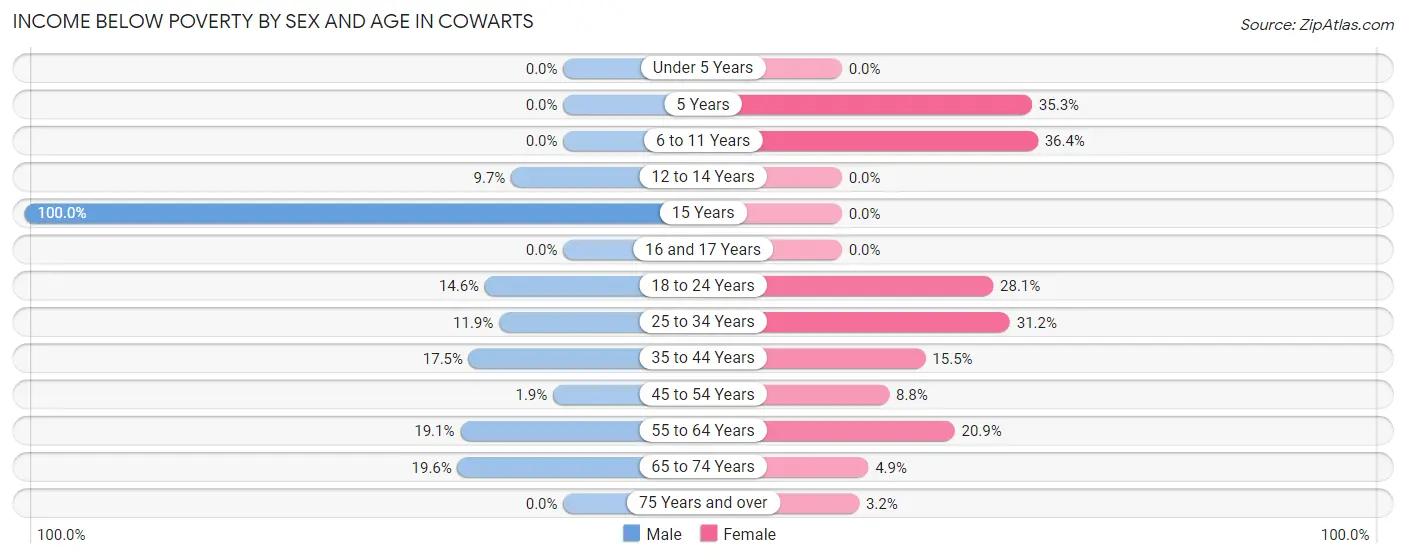
| Age Bracket | Male | Female |
| Under 5 Years | 0 (0.0%) | 0 (0.0%) |
| 5 Years | 0 (0.0%) | 6 (35.3%) |
| 6 to 11 Years | 0 (0.0%) | 20 (36.4%) |
| 12 to 14 Years | 9 (9.7%) | 0 (0.0%) |
| 15 Years | 6 (100.0%) | 0 (0.0%) |
| 16 and 17 Years | 0 (0.0%) | 0 (0.0%) |
| 18 to 24 Years | 8 (14.5%) | 25 (28.1%) |
| 25 to 34 Years | 18 (11.9%) | 58 (31.2%) |
| 35 to 44 Years | 20 (17.5%) | 18 (15.5%) |
| 45 to 54 Years | 2 (1.9%) | 10 (8.8%) |
| 55 to 64 Years | 26 (19.1%) | 27 (20.9%) |
| 65 to 74 Years | 32 (19.6%) | 5 (4.9%) |
| 75 Years and over | 0 (0.0%) | 3 (3.2%) |
| Total | 121 (11.2%) | 172 (15.8%) |
Income Above Poverty by Sex and Age in Cowarts
According to the poverty statistics in Cowarts, males aged under 5 years and females aged under 5 years are the age groups that are most secure financially, with 100.0% of males and 100.0% of females in these age groups living above the poverty line.
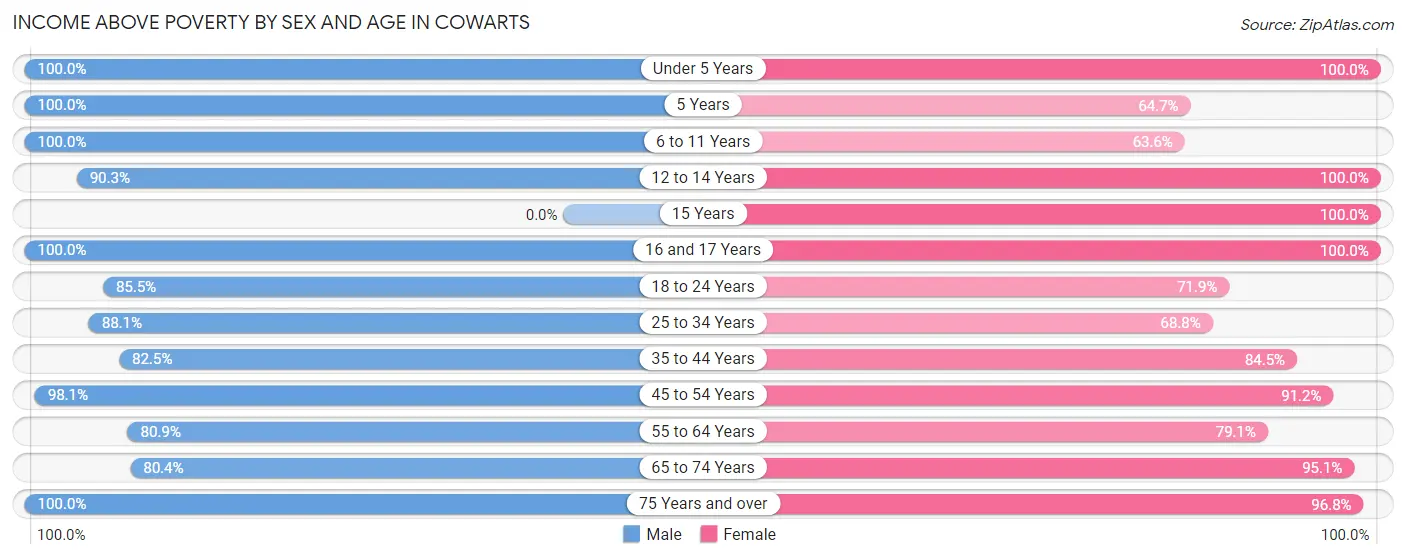
| Age Bracket | Male | Female |
| Under 5 Years | 42 (100.0%) | 149 (100.0%) |
| 5 Years | 24 (100.0%) | 11 (64.7%) |
| 6 to 11 Years | 56 (100.0%) | 35 (63.6%) |
| 12 to 14 Years | 84 (90.3%) | 20 (100.0%) |
| 15 Years | 0 (0.0%) | 6 (100.0%) |
| 16 and 17 Years | 26 (100.0%) | 13 (100.0%) |
| 18 to 24 Years | 47 (85.5%) | 64 (71.9%) |
| 25 to 34 Years | 133 (88.1%) | 128 (68.8%) |
| 35 to 44 Years | 94 (82.5%) | 98 (84.5%) |
| 45 to 54 Years | 103 (98.1%) | 104 (91.2%) |
| 55 to 64 Years | 110 (80.9%) | 102 (79.1%) |
| 65 to 74 Years | 131 (80.4%) | 97 (95.1%) |
| 75 Years and over | 110 (100.0%) | 91 (96.8%) |
| Total | 960 (88.8%) | 918 (84.2%) |
Income Below Poverty Among Married-Couple Families in Cowarts
The poverty statistics for married-couple families in Cowarts show that 5.7% or 26 of the total 454 families live below the poverty line. Families with 3 or 4 children have the highest poverty rate of 24.0%, comprising of 6 families. On the other hand, families with no children have the lowest poverty rate of 3.2%, which includes 10 families.
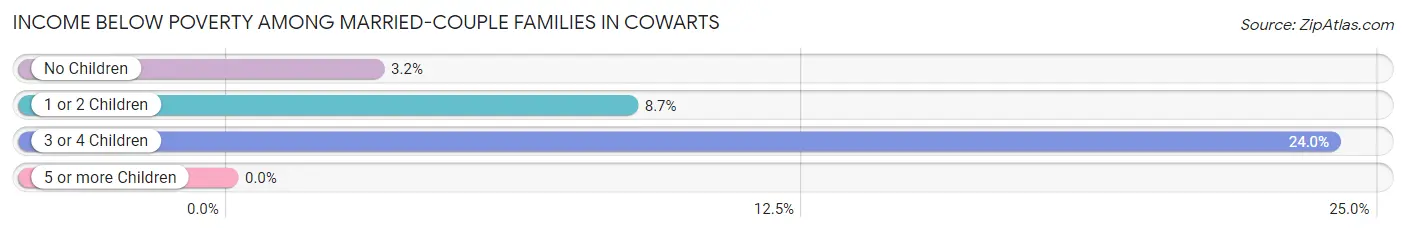
| Children | Above Poverty | Below Poverty |
| No Children | 304 (96.8%) | 10 (3.2%) |
| 1 or 2 Children | 105 (91.3%) | 10 (8.7%) |
| 3 or 4 Children | 19 (76.0%) | 6 (24.0%) |
| 5 or more Children | 0 (0.0%) | 0 (0.0%) |
| Total | 428 (94.3%) | 26 (5.7%) |
Income Below Poverty Among Single-Parent Households in Cowarts
According to the poverty data in Cowarts, 18.5% or 15 single-father households and 8.8% or 8 single-mother households are living below the poverty line. Among single-father households, those with no children have the highest poverty rate, with 13 households (50.0%) experiencing poverty. Likewise, among single-mother households, those with 3 or 4 children have the highest poverty rate, with 2 households (40.0%) falling below the poverty line.
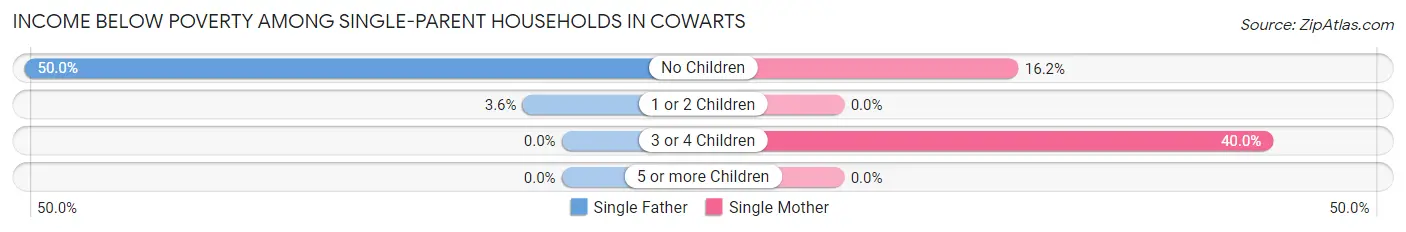
| Children | Single Father | Single Mother |
| No Children | 13 (50.0%) | 6 (16.2%) |
| 1 or 2 Children | 2 (3.6%) | 0 (0.0%) |
| 3 or 4 Children | 0 (0.0%) | 2 (40.0%) |
| 5 or more Children | 0 (0.0%) | 0 (0.0%) |
| Total | 15 (18.5%) | 8 (8.8%) |
Income Below Poverty Among Married-Couple vs Single-Parent Households in Cowarts
The poverty data for Cowarts shows that 26 of the married-couple family households (5.7%) and 23 of the single-parent households (13.4%) are living below the poverty level. Within the married-couple family households, those with 3 or 4 children have the highest poverty rate, with 6 households (24.0%) falling below the poverty line. Among the single-parent households, those with 3 or 4 children have the highest poverty rate, with 2 household (40.0%) living below poverty.
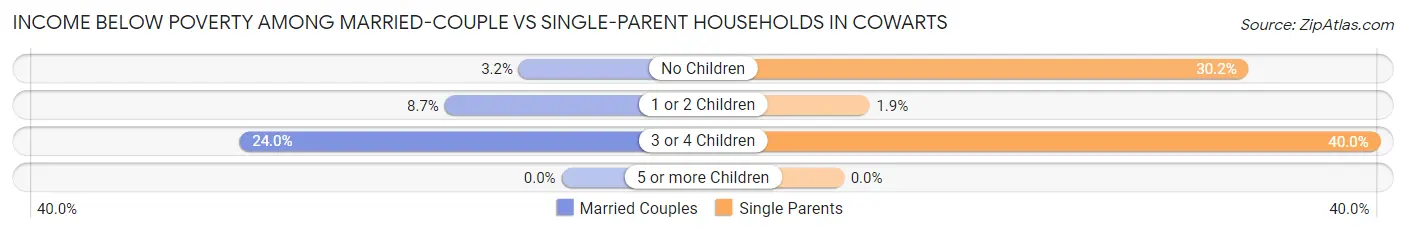
| Children | Married-Couple Families | Single-Parent Households |
| No Children | 10 (3.2%) | 19 (30.2%) |
| 1 or 2 Children | 10 (8.7%) | 2 (1.9%) |
| 3 or 4 Children | 6 (24.0%) | 2 (40.0%) |
| 5 or more Children | 0 (0.0%) | 0 (0.0%) |
| Total | 26 (5.7%) | 23 (13.4%) |
Race in Cowarts
The most populous races in Cowarts are White / Caucasian (1,749 | 80.4%), Black / African American (249 | 11.5%), and Two or more Races (136 | 6.3%).
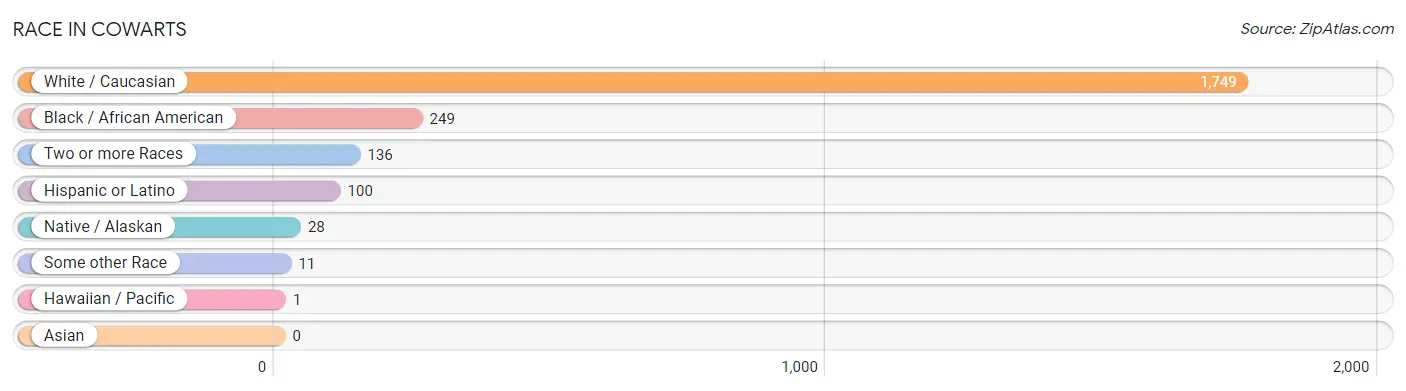
| Race | # Population | % Population |
| Asian | 0 | 0.0% |
| Black / African American | 249 | 11.5% |
| Hawaiian / Pacific | 1 | 0.1% |
| Hispanic or Latino | 100 | 4.6% |
| Native / Alaskan | 28 | 1.3% |
| White / Caucasian | 1,749 | 80.4% |
| Two or more Races | 136 | 6.3% |
| Some other Race | 11 | 0.5% |
| Total | 2,174 | 100.0% |
Ancestry in Cowarts
The most populous ancestries reported in Cowarts are American (479 | 22.0%), English (387 | 17.8%), Irish (263 | 12.1%), Mexican (94 | 4.3%), and German (75 | 3.5%), together accounting for 59.7% of all Cowarts residents.
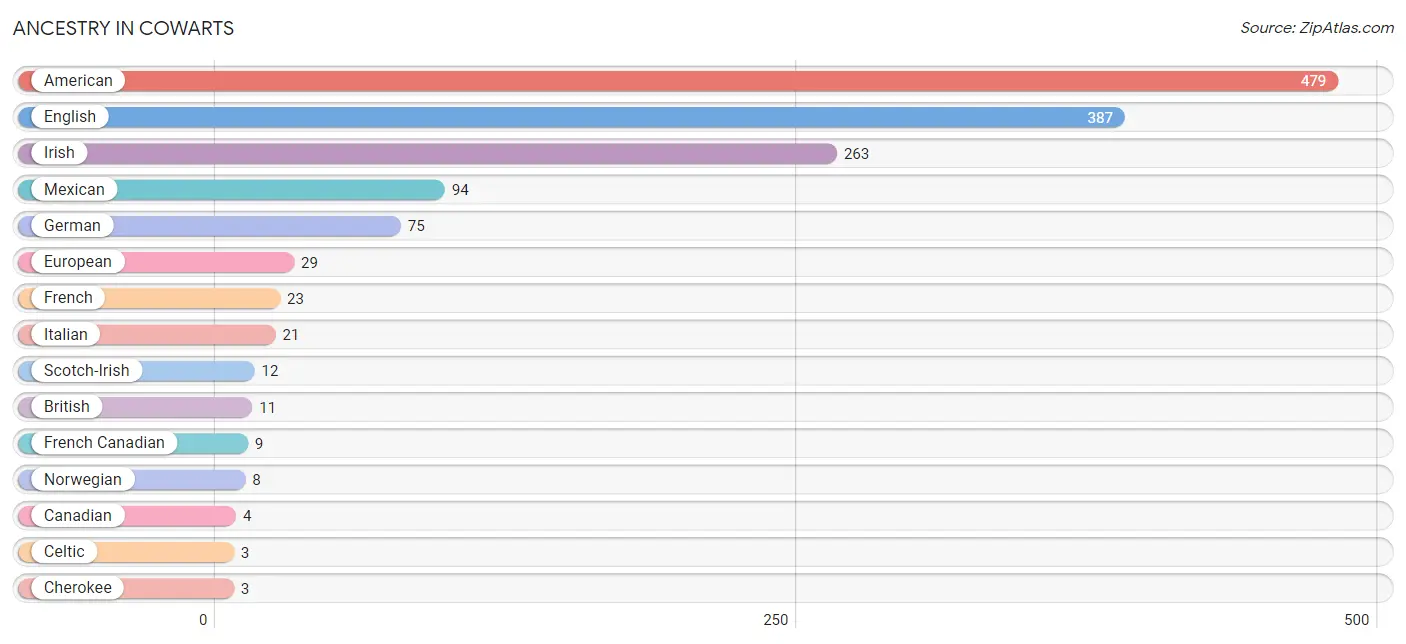
| Ancestry | # Population | % Population |
| American | 479 | 22.0% |
| Apache | 2 | 0.1% |
| British | 11 | 0.5% |
| Canadian | 4 | 0.2% |
| Celtic | 3 | 0.1% |
| Cherokee | 3 | 0.1% |
| Comanche | 2 | 0.1% |
| Creek | 3 | 0.1% |
| Dutch | 2 | 0.1% |
| English | 387 | 17.8% |
| European | 29 | 1.3% |
| French | 23 | 1.1% |
| French Canadian | 9 | 0.4% |
| German | 75 | 3.5% |
| Greek | 3 | 0.1% |
| Guamanian / Chamorro | 1 | 0.1% |
| Irish | 263 | 12.1% |
| Italian | 21 | 1.0% |
| Mexican | 94 | 4.3% |
| Norwegian | 8 | 0.4% |
| Polish | 3 | 0.1% |
| Russian | 2 | 0.1% |
| Scotch-Irish | 12 | 0.5% | View All 23 Rows |
Immigrants in Cowarts
The most numerous immigrant groups reported in Cowarts came from Latin America (24 | 1.1%), Central America (20 | 0.9%), Mexico (20 | 0.9%), Argentina (4 | 0.2%), and South America (4 | 0.2%), together accounting for 3.3% of all Cowarts residents.
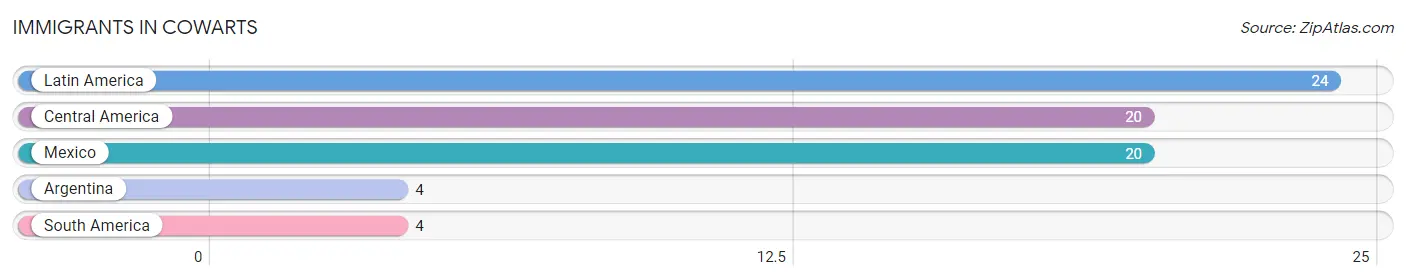
| Immigration Origin | # Population | % Population |
| Argentina | 4 | 0.2% |
| Central America | 20 | 0.9% |
| Latin America | 24 | 1.1% |
| Mexico | 20 | 0.9% |
| South America | 4 | 0.2% | View All 5 Rows |
Sex and Age in Cowarts
Sex and Age in Cowarts
The most populous age groups in Cowarts are 10 to 14 Years (119 | 11.0%) for men and Under 5 Years (149 | 13.7%) for women.
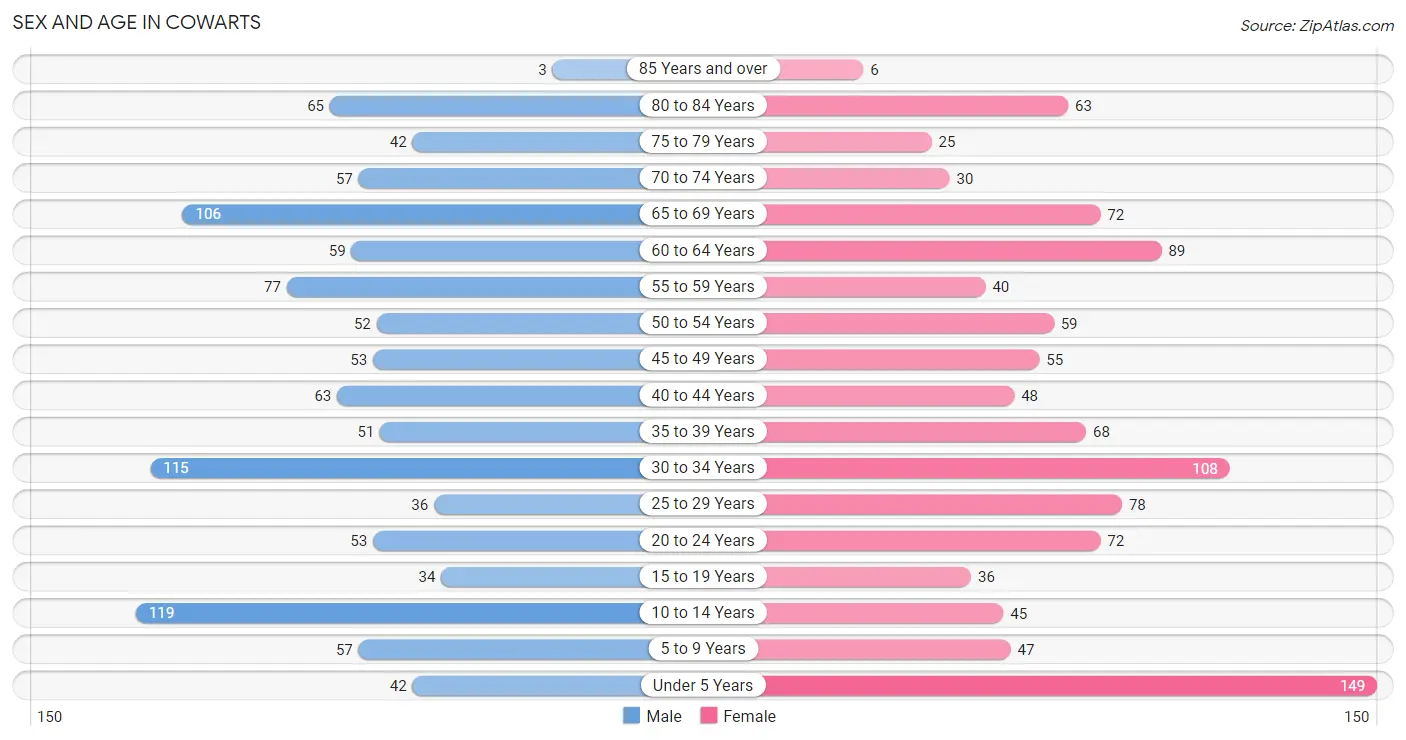
| Age Bracket | Male | Female |
| Under 5 Years | 42 (3.9%) | 149 (13.7%) |
| 5 to 9 Years | 57 (5.3%) | 47 (4.3%) |
| 10 to 14 Years | 119 (11.0%) | 45 (4.1%) |
| 15 to 19 Years | 34 (3.1%) | 36 (3.3%) |
| 20 to 24 Years | 53 (4.9%) | 72 (6.6%) |
| 25 to 29 Years | 36 (3.3%) | 78 (7.2%) |
| 30 to 34 Years | 115 (10.6%) | 108 (9.9%) |
| 35 to 39 Years | 51 (4.7%) | 68 (6.2%) |
| 40 to 44 Years | 63 (5.8%) | 48 (4.4%) |
| 45 to 49 Years | 53 (4.9%) | 55 (5.1%) |
| 50 to 54 Years | 52 (4.8%) | 59 (5.4%) |
| 55 to 59 Years | 77 (7.1%) | 40 (3.7%) |
| 60 to 64 Years | 59 (5.4%) | 89 (8.2%) |
| 65 to 69 Years | 106 (9.8%) | 72 (6.6%) |
| 70 to 74 Years | 57 (5.3%) | 30 (2.8%) |
| 75 to 79 Years | 42 (3.9%) | 25 (2.3%) |
| 80 to 84 Years | 65 (6.0%) | 63 (5.8%) |
| 85 Years and over | 3 (0.3%) | 6 (0.5%) |
| Total | 1,084 (100.0%) | 1,090 (100.0%) |
Families and Households in Cowarts
Median Family Size in Cowarts
The median family size in Cowarts is 3.00 persons per family, with single male/father families (81 | 12.9%) accounting for the largest median family size of 3.38 persons per family. On the other hand, married-couple families (454 | 72.5%) represent the smallest median family size with 2.87 persons per family.
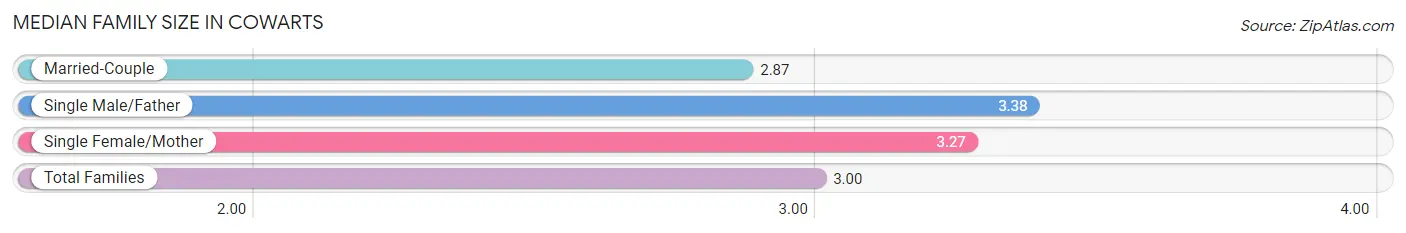
| Family Type | # Families | Family Size |
| Married-Couple | 454 (72.5%) | 2.87 |
| Single Male/Father | 81 (12.9%) | 3.38 |
| Single Female/Mother | 91 (14.5%) | 3.27 |
| Total Families | 626 (100.0%) | 3.00 |
Median Household Size in Cowarts
The median household size in Cowarts is 2.71 persons per household, with single male/father households (81 | 10.1%) accounting for the largest median household size of 4 persons per household. non-family households (175 | 21.8%) represent the smallest median household size with 1.26 persons per household.
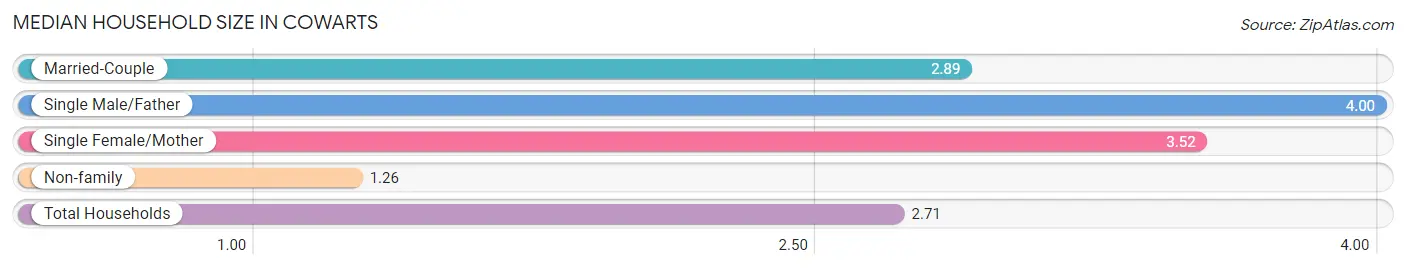
| Household Type | # Households | Household Size |
| Married-Couple | 454 (56.7%) | 2.89 |
| Single Male/Father | 81 (10.1%) | 4.00 |
| Single Female/Mother | 91 (11.4%) | 3.52 |
| Non-family | 175 (21.8%) | 1.26 |
| Total Households | 801 (100.0%) | 2.71 |
Household Size by Marriage Status in Cowarts
Out of a total of 801 households in Cowarts, 626 (78.1%) are family households, while 175 (21.8%) are nonfamily households. The most numerous type of family households are 2-person households, comprising 322, and the most common type of nonfamily households are 1-person households, comprising 151.
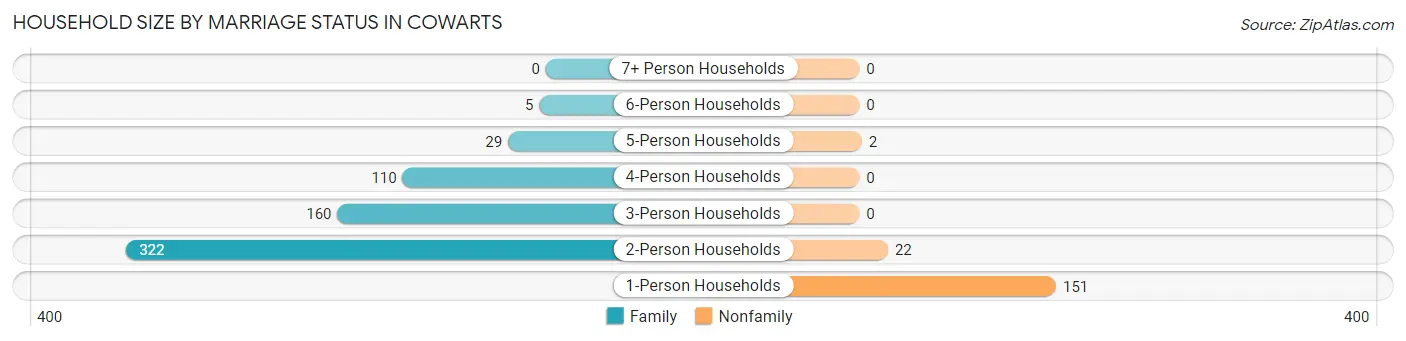
| Household Size | Family Households | Nonfamily Households |
| 1-Person Households | - | 151 (18.9%) |
| 2-Person Households | 322 (40.2%) | 22 (2.8%) |
| 3-Person Households | 160 (20.0%) | 0 (0.0%) |
| 4-Person Households | 110 (13.7%) | 0 (0.0%) |
| 5-Person Households | 29 (3.6%) | 2 (0.3%) |
| 6-Person Households | 5 (0.6%) | 0 (0.0%) |
| 7+ Person Households | 0 (0.0%) | 0 (0.0%) |
| Total | 626 (78.1%) | 175 (21.8%) |
Female Fertility in Cowarts
Fertility by Age in Cowarts
Average fertility rate in Cowarts is 43.0 births per 1,000 women. Women in the age bracket of 20 to 34 years have the highest fertility rate with 78.0 births per 1,000 women. Women in the age bracket of 20 to 34 years acount for 100.0% of all women with births.
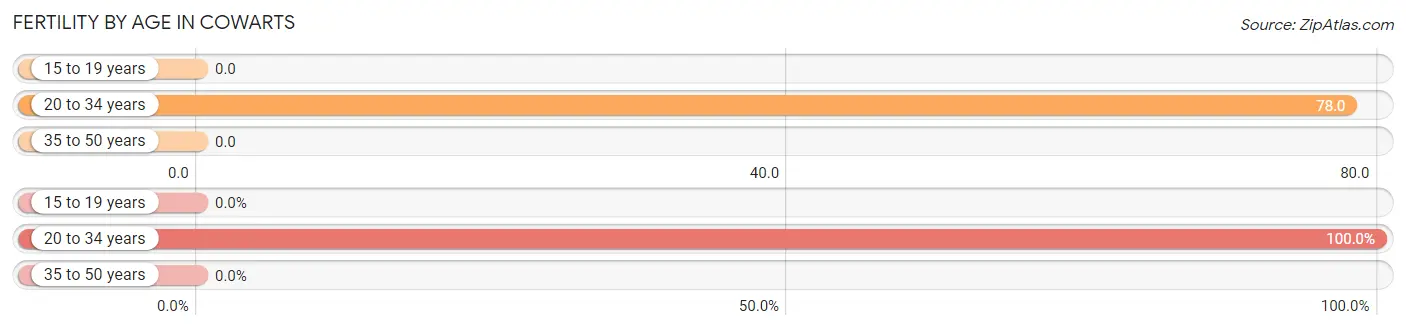
| Age Bracket | Women with Births | Births / 1,000 Women |
| 15 to 19 years | 0 (0.0%) | 0.0 |
| 20 to 34 years | 20 (100.0%) | 78.0 |
| 35 to 50 years | 0 (0.0%) | 0.0 |
| Total | 20 (100.0%) | 43.0 |
Fertility by Age by Marriage Status in Cowarts
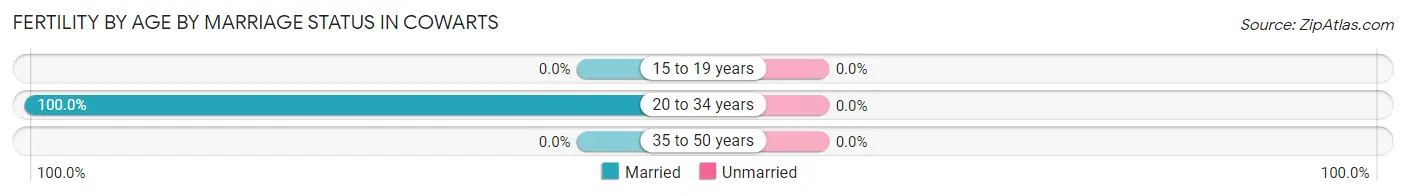
| Age Bracket | Married | Unmarried |
| 15 to 19 years | 0 (0.0%) | 0 (0.0%) |
| 20 to 34 years | 20 (100.0%) | 0 (0.0%) |
| 35 to 50 years | 0 (0.0%) | 0 (0.0%) |
| Total | 20 (100.0%) | 0 (0.0%) |
Fertility by Education in Cowarts
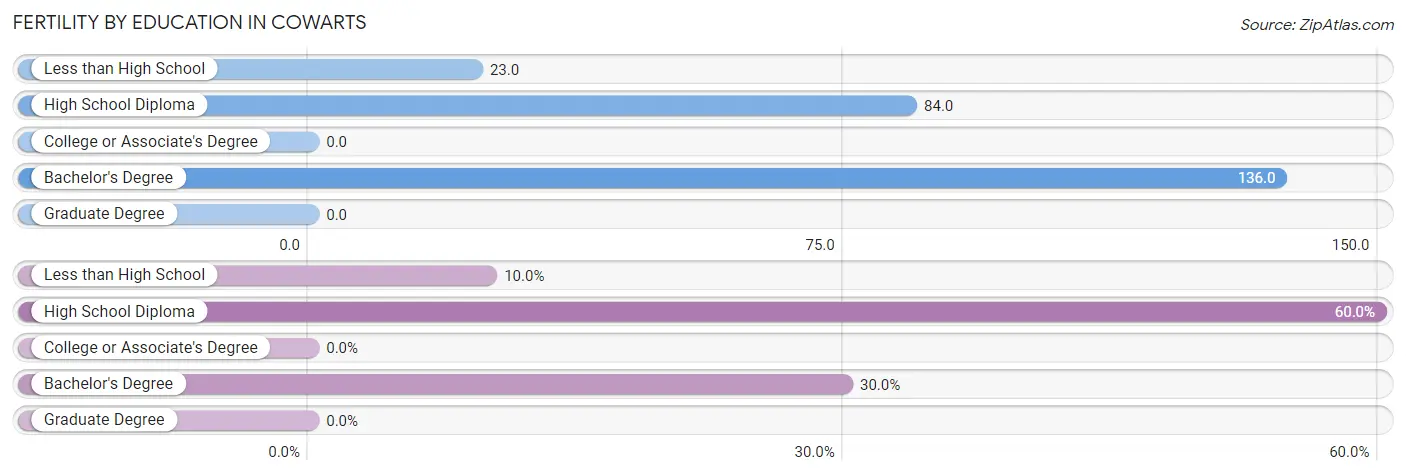
| Educational Attainment | Women with Births | Births / 1,000 Women |
| Less than High School | 2 (10.0%) | 23.0 |
| High School Diploma | 12 (60.0%) | 84.0 |
| College or Associate's Degree | 0 (0.0%) | 0.0 |
| Bachelor's Degree | 6 (30.0%) | 136.0 |
| Graduate Degree | 0 (0.0%) | 0.0 |
| Total | 20 (100.0%) | 43.0 |
Fertility by Education by Marriage Status in Cowarts
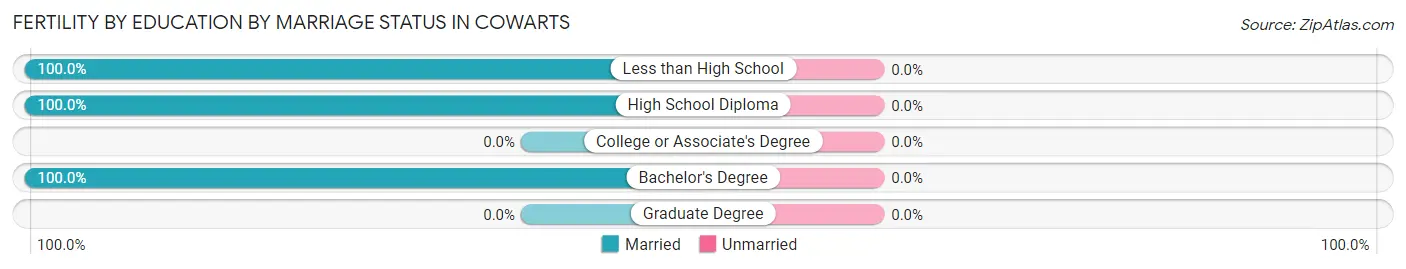
| Educational Attainment | Married | Unmarried |
| Less than High School | 2 (100.0%) | 0 (0.0%) |
| High School Diploma | 12 (100.0%) | 0 (0.0%) |
| College or Associate's Degree | 0 (0.0%) | 0 (0.0%) |
| Bachelor's Degree | 6 (100.0%) | 0 (0.0%) |
| Graduate Degree | 0 (0.0%) | 0 (0.0%) |
| Total | 20 (100.0%) | 0 (0.0%) |
Employment Characteristics in Cowarts
Employment by Class of Employer in Cowarts
Among the 827 employed individuals in Cowarts, private company employees (587 | 71.0%), self-employed (incorporated) (69 | 8.3%), and self-employed (not incorporated) (51 | 6.2%) make up the most common classes of employment.
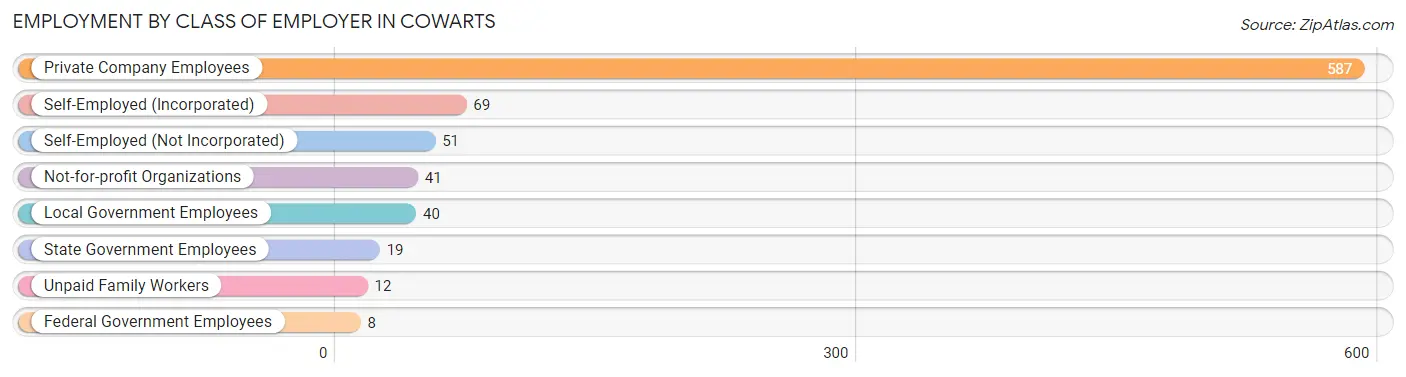
| Employer Class | # Employees | % Employees |
| Private Company Employees | 587 | 71.0% |
| Self-Employed (Incorporated) | 69 | 8.3% |
| Self-Employed (Not Incorporated) | 51 | 6.2% |
| Not-for-profit Organizations | 41 | 5.0% |
| Local Government Employees | 40 | 4.8% |
| State Government Employees | 19 | 2.3% |
| Federal Government Employees | 8 | 1.0% |
| Unpaid Family Workers | 12 | 1.5% |
| Total | 827 | 100.0% |
Employment Status by Age in Cowarts
According to the labor force statistics for Cowarts, out of the total population over 16 years of age (1,703), 51.7% or 880 individuals are in the labor force, with 3.1% or 27 of them unemployed. The age group with the highest labor force participation rate is 25 to 29 years, with 87.7% or 100 individuals in the labor force. Within the labor force, the 35 to 44 years age range has the highest percentage of unemployed individuals, with 8.8% or 14 of them being unemployed.
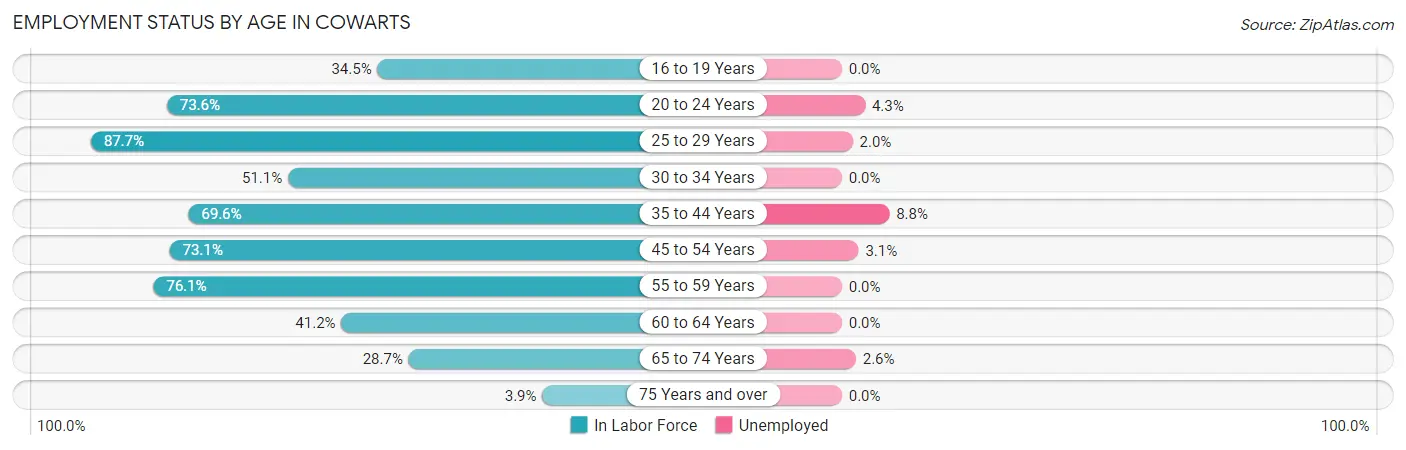
| Age Bracket | In Labor Force | Unemployed |
| 16 to 19 Years | 20 (34.5%) | 0 (0.0%) |
| 20 to 24 Years | 92 (73.6%) | 4 (4.3%) |
| 25 to 29 Years | 100 (87.7%) | 2 (2.0%) |
| 30 to 34 Years | 114 (51.1%) | 0 (0.0%) |
| 35 to 44 Years | 160 (69.6%) | 14 (8.8%) |
| 45 to 54 Years | 160 (73.1%) | 5 (3.1%) |
| 55 to 59 Years | 89 (76.1%) | 0 (0.0%) |
| 60 to 64 Years | 61 (41.2%) | 0 (0.0%) |
| 65 to 74 Years | 76 (28.7%) | 2 (2.6%) |
| 75 Years and over | 8 (3.9%) | 0 (0.0%) |
| Total | 880 (51.7%) | 27 (3.1%) |
Employment Status by Educational Attainment in Cowarts
According to labor force statistics for Cowarts, 65.1% of individuals (684) out of the total population between 25 and 64 years of age (1,051) are in the labor force, with 3.1% or 21 of them being unemployed. The group with the highest labor force participation rate are those with the educational attainment of bachelor's degree or higher, with 95.1% or 117 individuals in the labor force. Within the labor force, individuals with less than high school education have the highest percentage of unemployment, with 10.1% or 9 of them being unemployed.
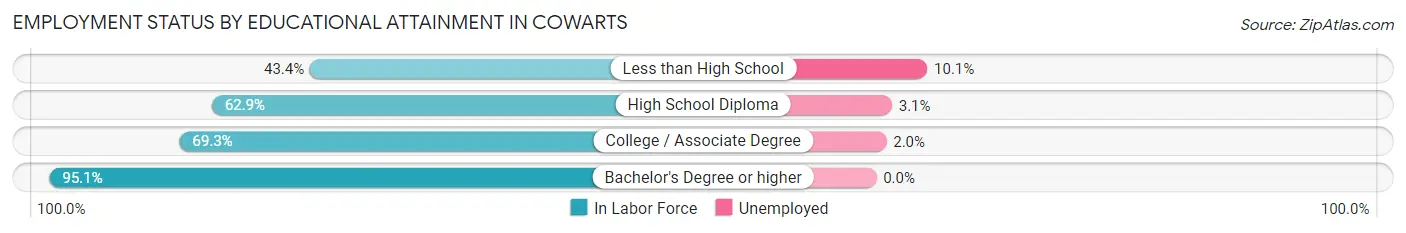
| Educational Attainment | In Labor Force | Unemployed |
| Less than High School | 89 (43.4%) | 21 (10.1%) |
| High School Diploma | 227 (62.9%) | 11 (3.1%) |
| College / Associate Degree | 251 (69.3%) | 7 (2.0%) |
| Bachelor's Degree or higher | 117 (95.1%) | 0 (0.0%) |
| Total | 684 (65.1%) | 33 (3.1%) |
Employment Occupations by Sex in Cowarts
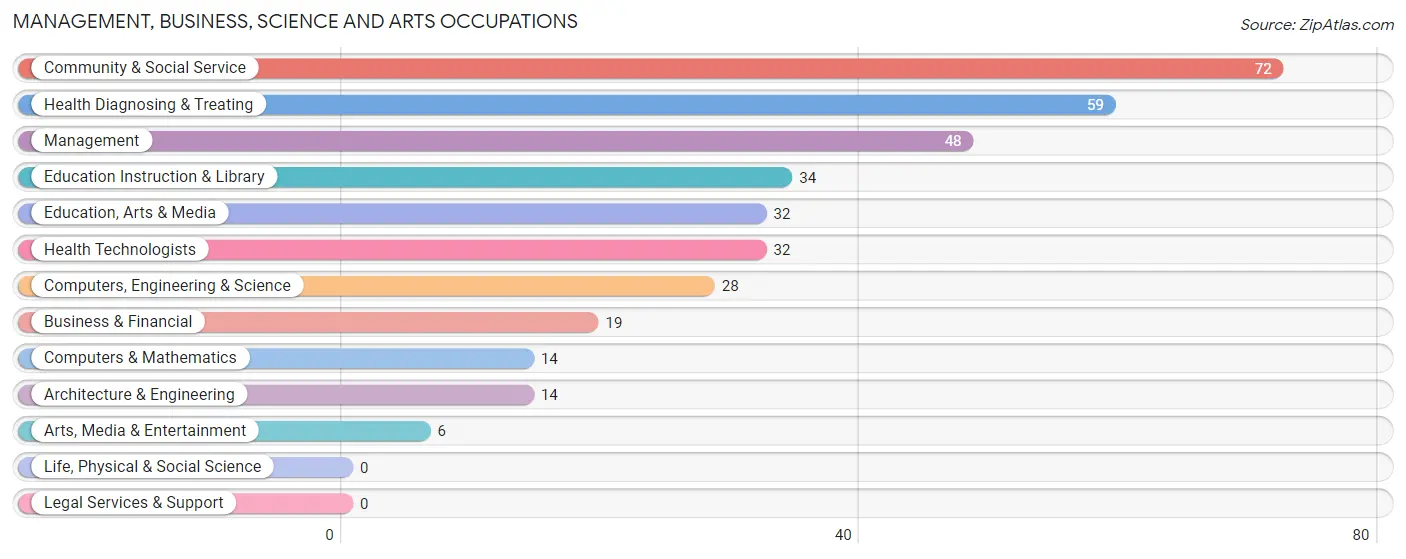
Management, Business, Science and Arts Occupations
The most common Management, Business, Science and Arts occupations in Cowarts are Community & Social Service (72 | 8.4%), Health Diagnosing & Treating (59 | 6.9%), Management (48 | 5.6%), Education Instruction & Library (34 | 4.0%), and Education, Arts & Media (32 | 3.7%).
Management, Business, Science and Arts Occupations by Sex
Within the Management, Business, Science and Arts occupations in Cowarts, the most male-oriented occupations are Computers & Mathematics (100.0%), Arts, Media & Entertainment (100.0%), and Computers, Engineering & Science (92.9%), while the most female-oriented occupations are Business & Financial (100.0%), Health Technologists (93.8%), and Health Diagnosing & Treating (88.1%).
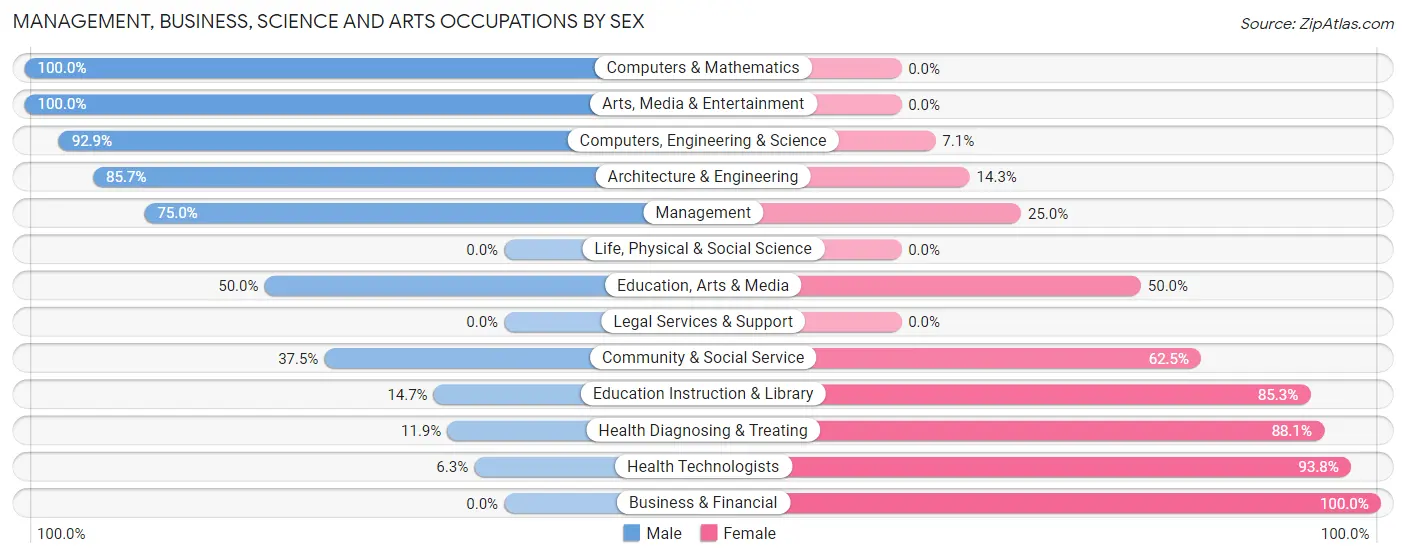
| Occupation | Male | Female |
| Management | 36 (75.0%) | 12 (25.0%) |
| Business & Financial | 0 (0.0%) | 19 (100.0%) |
| Computers, Engineering & Science | 26 (92.9%) | 2 (7.1%) |
| Computers & Mathematics | 14 (100.0%) | 0 (0.0%) |
| Architecture & Engineering | 12 (85.7%) | 2 (14.3%) |
| Life, Physical & Social Science | 0 (0.0%) | 0 (0.0%) |
| Community & Social Service | 27 (37.5%) | 45 (62.5%) |
| Education, Arts & Media | 16 (50.0%) | 16 (50.0%) |
| Legal Services & Support | 0 (0.0%) | 0 (0.0%) |
| Education Instruction & Library | 5 (14.7%) | 29 (85.3%) |
| Arts, Media & Entertainment | 6 (100.0%) | 0 (0.0%) |
| Health Diagnosing & Treating | 7 (11.9%) | 52 (88.1%) |
| Health Technologists | 2 (6.2%) | 30 (93.8%) |
| Total (Category) | 96 (42.5%) | 130 (57.5%) |
| Total (Overall) | 490 (57.4%) | 363 (42.6%) |
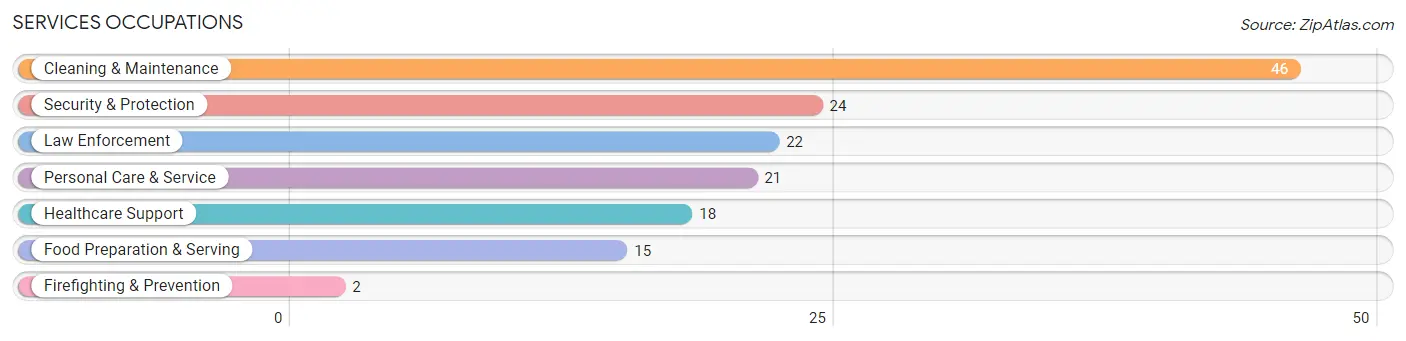
Services Occupations
The most common Services occupations in Cowarts are Cleaning & Maintenance (46 | 5.4%), Security & Protection (24 | 2.8%), Law Enforcement (22 | 2.6%), Personal Care & Service (21 | 2.5%), and Healthcare Support (18 | 2.1%).
Services Occupations by Sex
Within the Services occupations in Cowarts, the most male-oriented occupations are Security & Protection (100.0%), Firefighting & Prevention (100.0%), and Law Enforcement (100.0%), while the most female-oriented occupations are Healthcare Support (100.0%), Personal Care & Service (95.2%), and Food Preparation & Serving (53.3%).
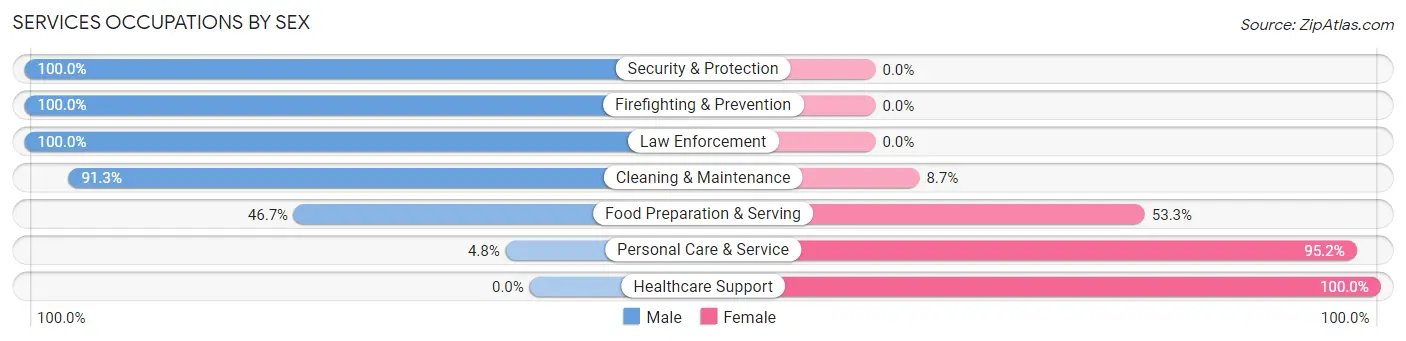
| Occupation | Male | Female |
| Healthcare Support | 0 (0.0%) | 18 (100.0%) |
| Security & Protection | 24 (100.0%) | 0 (0.0%) |
| Firefighting & Prevention | 2 (100.0%) | 0 (0.0%) |
| Law Enforcement | 22 (100.0%) | 0 (0.0%) |
| Food Preparation & Serving | 7 (46.7%) | 8 (53.3%) |
| Cleaning & Maintenance | 42 (91.3%) | 4 (8.7%) |
| Personal Care & Service | 1 (4.8%) | 20 (95.2%) |
| Total (Category) | 74 (59.7%) | 50 (40.3%) |
| Total (Overall) | 490 (57.4%) | 363 (42.6%) |
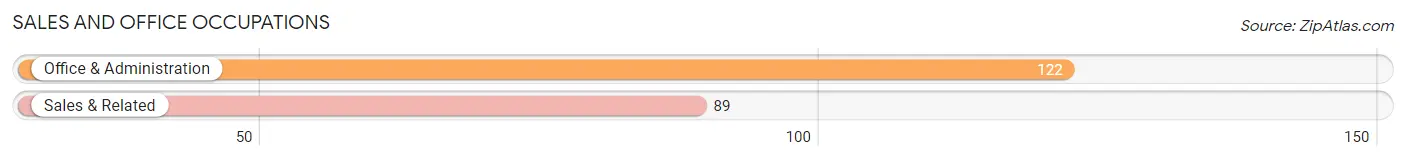
Sales and Office Occupations
The most common Sales and Office occupations in Cowarts are Office & Administration (122 | 14.3%), and Sales & Related (89 | 10.4%).
Sales and Office Occupations by Sex
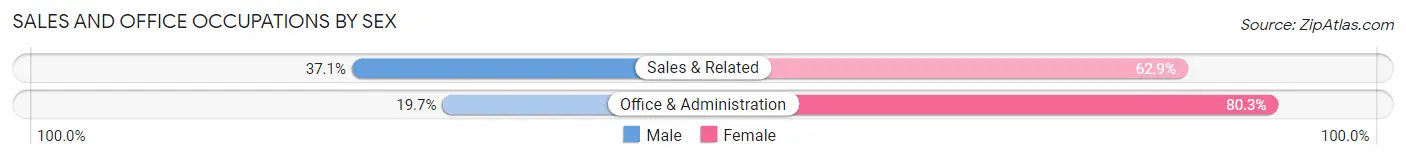
| Occupation | Male | Female |
| Sales & Related | 33 (37.1%) | 56 (62.9%) |
| Office & Administration | 24 (19.7%) | 98 (80.3%) |
| Total (Category) | 57 (27.0%) | 154 (73.0%) |
| Total (Overall) | 490 (57.4%) | 363 (42.6%) |
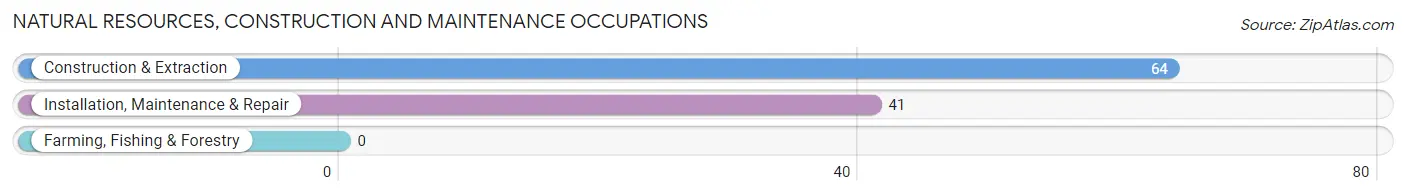
Natural Resources, Construction and Maintenance Occupations
The most common Natural Resources, Construction and Maintenance occupations in Cowarts are Construction & Extraction (64 | 7.5%), and Installation, Maintenance & Repair (41 | 4.8%).
Natural Resources, Construction and Maintenance Occupations by Sex
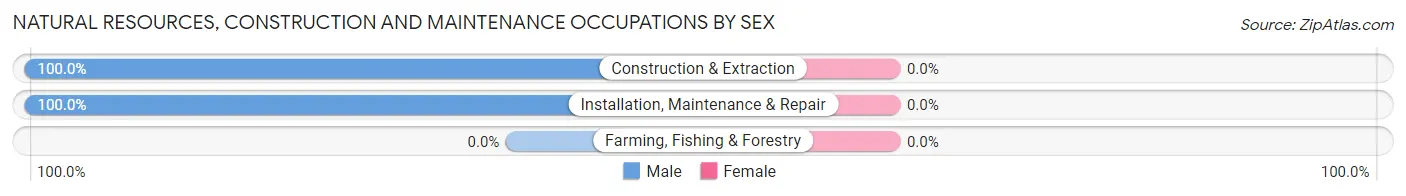
| Occupation | Male | Female |
| Farming, Fishing & Forestry | 0 (0.0%) | 0 (0.0%) |
| Construction & Extraction | 64 (100.0%) | 0 (0.0%) |
| Installation, Maintenance & Repair | 41 (100.0%) | 0 (0.0%) |
| Total (Category) | 105 (100.0%) | 0 (0.0%) |
| Total (Overall) | 490 (57.4%) | 363 (42.6%) |
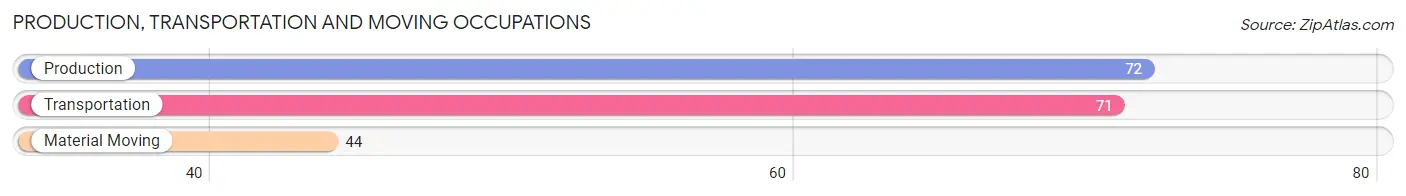
Production, Transportation and Moving Occupations
The most common Production, Transportation and Moving occupations in Cowarts are Production (72 | 8.4%), Transportation (71 | 8.3%), and Material Moving (44 | 5.2%).
Production, Transportation and Moving Occupations by Sex
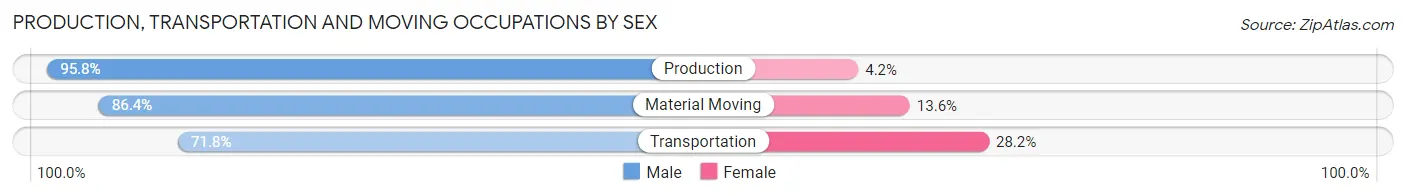
| Occupation | Male | Female |
| Production | 69 (95.8%) | 3 (4.2%) |
| Transportation | 51 (71.8%) | 20 (28.2%) |
| Material Moving | 38 (86.4%) | 6 (13.6%) |
| Total (Category) | 158 (84.5%) | 29 (15.5%) |
| Total (Overall) | 490 (57.4%) | 363 (42.6%) |
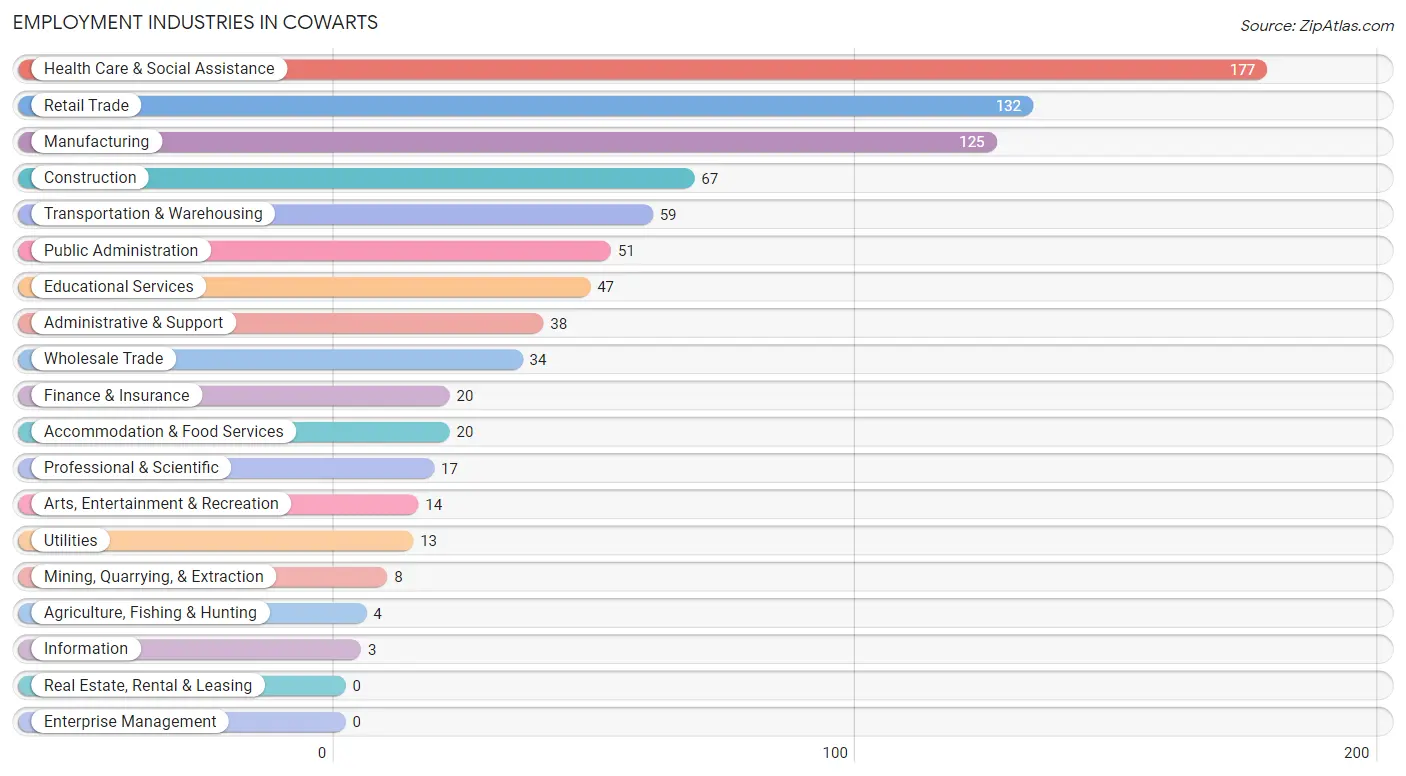
Employment Industries by Sex in Cowarts
Employment Industries in Cowarts
The major employment industries in Cowarts include Health Care & Social Assistance (177 | 20.7%), Retail Trade (132 | 15.5%), Manufacturing (125 | 14.6%), Construction (67 | 7.9%), and Transportation & Warehousing (59 | 6.9%).
Employment Industries by Sex in Cowarts
The Cowarts industries that see more men than women are Agriculture, Fishing & Hunting (100.0%), Mining, Quarrying, & Extraction (100.0%), and Transportation & Warehousing (100.0%), whereas the industries that tend to have a higher number of women are Information (100.0%), Finance & Insurance (100.0%), and Health Care & Social Assistance (84.8%).
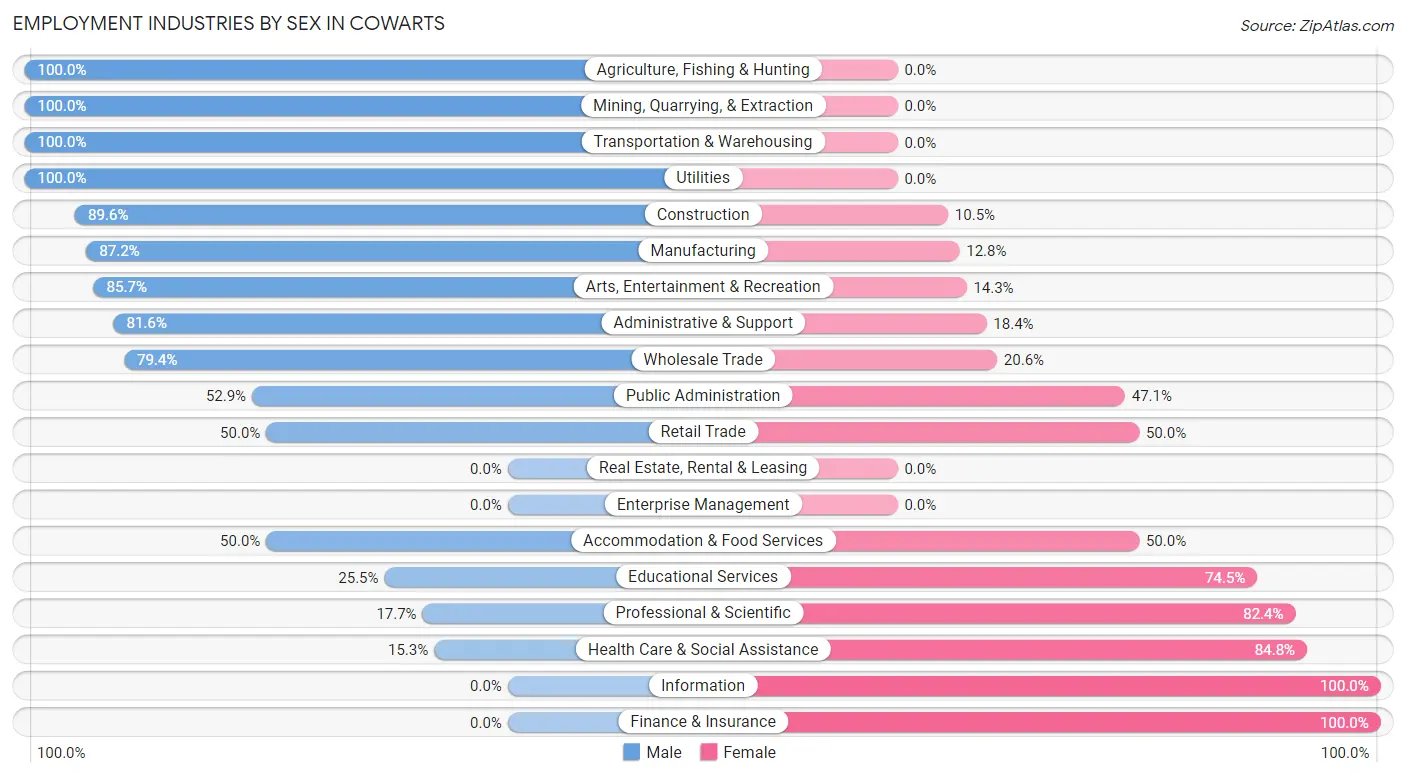
| Industry | Male | Female |
| Agriculture, Fishing & Hunting | 4 (100.0%) | 0 (0.0%) |
| Mining, Quarrying, & Extraction | 8 (100.0%) | 0 (0.0%) |
| Construction | 60 (89.5%) | 7 (10.4%) |
| Manufacturing | 109 (87.2%) | 16 (12.8%) |
| Wholesale Trade | 27 (79.4%) | 7 (20.6%) |
| Retail Trade | 66 (50.0%) | 66 (50.0%) |
| Transportation & Warehousing | 59 (100.0%) | 0 (0.0%) |
| Utilities | 13 (100.0%) | 0 (0.0%) |
| Information | 0 (0.0%) | 3 (100.0%) |
| Finance & Insurance | 0 (0.0%) | 20 (100.0%) |
| Real Estate, Rental & Leasing | 0 (0.0%) | 0 (0.0%) |
| Professional & Scientific | 3 (17.6%) | 14 (82.4%) |
| Enterprise Management | 0 (0.0%) | 0 (0.0%) |
| Administrative & Support | 31 (81.6%) | 7 (18.4%) |
| Educational Services | 12 (25.5%) | 35 (74.5%) |
| Health Care & Social Assistance | 27 (15.2%) | 150 (84.8%) |
| Arts, Entertainment & Recreation | 12 (85.7%) | 2 (14.3%) |
| Accommodation & Food Services | 10 (50.0%) | 10 (50.0%) |
| Public Administration | 27 (52.9%) | 24 (47.1%) |
| Total | 490 (57.4%) | 363 (42.6%) |
Education in Cowarts
School Enrollment in Cowarts
The most common levels of schooling among the 351 students in Cowarts are middle school (139 | 39.6%), elementary school (66 | 18.8%), and high school (62 | 17.7%).
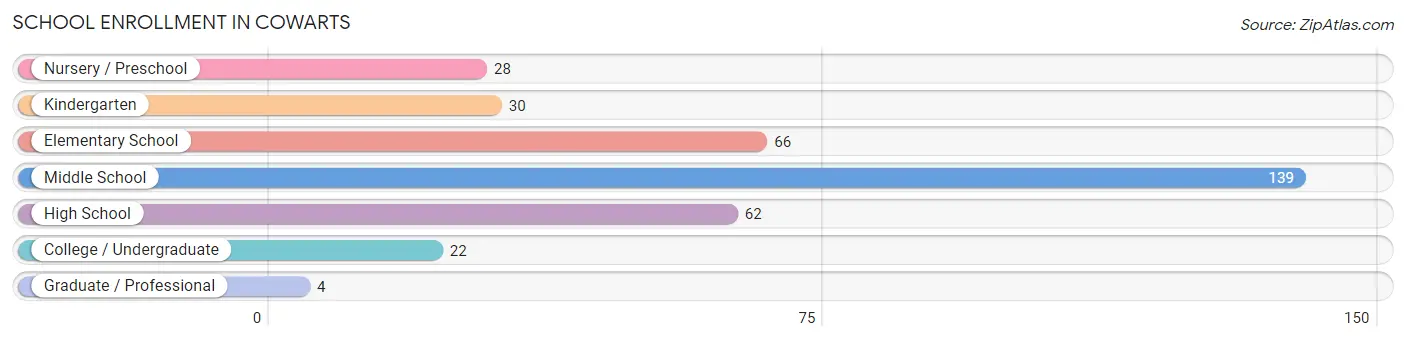
| School Level | # Students | % Students |
| Nursery / Preschool | 28 | 8.0% |
| Kindergarten | 30 | 8.6% |
| Elementary School | 66 | 18.8% |
| Middle School | 139 | 39.6% |
| High School | 62 | 17.7% |
| College / Undergraduate | 22 | 6.3% |
| Graduate / Professional | 4 | 1.1% |
| Total | 351 | 100.0% |
School Enrollment by Age by Funding Source in Cowarts
Out of a total of 351 students who are enrolled in schools in Cowarts, 89 (25.4%) attend a private institution, while the remaining 262 (74.6%) are enrolled in public schools. The age group of 35 years and over has the highest likelihood of being enrolled in private schools, with 5 (100.0% in the age bracket) enrolled. Conversely, the age group of 18 to 19 year olds has the lowest likelihood of being enrolled in a private school, with 14 (100.0% in the age bracket) attending a public institution.
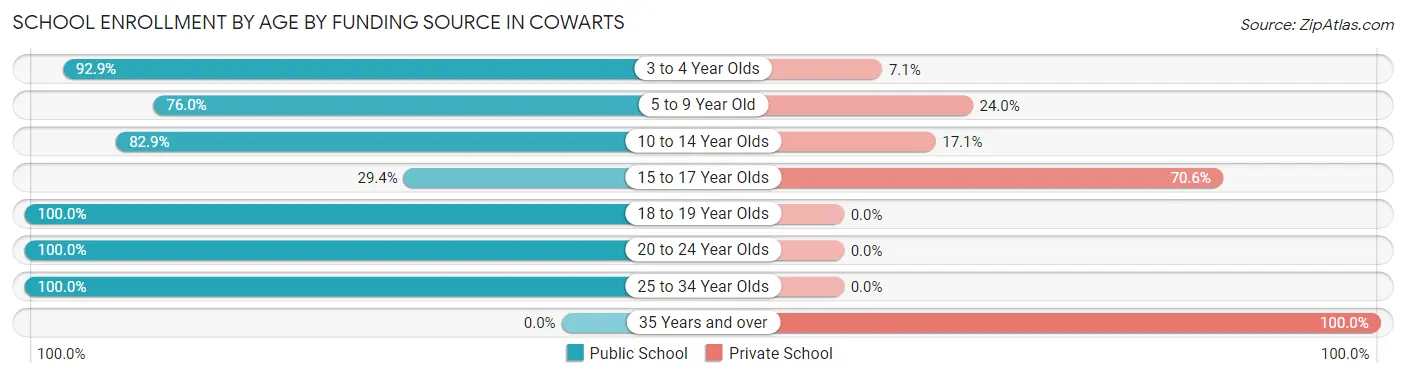
| Age Bracket | Public School | Private School |
| 3 to 4 Year Olds | 26 (92.9%) | 2 (7.1%) |
| 5 to 9 Year Old | 57 (76.0%) | 18 (24.0%) |
| 10 to 14 Year Olds | 136 (82.9%) | 28 (17.1%) |
| 15 to 17 Year Olds | 15 (29.4%) | 36 (70.6%) |
| 18 to 19 Year Olds | 14 (100.0%) | 0 (0.0%) |
| 20 to 24 Year Olds | 12 (100.0%) | 0 (0.0%) |
| 25 to 34 Year Olds | 2 (100.0%) | 0 (0.0%) |
| 35 Years and over | 0 (0.0%) | 5 (100.0%) |
| Total | 262 (74.6%) | 89 (25.4%) |
Educational Attainment by Field of Study in Cowarts
Education (42 | 21.6%), business (33 | 17.0%), science & technology (28 | 14.4%), arts & humanities (24 | 12.4%), and psychology (19 | 9.8%) are the most common fields of study among 194 individuals in Cowarts who have obtained a bachelor's degree or higher.
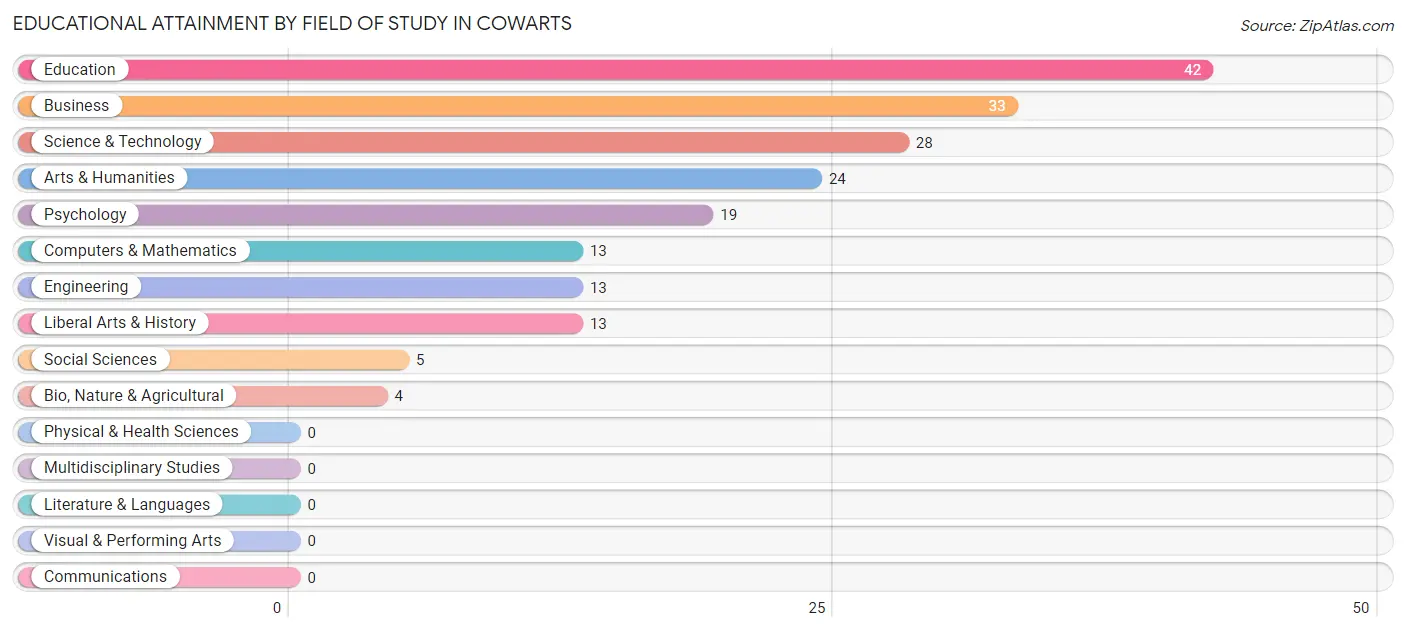
| Field of Study | # Graduates | % Graduates |
| Computers & Mathematics | 13 | 6.7% |
| Bio, Nature & Agricultural | 4 | 2.1% |
| Physical & Health Sciences | 0 | 0.0% |
| Psychology | 19 | 9.8% |
| Social Sciences | 5 | 2.6% |
| Engineering | 13 | 6.7% |
| Multidisciplinary Studies | 0 | 0.0% |
| Science & Technology | 28 | 14.4% |
| Business | 33 | 17.0% |
| Education | 42 | 21.6% |
| Literature & Languages | 0 | 0.0% |
| Liberal Arts & History | 13 | 6.7% |
| Visual & Performing Arts | 0 | 0.0% |
| Communications | 0 | 0.0% |
| Arts & Humanities | 24 | 12.4% |
| Total | 194 | 100.0% |
Transportation & Commute in Cowarts
Vehicle Availability by Sex in Cowarts
The most prevalent vehicle ownership categories in Cowarts are males with 2 vehicles (199, accounting for 41.2%) and females with 2 vehicles (124, making up 57.9%).
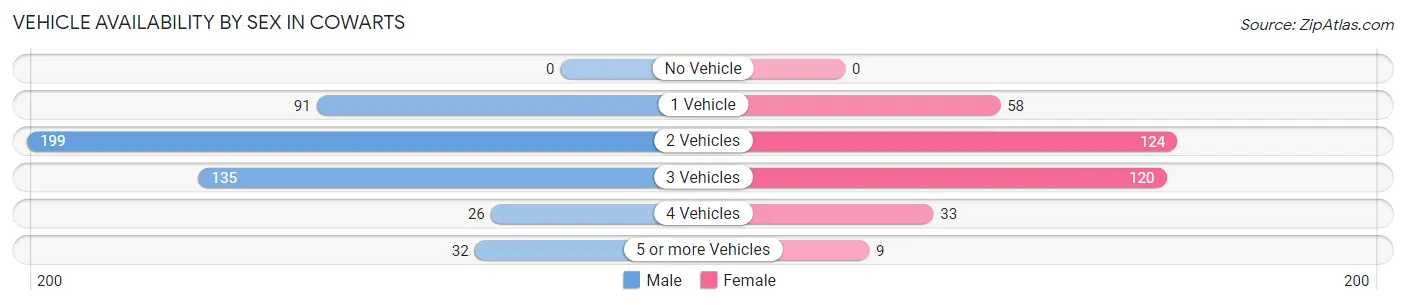
| Vehicles Available | Male | Female |
| No Vehicle | 0 (0.0%) | 0 (0.0%) |
| 1 Vehicle | 91 (18.8%) | 58 (16.9%) |
| 2 Vehicles | 199 (41.2%) | 124 (36.0%) |
| 3 Vehicles | 135 (28.0%) | 120 (34.9%) |
| 4 Vehicles | 26 (5.4%) | 33 (9.6%) |
| 5 or more Vehicles | 32 (6.6%) | 9 (2.6%) |
| Total | 483 (100.0%) | 344 (100.0%) |
Commute Time in Cowarts
The most frequently occuring commute durations in Cowarts are 15 to 19 minutes (194 commuters, 23.6%), 20 to 24 minutes (181 commuters, 22.0%), and 10 to 14 minutes (113 commuters, 13.8%).
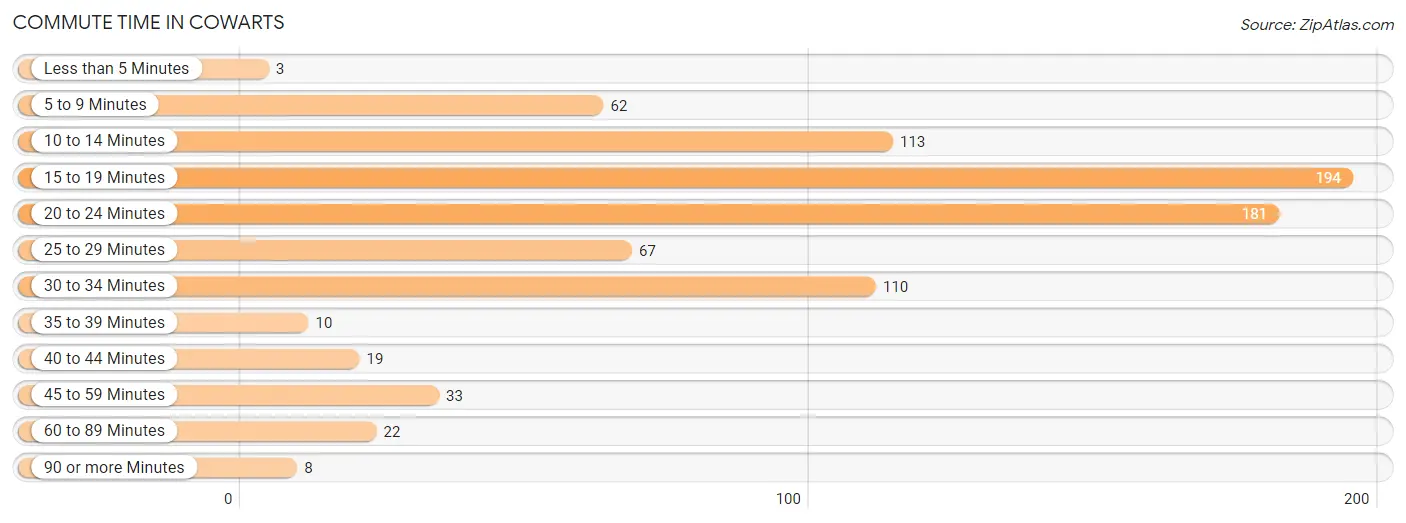
| Commute Time | # Commuters | % Commuters |
| Less than 5 Minutes | 3 | 0.4% |
| 5 to 9 Minutes | 62 | 7.5% |
| 10 to 14 Minutes | 113 | 13.8% |
| 15 to 19 Minutes | 194 | 23.6% |
| 20 to 24 Minutes | 181 | 22.0% |
| 25 to 29 Minutes | 67 | 8.2% |
| 30 to 34 Minutes | 110 | 13.4% |
| 35 to 39 Minutes | 10 | 1.2% |
| 40 to 44 Minutes | 19 | 2.3% |
| 45 to 59 Minutes | 33 | 4.0% |
| 60 to 89 Minutes | 22 | 2.7% |
| 90 or more Minutes | 8 | 1.0% |
Commute Time by Sex in Cowarts
The most common commute times in Cowarts are 20 to 24 minutes (115 commuters, 23.8%) for males and 15 to 19 minutes (106 commuters, 31.3%) for females.
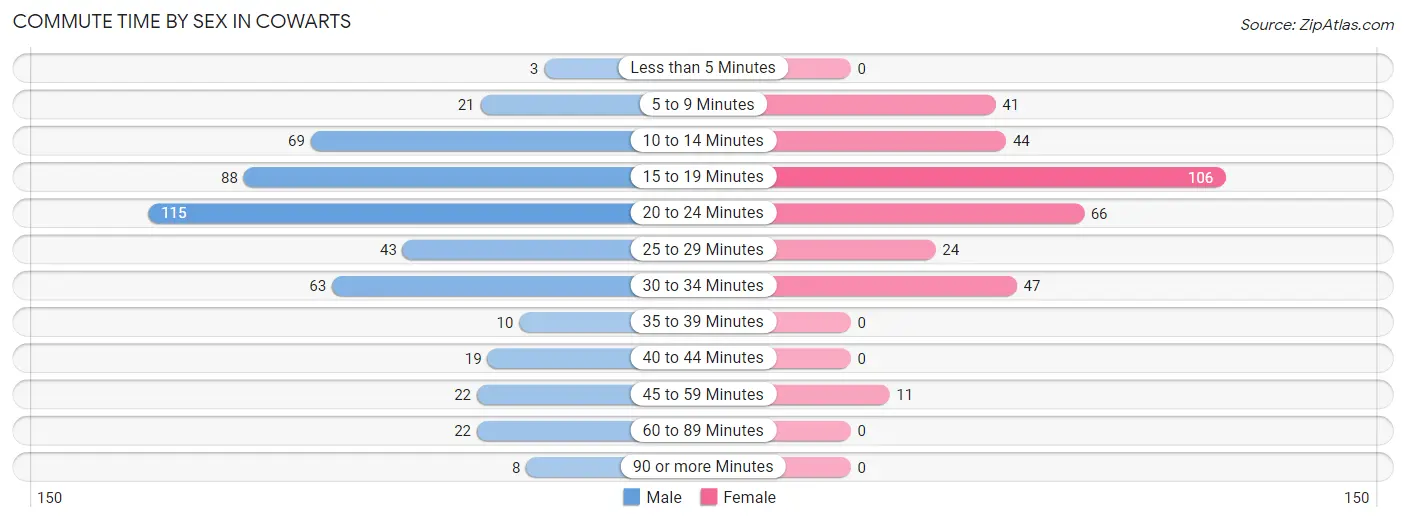
| Commute Time | Male | Female |
| Less than 5 Minutes | 3 (0.6%) | 0 (0.0%) |
| 5 to 9 Minutes | 21 (4.3%) | 41 (12.1%) |
| 10 to 14 Minutes | 69 (14.3%) | 44 (13.0%) |
| 15 to 19 Minutes | 88 (18.2%) | 106 (31.3%) |
| 20 to 24 Minutes | 115 (23.8%) | 66 (19.5%) |
| 25 to 29 Minutes | 43 (8.9%) | 24 (7.1%) |
| 30 to 34 Minutes | 63 (13.0%) | 47 (13.9%) |
| 35 to 39 Minutes | 10 (2.1%) | 0 (0.0%) |
| 40 to 44 Minutes | 19 (3.9%) | 0 (0.0%) |
| 45 to 59 Minutes | 22 (4.5%) | 11 (3.2%) |
| 60 to 89 Minutes | 22 (4.5%) | 0 (0.0%) |
| 90 or more Minutes | 8 (1.7%) | 0 (0.0%) |
Time of Departure to Work by Sex in Cowarts
The most frequent times of departure to work in Cowarts are 6:30 AM to 6:59 AM (110, 22.8%) for males and 7:30 AM to 7:59 AM (92, 27.1%) for females.
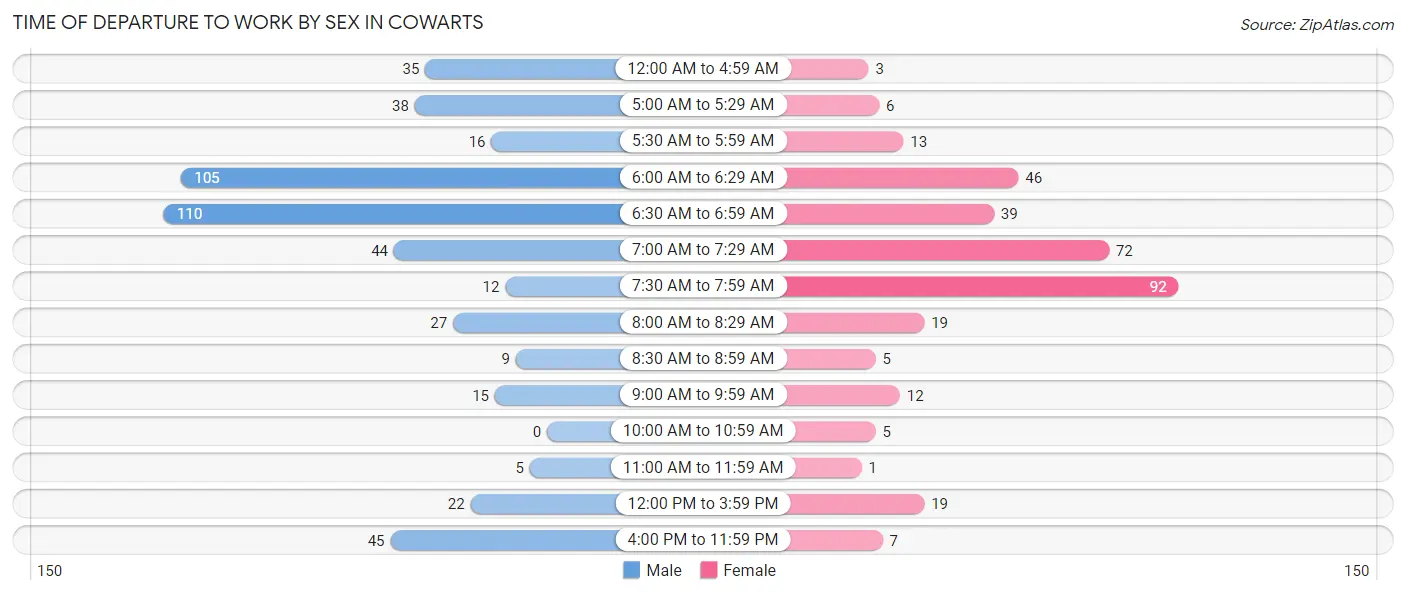
| Time of Departure | Male | Female |
| 12:00 AM to 4:59 AM | 35 (7.2%) | 3 (0.9%) |
| 5:00 AM to 5:29 AM | 38 (7.9%) | 6 (1.8%) |
| 5:30 AM to 5:59 AM | 16 (3.3%) | 13 (3.8%) |
| 6:00 AM to 6:29 AM | 105 (21.7%) | 46 (13.6%) |
| 6:30 AM to 6:59 AM | 110 (22.8%) | 39 (11.5%) |
| 7:00 AM to 7:29 AM | 44 (9.1%) | 72 (21.2%) |
| 7:30 AM to 7:59 AM | 12 (2.5%) | 92 (27.1%) |
| 8:00 AM to 8:29 AM | 27 (5.6%) | 19 (5.6%) |
| 8:30 AM to 8:59 AM | 9 (1.9%) | 5 (1.5%) |
| 9:00 AM to 9:59 AM | 15 (3.1%) | 12 (3.5%) |
| 10:00 AM to 10:59 AM | 0 (0.0%) | 5 (1.5%) |
| 11:00 AM to 11:59 AM | 5 (1.0%) | 1 (0.3%) |
| 12:00 PM to 3:59 PM | 22 (4.5%) | 19 (5.6%) |
| 4:00 PM to 11:59 PM | 45 (9.3%) | 7 (2.1%) |
| Total | 483 (100.0%) | 339 (100.0%) |
Housing Occupancy in Cowarts
Occupancy by Ownership in Cowarts
Of the total 801 dwellings in Cowarts, owner-occupied units account for 615 (76.8%), while renter-occupied units make up 186 (23.2%).
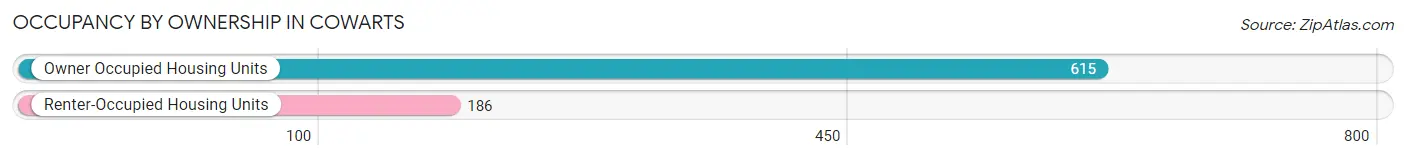
| Occupancy | # Housing Units | % Housing Units |
| Owner Occupied Housing Units | 615 | 76.8% |
| Renter-Occupied Housing Units | 186 | 23.2% |
| Total Occupied Housing Units | 801 | 100.0% |
Occupancy by Household Size in Cowarts
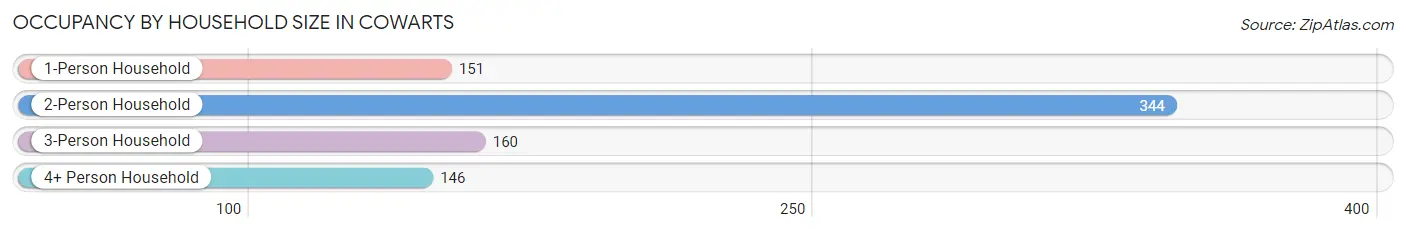
| Household Size | # Housing Units | % Housing Units |
| 1-Person Household | 151 | 18.9% |
| 2-Person Household | 344 | 42.9% |
| 3-Person Household | 160 | 20.0% |
| 4+ Person Household | 146 | 18.2% |
| Total Housing Units | 801 | 100.0% |
Occupancy by Ownership by Household Size in Cowarts
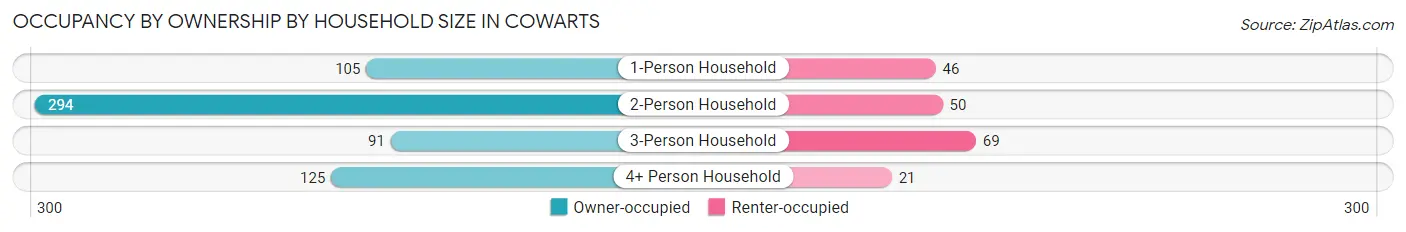
| Household Size | Owner-occupied | Renter-occupied |
| 1-Person Household | 105 (69.5%) | 46 (30.5%) |
| 2-Person Household | 294 (85.5%) | 50 (14.5%) |
| 3-Person Household | 91 (56.9%) | 69 (43.1%) |
| 4+ Person Household | 125 (85.6%) | 21 (14.4%) |
| Total Housing Units | 615 (76.8%) | 186 (23.2%) |
Occupancy by Educational Attainment in Cowarts
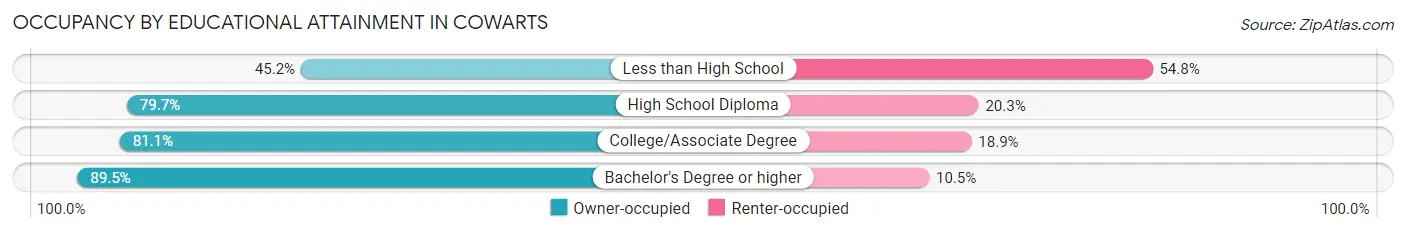
| Household Size | Owner-occupied | Renter-occupied |
| Less than High School | 52 (45.2%) | 63 (54.8%) |
| High School Diploma | 220 (79.7%) | 56 (20.3%) |
| College/Associate Degree | 232 (81.1%) | 54 (18.9%) |
| Bachelor's Degree or higher | 111 (89.5%) | 13 (10.5%) |
Occupancy by Age of Householder in Cowarts
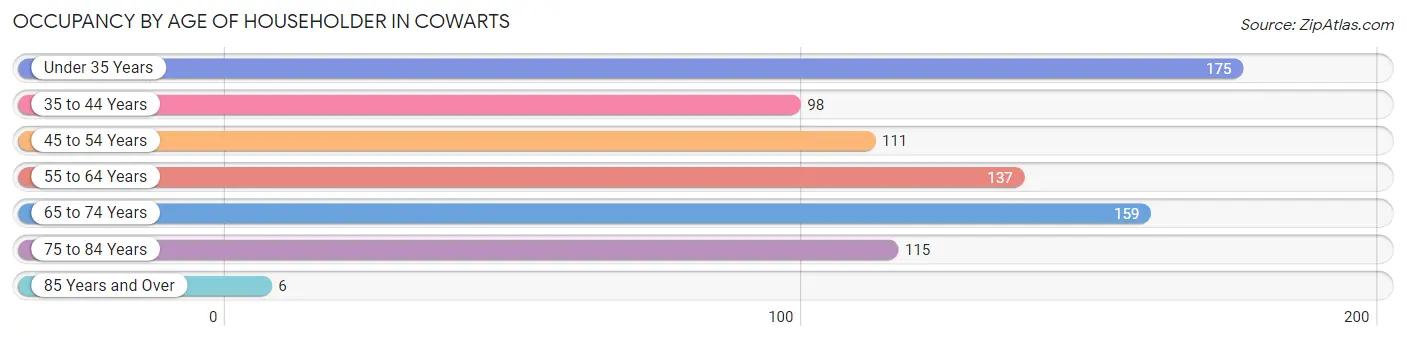
| Age Bracket | # Households | % Households |
| Under 35 Years | 175 | 21.8% |
| 35 to 44 Years | 98 | 12.2% |
| 45 to 54 Years | 111 | 13.9% |
| 55 to 64 Years | 137 | 17.1% |
| 65 to 74 Years | 159 | 19.9% |
| 75 to 84 Years | 115 | 14.4% |
| 85 Years and Over | 6 | 0.7% |
| Total | 801 | 100.0% |
Housing Finances in Cowarts
Median Income by Occupancy in Cowarts
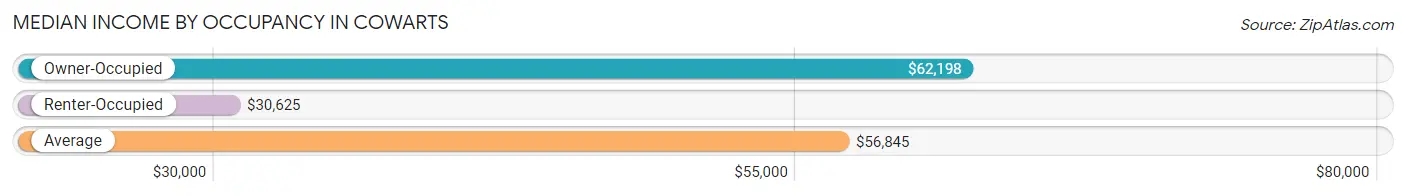
| Occupancy Type | # Households | Median Income |
| Owner-Occupied | 615 (76.8%) | $62,198 |
| Renter-Occupied | 186 (23.2%) | $30,625 |
| Average | 801 (100.0%) | $56,845 |
Occupancy by Householder Income Bracket in Cowarts
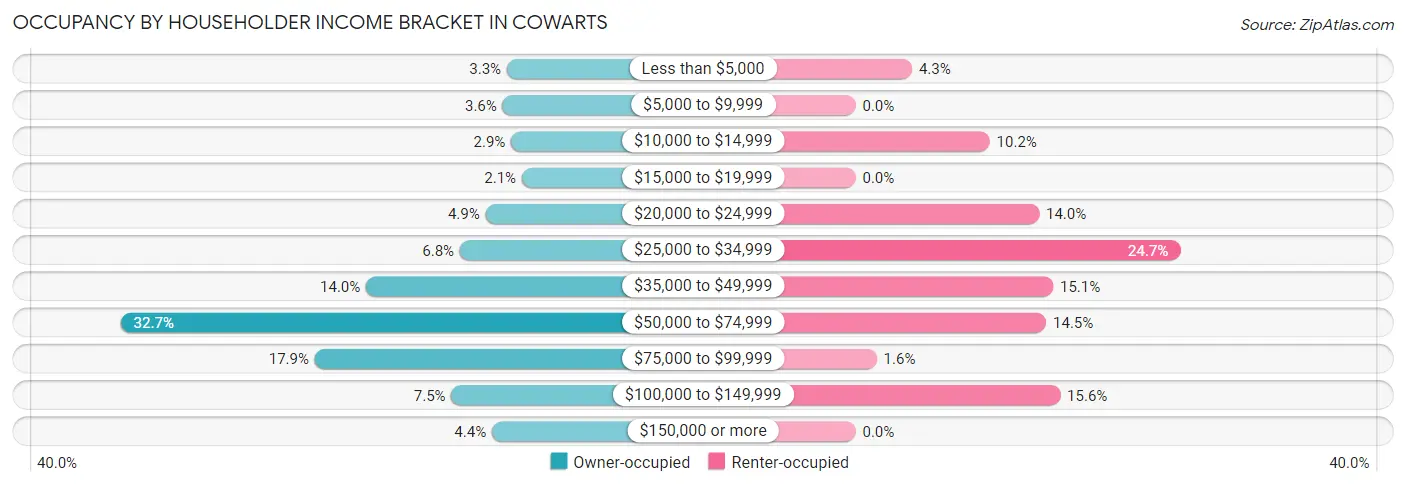
| Income Bracket | Owner-occupied | Renter-occupied |
| Less than $5,000 | 20 (3.3%) | 8 (4.3%) |
| $5,000 to $9,999 | 22 (3.6%) | 0 (0.0%) |
| $10,000 to $14,999 | 18 (2.9%) | 19 (10.2%) |
| $15,000 to $19,999 | 13 (2.1%) | 0 (0.0%) |
| $20,000 to $24,999 | 30 (4.9%) | 26 (14.0%) |
| $25,000 to $34,999 | 42 (6.8%) | 46 (24.7%) |
| $35,000 to $49,999 | 86 (14.0%) | 28 (15.0%) |
| $50,000 to $74,999 | 201 (32.7%) | 27 (14.5%) |
| $75,000 to $99,999 | 110 (17.9%) | 3 (1.6%) |
| $100,000 to $149,999 | 46 (7.5%) | 29 (15.6%) |
| $150,000 or more | 27 (4.4%) | 0 (0.0%) |
| Total | 615 (100.0%) | 186 (100.0%) |
Monthly Housing Cost Tiers in Cowarts
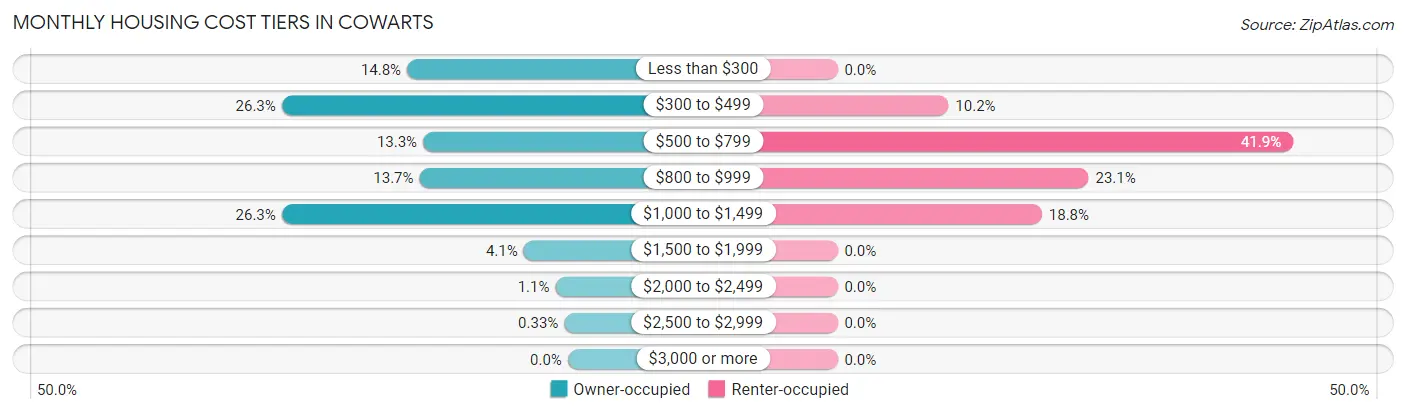
| Monthly Cost | Owner-occupied | Renter-occupied |
| Less than $300 | 91 (14.8%) | 0 (0.0%) |
| $300 to $499 | 162 (26.3%) | 19 (10.2%) |
| $500 to $799 | 82 (13.3%) | 78 (41.9%) |
| $800 to $999 | 84 (13.7%) | 43 (23.1%) |
| $1,000 to $1,499 | 162 (26.3%) | 35 (18.8%) |
| $1,500 to $1,999 | 25 (4.1%) | 0 (0.0%) |
| $2,000 to $2,499 | 7 (1.1%) | 0 (0.0%) |
| $2,500 to $2,999 | 2 (0.3%) | 0 (0.0%) |
| $3,000 or more | 0 (0.0%) | 0 (0.0%) |
| Total | 615 (100.0%) | 186 (100.0%) |
Physical Housing Characteristics in Cowarts
Housing Structures in Cowarts
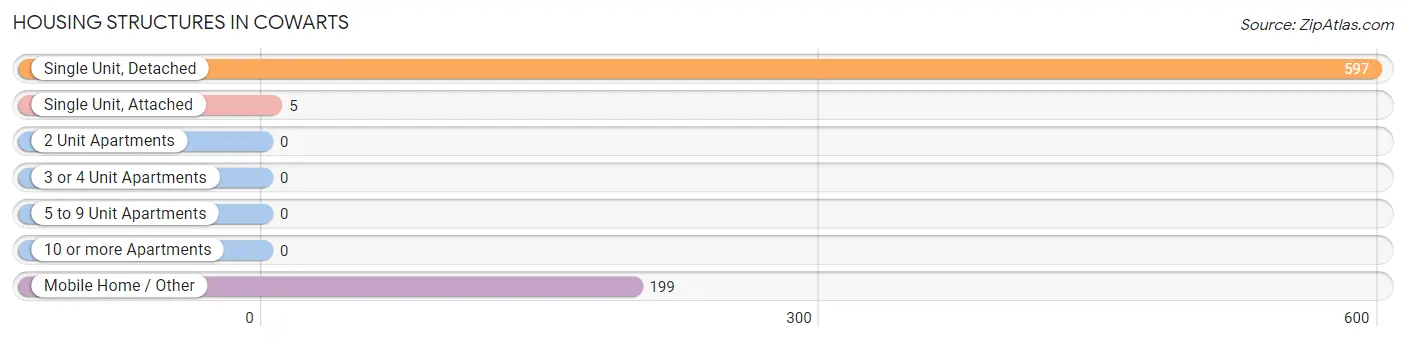
| Structure Type | # Housing Units | % Housing Units |
| Single Unit, Detached | 597 | 74.5% |
| Single Unit, Attached | 5 | 0.6% |
| 2 Unit Apartments | 0 | 0.0% |
| 3 or 4 Unit Apartments | 0 | 0.0% |
| 5 to 9 Unit Apartments | 0 | 0.0% |
| 10 or more Apartments | 0 | 0.0% |
| Mobile Home / Other | 199 | 24.8% |
| Total | 801 | 100.0% |
Housing Structures by Occupancy in Cowarts
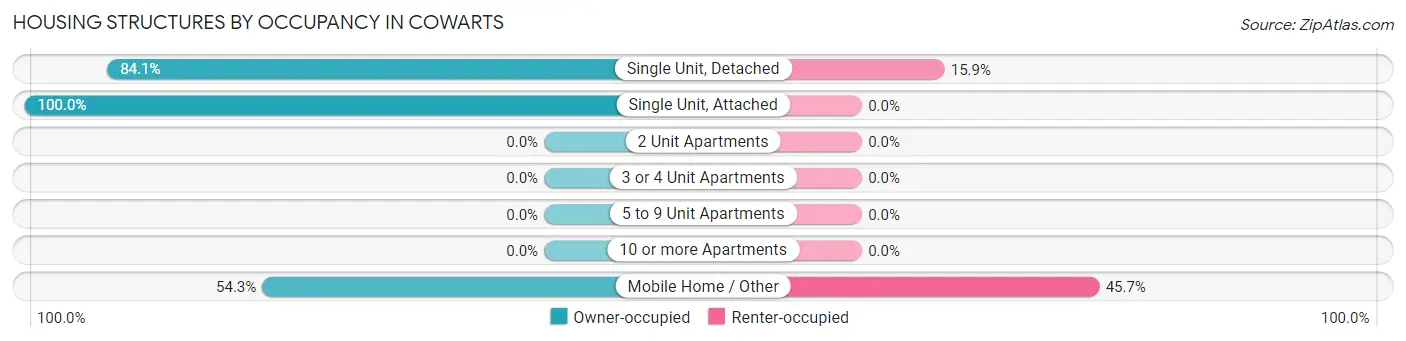
| Structure Type | Owner-occupied | Renter-occupied |
| Single Unit, Detached | 502 (84.1%) | 95 (15.9%) |
| Single Unit, Attached | 5 (100.0%) | 0 (0.0%) |
| 2 Unit Apartments | 0 (0.0%) | 0 (0.0%) |
| 3 or 4 Unit Apartments | 0 (0.0%) | 0 (0.0%) |
| 5 to 9 Unit Apartments | 0 (0.0%) | 0 (0.0%) |
| 10 or more Apartments | 0 (0.0%) | 0 (0.0%) |
| Mobile Home / Other | 108 (54.3%) | 91 (45.7%) |
| Total | 615 (76.8%) | 186 (23.2%) |
Housing Structures by Number of Rooms in Cowarts
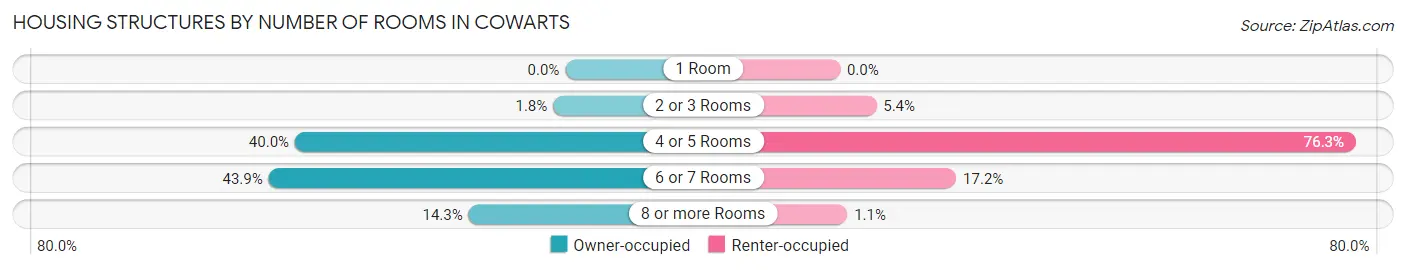
| Number of Rooms | Owner-occupied | Renter-occupied |
| 1 Room | 0 (0.0%) | 0 (0.0%) |
| 2 or 3 Rooms | 11 (1.8%) | 10 (5.4%) |
| 4 or 5 Rooms | 246 (40.0%) | 142 (76.3%) |
| 6 or 7 Rooms | 270 (43.9%) | 32 (17.2%) |
| 8 or more Rooms | 88 (14.3%) | 2 (1.1%) |
| Total | 615 (100.0%) | 186 (100.0%) |
Housing Structure by Heating Type in Cowarts
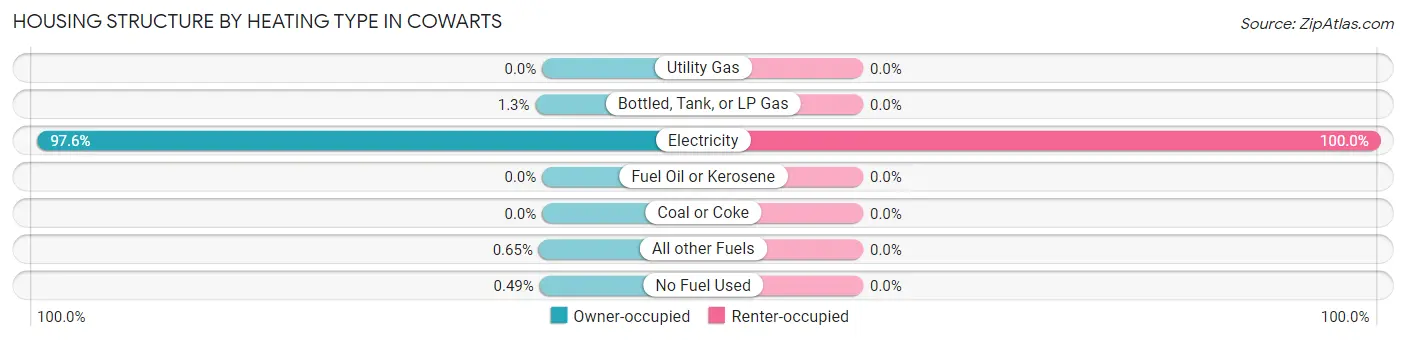
| Heating Type | Owner-occupied | Renter-occupied |
| Utility Gas | 0 (0.0%) | 0 (0.0%) |
| Bottled, Tank, or LP Gas | 8 (1.3%) | 0 (0.0%) |
| Electricity | 600 (97.6%) | 186 (100.0%) |
| Fuel Oil or Kerosene | 0 (0.0%) | 0 (0.0%) |
| Coal or Coke | 0 (0.0%) | 0 (0.0%) |
| All other Fuels | 4 (0.6%) | 0 (0.0%) |
| No Fuel Used | 3 (0.5%) | 0 (0.0%) |
| Total | 615 (100.0%) | 186 (100.0%) |
Household Vehicle Usage in Cowarts
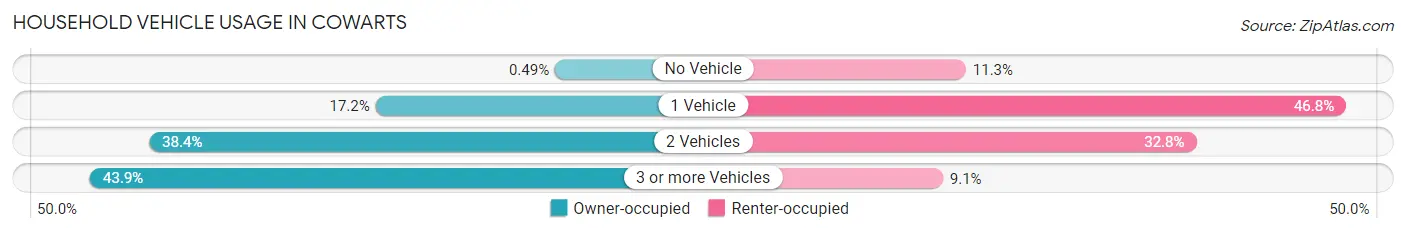
| Vehicles per Household | Owner-occupied | Renter-occupied |
| No Vehicle | 3 (0.5%) | 21 (11.3%) |
| 1 Vehicle | 106 (17.2%) | 87 (46.8%) |
| 2 Vehicles | 236 (38.4%) | 61 (32.8%) |
| 3 or more Vehicles | 270 (43.9%) | 17 (9.1%) |
| Total | 615 (100.0%) | 186 (100.0%) |
Real Estate & Mortgages in Cowarts
Real Estate and Mortgage Overview in Cowarts
| Characteristic | Without Mortgage | With Mortgage |
| Housing Units | 287 | 328 |
| Median Property Value | $121,400 | $160,500 |
| Median Household Income | $50,893 | $13 |
| Monthly Housing Costs | $364 | $0 |
| Real Estate Taxes | $263 | $33 |
Property Value by Mortgage Status in Cowarts
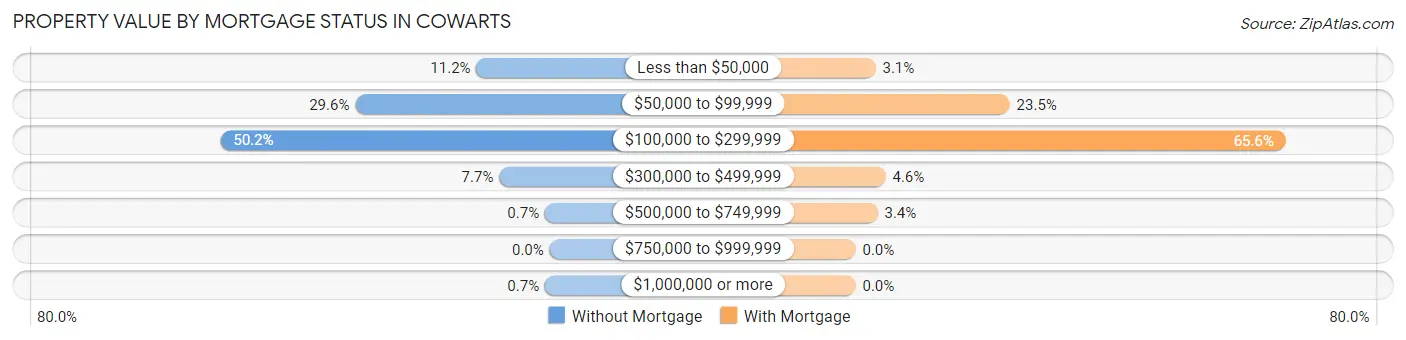
| Property Value | Without Mortgage | With Mortgage |
| Less than $50,000 | 32 (11.2%) | 10 (3.0%) |
| $50,000 to $99,999 | 85 (29.6%) | 77 (23.5%) |
| $100,000 to $299,999 | 144 (50.2%) | 215 (65.5%) |
| $300,000 to $499,999 | 22 (7.7%) | 15 (4.6%) |
| $500,000 to $749,999 | 2 (0.7%) | 11 (3.4%) |
| $750,000 to $999,999 | 0 (0.0%) | 0 (0.0%) |
| $1,000,000 or more | 2 (0.7%) | 0 (0.0%) |
| Total | 287 (100.0%) | 328 (100.0%) |
Household Income by Mortgage Status in Cowarts
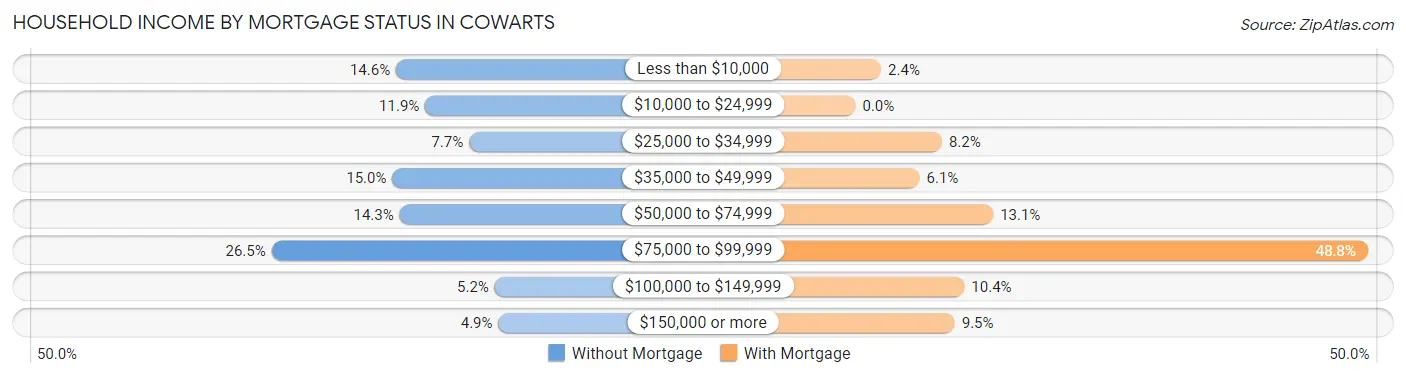
| Household Income | Without Mortgage | With Mortgage |
| Less than $10,000 | 42 (14.6%) | 8 (2.4%) |
| $10,000 to $24,999 | 34 (11.8%) | 0 (0.0%) |
| $25,000 to $34,999 | 22 (7.7%) | 27 (8.2%) |
| $35,000 to $49,999 | 43 (15.0%) | 20 (6.1%) |
| $50,000 to $74,999 | 41 (14.3%) | 43 (13.1%) |
| $75,000 to $99,999 | 76 (26.5%) | 160 (48.8%) |
| $100,000 to $149,999 | 15 (5.2%) | 34 (10.4%) |
| $150,000 or more | 14 (4.9%) | 31 (9.5%) |
| Total | 287 (100.0%) | 328 (100.0%) |
Property Value to Household Income Ratio in Cowarts
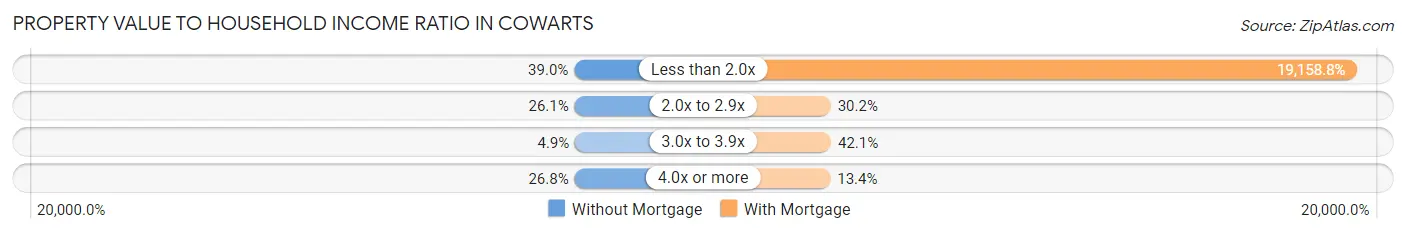
| Value-to-Income Ratio | Without Mortgage | With Mortgage |
| Less than 2.0x | 112 (39.0%) | 62,841 (19,158.8%) |
| 2.0x to 2.9x | 75 (26.1%) | 99 (30.2%) |
| 3.0x to 3.9x | 14 (4.9%) | 138 (42.1%) |
| 4.0x or more | 77 (26.8%) | 44 (13.4%) |
| Total | 287 (100.0%) | 328 (100.0%) |
Real Estate Taxes by Mortgage Status in Cowarts
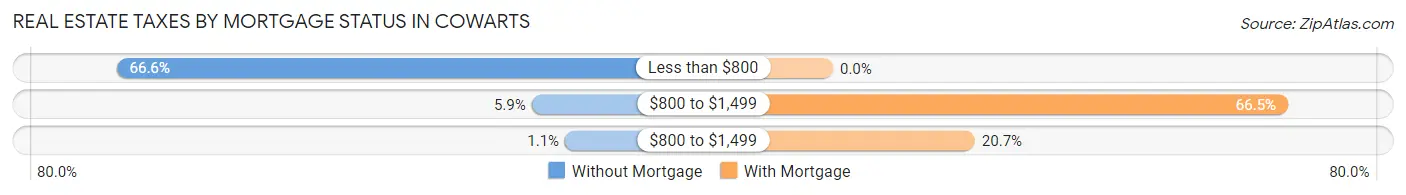
| Property Taxes | Without Mortgage | With Mortgage |
| Less than $800 | 191 (66.5%) | 0 (0.0%) |
| $800 to $1,499 | 17 (5.9%) | 218 (66.5%) |
| $800 to $1,499 | 3 (1.1%) | 68 (20.7%) |
| Total | 287 (100.0%) | 328 (100.0%) |
Health & Disability in Cowarts
Health Insurance Coverage by Age in Cowarts
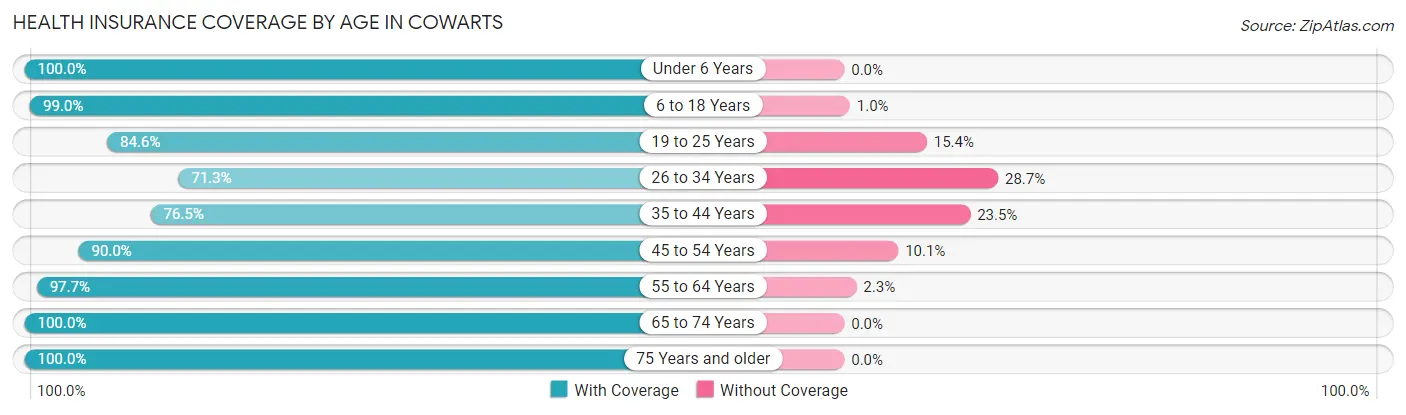
| Age Bracket | With Coverage | Without Coverage |
| Under 6 Years | 232 (100.0%) | 0 (0.0%) |
| 6 to 18 Years | 287 (99.0%) | 3 (1.0%) |
| 19 to 25 Years | 143 (84.6%) | 26 (15.4%) |
| 26 to 34 Years | 214 (71.3%) | 86 (28.7%) |
| 35 to 44 Years | 176 (76.5%) | 54 (23.5%) |
| 45 to 54 Years | 197 (89.9%) | 22 (10.1%) |
| 55 to 64 Years | 259 (97.7%) | 6 (2.3%) |
| 65 to 74 Years | 265 (100.0%) | 0 (0.0%) |
| 75 Years and older | 204 (100.0%) | 0 (0.0%) |
| Total | 1,977 (90.9%) | 197 (9.1%) |
Health Insurance Coverage by Citizenship Status in Cowarts
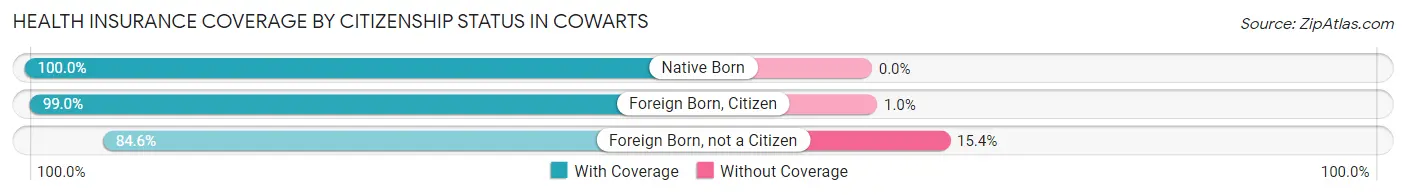
| Citizenship Status | With Coverage | Without Coverage |
| Native Born | 232 (100.0%) | 0 (0.0%) |
| Foreign Born, Citizen | 287 (99.0%) | 3 (1.0%) |
| Foreign Born, not a Citizen | 143 (84.6%) | 26 (15.4%) |
Health Insurance Coverage by Household Income in Cowarts
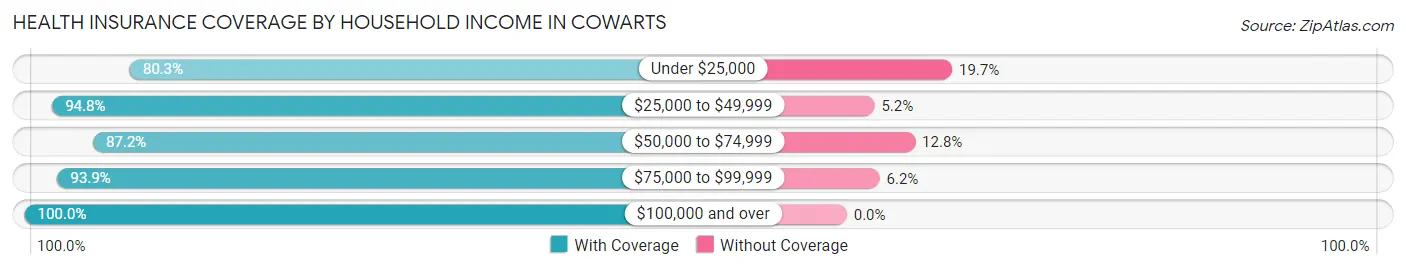
| Household Income | With Coverage | Without Coverage |
| Under $25,000 | 232 (80.3%) | 57 (19.7%) |
| $25,000 to $49,999 | 476 (94.8%) | 26 (5.2%) |
| $50,000 to $74,999 | 640 (87.2%) | 94 (12.8%) |
| $75,000 to $99,999 | 305 (93.9%) | 20 (6.1%) |
| $100,000 and over | 324 (100.0%) | 0 (0.0%) |
Public vs Private Health Insurance Coverage by Age in Cowarts
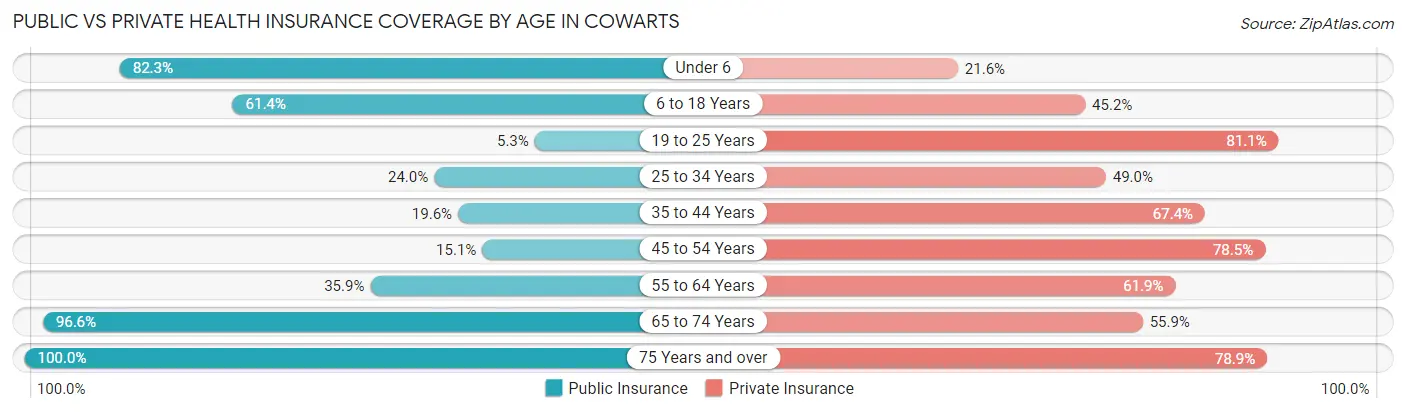
| Age Bracket | Public Insurance | Private Insurance |
| Under 6 | 191 (82.3%) | 50 (21.5%) |
| 6 to 18 Years | 178 (61.4%) | 131 (45.2%) |
| 19 to 25 Years | 9 (5.3%) | 137 (81.1%) |
| 25 to 34 Years | 72 (24.0%) | 147 (49.0%) |
| 35 to 44 Years | 45 (19.6%) | 155 (67.4%) |
| 45 to 54 Years | 33 (15.1%) | 172 (78.5%) |
| 55 to 64 Years | 95 (35.8%) | 164 (61.9%) |
| 65 to 74 Years | 256 (96.6%) | 148 (55.8%) |
| 75 Years and over | 204 (100.0%) | 161 (78.9%) |
| Total | 1,083 (49.8%) | 1,265 (58.2%) |
Disability Status by Sex by Age in Cowarts
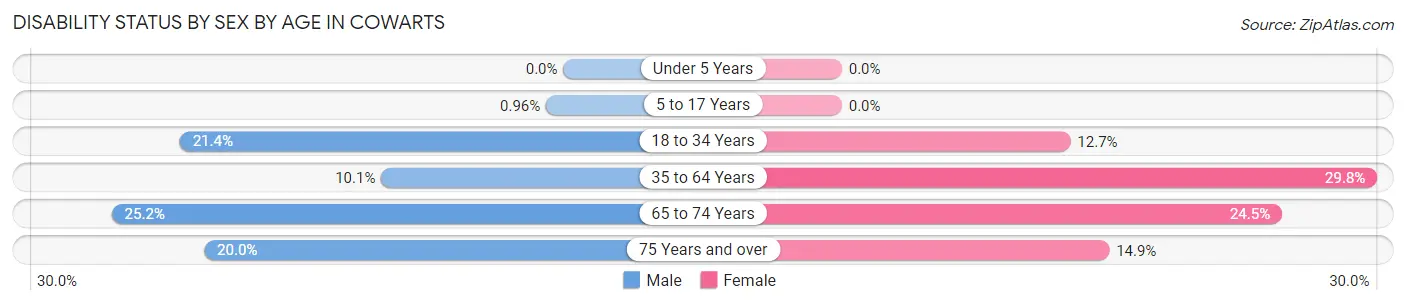
| Age Bracket | Male | Female |
| Under 5 Years | 0 (0.0%) | 0 (0.0%) |
| 5 to 17 Years | 2 (1.0%) | 0 (0.0%) |
| 18 to 34 Years | 44 (21.4%) | 35 (12.7%) |
| 35 to 64 Years | 36 (10.1%) | 107 (29.8%) |
| 65 to 74 Years | 41 (25.2%) | 25 (24.5%) |
| 75 Years and over | 22 (20.0%) | 14 (14.9%) |
Disability Class by Sex by Age in Cowarts
Disability Class: Hearing Difficulty
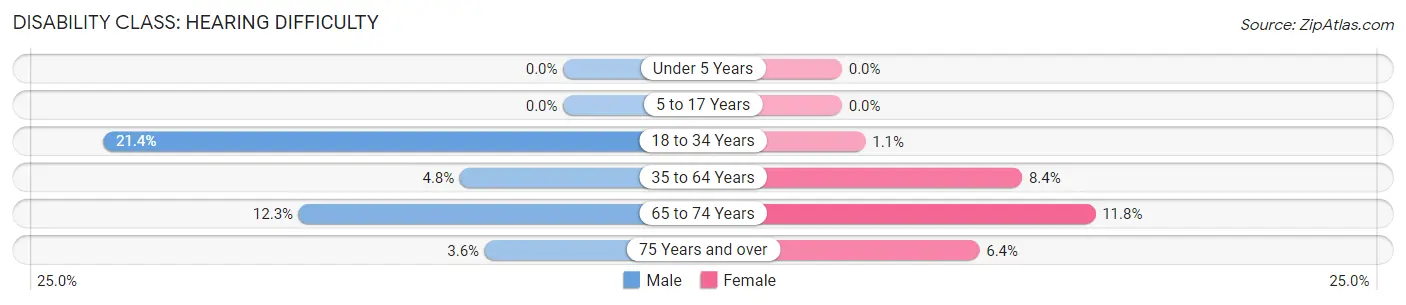
| Age Bracket | Male | Female |
| Under 5 Years | 0 (0.0%) | 0 (0.0%) |
| 5 to 17 Years | 0 (0.0%) | 0 (0.0%) |
| 18 to 34 Years | 44 (21.4%) | 3 (1.1%) |
| 35 to 64 Years | 17 (4.8%) | 30 (8.4%) |
| 65 to 74 Years | 20 (12.3%) | 12 (11.8%) |
| 75 Years and over | 4 (3.6%) | 6 (6.4%) |
Disability Class: Vision Difficulty
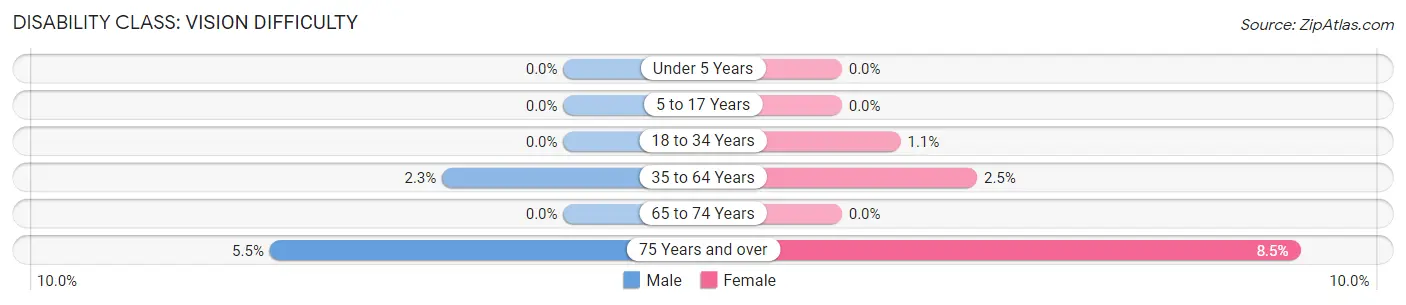
| Age Bracket | Male | Female |
| Under 5 Years | 0 (0.0%) | 0 (0.0%) |
| 5 to 17 Years | 0 (0.0%) | 0 (0.0%) |
| 18 to 34 Years | 0 (0.0%) | 3 (1.1%) |
| 35 to 64 Years | 8 (2.2%) | 9 (2.5%) |
| 65 to 74 Years | 0 (0.0%) | 0 (0.0%) |
| 75 Years and over | 6 (5.4%) | 8 (8.5%) |
Disability Class: Cognitive Difficulty
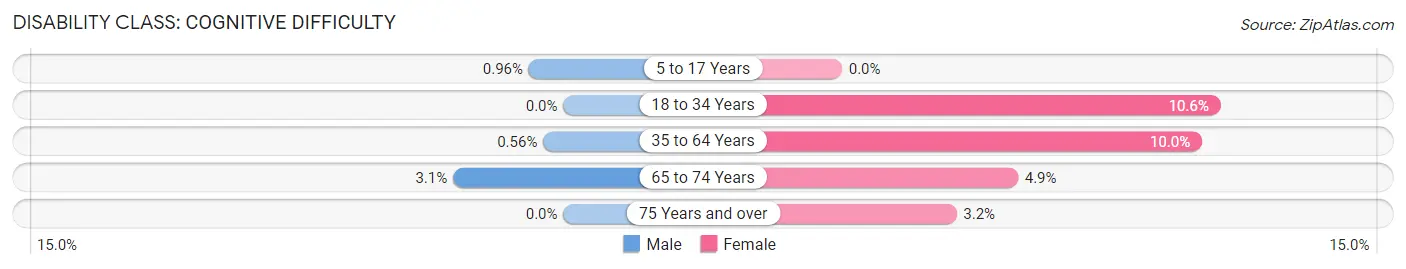
| Age Bracket | Male | Female |
| 5 to 17 Years | 2 (1.0%) | 0 (0.0%) |
| 18 to 34 Years | 0 (0.0%) | 29 (10.5%) |
| 35 to 64 Years | 2 (0.6%) | 36 (10.0%) |
| 65 to 74 Years | 5 (3.1%) | 5 (4.9%) |
| 75 Years and over | 0 (0.0%) | 3 (3.2%) |
Disability Class: Ambulatory Difficulty
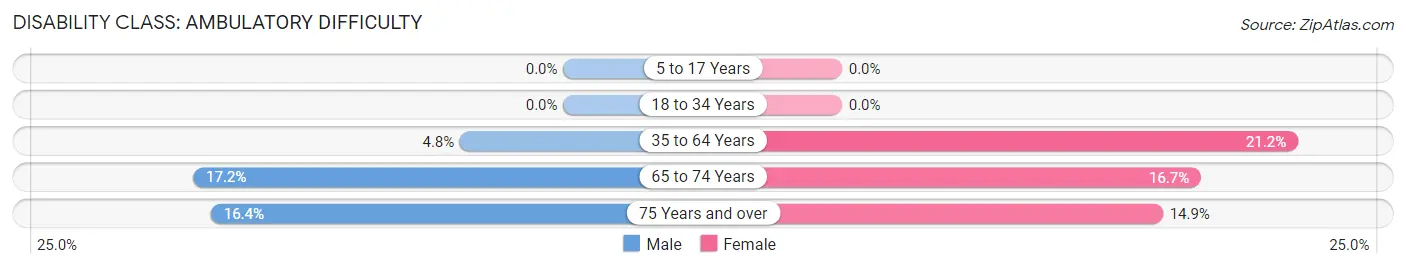
| Age Bracket | Male | Female |
| 5 to 17 Years | 0 (0.0%) | 0 (0.0%) |
| 18 to 34 Years | 0 (0.0%) | 0 (0.0%) |
| 35 to 64 Years | 17 (4.8%) | 76 (21.2%) |
| 65 to 74 Years | 28 (17.2%) | 17 (16.7%) |
| 75 Years and over | 18 (16.4%) | 14 (14.9%) |
Disability Class: Self-Care Difficulty
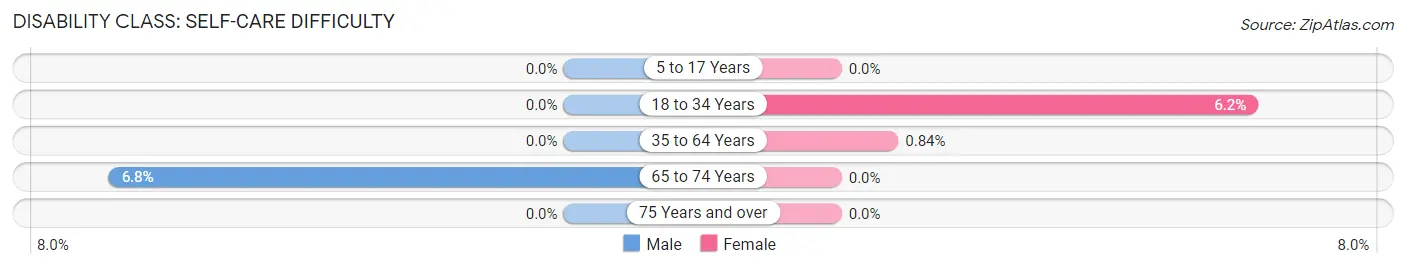
| Age Bracket | Male | Female |
| 5 to 17 Years | 0 (0.0%) | 0 (0.0%) |
| 18 to 34 Years | 0 (0.0%) | 17 (6.2%) |
| 35 to 64 Years | 0 (0.0%) | 3 (0.8%) |
| 65 to 74 Years | 11 (6.8%) | 0 (0.0%) |
| 75 Years and over | 0 (0.0%) | 0 (0.0%) |
Technology Access in Cowarts
Computing Device Access in Cowarts
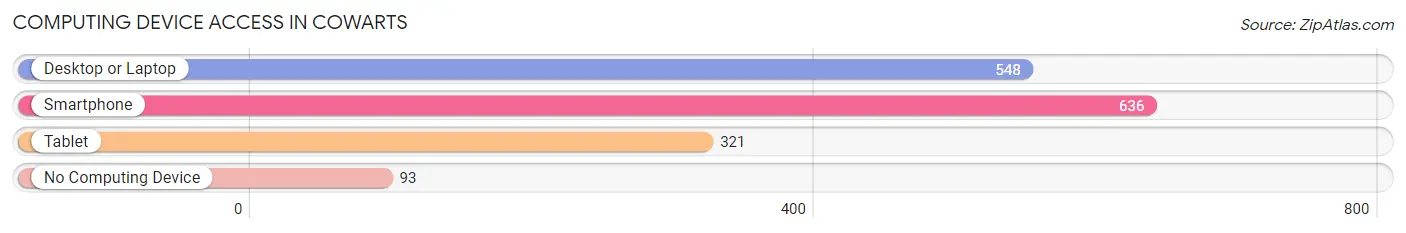
| Device Type | # Households | % Households |
| Desktop or Laptop | 548 | 68.4% |
| Smartphone | 636 | 79.4% |
| Tablet | 321 | 40.1% |
| No Computing Device | 93 | 11.6% |
| Total | 801 | 100.0% |
Internet Access in Cowarts
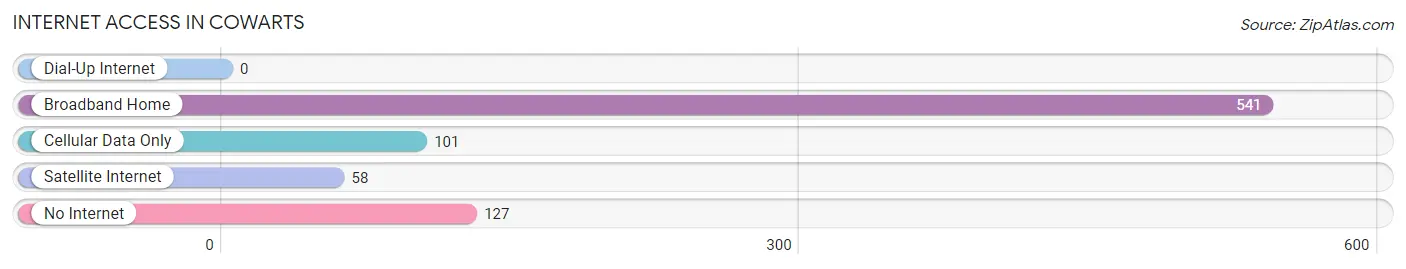
| Internet Type | # Households | % Households |
| Dial-Up Internet | 0 | 0.0% |
| Broadband Home | 541 | 67.5% |
| Cellular Data Only | 101 | 12.6% |
| Satellite Internet | 58 | 7.2% |
| No Internet | 127 | 15.9% |
| Total | 801 | 100.0% |
Cowarts Summary
History
Cowarts is a small town located in Houston County, Alabama. It was founded in 1883 and was originally known as Cowartsville. The town was named after the Cowart family, who were among the first settlers in the area. The Cowarts were farmers and the town was a farming community for many years.
In the early 1900s, the town began to grow and develop. The first school was built in 1906 and the first post office was established in 1907. The town also had a cotton gin, a sawmill, and a grist mill.
In the 1920s, the town began to experience a period of growth and prosperity. The population increased from around 200 in 1920 to over 500 in 1930. During this time, the town had several stores, a bank, a hotel, and a movie theater.
In the 1940s, the town experienced a decline in population due to the Great Depression and World War II. After the war, the population began to slowly increase again.
In the 1950s, the town experienced a period of growth and development. The population increased to over 1,000 and the town had several new businesses, including a grocery store, a hardware store, and a drug store.
In the 1960s, the town experienced a period of decline. The population decreased to around 500 and many of the businesses closed.
In the 1970s, the town experienced a period of revitalization. The population increased to over 1,000 and several new businesses opened.
In the 1980s, the town experienced a period of growth and development. The population increased to over 1,500 and the town had several new businesses, including a restaurant, a gas station, and a convenience store.
In the 1990s, the town experienced a period of decline. The population decreased to around 1,000 and many of the businesses closed.
Geography
Cowarts is located in Houston County, Alabama. It is situated in the southeastern part of the state, about 20 miles south of Dothan. The town is located on the banks of the Choctawhatchee River.
The town has a total area of 1.2 square miles, all of which is land. The terrain is mostly flat and the town is surrounded by farmland.
Economy
The economy of Cowarts is largely based on agriculture. The town is home to several farms, which produce a variety of crops, including cotton, corn, soybeans, and peanuts.
The town also has several small businesses, including a grocery store, a hardware store, a drug store, a restaurant, a gas station, and a convenience store.
Demographics
As of the 2010 census, the population of Cowarts was 1,093. The racial makeup of the town was 79.3% White, 17.7% African American, 0.7% Native American, 0.3% Asian, 0.1% Pacific Islander, and 1.9% from other races.
The median household income in Cowarts was $31,250, and the median family income was $37,500. The per capita income was $15,945. About 17.3% of the population was below the poverty line.
Common Questions
What is Per Capita Income in Cowarts?
Per Capita income in Cowarts is $23,736.
What is the Median Family Income in Cowarts?
Median Family Income in Cowarts is $57,423.
What is the Median Household income in Cowarts?
Median Household Income in Cowarts is $56,845.
What is Income or Wage Gap in Cowarts?
Income or Wage Gap in Cowarts is 41.0%.
Women in Cowarts earn 59.0 cents for every dollar earned by a man.
What is Inequality or Gini Index in Cowarts?
Inequality or Gini Index in Cowarts is 0.37.
What is the Total Population of Cowarts?
Total Population of Cowarts is 2,174.
What is the Total Male Population of Cowarts?
Total Male Population of Cowarts is 1,084.
What is the Total Female Population of Cowarts?
Total Female Population of Cowarts is 1,090.
What is the Ratio of Males per 100 Females in Cowarts?
There are 99.45 Males per 100 Females in Cowarts.
What is the Ratio of Females per 100 Males in Cowarts?
There are 100.55 Females per 100 Males in Cowarts.
What is the Median Population Age in Cowarts?
Median Population Age in Cowarts is 39.4 Years.
What is the Average Family Size in Cowarts
Average Family Size in Cowarts is 3.0 People.
What is the Average Household Size in Cowarts
Average Household Size in Cowarts is 2.7 People.
How Large is the Labor Force in Cowarts?
There are 880 People in the Labor Forcein in Cowarts.
What is the Percentage of People in the Labor Force in Cowarts?
51.7% of People are in the Labor Force in Cowarts.
What is the Unemployment Rate in Cowarts?
Unemployment Rate in Cowarts is 3.1%.