Collinsville, AL Map & Demographics
Collinsville Map
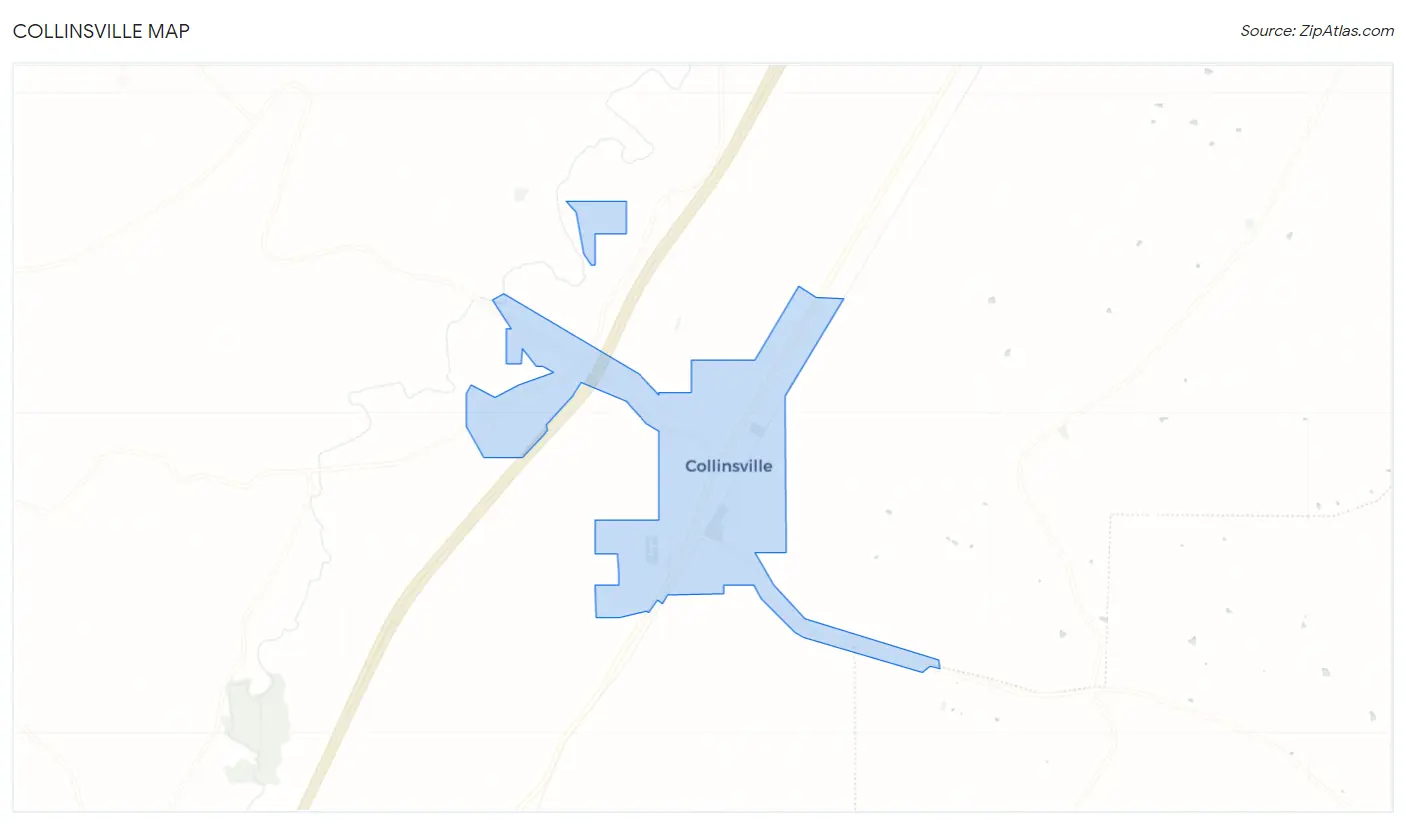
Collinsville Overview
$16,437
PER CAPITA INCOME
$44,237
AVG FAMILY INCOME
$38,438
AVG HOUSEHOLD INCOME
12.8%
WAGE / INCOME GAP [ % ]
87.2¢/ $1
WAGE / INCOME GAP [ $ ]
0.47
INEQUALITY / GINI INDEX
2,036
TOTAL POPULATION
1,100
MALE POPULATION
936
FEMALE POPULATION
117.52
MALES / 100 FEMALES
85.09
FEMALES / 100 MALES
36.4
MEDIAN AGE
3.5
AVG FAMILY SIZE
2.9
AVG HOUSEHOLD SIZE
741
LABOR FORCE [ PEOPLE ]
46.6%
PERCENT IN LABOR FORCE
1.3%
UNEMPLOYMENT RATE
Collinsville Zip Codes
Collinsville Area Codes
Income in Collinsville
Income Overview in Collinsville
Per Capita Income in Collinsville is $16,437, while median incomes of families and households are $44,237 and $38,438 respectively.
| Characteristic | Number | Measure |
| Per Capita Income | 2,036 | $16,437 |
| Median Family Income | 436 | $44,237 |
| Mean Family Income | 436 | $64,390 |
| Median Household Income | 633 | $38,438 |
| Mean Household Income | 633 | $51,500 |
| Income Deficit | 436 | $0 |
| Wage / Income Gap (%) | 2,036 | 12.82% |
| Wage / Income Gap ($) | 2,036 | 87.18¢ per $1 |
| Gini / Inequality Index | 2,036 | 0.47 |
Earnings by Sex in Collinsville
Average Earnings in Collinsville are $23,925, $24,482 for men and $21,344 for women, a difference of 12.8%.
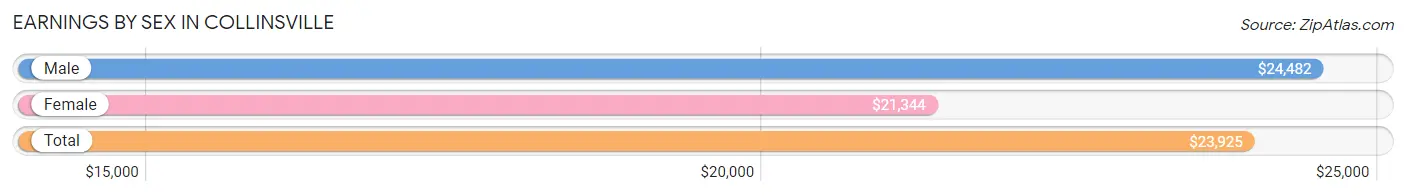
| Sex | Number | Average Earnings |
| Male | 509 (67.7%) | $24,482 |
| Female | 243 (32.3%) | $21,344 |
| Total | 752 (100.0%) | $23,925 |
Earnings by Sex by Income Bracket in Collinsville
The most common earnings brackets in Collinsville are $22,500 to $24,999 for men (152 | 29.9%) and $20,000 to $22,499 for women (40 | 16.5%).
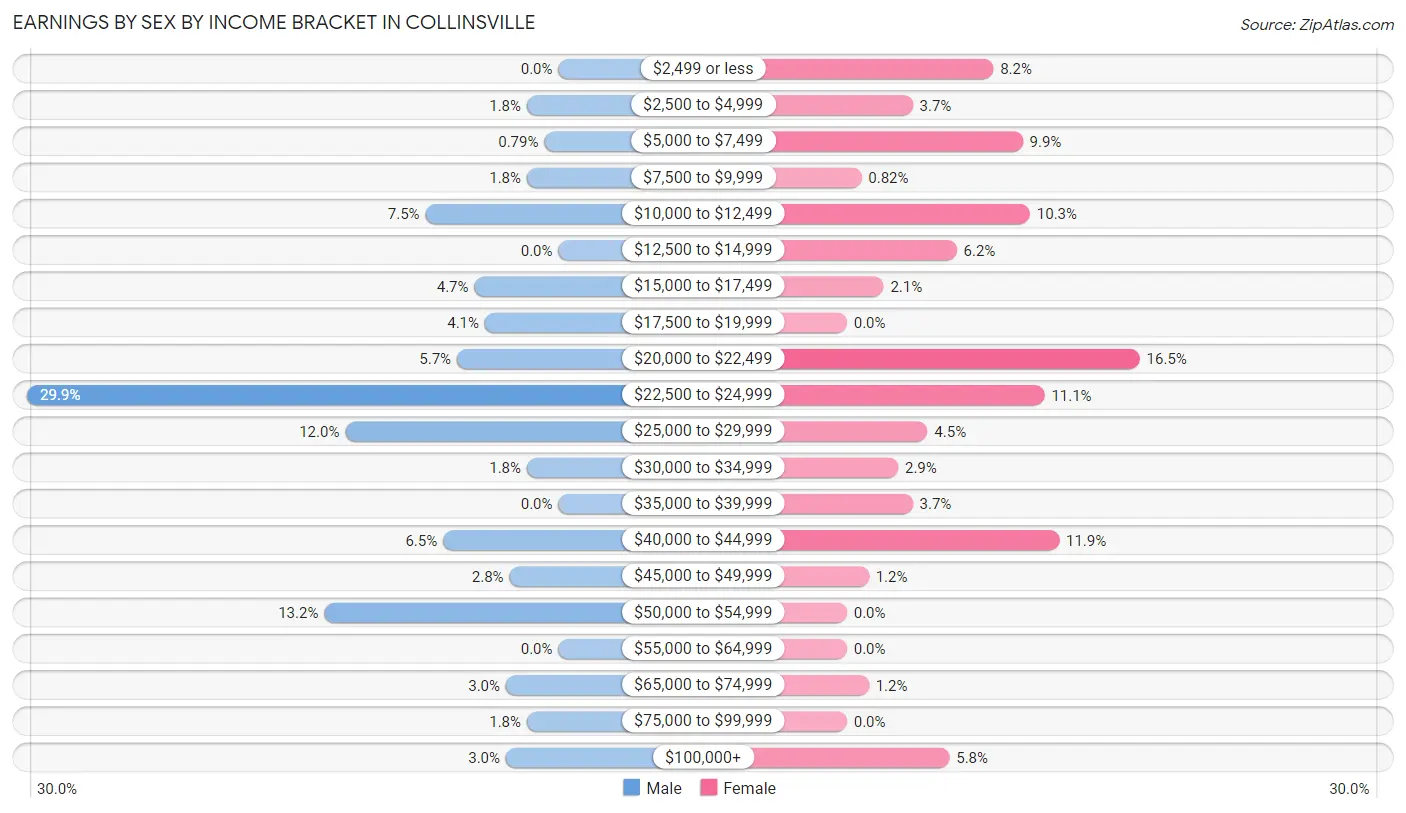
| Income | Male | Female |
| $2,499 or less | 0 (0.0%) | 20 (8.2%) |
| $2,500 to $4,999 | 9 (1.8%) | 9 (3.7%) |
| $5,000 to $7,499 | 4 (0.8%) | 24 (9.9%) |
| $7,500 to $9,999 | 9 (1.8%) | 2 (0.8%) |
| $10,000 to $12,499 | 38 (7.5%) | 25 (10.3%) |
| $12,500 to $14,999 | 0 (0.0%) | 15 (6.2%) |
| $15,000 to $17,499 | 24 (4.7%) | 5 (2.1%) |
| $17,500 to $19,999 | 21 (4.1%) | 0 (0.0%) |
| $20,000 to $22,499 | 29 (5.7%) | 40 (16.5%) |
| $22,500 to $24,999 | 152 (29.9%) | 27 (11.1%) |
| $25,000 to $29,999 | 61 (12.0%) | 11 (4.5%) |
| $30,000 to $34,999 | 9 (1.8%) | 7 (2.9%) |
| $35,000 to $39,999 | 0 (0.0%) | 9 (3.7%) |
| $40,000 to $44,999 | 33 (6.5%) | 29 (11.9%) |
| $45,000 to $49,999 | 14 (2.8%) | 3 (1.2%) |
| $50,000 to $54,999 | 67 (13.2%) | 0 (0.0%) |
| $55,000 to $64,999 | 0 (0.0%) | 0 (0.0%) |
| $65,000 to $74,999 | 15 (2.9%) | 3 (1.2%) |
| $75,000 to $99,999 | 9 (1.8%) | 0 (0.0%) |
| $100,000+ | 15 (2.9%) | 14 (5.8%) |
| Total | 509 (100.0%) | 243 (100.0%) |
Earnings by Sex by Educational Attainment in Collinsville
Average earnings in Collinsville are $24,484 for men and $22,438 for women, a difference of 8.4%. Men with an educational attainment of college or associate's degree enjoy the highest average annual earnings of $69,038, while those with less than high school education earn the least with $23,854. Women with an educational attainment of less than high school earn the most with the average annual earnings of $28,409, while those with college or associate's degree education have the smallest earnings of $21,313.
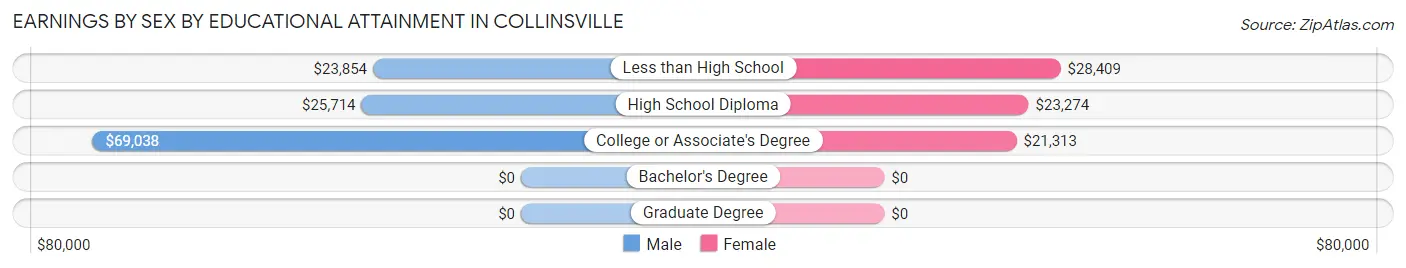
| Educational Attainment | Male Income | Female Income |
| Less than High School | $23,854 | $28,409 |
| High School Diploma | $25,714 | $23,274 |
| College or Associate's Degree | $69,038 | $21,313 |
| Bachelor's Degree | - | - |
| Graduate Degree | - | - |
| Total | $24,484 | $22,438 |
Family Income in Collinsville
Family Income Brackets in Collinsville
According to the Collinsville family income data, there are 130 families falling into the $35,000 to $49,999 income range, which is the most common income bracket and makes up 29.8% of all families. Conversely, the $150,000 to $199,999 income bracket is the least frequent group with only 2 families (0.5%) belonging to this category.
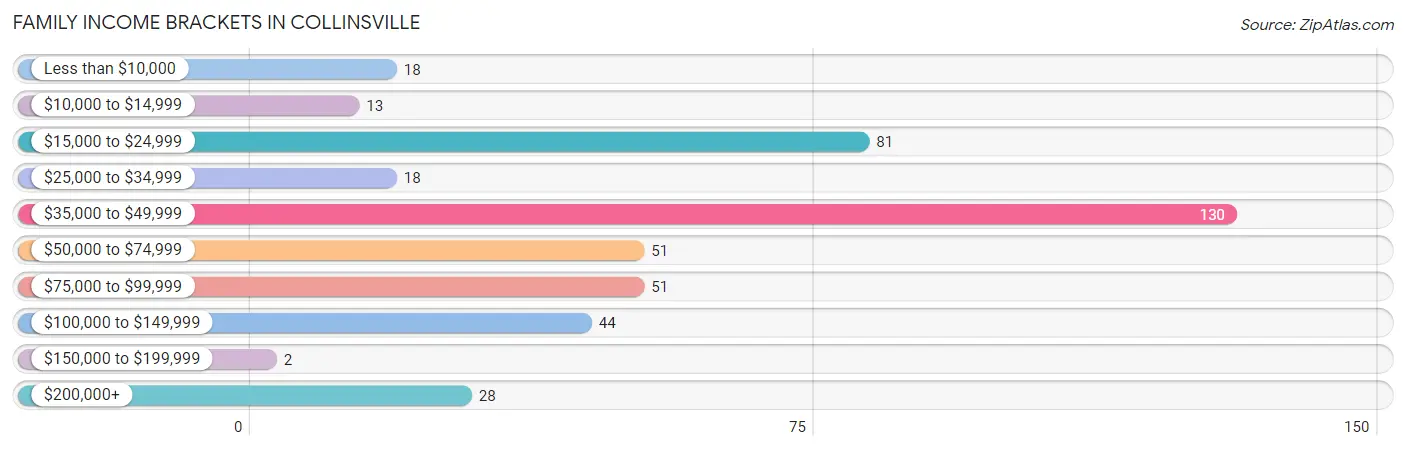
| Income Bracket | # Families | % Families |
| Less than $10,000 | 18 | 4.1% |
| $10,000 to $14,999 | 13 | 3.0% |
| $15,000 to $24,999 | 81 | 18.6% |
| $25,000 to $34,999 | 18 | 4.1% |
| $35,000 to $49,999 | 130 | 29.8% |
| $50,000 to $74,999 | 51 | 11.7% |
| $75,000 to $99,999 | 51 | 11.7% |
| $100,000 to $149,999 | 44 | 10.1% |
| $150,000 to $199,999 | 2 | 0.5% |
| $200,000+ | 28 | 6.4% |
Family Income by Famaliy Size in Collinsville
7+ person families (20 | 4.6%) account for the highest median family income in Collinsville with $86,591 per family, while 7+ person families (20 | 4.6%) have the highest median income of $12,370 per family member.
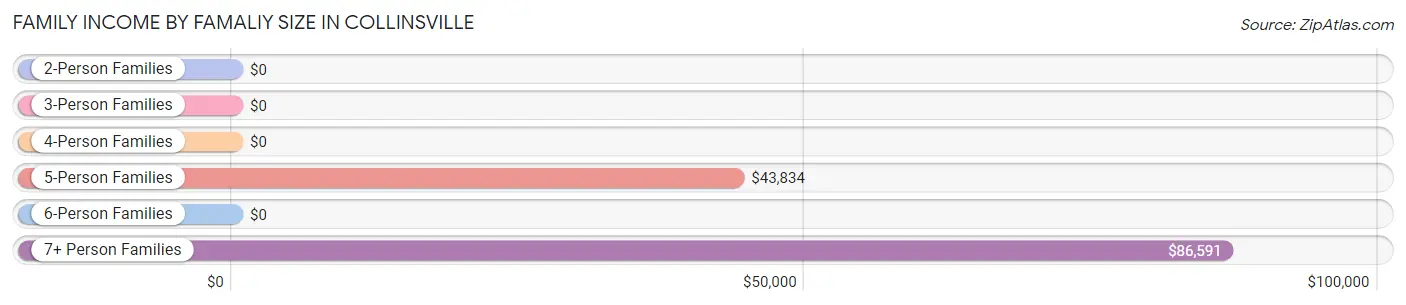
| Income Bracket | # Families | Median Income |
| 2-Person Families | 118 (27.1%) | $0 |
| 3-Person Families | 147 (33.7%) | $0 |
| 4-Person Families | 15 (3.4%) | $0 |
| 5-Person Families | 123 (28.2%) | $43,834 |
| 6-Person Families | 13 (3.0%) | $0 |
| 7+ Person Families | 20 (4.6%) | $86,591 |
| Total | 436 (100.0%) | $44,237 |
Family Income by Number of Earners in Collinsville
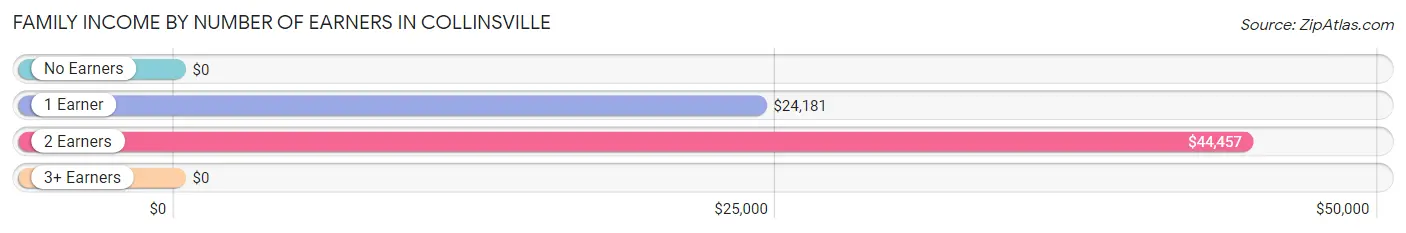
| Number of Earners | # Families | Median Income |
| No Earners | 24 (5.5%) | $0 |
| 1 Earner | 181 (41.5%) | $24,181 |
| 2 Earners | 164 (37.6%) | $44,457 |
| 3+ Earners | 67 (15.4%) | $0 |
| Total | 436 (100.0%) | $44,237 |
Household Income in Collinsville
Household Income Brackets in Collinsville
With 134 households falling in the category, the $35,000 to $49,999 income range is the most frequent in Collinsville, accounting for 21.2% of all households. In contrast, only 2 households (0.3%) fall into the $150,000 to $199,999 income bracket, making it the least populous group.
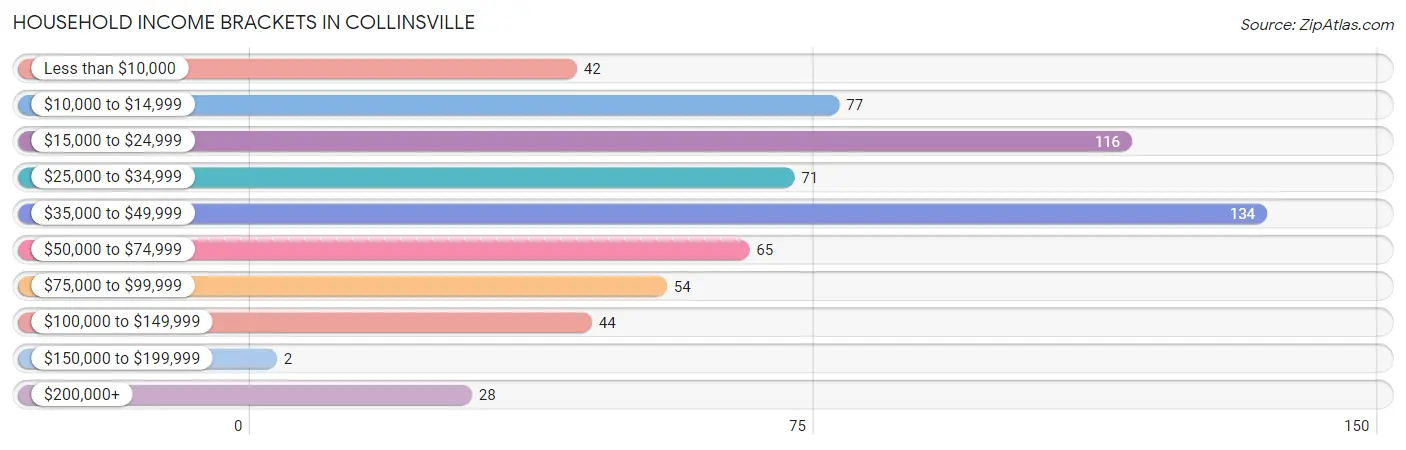
| Income Bracket | # Households | % Households |
| Less than $10,000 | 42 | 6.6% |
| $10,000 to $14,999 | 77 | 12.2% |
| $15,000 to $24,999 | 116 | 18.3% |
| $25,000 to $34,999 | 71 | 11.2% |
| $35,000 to $49,999 | 134 | 21.2% |
| $50,000 to $74,999 | 65 | 10.3% |
| $75,000 to $99,999 | 54 | 8.5% |
| $100,000 to $149,999 | 44 | 7.0% |
| $150,000 to $199,999 | 2 | 0.3% |
| $200,000+ | 28 | 4.4% |
Household Income by Householder Age in Collinsville
The median household income in Collinsville is $38,438, with the highest median household income of $43,736 found in the 45 to 64 years age bracket for the primary householder. A total of 293 households (46.3%) fall into this category. Meanwhile, the 15 to 24 years age bracket for the primary householder has the lowest median household income of $0, with 9 households (1.4%) in this group.
| Income Bracket | # Households | Median Income |
| 15 to 24 Years | 9 (1.4%) | $0 |
| 25 to 44 Years | 201 (31.8%) | $28,162 |
| 45 to 64 Years | 293 (46.3%) | $43,736 |
| 65+ Years | 130 (20.5%) | $20,921 |
| Total | 633 (100.0%) | $38,438 |
Poverty in Collinsville
Income Below Poverty by Sex and Age in Collinsville
With 28.0% poverty level for males and 29.7% for females among the residents of Collinsville, 12 to 14 year old males and 15 year old females are the most vulnerable to poverty, with 65 males (83.3%) and 5 females (100.0%) in their respective age groups living below the poverty level.
| Age Bracket | Male | Female |
| Under 5 Years | 27 (36.5%) | 9 (29.0%) |
| 5 Years | 0 (0.0%) | 11 (50.0%) |
| 6 to 11 Years | 24 (34.3%) | 51 (39.2%) |
| 12 to 14 Years | 65 (83.3%) | 10 (30.3%) |
| 15 Years | 0 (0.0%) | 5 (100.0%) |
| 16 and 17 Years | 14 (10.1%) | 21 (53.8%) |
| 18 to 24 Years | 0 (0.0%) | 8 (12.9%) |
| 25 to 34 Years | 41 (31.5%) | 36 (29.7%) |
| 35 to 44 Years | 31 (33.3%) | 34 (66.7%) |
| 45 to 54 Years | 45 (19.8%) | 31 (24.2%) |
| 55 to 64 Years | 16 (20.3%) | 13 (15.1%) |
| 65 to 74 Years | 16 (34.0%) | 13 (32.5%) |
| 75 Years and over | 0 (0.0%) | 2 (2.7%) |
| Total | 279 (28.0%) | 244 (29.7%) |
Income Above Poverty by Sex and Age in Collinsville
According to the poverty statistics in Collinsville, males aged 18 to 24 years and females aged 75 years and over are the age groups that are most secure financially, with 100.0% of males and 97.3% of females in these age groups living above the poverty line.
| Age Bracket | Male | Female |
| Under 5 Years | 47 (63.5%) | 22 (71.0%) |
| 5 Years | 0 (0.0%) | 11 (50.0%) |
| 6 to 11 Years | 46 (65.7%) | 79 (60.8%) |
| 12 to 14 Years | 13 (16.7%) | 23 (69.7%) |
| 15 Years | 0 (0.0%) | 0 (0.0%) |
| 16 and 17 Years | 124 (89.9%) | 18 (46.2%) |
| 18 to 24 Years | 33 (100.0%) | 54 (87.1%) |
| 25 to 34 Years | 89 (68.5%) | 85 (70.3%) |
| 35 to 44 Years | 62 (66.7%) | 17 (33.3%) |
| 45 to 54 Years | 182 (80.2%) | 97 (75.8%) |
| 55 to 64 Years | 63 (79.7%) | 73 (84.9%) |
| 65 to 74 Years | 31 (66.0%) | 27 (67.5%) |
| 75 Years and over | 28 (100.0%) | 71 (97.3%) |
| Total | 718 (72.0%) | 577 (70.3%) |
Income Below Poverty Among Married-Couple Families in Collinsville
The poverty statistics for married-couple families in Collinsville show that 14.5% or 48 of the total 331 families live below the poverty line. Families with 3 or 4 children have the highest poverty rate of 23.0%, comprising of 14 families. On the other hand, families with no children have the lowest poverty rate of 3.1%, which includes 4 families.
| Children | Above Poverty | Below Poverty |
| No Children | 125 (96.9%) | 4 (3.1%) |
| 1 or 2 Children | 111 (78.7%) | 30 (21.3%) |
| 3 or 4 Children | 47 (77.0%) | 14 (23.0%) |
| 5 or more Children | 0 (0.0%) | 0 (0.0%) |
| Total | 283 (85.5%) | 48 (14.5%) |
Income Below Poverty Among Single-Parent Households in Collinsville
According to the poverty data in Collinsville, 55.0% or 22 single-father households and 61.5% or 40 single-mother households are living below the poverty line. Among single-father households, those with 3 or 4 children have the highest poverty rate, with 13 households (100.0%) experiencing poverty. Likewise, among single-mother households, those with 1 or 2 children have the highest poverty rate, with 40 households (75.5%) falling below the poverty line.
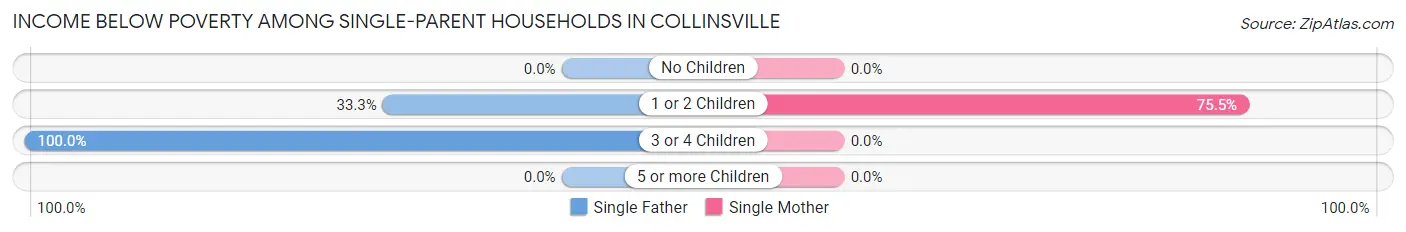
| Children | Single Father | Single Mother |
| No Children | 0 (0.0%) | 0 (0.0%) |
| 1 or 2 Children | 9 (33.3%) | 40 (75.5%) |
| 3 or 4 Children | 13 (100.0%) | 0 (0.0%) |
| 5 or more Children | 0 (0.0%) | 0 (0.0%) |
| Total | 22 (55.0%) | 40 (61.5%) |
Income Below Poverty Among Married-Couple vs Single-Parent Households in Collinsville
The poverty data for Collinsville shows that 48 of the married-couple family households (14.5%) and 62 of the single-parent households (59.1%) are living below the poverty level. Within the married-couple family households, those with 3 or 4 children have the highest poverty rate, with 14 households (23.0%) falling below the poverty line. Among the single-parent households, those with 3 or 4 children have the highest poverty rate, with 13 household (100.0%) living below poverty.
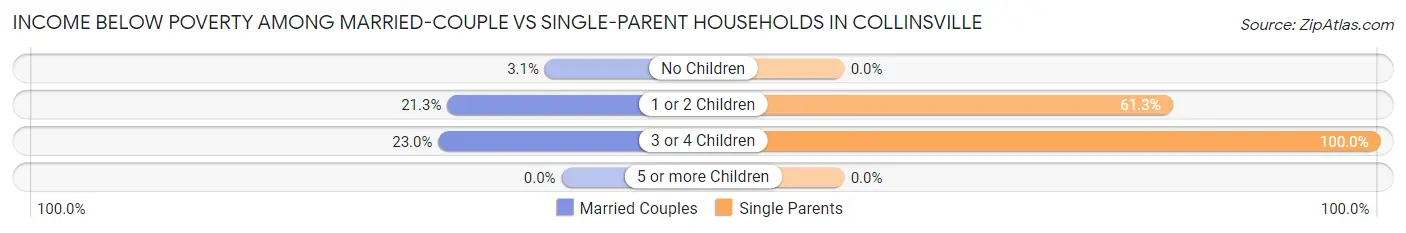
| Children | Married-Couple Families | Single-Parent Households |
| No Children | 4 (3.1%) | 0 (0.0%) |
| 1 or 2 Children | 30 (21.3%) | 49 (61.3%) |
| 3 or 4 Children | 14 (23.0%) | 13 (100.0%) |
| 5 or more Children | 0 (0.0%) | 0 (0.0%) |
| Total | 48 (14.5%) | 62 (59.1%) |
Race in Collinsville
The most populous races in Collinsville are Hispanic or Latino (1,088 | 53.4%), White / Caucasian (935 | 45.9%), and Some other Race (557 | 27.4%).
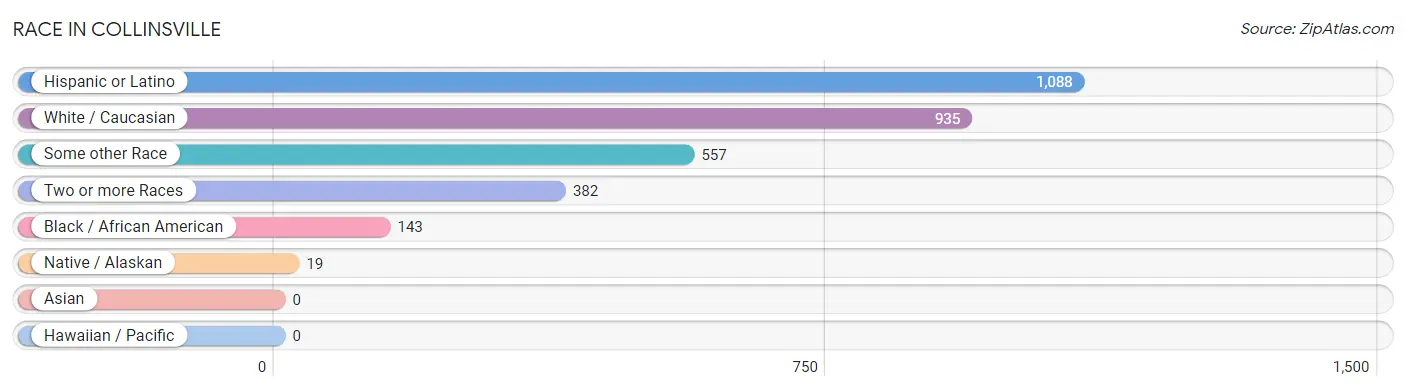
| Race | # Population | % Population |
| Asian | 0 | 0.0% |
| Black / African American | 143 | 7.0% |
| Hawaiian / Pacific | 0 | 0.0% |
| Hispanic or Latino | 1,088 | 53.4% |
| Native / Alaskan | 19 | 0.9% |
| White / Caucasian | 935 | 45.9% |
| Two or more Races | 382 | 18.8% |
| Some other Race | 557 | 27.4% |
| Total | 2,036 | 100.0% |
Ancestry in Collinsville
The most populous ancestries reported in Collinsville are Mexican (683 | 33.6%), Central American (369 | 18.1%), Guatemalan (357 | 17.5%), American (249 | 12.2%), and Irish (106 | 5.2%), together accounting for 86.6% of all Collinsville residents.
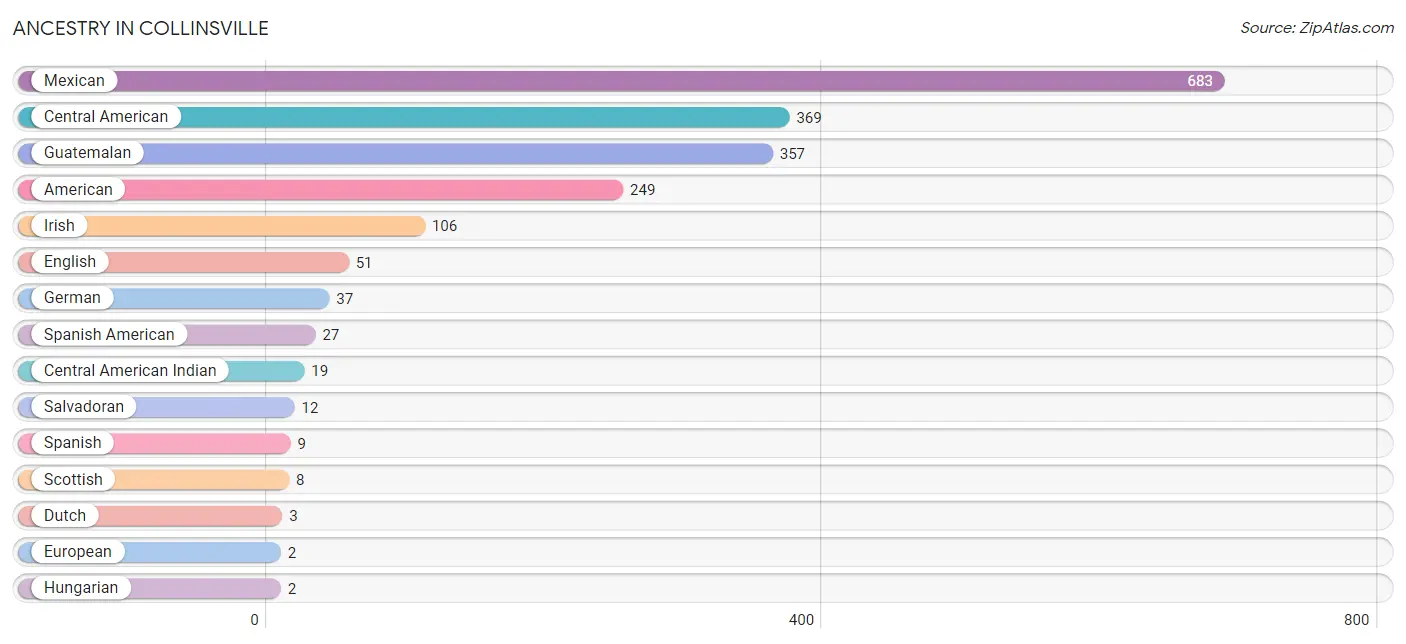
| Ancestry | # Population | % Population |
| American | 249 | 12.2% |
| Central American | 369 | 18.1% |
| Central American Indian | 19 | 0.9% |
| Dutch | 3 | 0.2% |
| English | 51 | 2.5% |
| European | 2 | 0.1% |
| German | 37 | 1.8% |
| Guatemalan | 357 | 17.5% |
| Hungarian | 2 | 0.1% |
| Irish | 106 | 5.2% |
| Mexican | 683 | 33.6% |
| Salvadoran | 12 | 0.6% |
| Scottish | 8 | 0.4% |
| Spanish | 9 | 0.4% |
| Spanish American | 27 | 1.3% | View All 15 Rows |
Immigrants in Collinsville
The most numerous immigrant groups reported in Collinsville came from Central America (589 | 28.9%), Latin America (589 | 28.9%), Mexico (352 | 17.3%), Guatemala (225 | 11.1%), and El Salvador (12 | 0.6%), together accounting for 86.8% of all Collinsville residents.
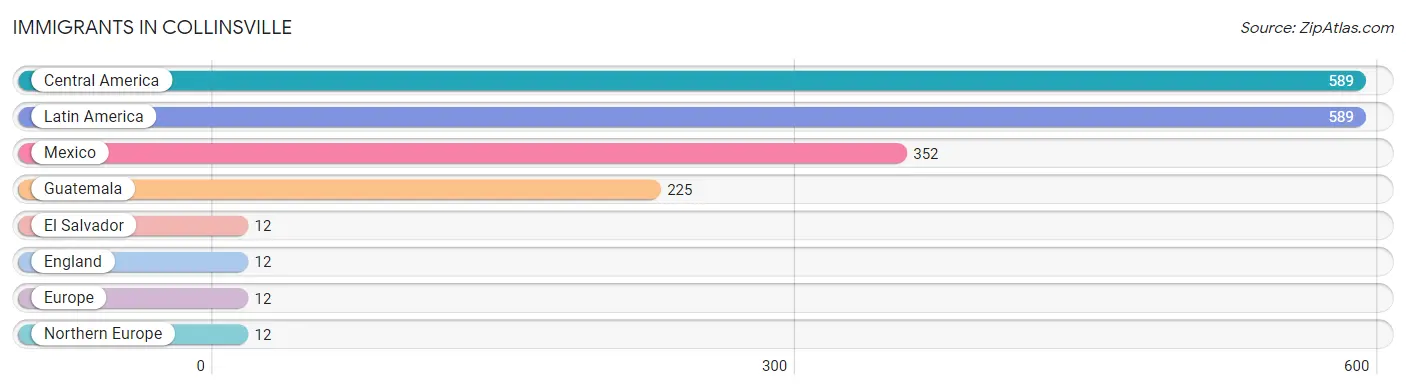
| Immigration Origin | # Population | % Population |
| Central America | 589 | 28.9% |
| El Salvador | 12 | 0.6% |
| England | 12 | 0.6% |
| Europe | 12 | 0.6% |
| Guatemala | 225 | 11.1% |
| Latin America | 589 | 28.9% |
| Mexico | 352 | 17.3% |
| Northern Europe | 12 | 0.6% | View All 8 Rows |
Sex and Age in Collinsville
Sex and Age in Collinsville
The most populous age groups in Collinsville are 15 to 19 Years (152 | 13.8%) for men and 5 to 9 Years (127 | 13.6%) for women.
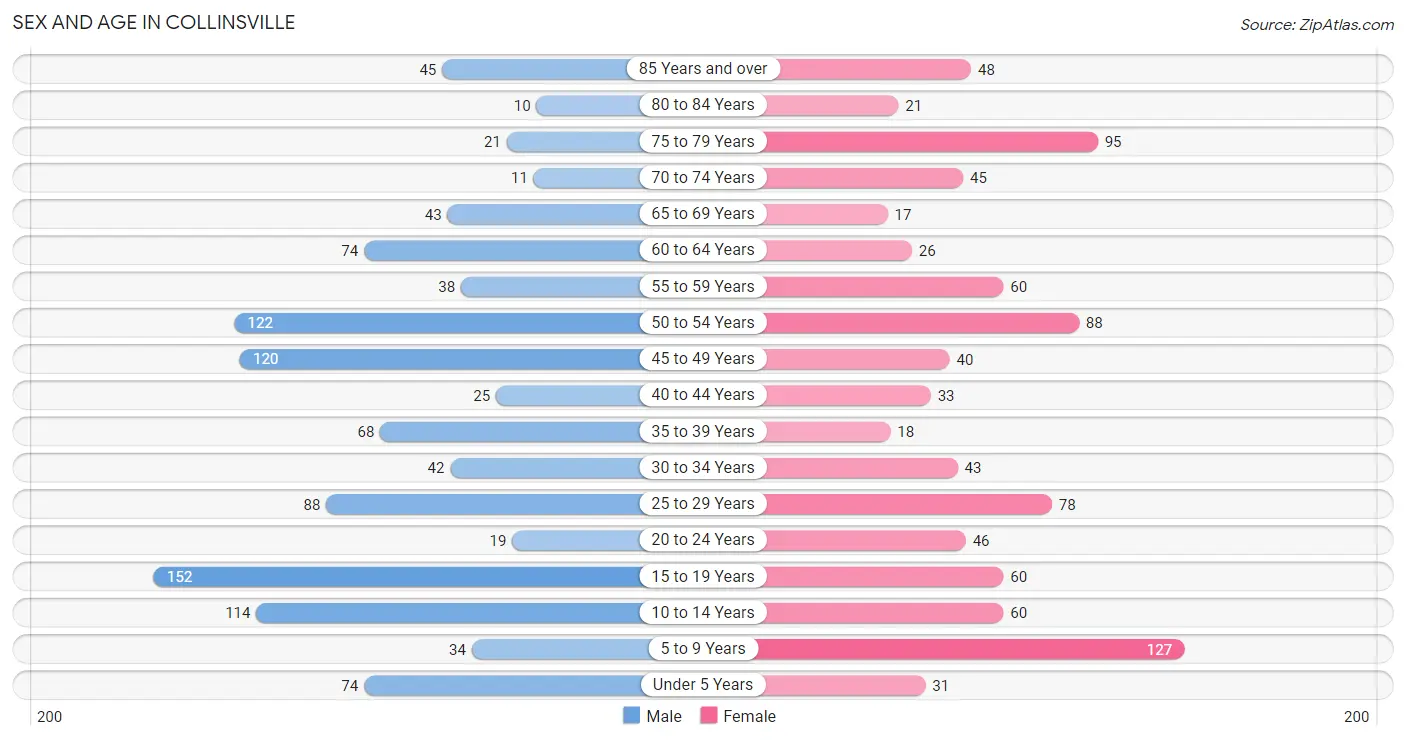
| Age Bracket | Male | Female |
| Under 5 Years | 74 (6.7%) | 31 (3.3%) |
| 5 to 9 Years | 34 (3.1%) | 127 (13.6%) |
| 10 to 14 Years | 114 (10.4%) | 60 (6.4%) |
| 15 to 19 Years | 152 (13.8%) | 60 (6.4%) |
| 20 to 24 Years | 19 (1.7%) | 46 (4.9%) |
| 25 to 29 Years | 88 (8.0%) | 78 (8.3%) |
| 30 to 34 Years | 42 (3.8%) | 43 (4.6%) |
| 35 to 39 Years | 68 (6.2%) | 18 (1.9%) |
| 40 to 44 Years | 25 (2.3%) | 33 (3.5%) |
| 45 to 49 Years | 120 (10.9%) | 40 (4.3%) |
| 50 to 54 Years | 122 (11.1%) | 88 (9.4%) |
| 55 to 59 Years | 38 (3.5%) | 60 (6.4%) |
| 60 to 64 Years | 74 (6.7%) | 26 (2.8%) |
| 65 to 69 Years | 43 (3.9%) | 17 (1.8%) |
| 70 to 74 Years | 11 (1.0%) | 45 (4.8%) |
| 75 to 79 Years | 21 (1.9%) | 95 (10.2%) |
| 80 to 84 Years | 10 (0.9%) | 21 (2.2%) |
| 85 Years and over | 45 (4.1%) | 48 (5.1%) |
| Total | 1,100 (100.0%) | 936 (100.0%) |
Families and Households in Collinsville
Median Family Size in Collinsville
The median family size in Collinsville is 3.50 persons per family, with single female/mother families (65 | 14.9%) accounting for the largest median family size of 4.28 persons per family. On the other hand, single male/father families (40 | 9.2%) represent the smallest median family size with 3.08 persons per family.
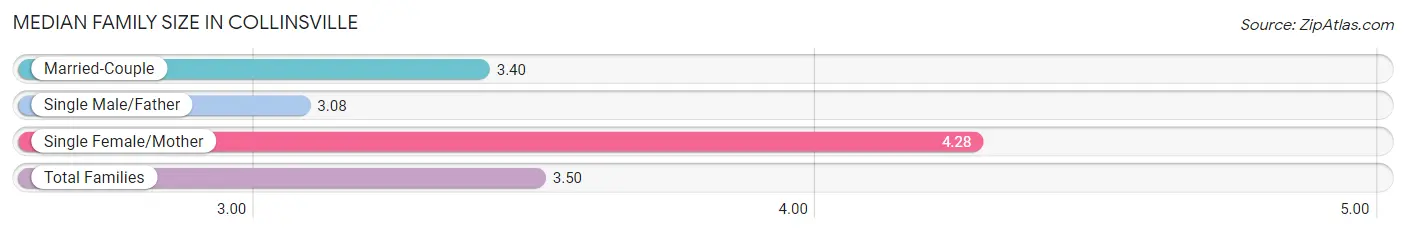
| Family Type | # Families | Family Size |
| Married-Couple | 331 (75.9%) | 3.40 |
| Single Male/Father | 40 (9.2%) | 3.08 |
| Single Female/Mother | 65 (14.9%) | 4.28 |
| Total Families | 436 (100.0%) | 3.50 |
Median Household Size in Collinsville
The median household size in Collinsville is 2.88 persons per household, with single female/mother households (65 | 10.3%) accounting for the largest median household size of 4.6 persons per household. non-family households (197 | 31.1%) represent the smallest median household size with 1.13 persons per household.
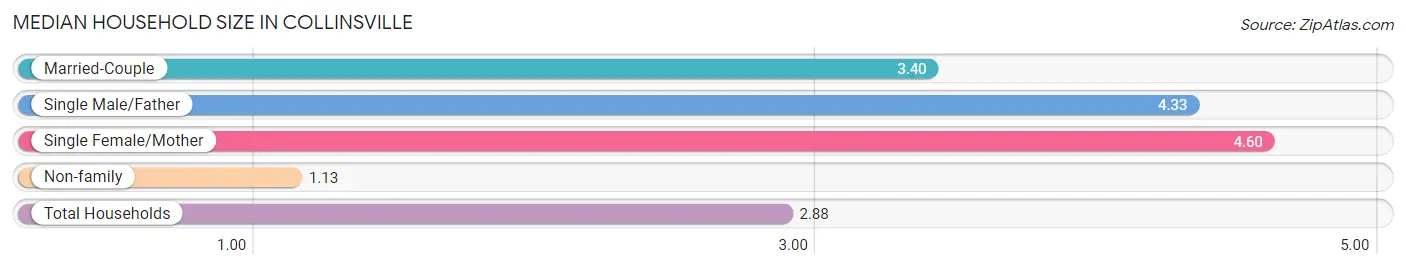
| Household Type | # Households | Household Size |
| Married-Couple | 331 (52.3%) | 3.40 |
| Single Male/Father | 40 (6.3%) | 4.33 |
| Single Female/Mother | 65 (10.3%) | 4.60 |
| Non-family | 197 (31.1%) | 1.13 |
| Total Households | 633 (100.0%) | 2.88 |
Household Size by Marriage Status in Collinsville
Out of a total of 633 households in Collinsville, 436 (68.9%) are family households, while 197 (31.1%) are nonfamily households. The most numerous type of family households are 3-person households, comprising 158, and the most common type of nonfamily households are 1-person households, comprising 190.
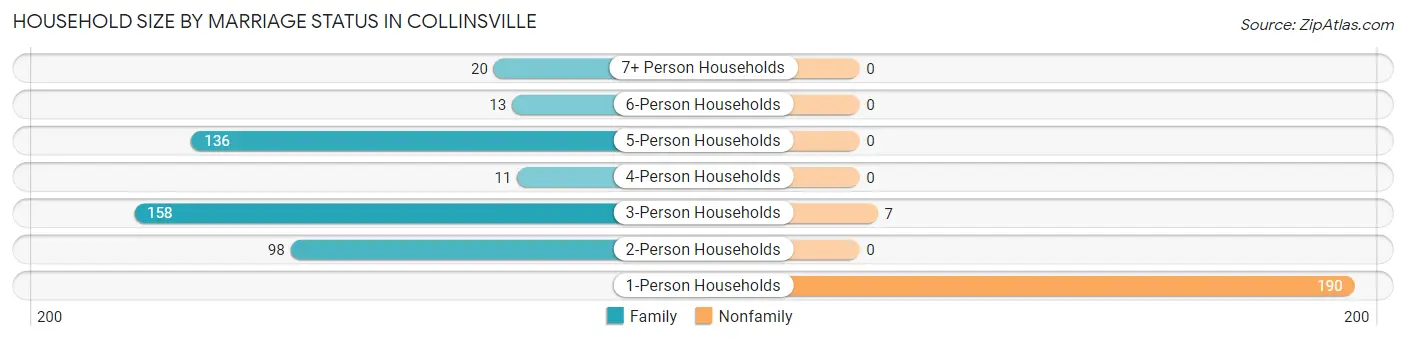
| Household Size | Family Households | Nonfamily Households |
| 1-Person Households | - | 190 (30.0%) |
| 2-Person Households | 98 (15.5%) | 0 (0.0%) |
| 3-Person Households | 158 (25.0%) | 7 (1.1%) |
| 4-Person Households | 11 (1.7%) | 0 (0.0%) |
| 5-Person Households | 136 (21.5%) | 0 (0.0%) |
| 6-Person Households | 13 (2.1%) | 0 (0.0%) |
| 7+ Person Households | 20 (3.2%) | 0 (0.0%) |
| Total | 436 (68.9%) | 197 (31.1%) |
Female Fertility in Collinsville
Fertility by Age in Collinsville
Average fertility rate in Collinsville is 28.0 births per 1,000 women. Women in the age bracket of 20 to 34 years have the highest fertility rate with 36.0 births per 1,000 women. Women in the age bracket of 20 to 34 years acount for 66.7% of all women with births.
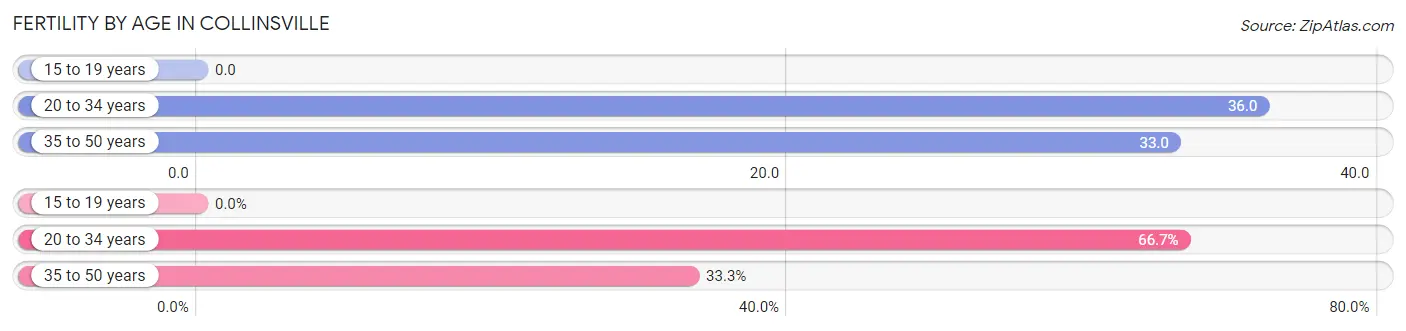
| Age Bracket | Women with Births | Births / 1,000 Women |
| 15 to 19 years | 0 (0.0%) | 0.0 |
| 20 to 34 years | 6 (66.7%) | 36.0 |
| 35 to 50 years | 3 (33.3%) | 33.0 |
| Total | 9 (100.0%) | 28.0 |
Fertility by Age by Marriage Status in Collinsville
77.8% of women with births (9) in Collinsville are married. The highest percentage of unmarried women with births falls into 20 to 34 years age bracket with 33.3% of them unmarried at the time of birth, while the lowest percentage of unmarried women with births belong to 35 to 50 years age bracket with 0.0% of them unmarried.
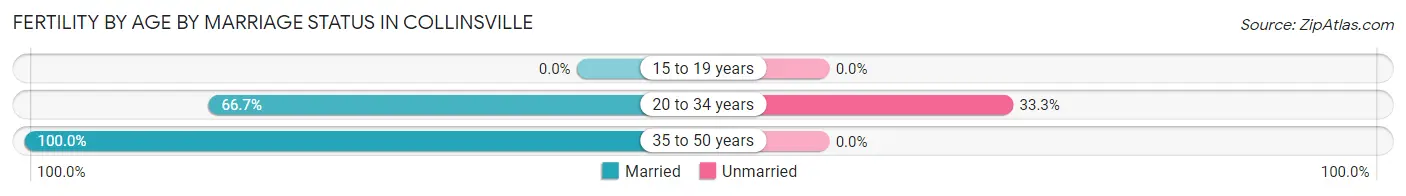
| Age Bracket | Married | Unmarried |
| 15 to 19 years | 0 (0.0%) | 0 (0.0%) |
| 20 to 34 years | 4 (66.7%) | 2 (33.3%) |
| 35 to 50 years | 3 (100.0%) | 0 (0.0%) |
| Total | 7 (77.8%) | 2 (22.2%) |
Fertility by Education in Collinsville
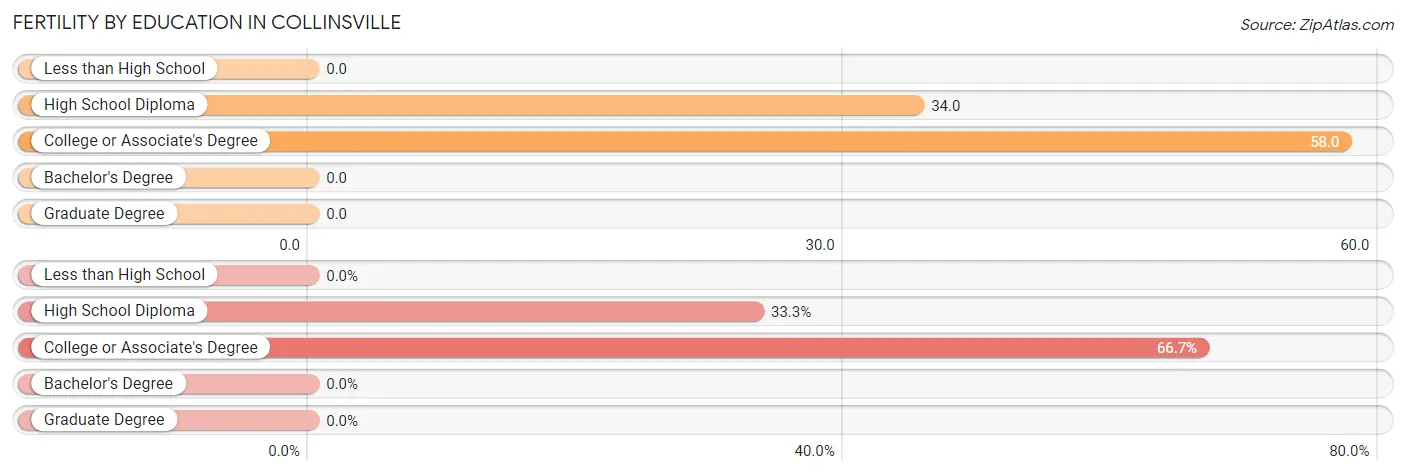
| Educational Attainment | Women with Births | Births / 1,000 Women |
| Less than High School | 0 (0.0%) | 0.0 |
| High School Diploma | 3 (33.3%) | 34.0 |
| College or Associate's Degree | 6 (66.7%) | 58.0 |
| Bachelor's Degree | 0 (0.0%) | 0.0 |
| Graduate Degree | 0 (0.0%) | 0.0 |
| Total | 9 (100.0%) | 28.0 |
Fertility by Education by Marriage Status in Collinsville
22.2% of women with births in Collinsville are unmarried. Women with the educational attainment of high school diploma are most likely to be married with 100.0% of them married at childbirth, while women with the educational attainment of college or associate's degree are least likely to be married with 33.3% of them unmarried at childbirth.
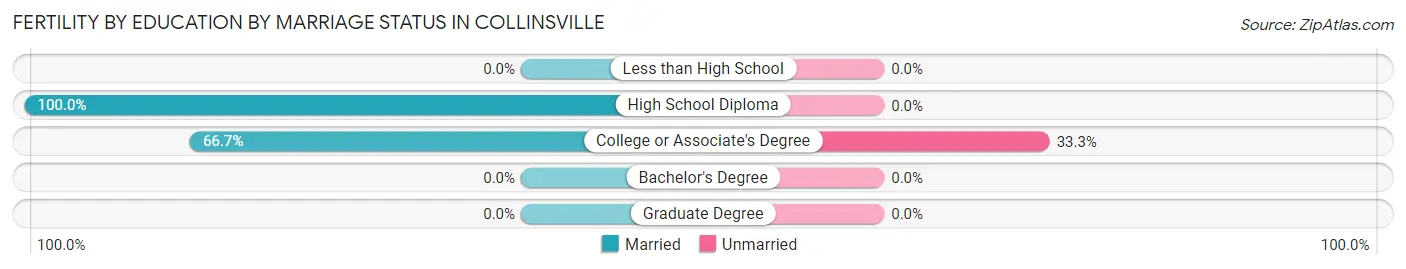
| Educational Attainment | Married | Unmarried |
| Less than High School | 0 (0.0%) | 0 (0.0%) |
| High School Diploma | 3 (100.0%) | 0 (0.0%) |
| College or Associate's Degree | 4 (66.7%) | 2 (33.3%) |
| Bachelor's Degree | 0 (0.0%) | 0 (0.0%) |
| Graduate Degree | 0 (0.0%) | 0 (0.0%) |
| Total | 7 (77.8%) | 2 (22.2%) |
Employment Characteristics in Collinsville
Employment by Class of Employer in Collinsville
Among the 724 employed individuals in Collinsville, private company employees (595 | 82.2%), self-employed (not incorporated) (67 | 9.2%), and state government employees (25 | 3.5%) make up the most common classes of employment.
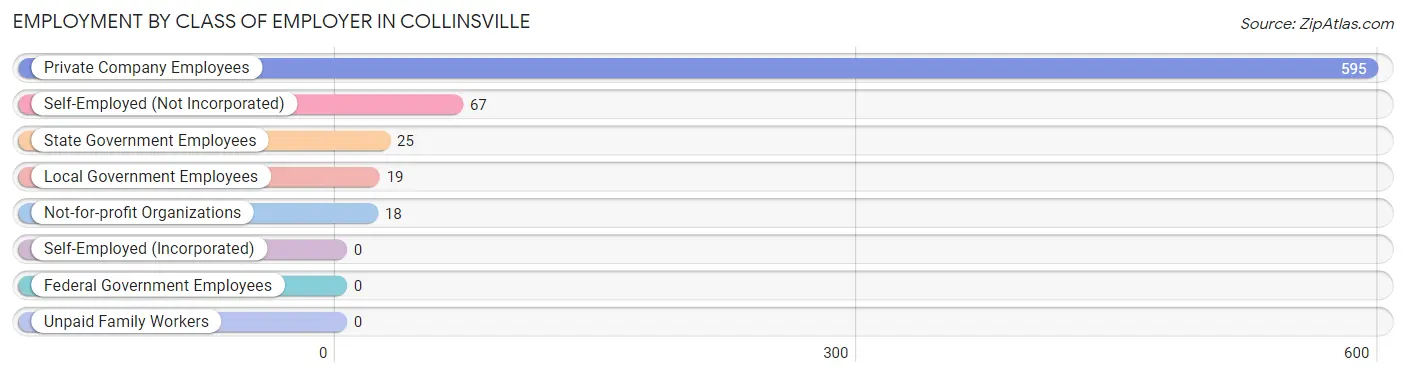
| Employer Class | # Employees | % Employees |
| Private Company Employees | 595 | 82.2% |
| Self-Employed (Incorporated) | 0 | 0.0% |
| Self-Employed (Not Incorporated) | 67 | 9.2% |
| Not-for-profit Organizations | 18 | 2.5% |
| Local Government Employees | 19 | 2.6% |
| State Government Employees | 25 | 3.5% |
| Federal Government Employees | 0 | 0.0% |
| Unpaid Family Workers | 0 | 0.0% |
| Total | 724 | 100.0% |
Employment Status by Age in Collinsville
According to the labor force statistics for Collinsville, out of the total population over 16 years of age (1,591), 46.6% or 741 individuals are in the labor force, with 1.3% or 10 of them unemployed. The age group with the highest labor force participation rate is 25 to 29 years, with 97.0% or 161 individuals in the labor force. Within the labor force, the 60 to 64 years age range has the highest percentage of unemployed individuals, with 14.3% or 10 of them being unemployed.
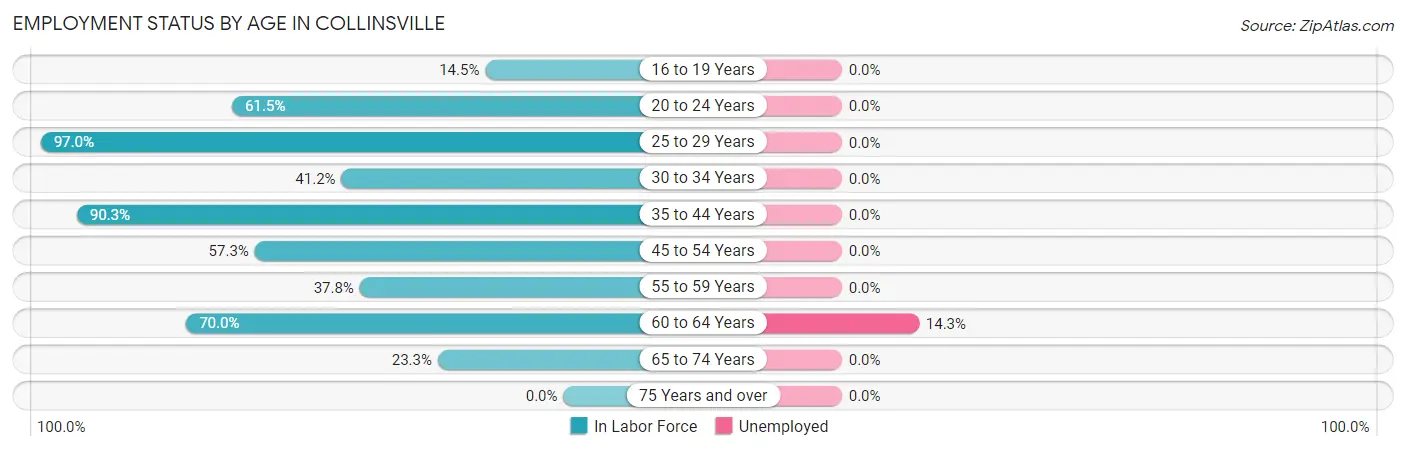
| Age Bracket | In Labor Force | Unemployed |
| 16 to 19 Years | 30 (14.5%) | 0 (0.0%) |
| 20 to 24 Years | 40 (61.5%) | 0 (0.0%) |
| 25 to 29 Years | 161 (97.0%) | 0 (0.0%) |
| 30 to 34 Years | 35 (41.2%) | 0 (0.0%) |
| 35 to 44 Years | 130 (90.3%) | 0 (0.0%) |
| 45 to 54 Years | 212 (57.3%) | 0 (0.0%) |
| 55 to 59 Years | 37 (37.8%) | 0 (0.0%) |
| 60 to 64 Years | 70 (70.0%) | 10 (14.3%) |
| 65 to 74 Years | 27 (23.3%) | 0 (0.0%) |
| 75 Years and over | 0 (0.0%) | 0 (0.0%) |
| Total | 741 (46.6%) | 10 (1.3%) |
Employment Status by Educational Attainment in Collinsville
According to labor force statistics for Collinsville, 67.0% of individuals (645) out of the total population between 25 and 64 years of age (963) are in the labor force, with 1.6% or 10 of them being unemployed. The group with the highest labor force participation rate are those with the educational attainment of bachelor's degree or higher, with 88.9% or 40 individuals in the labor force. Within the labor force, individuals with high school diploma education have the highest percentage of unemployment, with 5.6% or 10 of them being unemployed.
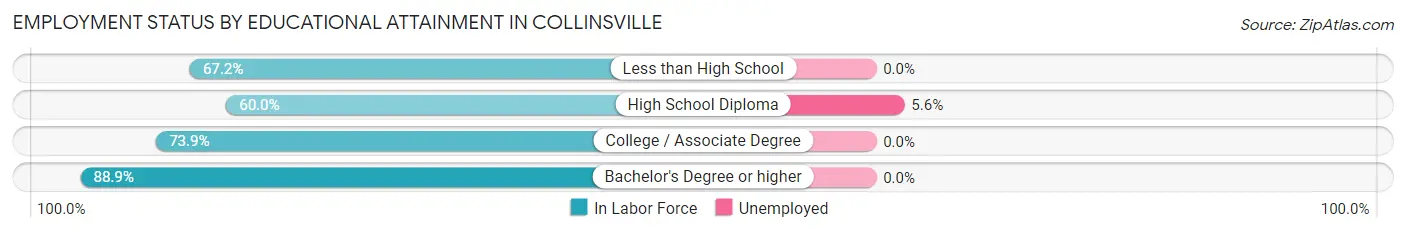
| Educational Attainment | In Labor Force | Unemployed |
| Less than High School | 323 (67.2%) | 0 (0.0%) |
| High School Diploma | 177 (60.0%) | 17 (5.6%) |
| College / Associate Degree | 105 (73.9%) | 0 (0.0%) |
| Bachelor's Degree or higher | 40 (88.9%) | 0 (0.0%) |
| Total | 645 (67.0%) | 15 (1.6%) |
Employment Occupations by Sex in Collinsville
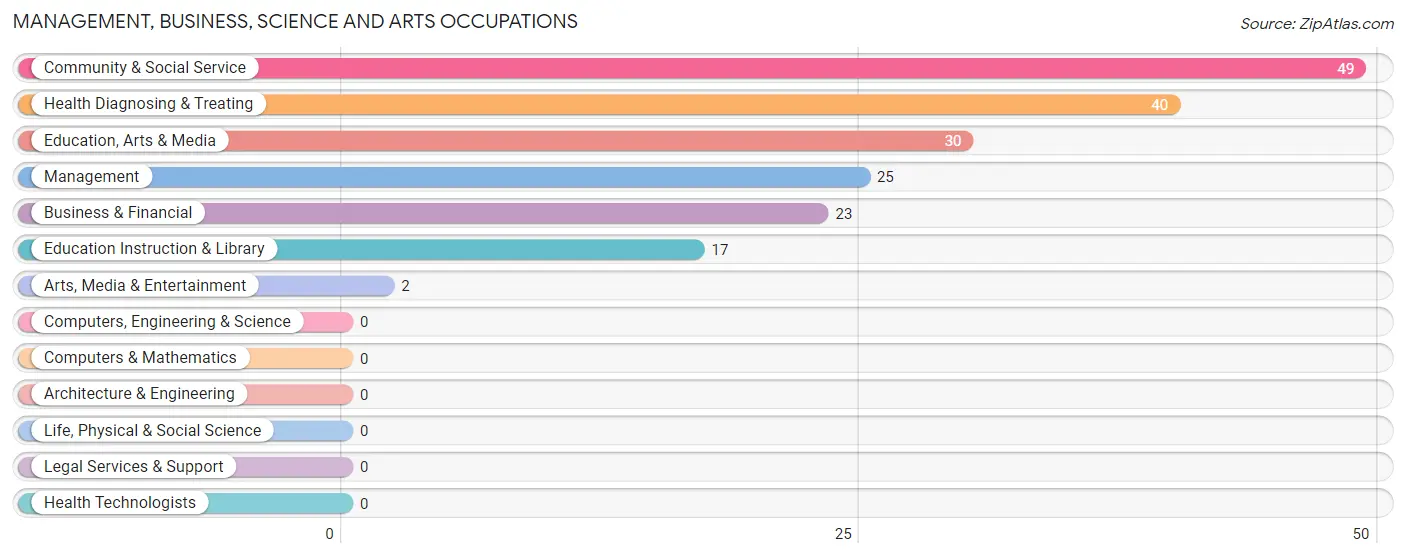
Management, Business, Science and Arts Occupations
The most common Management, Business, Science and Arts occupations in Collinsville are Community & Social Service (49 | 6.7%), Health Diagnosing & Treating (40 | 5.5%), Education, Arts & Media (30 | 4.1%), Management (25 | 3.4%), and Business & Financial (23 | 3.1%).
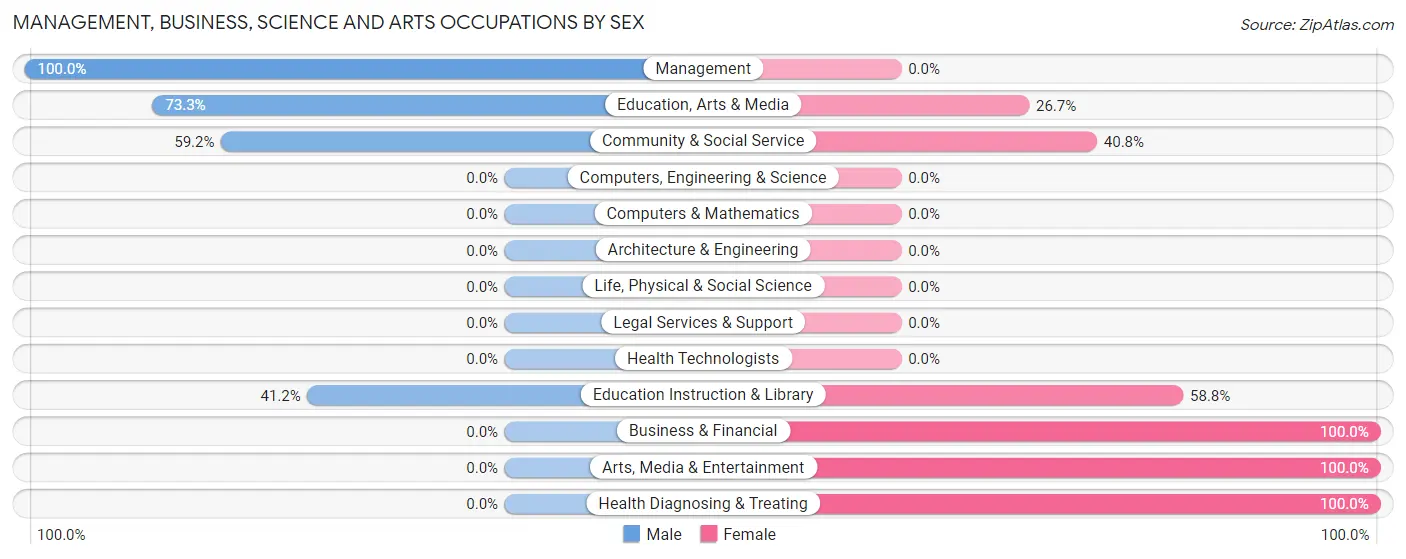
Management, Business, Science and Arts Occupations by Sex
Within the Management, Business, Science and Arts occupations in Collinsville, the most male-oriented occupations are Management (100.0%), Education, Arts & Media (73.3%), and Community & Social Service (59.2%), while the most female-oriented occupations are Business & Financial (100.0%), Arts, Media & Entertainment (100.0%), and Health Diagnosing & Treating (100.0%).
| Occupation | Male | Female |
| Management | 25 (100.0%) | 0 (0.0%) |
| Business & Financial | 0 (0.0%) | 23 (100.0%) |
| Computers, Engineering & Science | 0 (0.0%) | 0 (0.0%) |
| Computers & Mathematics | 0 (0.0%) | 0 (0.0%) |
| Architecture & Engineering | 0 (0.0%) | 0 (0.0%) |
| Life, Physical & Social Science | 0 (0.0%) | 0 (0.0%) |
| Community & Social Service | 29 (59.2%) | 20 (40.8%) |
| Education, Arts & Media | 22 (73.3%) | 8 (26.7%) |
| Legal Services & Support | 0 (0.0%) | 0 (0.0%) |
| Education Instruction & Library | 7 (41.2%) | 10 (58.8%) |
| Arts, Media & Entertainment | 0 (0.0%) | 2 (100.0%) |
| Health Diagnosing & Treating | 0 (0.0%) | 40 (100.0%) |
| Health Technologists | 0 (0.0%) | 0 (0.0%) |
| Total (Category) | 54 (39.4%) | 83 (60.6%) |
| Total (Overall) | 500 (68.3%) | 232 (31.7%) |
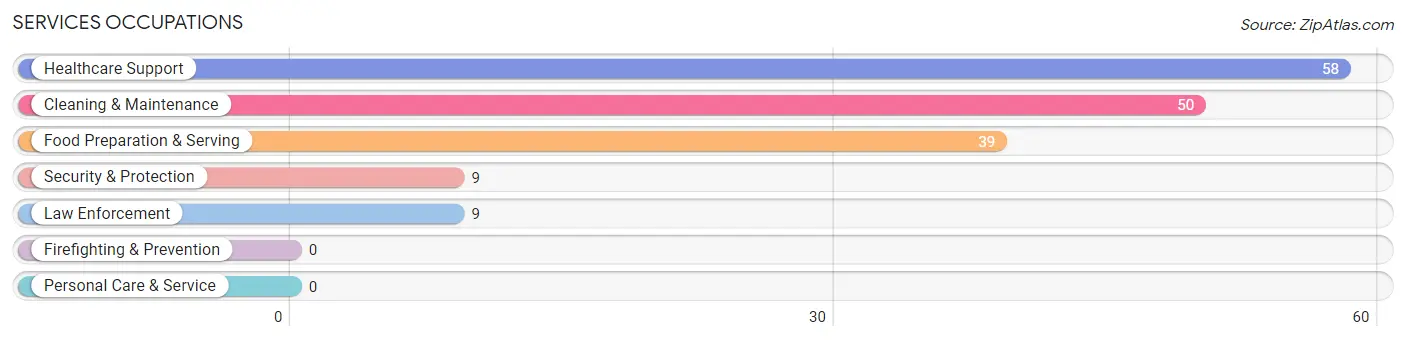
Services Occupations
The most common Services occupations in Collinsville are Healthcare Support (58 | 7.9%), Cleaning & Maintenance (50 | 6.8%), Food Preparation & Serving (39 | 5.3%), Security & Protection (9 | 1.2%), and Law Enforcement (9 | 1.2%).
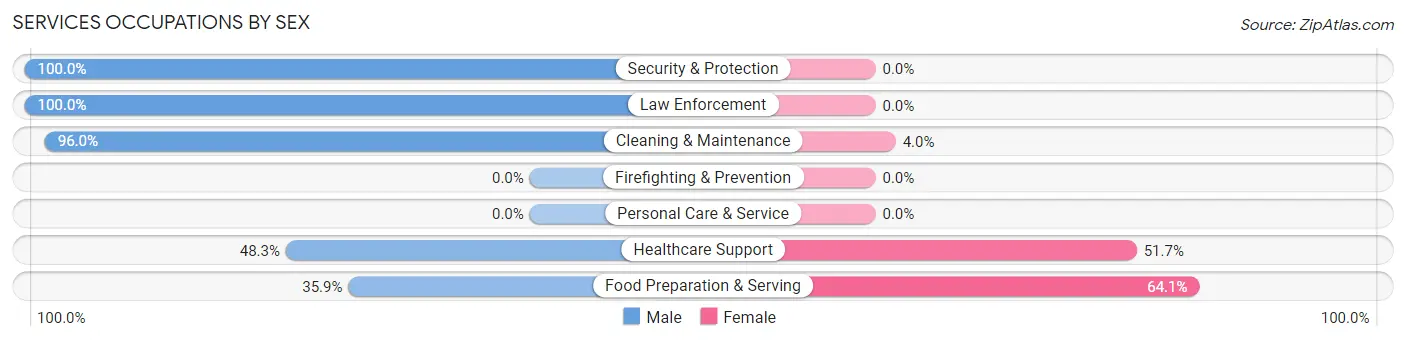
Services Occupations by Sex
Within the Services occupations in Collinsville, the most male-oriented occupations are Security & Protection (100.0%), Law Enforcement (100.0%), and Cleaning & Maintenance (96.0%), while the most female-oriented occupations are Food Preparation & Serving (64.1%), Healthcare Support (51.7%), and Cleaning & Maintenance (4.0%).
| Occupation | Male | Female |
| Healthcare Support | 28 (48.3%) | 30 (51.7%) |
| Security & Protection | 9 (100.0%) | 0 (0.0%) |
| Firefighting & Prevention | 0 (0.0%) | 0 (0.0%) |
| Law Enforcement | 9 (100.0%) | 0 (0.0%) |
| Food Preparation & Serving | 14 (35.9%) | 25 (64.1%) |
| Cleaning & Maintenance | 48 (96.0%) | 2 (4.0%) |
| Personal Care & Service | 0 (0.0%) | 0 (0.0%) |
| Total (Category) | 99 (63.5%) | 57 (36.5%) |
| Total (Overall) | 500 (68.3%) | 232 (31.7%) |
Sales and Office Occupations
The most common Sales and Office occupations in Collinsville are Office & Administration (62 | 8.5%), and Sales & Related (17 | 2.3%).
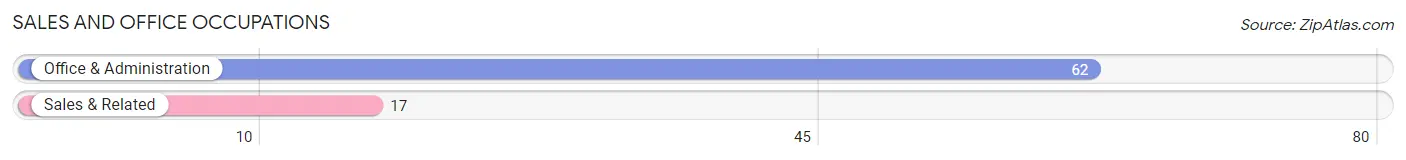
Sales and Office Occupations by Sex

| Occupation | Male | Female |
| Sales & Related | 7 (41.2%) | 10 (58.8%) |
| Office & Administration | 0 (0.0%) | 62 (100.0%) |
| Total (Category) | 7 (8.9%) | 72 (91.1%) |
| Total (Overall) | 500 (68.3%) | 232 (31.7%) |
Natural Resources, Construction and Maintenance Occupations
The most common Natural Resources, Construction and Maintenance occupations in Collinsville are Installation, Maintenance & Repair (106 | 14.5%), Construction & Extraction (73 | 10.0%), and Farming, Fishing & Forestry (12 | 1.6%).
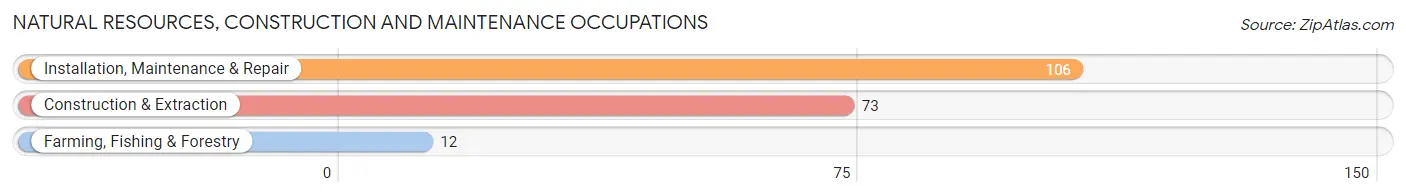
Natural Resources, Construction and Maintenance Occupations by Sex
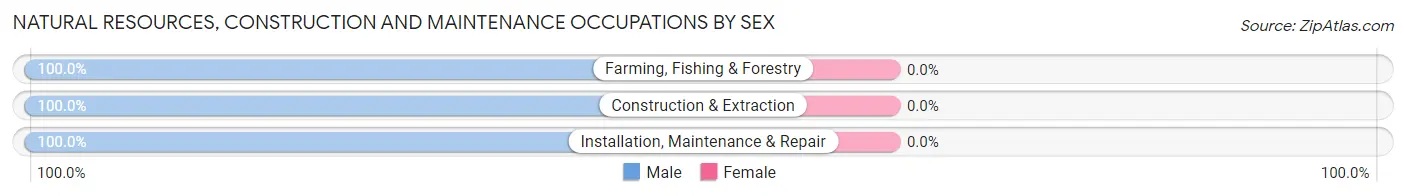
| Occupation | Male | Female |
| Farming, Fishing & Forestry | 12 (100.0%) | 0 (0.0%) |
| Construction & Extraction | 73 (100.0%) | 0 (0.0%) |
| Installation, Maintenance & Repair | 106 (100.0%) | 0 (0.0%) |
| Total (Category) | 191 (100.0%) | 0 (0.0%) |
| Total (Overall) | 500 (68.3%) | 232 (31.7%) |
Production, Transportation and Moving Occupations
The most common Production, Transportation and Moving occupations in Collinsville are Production (117 | 16.0%), Material Moving (49 | 6.7%), and Transportation (3 | 0.4%).
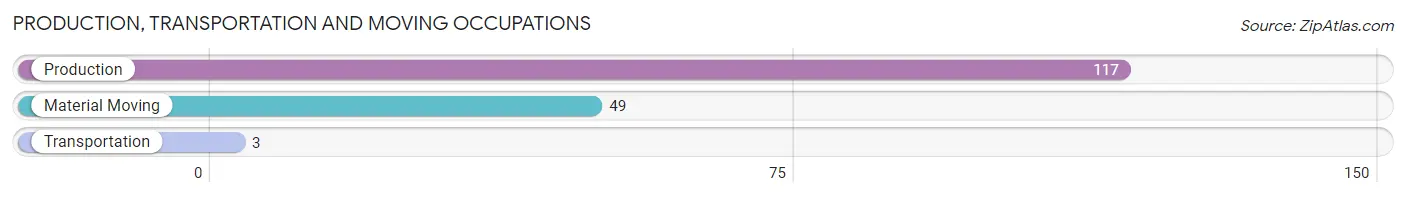
Production, Transportation and Moving Occupations by Sex
| Occupation | Male | Female |
| Production | 97 (82.9%) | 20 (17.1%) |
| Transportation | 3 (100.0%) | 0 (0.0%) |
| Material Moving | 49 (100.0%) | 0 (0.0%) |
| Total (Category) | 149 (88.2%) | 20 (11.8%) |
| Total (Overall) | 500 (68.3%) | 232 (31.7%) |
Employment Industries by Sex in Collinsville
Employment Industries in Collinsville
The major employment industries in Collinsville include Manufacturing (324 | 44.3%), Health Care & Social Assistance (145 | 19.8%), Construction (77 | 10.5%), Retail Trade (35 | 4.8%), and Educational Services (29 | 4.0%).
Employment Industries by Sex in Collinsville
The Collinsville industries that see more men than women are Agriculture, Fishing & Hunting (100.0%), Construction (100.0%), and Transportation & Warehousing (100.0%), whereas the industries that tend to have a higher number of women are Finance & Insurance (100.0%), Professional & Scientific (100.0%), and Accommodation & Food Services (100.0%).
| Industry | Male | Female |
| Agriculture, Fishing & Hunting | 28 (100.0%) | 0 (0.0%) |
| Mining, Quarrying, & Extraction | 0 (0.0%) | 0 (0.0%) |
| Construction | 77 (100.0%) | 0 (0.0%) |
| Manufacturing | 256 (79.0%) | 68 (21.0%) |
| Wholesale Trade | 8 (57.1%) | 6 (42.9%) |
| Retail Trade | 28 (80.0%) | 7 (20.0%) |
| Transportation & Warehousing | 6 (100.0%) | 0 (0.0%) |
| Utilities | 0 (0.0%) | 0 (0.0%) |
| Information | 0 (0.0%) | 0 (0.0%) |
| Finance & Insurance | 0 (0.0%) | 13 (100.0%) |
| Real Estate, Rental & Leasing | 0 (0.0%) | 0 (0.0%) |
| Professional & Scientific | 0 (0.0%) | 7 (100.0%) |
| Enterprise Management | 0 (0.0%) | 0 (0.0%) |
| Administrative & Support | 15 (100.0%) | 0 (0.0%) |
| Educational Services | 7 (24.1%) | 22 (75.9%) |
| Health Care & Social Assistance | 60 (41.4%) | 85 (58.6%) |
| Arts, Entertainment & Recreation | 0 (0.0%) | 0 (0.0%) |
| Accommodation & Food Services | 0 (0.0%) | 22 (100.0%) |
| Public Administration | 9 (100.0%) | 0 (0.0%) |
| Total | 500 (68.3%) | 232 (31.7%) |
Education in Collinsville
School Enrollment in Collinsville
The most common levels of schooling among the 551 students in Collinsville are high school (188 | 34.1%), middle school (158 | 28.7%), and elementary school (132 | 24.0%).
| School Level | # Students | % Students |
| Nursery / Preschool | 23 | 4.2% |
| Kindergarten | 18 | 3.3% |
| Elementary School | 132 | 24.0% |
| Middle School | 158 | 28.7% |
| High School | 188 | 34.1% |
| College / Undergraduate | 32 | 5.8% |
| Graduate / Professional | 0 | 0.0% |
| Total | 551 | 100.0% |
School Enrollment by Age by Funding Source in Collinsville
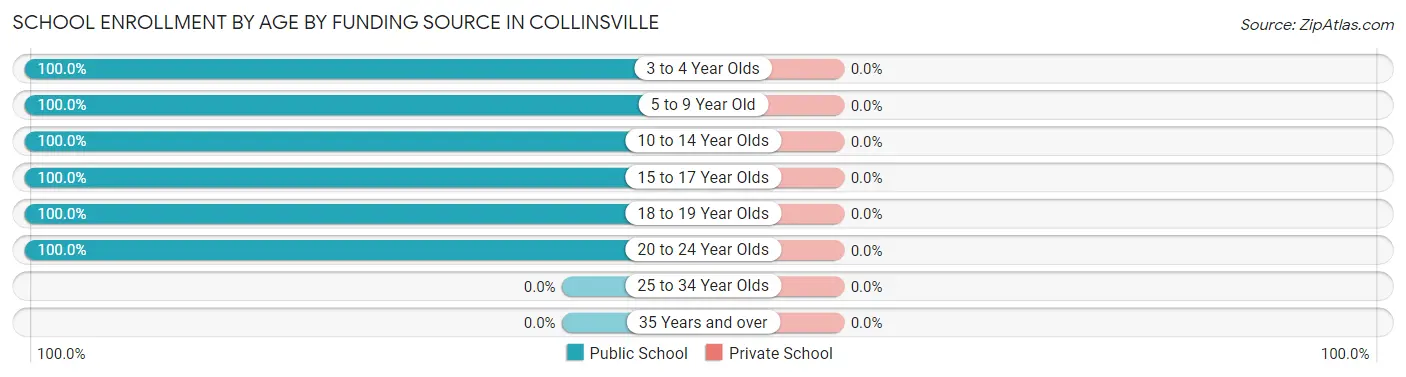
| Age Bracket | Public School | Private School |
| 3 to 4 Year Olds | 23 (100.0%) | 0 (0.0%) |
| 5 to 9 Year Old | 150 (100.0%) | 0 (0.0%) |
| 10 to 14 Year Olds | 161 (100.0%) | 0 (0.0%) |
| 15 to 17 Year Olds | 182 (100.0%) | 0 (0.0%) |
| 18 to 19 Year Olds | 30 (100.0%) | 0 (0.0%) |
| 20 to 24 Year Olds | 5 (100.0%) | 0 (0.0%) |
| 25 to 34 Year Olds | 0 (0.0%) | 0 (0.0%) |
| 35 Years and over | 0 (0.0%) | 0 (0.0%) |
| Total | 551 (100.0%) | 0 (0.0%) |
Educational Attainment by Field of Study in Collinsville
Business (31 | 37.3%), education (18 | 21.7%), liberal arts & history (14 | 16.9%), bio, nature & agricultural (8 | 9.6%), and physical & health sciences (6 | 7.2%) are the most common fields of study among 83 individuals in Collinsville who have obtained a bachelor's degree or higher.
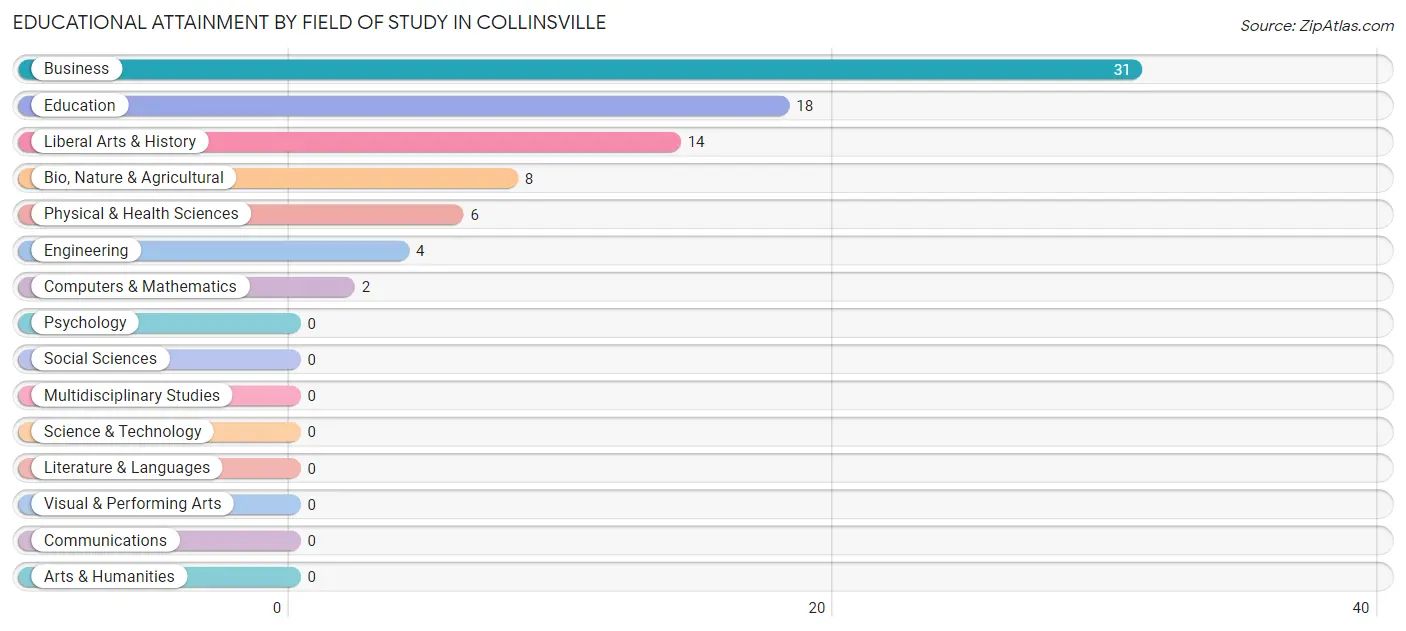
| Field of Study | # Graduates | % Graduates |
| Computers & Mathematics | 2 | 2.4% |
| Bio, Nature & Agricultural | 8 | 9.6% |
| Physical & Health Sciences | 6 | 7.2% |
| Psychology | 0 | 0.0% |
| Social Sciences | 0 | 0.0% |
| Engineering | 4 | 4.8% |
| Multidisciplinary Studies | 0 | 0.0% |
| Science & Technology | 0 | 0.0% |
| Business | 31 | 37.3% |
| Education | 18 | 21.7% |
| Literature & Languages | 0 | 0.0% |
| Liberal Arts & History | 14 | 16.9% |
| Visual & Performing Arts | 0 | 0.0% |
| Communications | 0 | 0.0% |
| Arts & Humanities | 0 | 0.0% |
| Total | 83 | 100.0% |
Transportation & Commute in Collinsville
Vehicle Availability by Sex in Collinsville
The most prevalent vehicle ownership categories in Collinsville are males with 3 vehicles (194, accounting for 38.8%) and females with 3 vehicles (100, making up 86.6%).
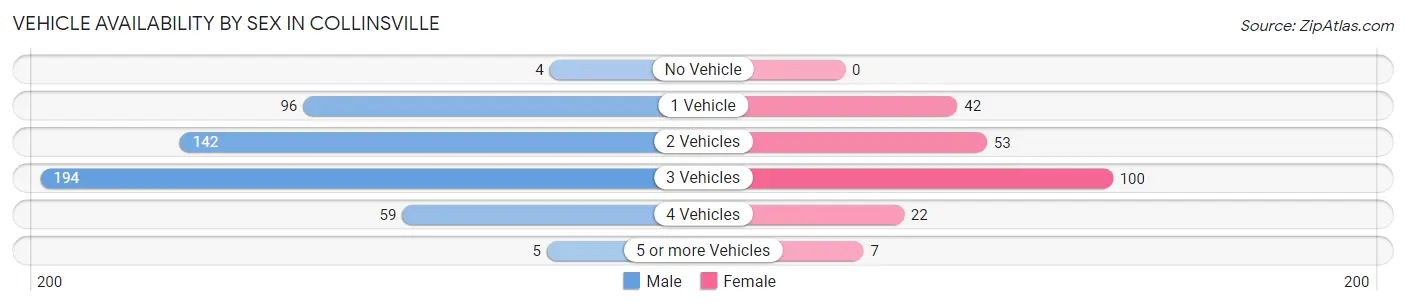
| Vehicles Available | Male | Female |
| No Vehicle | 4 (0.8%) | 0 (0.0%) |
| 1 Vehicle | 96 (19.2%) | 42 (18.8%) |
| 2 Vehicles | 142 (28.4%) | 53 (23.7%) |
| 3 Vehicles | 194 (38.8%) | 100 (44.6%) |
| 4 Vehicles | 59 (11.8%) | 22 (9.8%) |
| 5 or more Vehicles | 5 (1.0%) | 7 (3.1%) |
| Total | 500 (100.0%) | 224 (100.0%) |
Commute Time in Collinsville
The most frequently occuring commute durations in Collinsville are 20 to 24 minutes (172 commuters, 24.0%), 5 to 9 minutes (131 commuters, 18.2%), and 30 to 34 minutes (100 commuters, 13.9%).
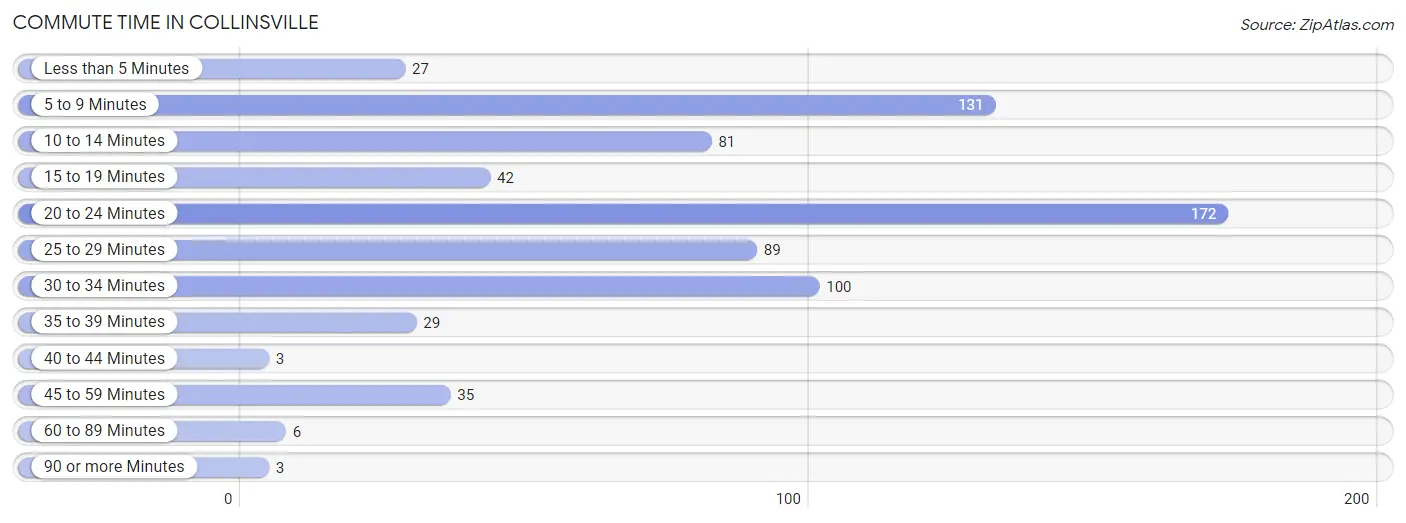
| Commute Time | # Commuters | % Commuters |
| Less than 5 Minutes | 27 | 3.8% |
| 5 to 9 Minutes | 131 | 18.2% |
| 10 to 14 Minutes | 81 | 11.3% |
| 15 to 19 Minutes | 42 | 5.9% |
| 20 to 24 Minutes | 172 | 24.0% |
| 25 to 29 Minutes | 89 | 12.4% |
| 30 to 34 Minutes | 100 | 13.9% |
| 35 to 39 Minutes | 29 | 4.0% |
| 40 to 44 Minutes | 3 | 0.4% |
| 45 to 59 Minutes | 35 | 4.9% |
| 60 to 89 Minutes | 6 | 0.8% |
| 90 or more Minutes | 3 | 0.4% |
Commute Time by Sex in Collinsville
The most common commute times in Collinsville are 20 to 24 minutes (132 commuters, 26.4%) for males and 5 to 9 minutes (62 commuters, 28.4%) for females.
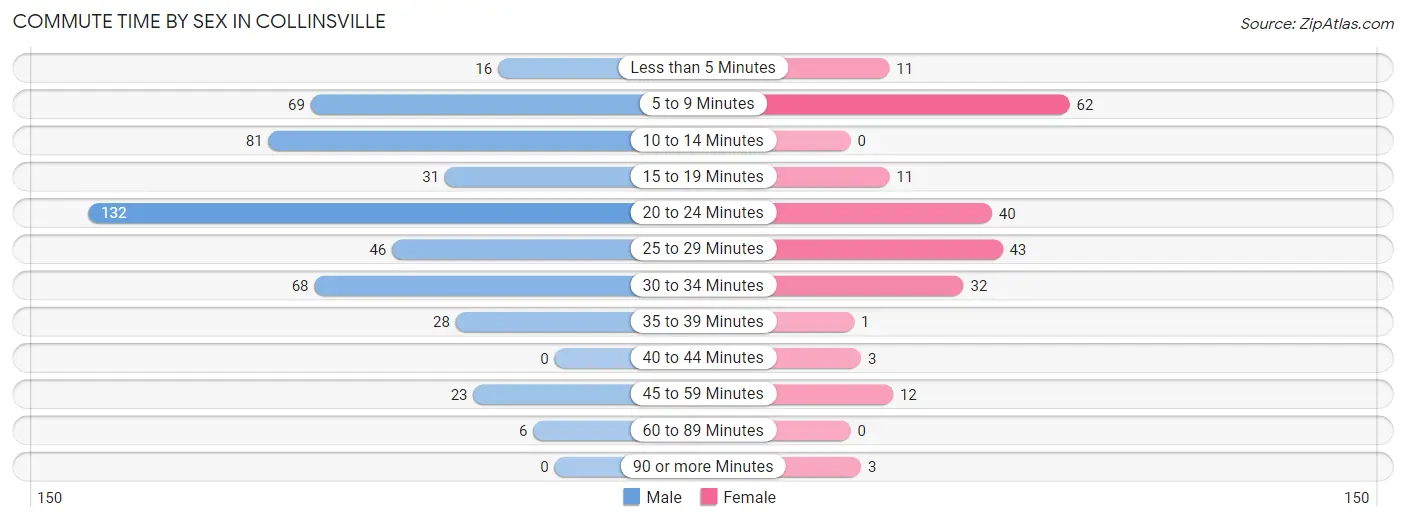
| Commute Time | Male | Female |
| Less than 5 Minutes | 16 (3.2%) | 11 (5.1%) |
| 5 to 9 Minutes | 69 (13.8%) | 62 (28.4%) |
| 10 to 14 Minutes | 81 (16.2%) | 0 (0.0%) |
| 15 to 19 Minutes | 31 (6.2%) | 11 (5.1%) |
| 20 to 24 Minutes | 132 (26.4%) | 40 (18.3%) |
| 25 to 29 Minutes | 46 (9.2%) | 43 (19.7%) |
| 30 to 34 Minutes | 68 (13.6%) | 32 (14.7%) |
| 35 to 39 Minutes | 28 (5.6%) | 1 (0.5%) |
| 40 to 44 Minutes | 0 (0.0%) | 3 (1.4%) |
| 45 to 59 Minutes | 23 (4.6%) | 12 (5.5%) |
| 60 to 89 Minutes | 6 (1.2%) | 0 (0.0%) |
| 90 or more Minutes | 0 (0.0%) | 3 (1.4%) |
Time of Departure to Work by Sex in Collinsville
The most frequent times of departure to work in Collinsville are 12:00 PM to 3:59 PM (142, 28.4%) for males and 6:30 AM to 6:59 AM (118, 54.1%) for females.
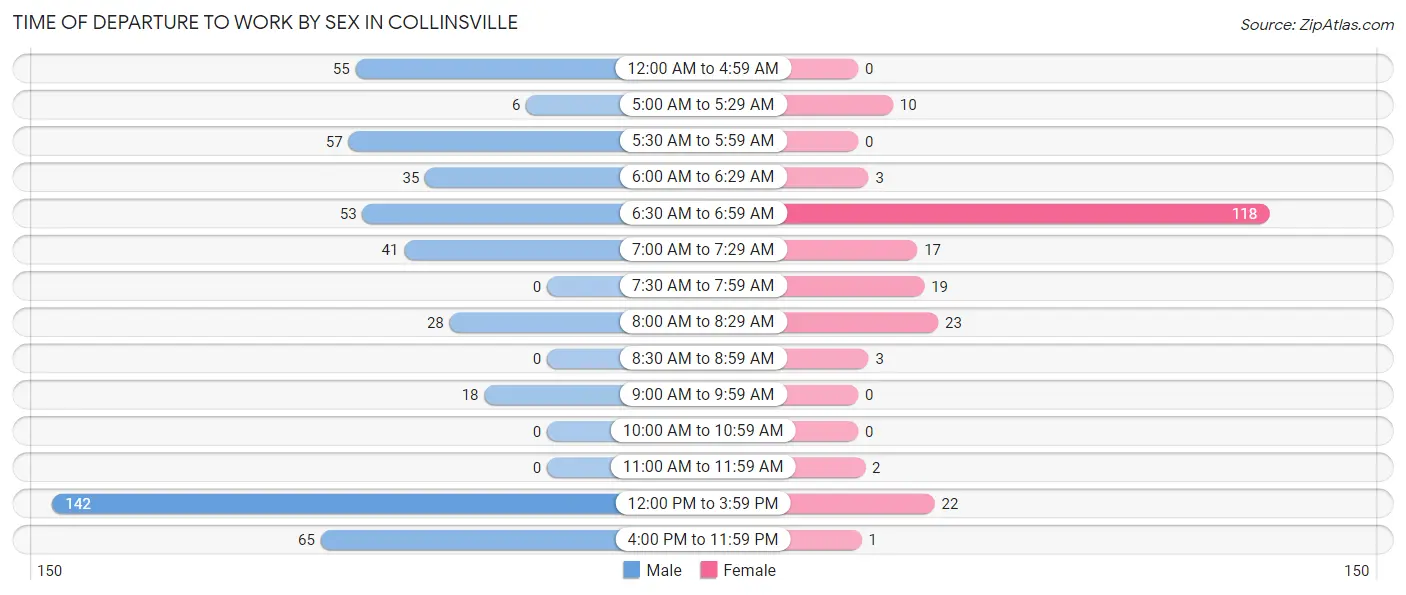
| Time of Departure | Male | Female |
| 12:00 AM to 4:59 AM | 55 (11.0%) | 0 (0.0%) |
| 5:00 AM to 5:29 AM | 6 (1.2%) | 10 (4.6%) |
| 5:30 AM to 5:59 AM | 57 (11.4%) | 0 (0.0%) |
| 6:00 AM to 6:29 AM | 35 (7.0%) | 3 (1.4%) |
| 6:30 AM to 6:59 AM | 53 (10.6%) | 118 (54.1%) |
| 7:00 AM to 7:29 AM | 41 (8.2%) | 17 (7.8%) |
| 7:30 AM to 7:59 AM | 0 (0.0%) | 19 (8.7%) |
| 8:00 AM to 8:29 AM | 28 (5.6%) | 23 (10.5%) |
| 8:30 AM to 8:59 AM | 0 (0.0%) | 3 (1.4%) |
| 9:00 AM to 9:59 AM | 18 (3.6%) | 0 (0.0%) |
| 10:00 AM to 10:59 AM | 0 (0.0%) | 0 (0.0%) |
| 11:00 AM to 11:59 AM | 0 (0.0%) | 2 (0.9%) |
| 12:00 PM to 3:59 PM | 142 (28.4%) | 22 (10.1%) |
| 4:00 PM to 11:59 PM | 65 (13.0%) | 1 (0.5%) |
| Total | 500 (100.0%) | 218 (100.0%) |
Housing Occupancy in Collinsville
Occupancy by Ownership in Collinsville
Of the total 633 dwellings in Collinsville, owner-occupied units account for 360 (56.9%), while renter-occupied units make up 273 (43.1%).
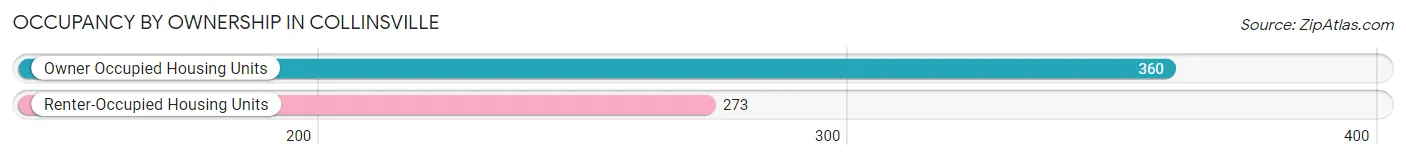
| Occupancy | # Housing Units | % Housing Units |
| Owner Occupied Housing Units | 360 | 56.9% |
| Renter-Occupied Housing Units | 273 | 43.1% |
| Total Occupied Housing Units | 633 | 100.0% |
Occupancy by Household Size in Collinsville
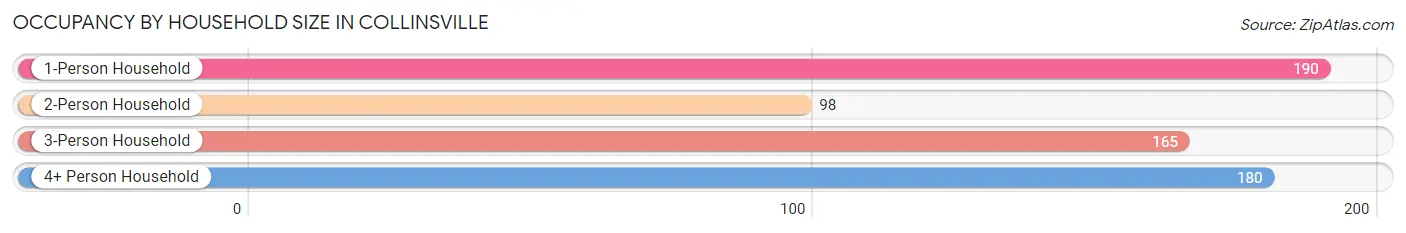
| Household Size | # Housing Units | % Housing Units |
| 1-Person Household | 190 | 30.0% |
| 2-Person Household | 98 | 15.5% |
| 3-Person Household | 165 | 26.1% |
| 4+ Person Household | 180 | 28.4% |
| Total Housing Units | 633 | 100.0% |
Occupancy by Ownership by Household Size in Collinsville
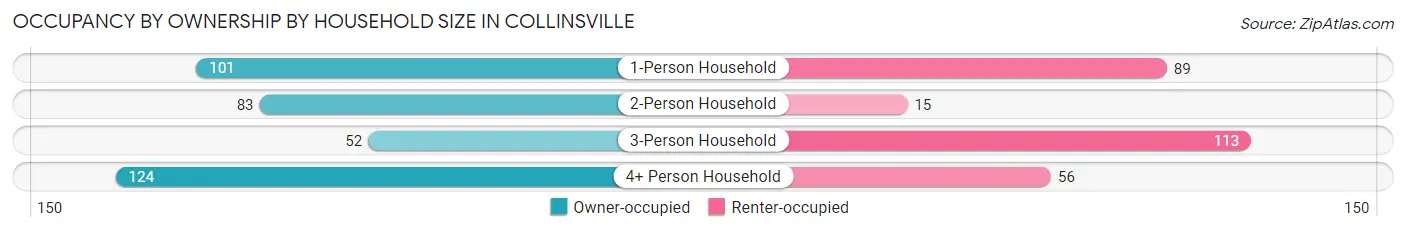
| Household Size | Owner-occupied | Renter-occupied |
| 1-Person Household | 101 (53.2%) | 89 (46.8%) |
| 2-Person Household | 83 (84.7%) | 15 (15.3%) |
| 3-Person Household | 52 (31.5%) | 113 (68.5%) |
| 4+ Person Household | 124 (68.9%) | 56 (31.1%) |
| Total Housing Units | 360 (56.9%) | 273 (43.1%) |
Occupancy by Educational Attainment in Collinsville
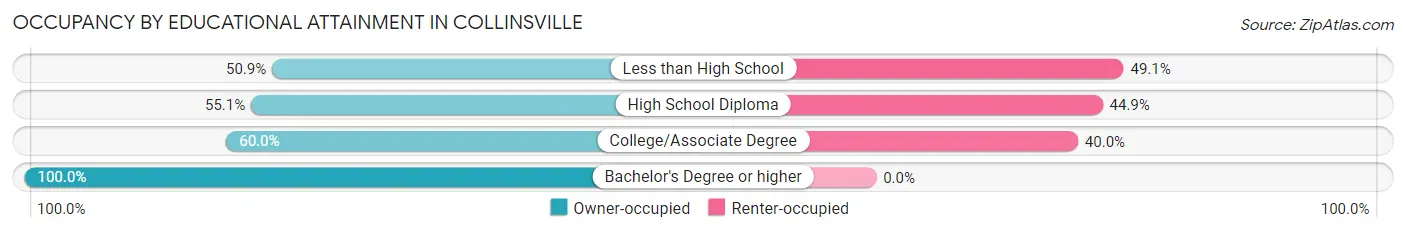
| Household Size | Owner-occupied | Renter-occupied |
| Less than High School | 135 (50.9%) | 130 (49.1%) |
| High School Diploma | 124 (55.1%) | 101 (44.9%) |
| College/Associate Degree | 63 (60.0%) | 42 (40.0%) |
| Bachelor's Degree or higher | 38 (100.0%) | 0 (0.0%) |
Occupancy by Age of Householder in Collinsville
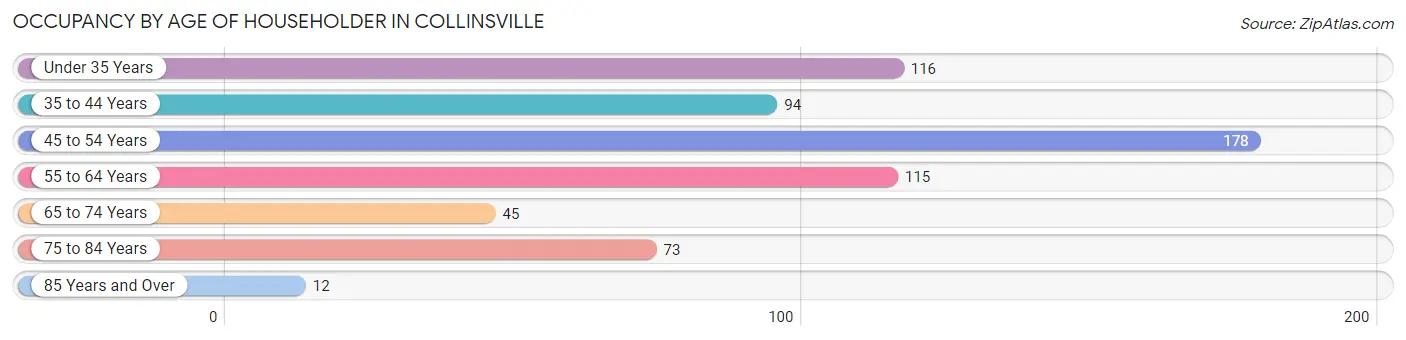
| Age Bracket | # Households | % Households |
| Under 35 Years | 116 | 18.3% |
| 35 to 44 Years | 94 | 14.8% |
| 45 to 54 Years | 178 | 28.1% |
| 55 to 64 Years | 115 | 18.2% |
| 65 to 74 Years | 45 | 7.1% |
| 75 to 84 Years | 73 | 11.5% |
| 85 Years and Over | 12 | 1.9% |
| Total | 633 | 100.0% |
Housing Finances in Collinsville
Median Income by Occupancy in Collinsville
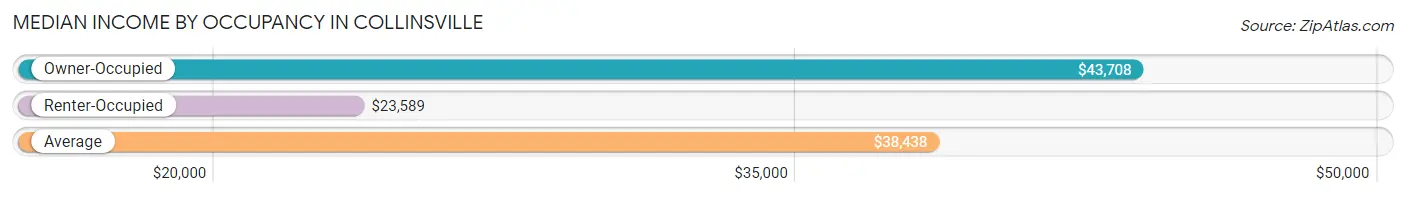
| Occupancy Type | # Households | Median Income |
| Owner-Occupied | 360 (56.9%) | $43,708 |
| Renter-Occupied | 273 (43.1%) | $23,589 |
| Average | 633 (100.0%) | $38,438 |
Occupancy by Householder Income Bracket in Collinsville
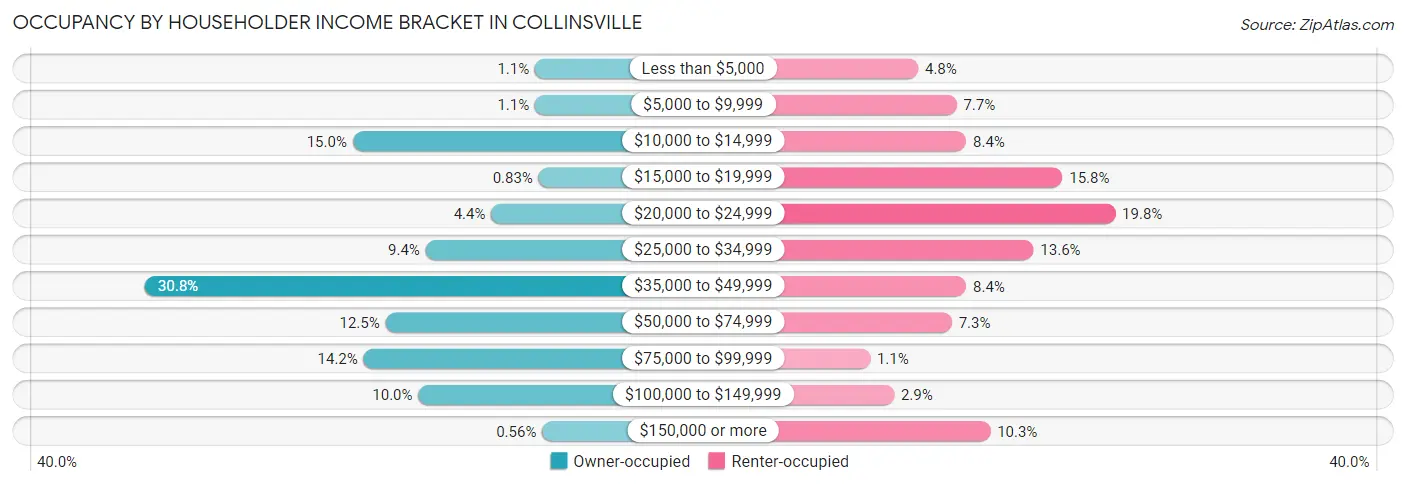
| Income Bracket | Owner-occupied | Renter-occupied |
| Less than $5,000 | 4 (1.1%) | 13 (4.8%) |
| $5,000 to $9,999 | 4 (1.1%) | 21 (7.7%) |
| $10,000 to $14,999 | 54 (15.0%) | 23 (8.4%) |
| $15,000 to $19,999 | 3 (0.8%) | 43 (15.8%) |
| $20,000 to $24,999 | 16 (4.4%) | 54 (19.8%) |
| $25,000 to $34,999 | 34 (9.4%) | 37 (13.6%) |
| $35,000 to $49,999 | 111 (30.8%) | 23 (8.4%) |
| $50,000 to $74,999 | 45 (12.5%) | 20 (7.3%) |
| $75,000 to $99,999 | 51 (14.2%) | 3 (1.1%) |
| $100,000 to $149,999 | 36 (10.0%) | 8 (2.9%) |
| $150,000 or more | 2 (0.6%) | 28 (10.3%) |
| Total | 360 (100.0%) | 273 (100.0%) |
Monthly Housing Cost Tiers in Collinsville
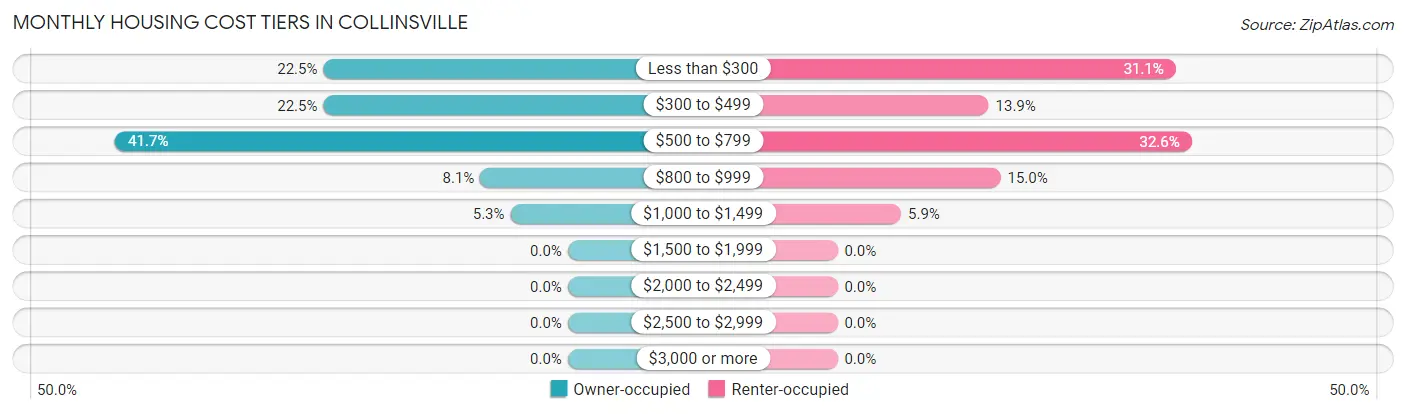
| Monthly Cost | Owner-occupied | Renter-occupied |
| Less than $300 | 81 (22.5%) | 85 (31.1%) |
| $300 to $499 | 81 (22.5%) | 38 (13.9%) |
| $500 to $799 | 150 (41.7%) | 89 (32.6%) |
| $800 to $999 | 29 (8.1%) | 41 (15.0%) |
| $1,000 to $1,499 | 19 (5.3%) | 16 (5.9%) |
| $1,500 to $1,999 | 0 (0.0%) | 0 (0.0%) |
| $2,000 to $2,499 | 0 (0.0%) | 0 (0.0%) |
| $2,500 to $2,999 | 0 (0.0%) | 0 (0.0%) |
| $3,000 or more | 0 (0.0%) | 0 (0.0%) |
| Total | 360 (100.0%) | 273 (100.0%) |
Physical Housing Characteristics in Collinsville
Housing Structures in Collinsville
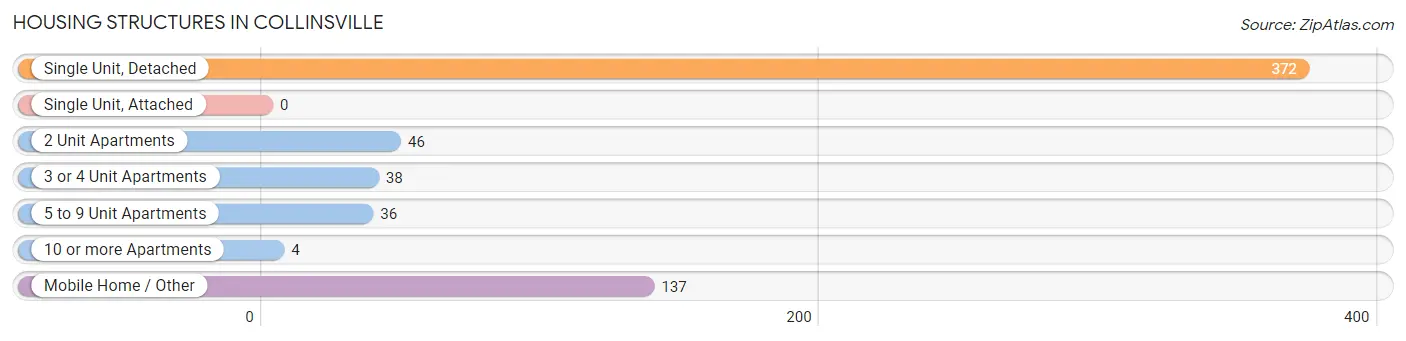
| Structure Type | # Housing Units | % Housing Units |
| Single Unit, Detached | 372 | 58.8% |
| Single Unit, Attached | 0 | 0.0% |
| 2 Unit Apartments | 46 | 7.3% |
| 3 or 4 Unit Apartments | 38 | 6.0% |
| 5 to 9 Unit Apartments | 36 | 5.7% |
| 10 or more Apartments | 4 | 0.6% |
| Mobile Home / Other | 137 | 21.6% |
| Total | 633 | 100.0% |
Housing Structures by Occupancy in Collinsville
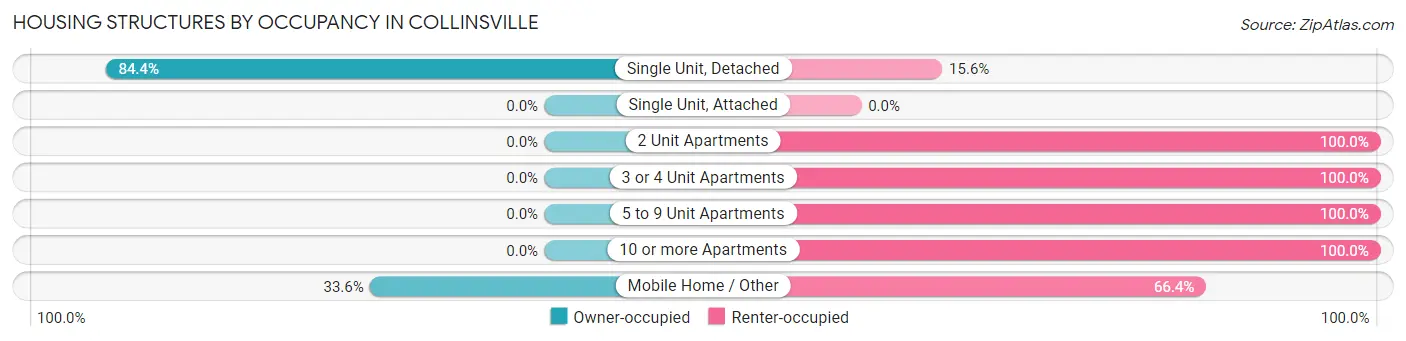
| Structure Type | Owner-occupied | Renter-occupied |
| Single Unit, Detached | 314 (84.4%) | 58 (15.6%) |
| Single Unit, Attached | 0 (0.0%) | 0 (0.0%) |
| 2 Unit Apartments | 0 (0.0%) | 46 (100.0%) |
| 3 or 4 Unit Apartments | 0 (0.0%) | 38 (100.0%) |
| 5 to 9 Unit Apartments | 0 (0.0%) | 36 (100.0%) |
| 10 or more Apartments | 0 (0.0%) | 4 (100.0%) |
| Mobile Home / Other | 46 (33.6%) | 91 (66.4%) |
| Total | 360 (56.9%) | 273 (43.1%) |
Housing Structures by Number of Rooms in Collinsville
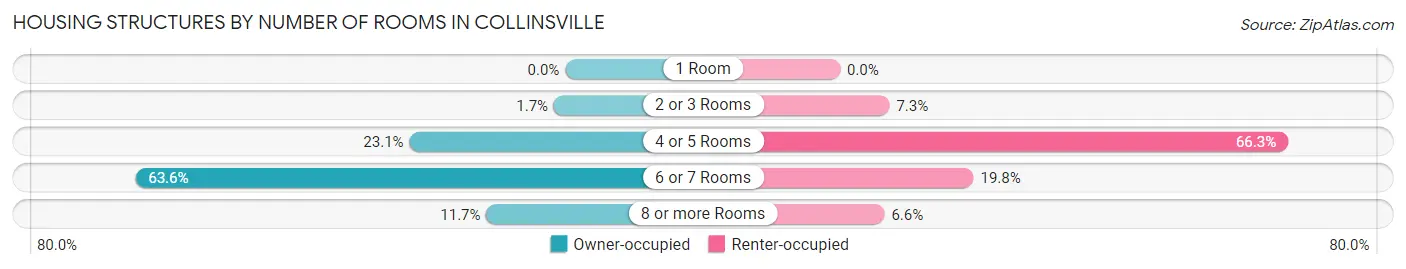
| Number of Rooms | Owner-occupied | Renter-occupied |
| 1 Room | 0 (0.0%) | 0 (0.0%) |
| 2 or 3 Rooms | 6 (1.7%) | 20 (7.3%) |
| 4 or 5 Rooms | 83 (23.1%) | 181 (66.3%) |
| 6 or 7 Rooms | 229 (63.6%) | 54 (19.8%) |
| 8 or more Rooms | 42 (11.7%) | 18 (6.6%) |
| Total | 360 (100.0%) | 273 (100.0%) |
Housing Structure by Heating Type in Collinsville
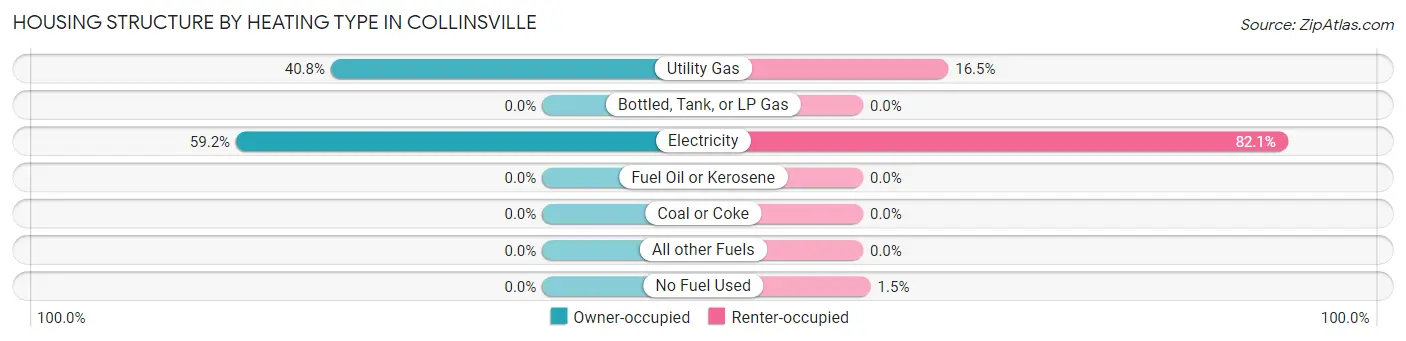
| Heating Type | Owner-occupied | Renter-occupied |
| Utility Gas | 147 (40.8%) | 45 (16.5%) |
| Bottled, Tank, or LP Gas | 0 (0.0%) | 0 (0.0%) |
| Electricity | 213 (59.2%) | 224 (82.1%) |
| Fuel Oil or Kerosene | 0 (0.0%) | 0 (0.0%) |
| Coal or Coke | 0 (0.0%) | 0 (0.0%) |
| All other Fuels | 0 (0.0%) | 0 (0.0%) |
| No Fuel Used | 0 (0.0%) | 4 (1.5%) |
| Total | 360 (100.0%) | 273 (100.0%) |
Household Vehicle Usage in Collinsville
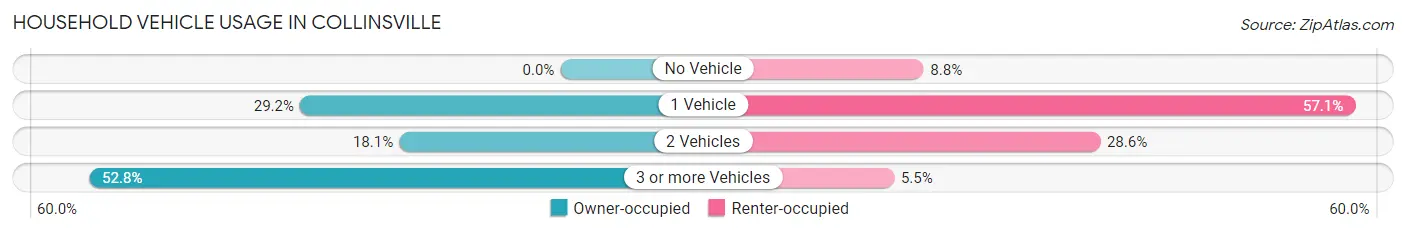
| Vehicles per Household | Owner-occupied | Renter-occupied |
| No Vehicle | 0 (0.0%) | 24 (8.8%) |
| 1 Vehicle | 105 (29.2%) | 156 (57.1%) |
| 2 Vehicles | 65 (18.1%) | 78 (28.6%) |
| 3 or more Vehicles | 190 (52.8%) | 15 (5.5%) |
| Total | 360 (100.0%) | 273 (100.0%) |
Real Estate & Mortgages in Collinsville
Real Estate and Mortgage Overview in Collinsville
| Characteristic | Without Mortgage | With Mortgage |
| Housing Units | 285 | 75 |
| Median Property Value | - | - |
| Median Household Income | $43,048 | $0 |
| Monthly Housing Costs | $415 | $0 |
| Real Estate Taxes | $340 | $0 |
Property Value by Mortgage Status in Collinsville
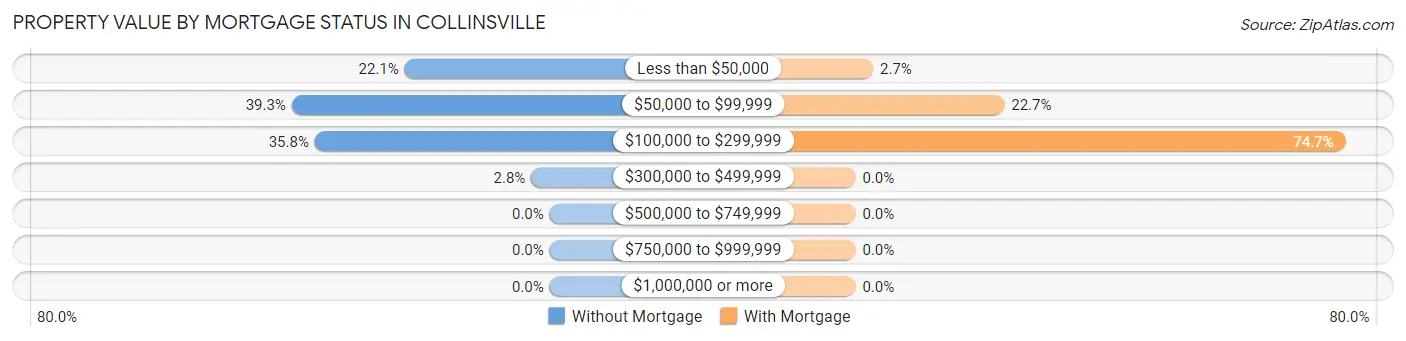
| Property Value | Without Mortgage | With Mortgage |
| Less than $50,000 | 63 (22.1%) | 2 (2.7%) |
| $50,000 to $99,999 | 112 (39.3%) | 17 (22.7%) |
| $100,000 to $299,999 | 102 (35.8%) | 56 (74.7%) |
| $300,000 to $499,999 | 8 (2.8%) | 0 (0.0%) |
| $500,000 to $749,999 | 0 (0.0%) | 0 (0.0%) |
| $750,000 to $999,999 | 0 (0.0%) | 0 (0.0%) |
| $1,000,000 or more | 0 (0.0%) | 0 (0.0%) |
| Total | 285 (100.0%) | 75 (100.0%) |
Household Income by Mortgage Status in Collinsville
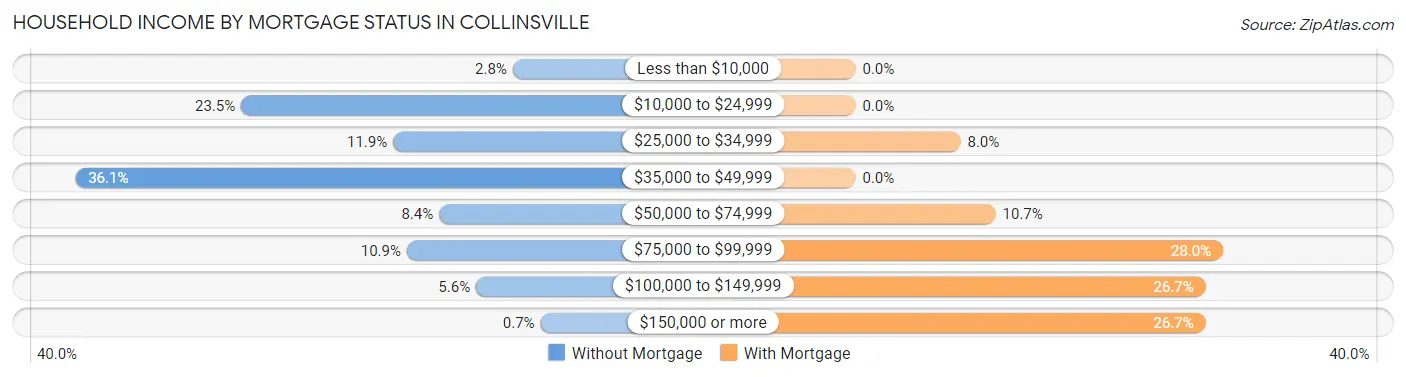
| Household Income | Without Mortgage | With Mortgage |
| Less than $10,000 | 8 (2.8%) | 0 (0.0%) |
| $10,000 to $24,999 | 67 (23.5%) | 0 (0.0%) |
| $25,000 to $34,999 | 34 (11.9%) | 6 (8.0%) |
| $35,000 to $49,999 | 103 (36.1%) | 0 (0.0%) |
| $50,000 to $74,999 | 24 (8.4%) | 8 (10.7%) |
| $75,000 to $99,999 | 31 (10.9%) | 21 (28.0%) |
| $100,000 to $149,999 | 16 (5.6%) | 20 (26.7%) |
| $150,000 or more | 2 (0.7%) | 20 (26.7%) |
| Total | 285 (100.0%) | 75 (100.0%) |
Property Value to Household Income Ratio in Collinsville
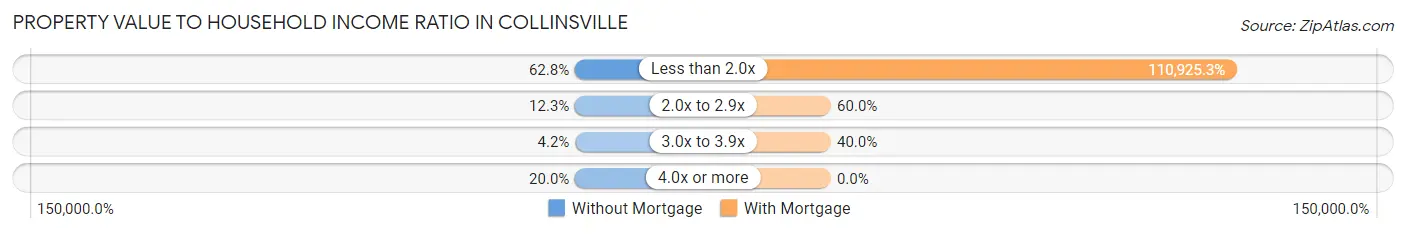
| Value-to-Income Ratio | Without Mortgage | With Mortgage |
| Less than 2.0x | 179 (62.8%) | 83,194 (110,925.3%) |
| 2.0x to 2.9x | 35 (12.3%) | 45 (60.0%) |
| 3.0x to 3.9x | 12 (4.2%) | 30 (40.0%) |
| 4.0x or more | 57 (20.0%) | 0 (0.0%) |
| Total | 285 (100.0%) | 75 (100.0%) |
Real Estate Taxes by Mortgage Status in Collinsville
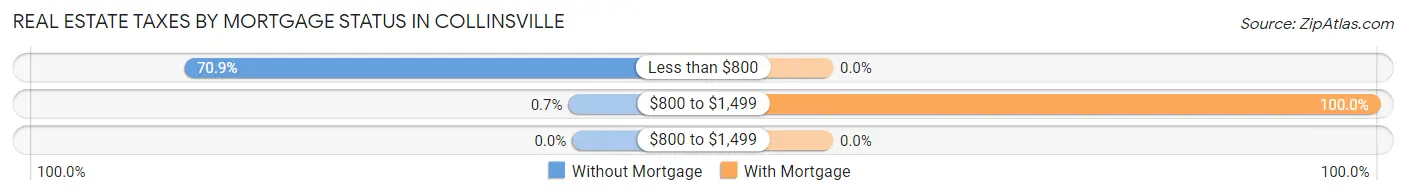
| Property Taxes | Without Mortgage | With Mortgage |
| Less than $800 | 202 (70.9%) | 0 (0.0%) |
| $800 to $1,499 | 2 (0.7%) | 75 (100.0%) |
| $800 to $1,499 | 0 (0.0%) | 0 (0.0%) |
| Total | 285 (100.0%) | 75 (100.0%) |
Health & Disability in Collinsville
Health Insurance Coverage by Age in Collinsville
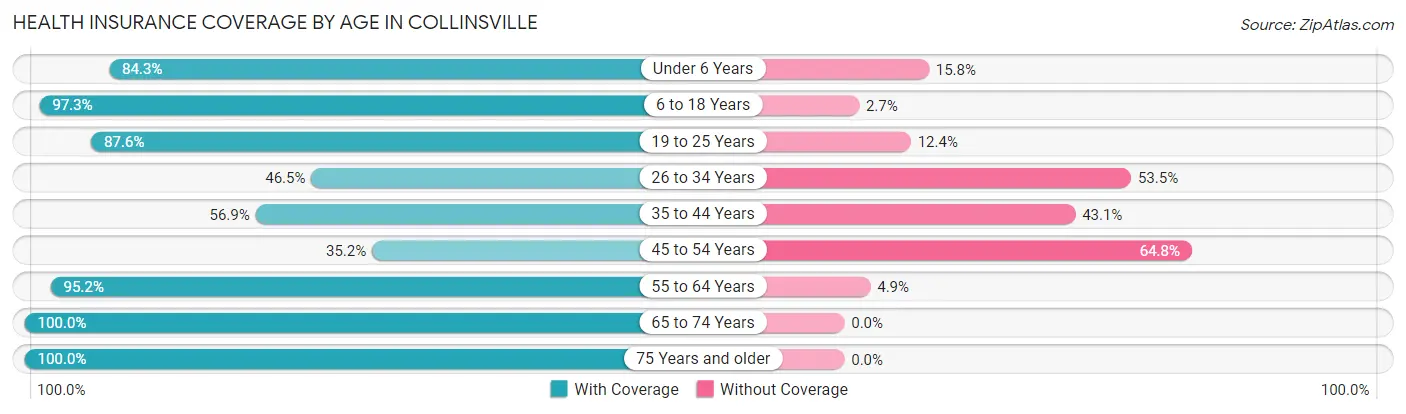
| Age Bracket | With Coverage | Without Coverage |
| Under 6 Years | 107 (84.3%) | 20 (15.8%) |
| 6 to 18 Years | 497 (97.3%) | 14 (2.7%) |
| 19 to 25 Years | 99 (87.6%) | 14 (12.4%) |
| 26 to 34 Years | 101 (46.5%) | 116 (53.5%) |
| 35 to 44 Years | 82 (56.9%) | 62 (43.1%) |
| 45 to 54 Years | 125 (35.2%) | 230 (64.8%) |
| 55 to 64 Years | 157 (95.2%) | 8 (4.9%) |
| 65 to 74 Years | 87 (100.0%) | 0 (0.0%) |
| 75 Years and older | 101 (100.0%) | 0 (0.0%) |
| Total | 1,356 (74.5%) | 464 (25.5%) |
Health Insurance Coverage by Citizenship Status in Collinsville
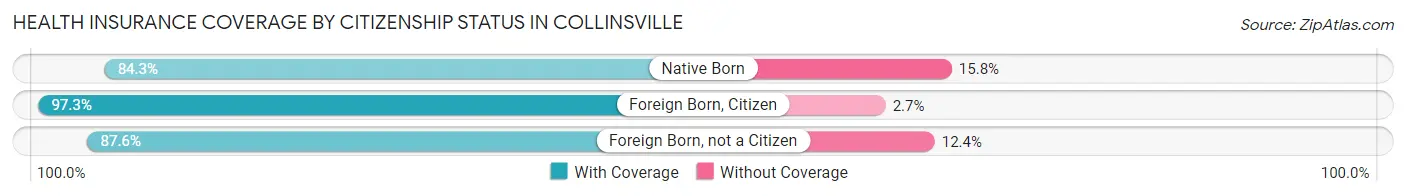
| Citizenship Status | With Coverage | Without Coverage |
| Native Born | 107 (84.3%) | 20 (15.8%) |
| Foreign Born, Citizen | 497 (97.3%) | 14 (2.7%) |
| Foreign Born, not a Citizen | 99 (87.6%) | 14 (12.4%) |
Health Insurance Coverage by Household Income in Collinsville
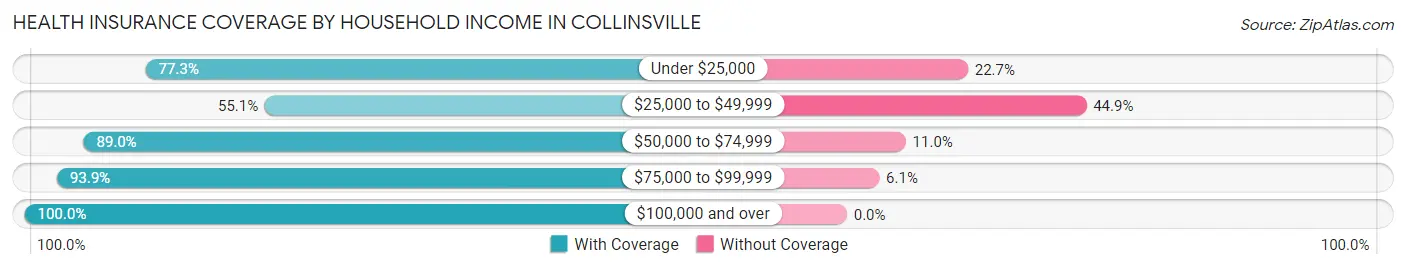
| Household Income | With Coverage | Without Coverage |
| Under $25,000 | 365 (77.3%) | 107 (22.7%) |
| $25,000 to $49,999 | 386 (55.1%) | 314 (44.9%) |
| $50,000 to $74,999 | 250 (89.0%) | 31 (11.0%) |
| $75,000 to $99,999 | 186 (93.9%) | 12 (6.1%) |
| $100,000 and over | 169 (100.0%) | 0 (0.0%) |
Public vs Private Health Insurance Coverage by Age in Collinsville
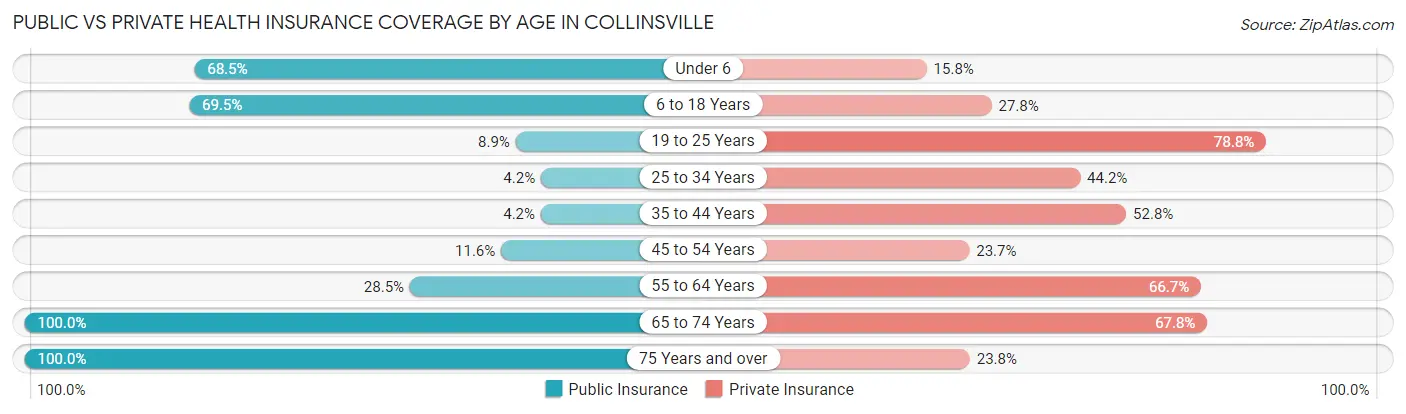
| Age Bracket | Public Insurance | Private Insurance |
| Under 6 | 87 (68.5%) | 20 (15.8%) |
| 6 to 18 Years | 355 (69.5%) | 142 (27.8%) |
| 19 to 25 Years | 10 (8.8%) | 89 (78.8%) |
| 25 to 34 Years | 9 (4.2%) | 96 (44.2%) |
| 35 to 44 Years | 6 (4.2%) | 76 (52.8%) |
| 45 to 54 Years | 41 (11.6%) | 84 (23.7%) |
| 55 to 64 Years | 47 (28.5%) | 110 (66.7%) |
| 65 to 74 Years | 87 (100.0%) | 59 (67.8%) |
| 75 Years and over | 101 (100.0%) | 24 (23.8%) |
| Total | 743 (40.8%) | 700 (38.5%) |
Disability Status by Sex by Age in Collinsville
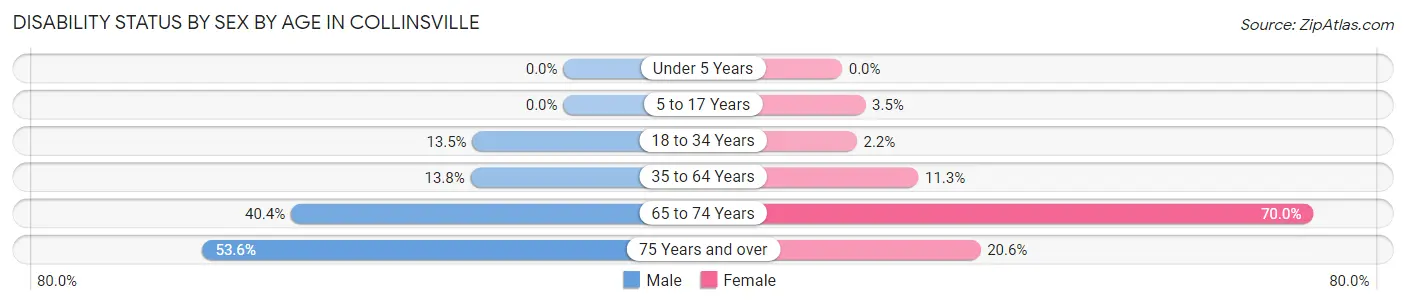
| Age Bracket | Male | Female |
| Under 5 Years | 0 (0.0%) | 0 (0.0%) |
| 5 to 17 Years | 0 (0.0%) | 8 (3.5%) |
| 18 to 34 Years | 22 (13.5%) | 4 (2.2%) |
| 35 to 64 Years | 55 (13.8%) | 30 (11.3%) |
| 65 to 74 Years | 19 (40.4%) | 28 (70.0%) |
| 75 Years and over | 15 (53.6%) | 15 (20.5%) |
Disability Class by Sex by Age in Collinsville
Disability Class: Hearing Difficulty
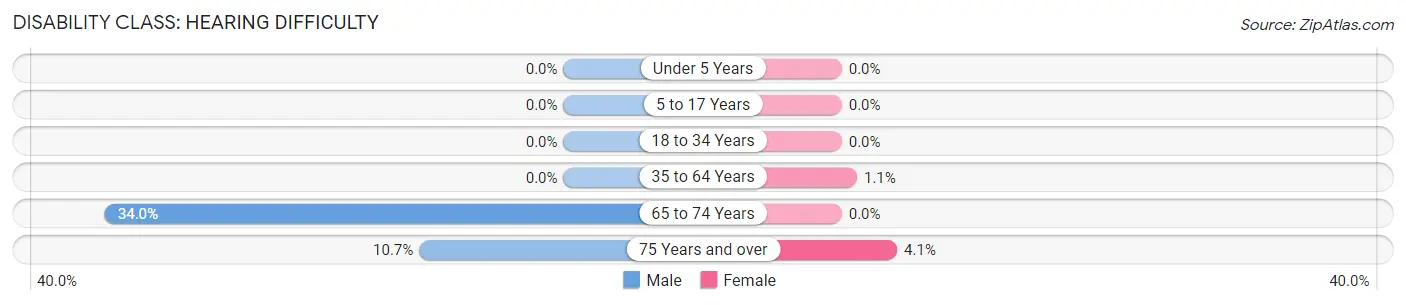
| Age Bracket | Male | Female |
| Under 5 Years | 0 (0.0%) | 0 (0.0%) |
| 5 to 17 Years | 0 (0.0%) | 0 (0.0%) |
| 18 to 34 Years | 0 (0.0%) | 0 (0.0%) |
| 35 to 64 Years | 0 (0.0%) | 3 (1.1%) |
| 65 to 74 Years | 16 (34.0%) | 0 (0.0%) |
| 75 Years and over | 3 (10.7%) | 3 (4.1%) |
Disability Class: Vision Difficulty
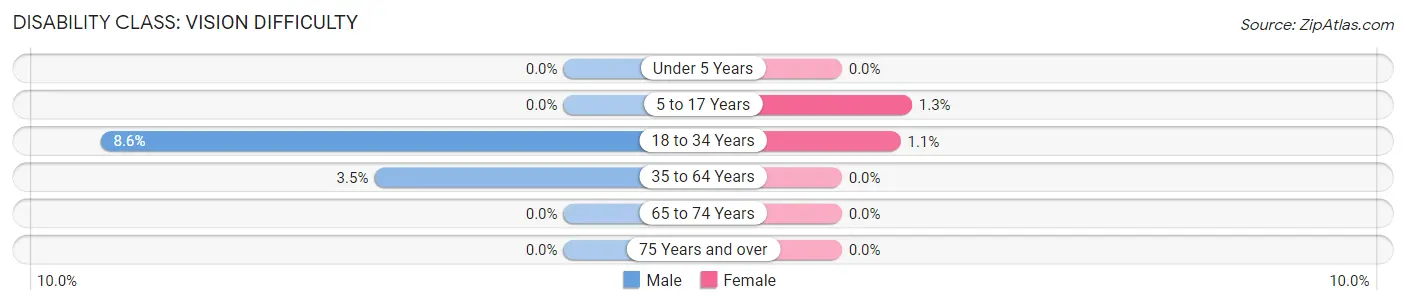
| Age Bracket | Male | Female |
| Under 5 Years | 0 (0.0%) | 0 (0.0%) |
| 5 to 17 Years | 0 (0.0%) | 3 (1.3%) |
| 18 to 34 Years | 14 (8.6%) | 2 (1.1%) |
| 35 to 64 Years | 14 (3.5%) | 0 (0.0%) |
| 65 to 74 Years | 0 (0.0%) | 0 (0.0%) |
| 75 Years and over | 0 (0.0%) | 0 (0.0%) |
Disability Class: Cognitive Difficulty
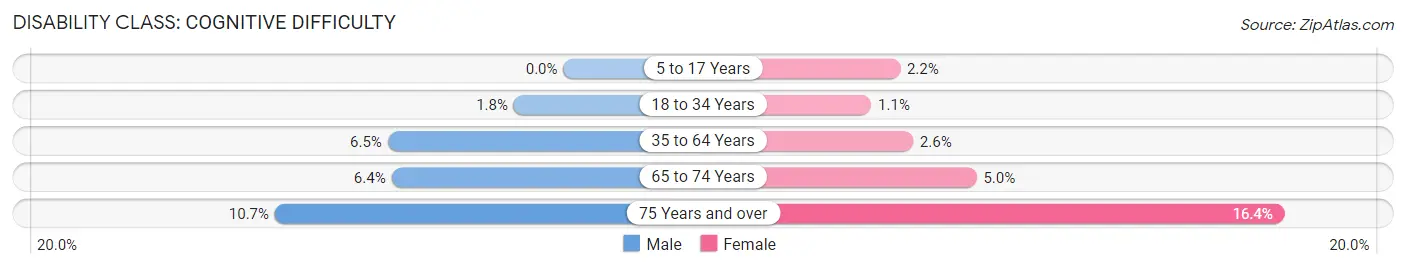
| Age Bracket | Male | Female |
| 5 to 17 Years | 0 (0.0%) | 5 (2.2%) |
| 18 to 34 Years | 3 (1.8%) | 2 (1.1%) |
| 35 to 64 Years | 26 (6.5%) | 7 (2.6%) |
| 65 to 74 Years | 3 (6.4%) | 2 (5.0%) |
| 75 Years and over | 3 (10.7%) | 12 (16.4%) |
Disability Class: Ambulatory Difficulty
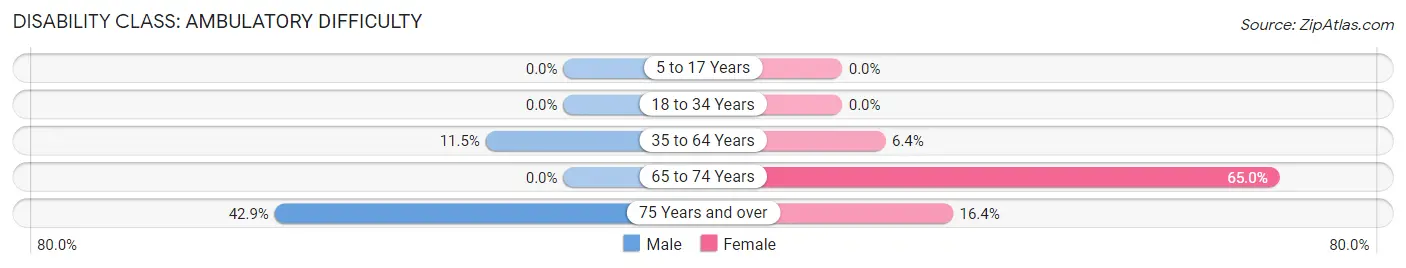
| Age Bracket | Male | Female |
| 5 to 17 Years | 0 (0.0%) | 0 (0.0%) |
| 18 to 34 Years | 0 (0.0%) | 0 (0.0%) |
| 35 to 64 Years | 46 (11.5%) | 17 (6.4%) |
| 65 to 74 Years | 0 (0.0%) | 26 (65.0%) |
| 75 Years and over | 12 (42.9%) | 12 (16.4%) |
Disability Class: Self-Care Difficulty
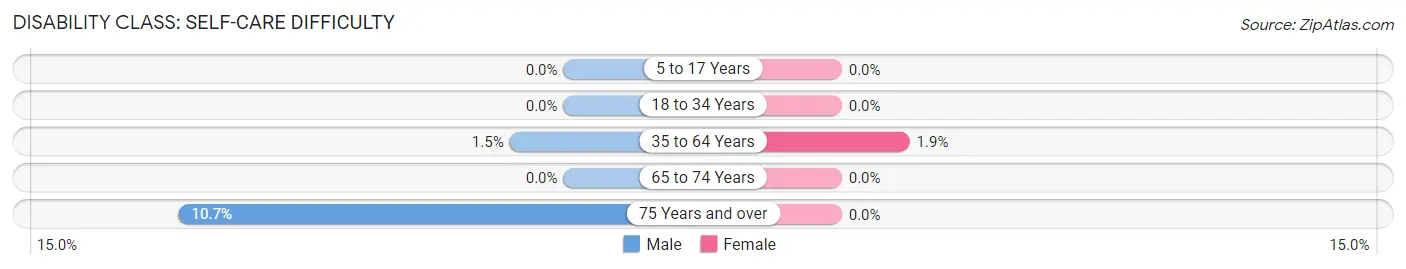
| Age Bracket | Male | Female |
| 5 to 17 Years | 0 (0.0%) | 0 (0.0%) |
| 18 to 34 Years | 0 (0.0%) | 0 (0.0%) |
| 35 to 64 Years | 6 (1.5%) | 5 (1.9%) |
| 65 to 74 Years | 0 (0.0%) | 0 (0.0%) |
| 75 Years and over | 3 (10.7%) | 0 (0.0%) |
Technology Access in Collinsville
Computing Device Access in Collinsville
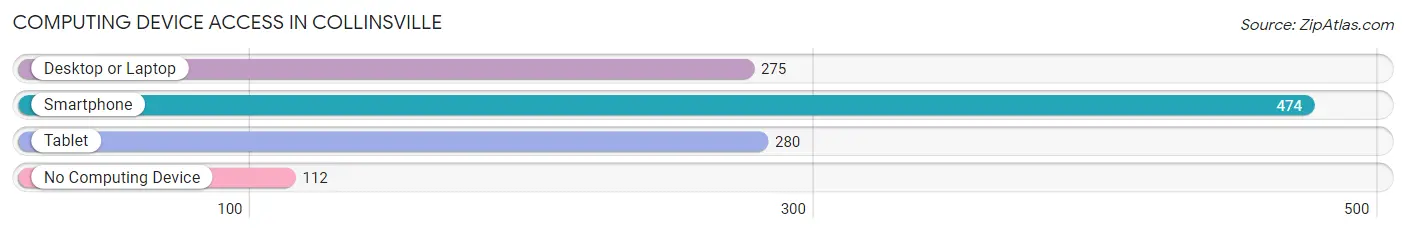
| Device Type | # Households | % Households |
| Desktop or Laptop | 275 | 43.4% |
| Smartphone | 474 | 74.9% |
| Tablet | 280 | 44.2% |
| No Computing Device | 112 | 17.7% |
| Total | 633 | 100.0% |
Internet Access in Collinsville
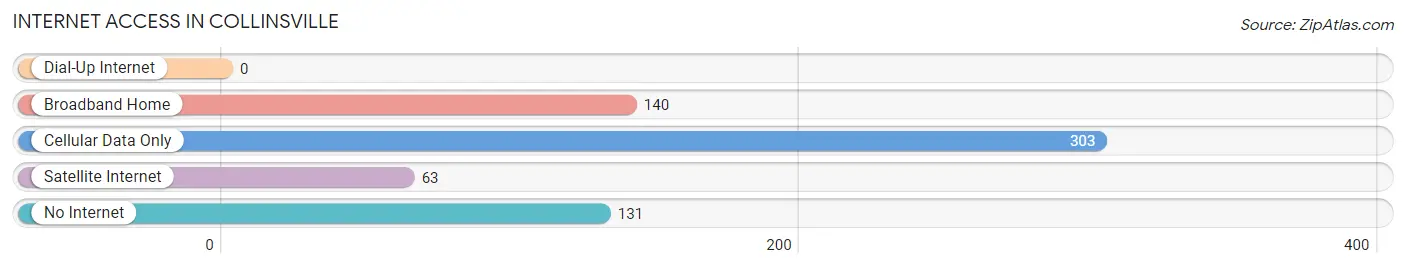
| Internet Type | # Households | % Households |
| Dial-Up Internet | 0 | 0.0% |
| Broadband Home | 140 | 22.1% |
| Cellular Data Only | 303 | 47.9% |
| Satellite Internet | 63 | 10.0% |
| No Internet | 131 | 20.7% |
| Total | 633 | 100.0% |
Collinsville Summary
History
The town of Collinsville, Alabama is located in DeKalb County in the northeastern part of the state. It was founded in 1836 and named after the Collins family, who were among the first settlers in the area. The town was originally known as Collinsville Station, as it was a stop on the Nashville and Chattanooga Railroad. The town was incorporated in 1891 and has since grown to a population of over 1,000 people.
The town has a rich history, with many of its buildings and homes dating back to the 19th century. The Collinsville Historic District, which was added to the National Register of Historic Places in 1985, includes many of the town’s historic buildings. The district includes the Collinsville Methodist Church, which was built in 1891, and the Collinsville Hotel, which was built in 1892.
The town was also home to the Collinsville Iron Works, which was established in 1872 and was one of the largest iron works in the South. The iron works produced a variety of products, including railroad cars, bridges, and other iron products. The iron works closed in the early 20th century, but the town still has a strong industrial presence, with several factories and businesses located in the area.
Geography
Collinsville is located in the foothills of the Appalachian Mountains in northeastern Alabama. The town is situated on the banks of the Little River, which flows through the town and is a popular spot for fishing and other recreational activities. The town is surrounded by rolling hills and forests, and is located about 30 miles from Chattanooga, Tennessee.
The climate in Collinsville is mild, with temperatures ranging from the mid-50s in the winter to the mid-80s in the summer. The town receives an average of 48 inches of rain per year, and snowfall is rare.
Economy
Collinsville’s economy is largely based on agriculture and manufacturing. The town is home to several factories and businesses, including a furniture factory, a paper mill, and a metal fabrication plant. The town also has a strong tourism industry, with many visitors coming to the area to enjoy the natural beauty of the Appalachian Mountains.
The town is also home to several small businesses, including restaurants, shops, and other services. The town is also home to several churches, including the Collinsville Methodist Church, which was built in 1891.
Demographics
As of the 2010 census, the population of Collinsville was 1,072. The racial makeup of the town was 95.3% White, 0.9% African American, 0.3% Native American, 0.2% Asian, 0.1% Pacific Islander, and 2.2% from other races. The median household income was $30,938, and the median family income was $37,813. The town has a poverty rate of 22.3%.
The town is served by the DeKalb County School System, which includes two elementary schools, a middle school, and a high school. The town also has a library, a post office, and several parks.
Collinsville is a small town with a rich history and a strong sense of community. The town is home to many historic buildings and homes, and is a popular destination for tourists looking to explore the natural beauty of the Appalachian Mountains. The town has a strong economy, with many businesses and factories located in the area, and is a great place to live for those looking for a quiet, rural lifestyle.
Common Questions
What is Per Capita Income in Collinsville?
Per Capita income in Collinsville is $16,437.
What is the Median Family Income in Collinsville?
Median Family Income in Collinsville is $44,237.
What is the Median Household income in Collinsville?
Median Household Income in Collinsville is $38,438.
What is Income or Wage Gap in Collinsville?
Income or Wage Gap in Collinsville is 12.8%.
Women in Collinsville earn 87.2 cents for every dollar earned by a man.
What is Inequality or Gini Index in Collinsville?
Inequality or Gini Index in Collinsville is 0.47.
What is the Total Population of Collinsville?
Total Population of Collinsville is 2,036.
What is the Total Male Population of Collinsville?
Total Male Population of Collinsville is 1,100.
What is the Total Female Population of Collinsville?
Total Female Population of Collinsville is 936.
What is the Ratio of Males per 100 Females in Collinsville?
There are 117.52 Males per 100 Females in Collinsville.
What is the Ratio of Females per 100 Males in Collinsville?
There are 85.09 Females per 100 Males in Collinsville.
What is the Median Population Age in Collinsville?
Median Population Age in Collinsville is 36.4 Years.
What is the Average Family Size in Collinsville
Average Family Size in Collinsville is 3.5 People.
What is the Average Household Size in Collinsville
Average Household Size in Collinsville is 2.9 People.
How Large is the Labor Force in Collinsville?
There are 741 People in the Labor Forcein in Collinsville.
What is the Percentage of People in the Labor Force in Collinsville?
46.6% of People are in the Labor Force in Collinsville.
What is the Unemployment Rate in Collinsville?
Unemployment Rate in Collinsville is 1.3%.