Red Bay, AL Map & Demographics
Red Bay Map
Red Bay Overview
$24,009
PER CAPITA INCOME
$53,600
AVG FAMILY INCOME
$33,234
AVG HOUSEHOLD INCOME
29.2%
WAGE / INCOME GAP [ % ]
70.8¢/ $1
WAGE / INCOME GAP [ $ ]
0.48
INEQUALITY / GINI INDEX
3,210
TOTAL POPULATION
1,482
MALE POPULATION
1,728
FEMALE POPULATION
85.76
MALES / 100 FEMALES
116.60
FEMALES / 100 MALES
46.3
MEDIAN AGE
3.1
AVG FAMILY SIZE
2.1
AVG HOUSEHOLD SIZE
1,261
LABOR FORCE [ PEOPLE ]
49.0%
PERCENT IN LABOR FORCE
3.6%
UNEMPLOYMENT RATE
Red Bay Zip Codes
Income in Red Bay
Income Overview in Red Bay
Per Capita Income in Red Bay is $24,009, while median incomes of families and households are $53,600 and $33,234 respectively.
| Characteristic | Number | Measure |
| Per Capita Income | 3,210 | $24,009 |
| Median Family Income | 740 | $53,600 |
| Mean Family Income | 740 | $73,205 |
| Median Household Income | 1,487 | $33,234 |
| Mean Household Income | 1,487 | $51,475 |
| Income Deficit | 740 | $0 |
| Wage / Income Gap (%) | 3,210 | 29.16% |
| Wage / Income Gap ($) | 3,210 | 70.84¢ per $1 |
| Gini / Inequality Index | 3,210 | 0.48 |
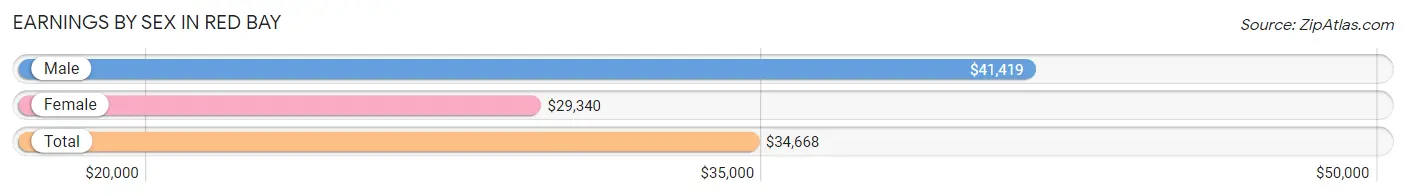
Earnings by Sex in Red Bay
Average Earnings in Red Bay are $34,668, $41,419 for men and $29,340 for women, a difference of 29.2%.
| Sex | Number | Average Earnings |
| Male | 652 (51.5%) | $41,419 |
| Female | 613 (48.5%) | $29,340 |
| Total | 1,265 (100.0%) | $34,668 |
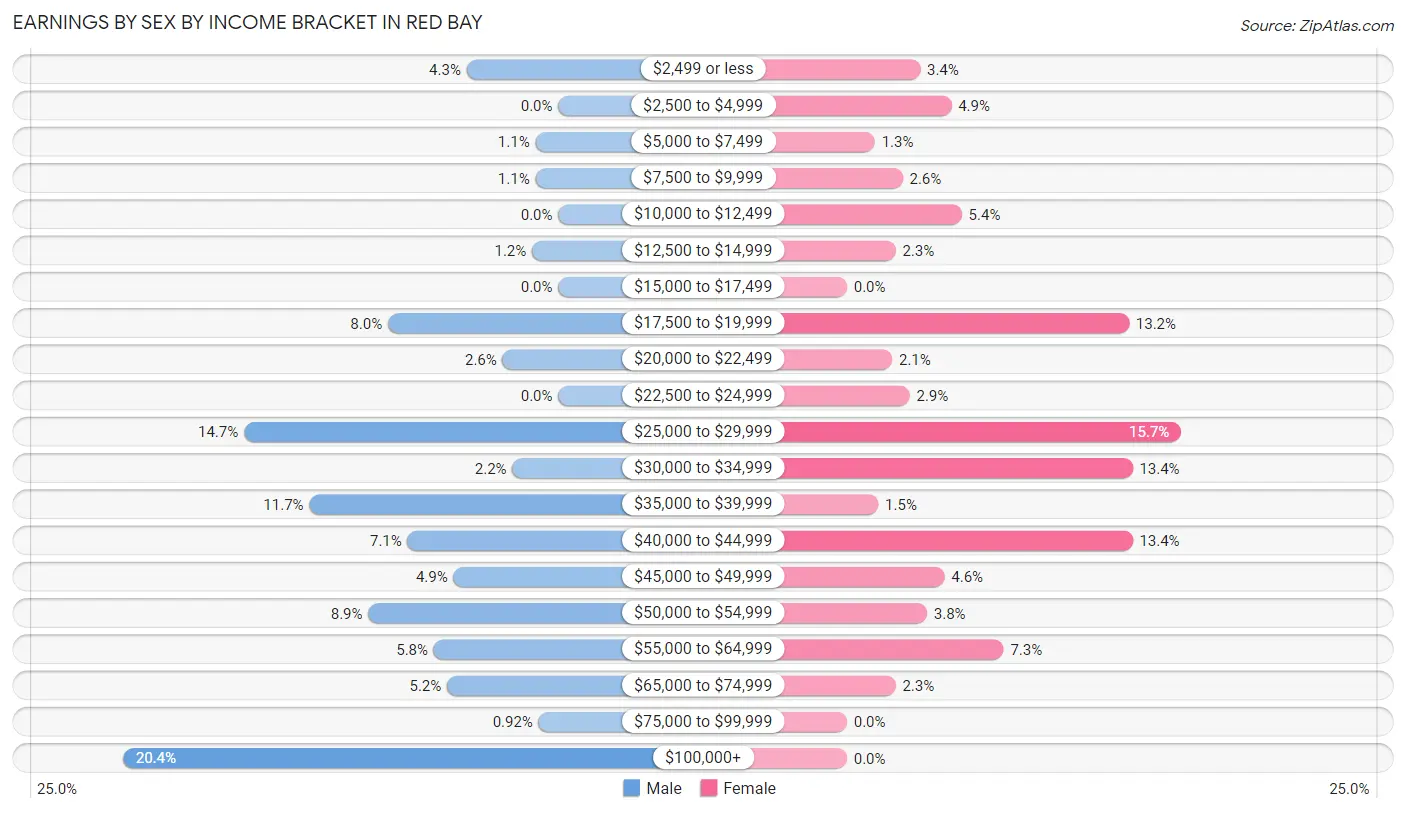
Earnings by Sex by Income Bracket in Red Bay
The most common earnings brackets in Red Bay are $100,000+ for men (133 | 20.4%) and $25,000 to $29,999 for women (96 | 15.7%).
| Income | Male | Female |
| $2,499 or less | 28 (4.3%) | 21 (3.4%) |
| $2,500 to $4,999 | 0 (0.0%) | 30 (4.9%) |
| $5,000 to $7,499 | 7 (1.1%) | 8 (1.3%) |
| $7,500 to $9,999 | 7 (1.1%) | 16 (2.6%) |
| $10,000 to $12,499 | 0 (0.0%) | 33 (5.4%) |
| $12,500 to $14,999 | 8 (1.2%) | 14 (2.3%) |
| $15,000 to $17,499 | 0 (0.0%) | 0 (0.0%) |
| $17,500 to $19,999 | 52 (8.0%) | 81 (13.2%) |
| $20,000 to $22,499 | 17 (2.6%) | 13 (2.1%) |
| $22,500 to $24,999 | 0 (0.0%) | 18 (2.9%) |
| $25,000 to $29,999 | 96 (14.7%) | 96 (15.7%) |
| $30,000 to $34,999 | 14 (2.1%) | 82 (13.4%) |
| $35,000 to $39,999 | 76 (11.7%) | 9 (1.5%) |
| $40,000 to $44,999 | 46 (7.1%) | 82 (13.4%) |
| $45,000 to $49,999 | 32 (4.9%) | 28 (4.6%) |
| $50,000 to $54,999 | 58 (8.9%) | 23 (3.7%) |
| $55,000 to $64,999 | 38 (5.8%) | 45 (7.3%) |
| $65,000 to $74,999 | 34 (5.2%) | 14 (2.3%) |
| $75,000 to $99,999 | 6 (0.9%) | 0 (0.0%) |
| $100,000+ | 133 (20.4%) | 0 (0.0%) |
| Total | 652 (100.0%) | 613 (100.0%) |
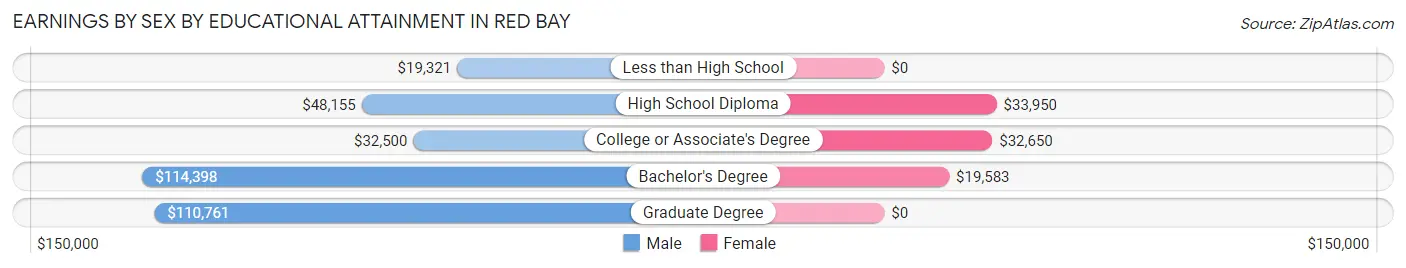
Earnings by Sex by Educational Attainment in Red Bay
Average earnings in Red Bay are $43,611 for men and $29,722 for women, a difference of 31.9%. Men with an educational attainment of bachelor's degree enjoy the highest average annual earnings of $114,398, while those with less than high school education earn the least with $19,321. Women with an educational attainment of high school diploma earn the most with the average annual earnings of $33,950, while those with bachelor's degree education have the smallest earnings of $19,583.
| Educational Attainment | Male Income | Female Income |
| Less than High School | $19,321 | $0 |
| High School Diploma | $48,155 | $33,950 |
| College or Associate's Degree | $32,500 | $32,650 |
| Bachelor's Degree | $114,398 | $19,583 |
| Graduate Degree | $110,761 | $0 |
| Total | $43,611 | $29,722 |
Family Income in Red Bay
Family Income Brackets in Red Bay
According to the Red Bay family income data, there are 139 families falling into the $15,000 to $24,999 income range, which is the most common income bracket and makes up 18.8% of all families. Conversely, the $10,000 to $14,999 income bracket is the least frequent group with only 20 families (2.7%) belonging to this category.
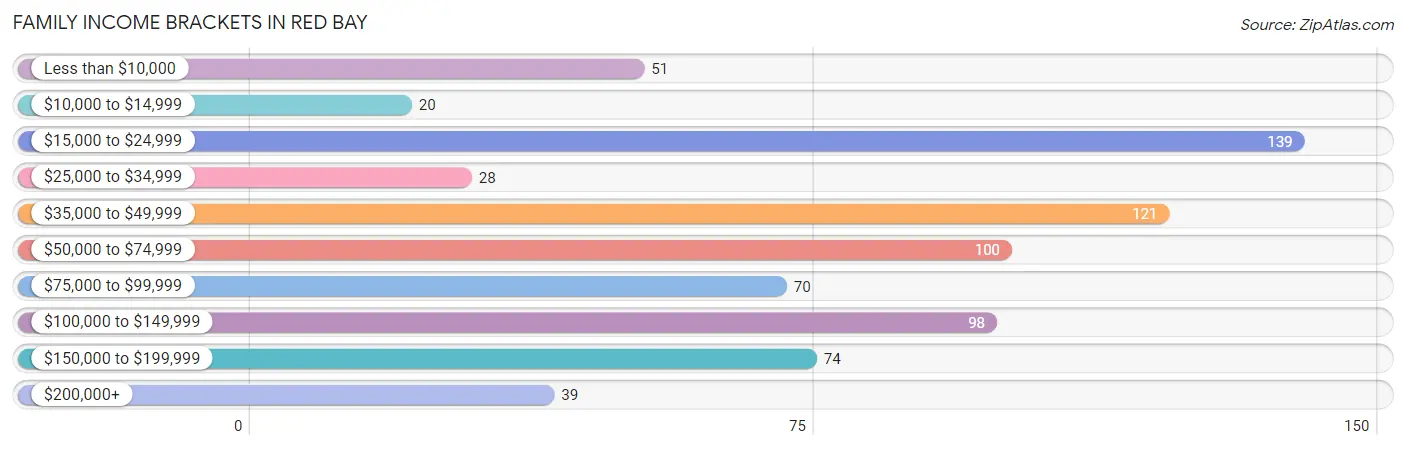
| Income Bracket | # Families | % Families |
| Less than $10,000 | 51 | 6.9% |
| $10,000 to $14,999 | 20 | 2.7% |
| $15,000 to $24,999 | 139 | 18.8% |
| $25,000 to $34,999 | 28 | 3.8% |
| $35,000 to $49,999 | 121 | 16.4% |
| $50,000 to $74,999 | 100 | 13.5% |
| $75,000 to $99,999 | 70 | 9.5% |
| $100,000 to $149,999 | 98 | 13.2% |
| $150,000 to $199,999 | 74 | 10.0% |
| $200,000+ | 39 | 5.3% |
Family Income by Famaliy Size in Red Bay
4-person families (140 | 18.9%) account for the highest median family income in Red Bay with $100,652 per family, while 4-person families (140 | 18.9%) have the highest median income of $25,163 per family member.
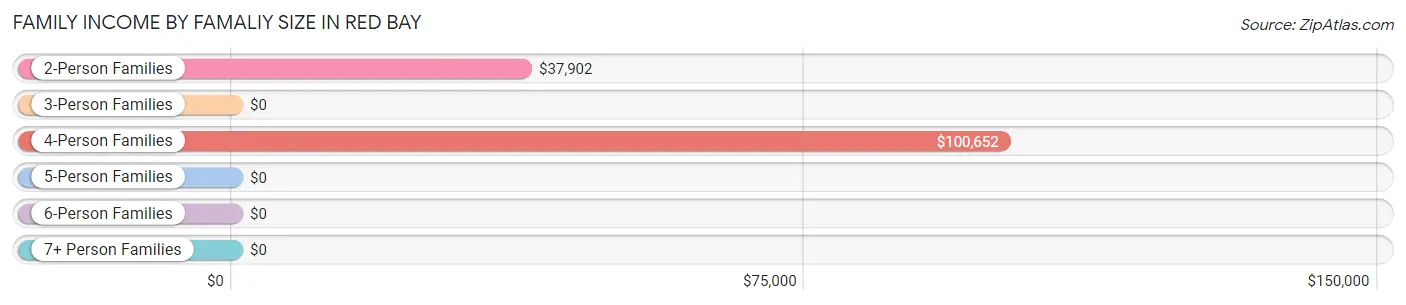
| Income Bracket | # Families | Median Income |
| 2-Person Families | 417 (56.4%) | $37,902 |
| 3-Person Families | 120 (16.2%) | $0 |
| 4-Person Families | 140 (18.9%) | $100,652 |
| 5-Person Families | 41 (5.5%) | $0 |
| 6-Person Families | 16 (2.2%) | $0 |
| 7+ Person Families | 6 (0.8%) | $0 |
| Total | 740 (100.0%) | $53,600 |
Family Income by Number of Earners in Red Bay
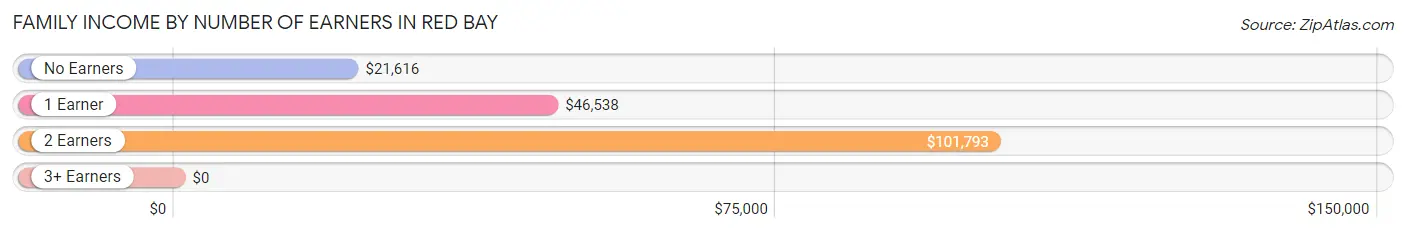
| Number of Earners | # Families | Median Income |
| No Earners | 249 (33.7%) | $21,616 |
| 1 Earner | 222 (30.0%) | $46,538 |
| 2 Earners | 265 (35.8%) | $101,793 |
| 3+ Earners | 4 (0.5%) | $0 |
| Total | 740 (100.0%) | $53,600 |
Household Income in Red Bay
Household Income Brackets in Red Bay
With 321 households falling in the category, the $15,000 to $24,999 income range is the most frequent in Red Bay, accounting for 21.6% of all households. In contrast, only 39 households (2.6%) fall into the $200,000+ income bracket, making it the least populous group.
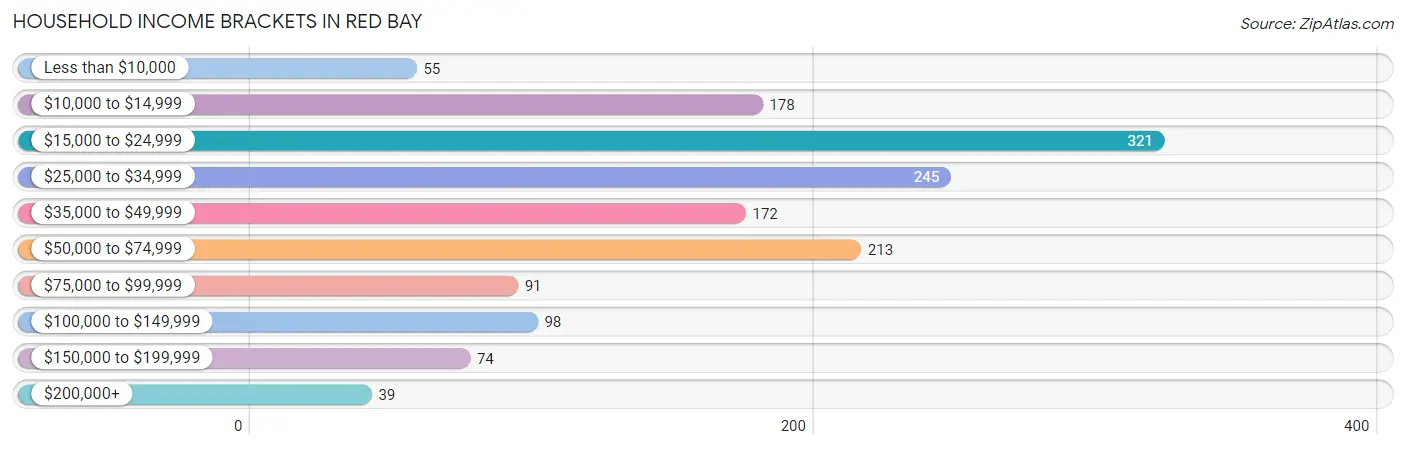
| Income Bracket | # Households | % Households |
| Less than $10,000 | 55 | 3.7% |
| $10,000 to $14,999 | 178 | 12.0% |
| $15,000 to $24,999 | 321 | 21.6% |
| $25,000 to $34,999 | 245 | 16.5% |
| $35,000 to $49,999 | 172 | 11.6% |
| $50,000 to $74,999 | 213 | 14.3% |
| $75,000 to $99,999 | 91 | 6.1% |
| $100,000 to $149,999 | 98 | 6.6% |
| $150,000 to $199,999 | 74 | 5.0% |
| $200,000+ | 39 | 2.6% |
Household Income by Householder Age in Red Bay
The median household income in Red Bay is $33,234, with the highest median household income of $37,284 found in the 25 to 44 years age bracket for the primary householder. A total of 479 households (32.2%) fall into this category. Meanwhile, the 15 to 24 years age bracket for the primary householder has the lowest median household income of $0, with 20 households (1.3%) in this group.
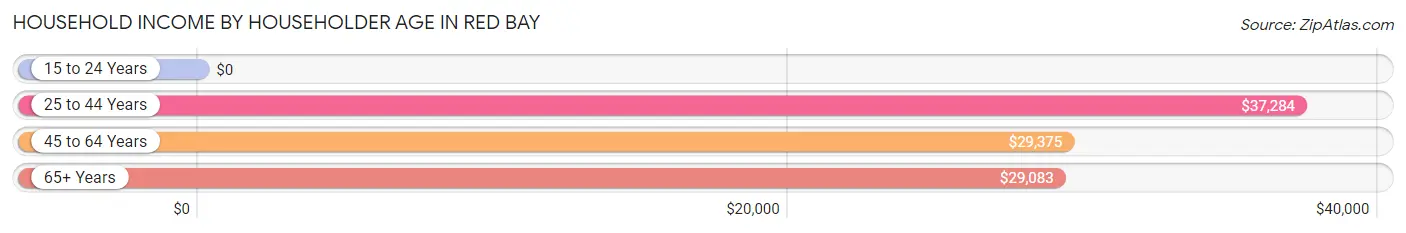
| Income Bracket | # Households | Median Income |
| 15 to 24 Years | 20 (1.3%) | $0 |
| 25 to 44 Years | 479 (32.2%) | $37,284 |
| 45 to 64 Years | 517 (34.8%) | $29,375 |
| 65+ Years | 471 (31.7%) | $29,083 |
| Total | 1,487 (100.0%) | $33,234 |
Poverty in Red Bay
Income Below Poverty by Sex and Age in Red Bay
With 21.2% poverty level for males and 23.9% for females among the residents of Red Bay, under 5 year old males and under 5 year old females are the most vulnerable to poverty, with 113 males (75.8%) and 54 females (65.8%) in their respective age groups living below the poverty level.
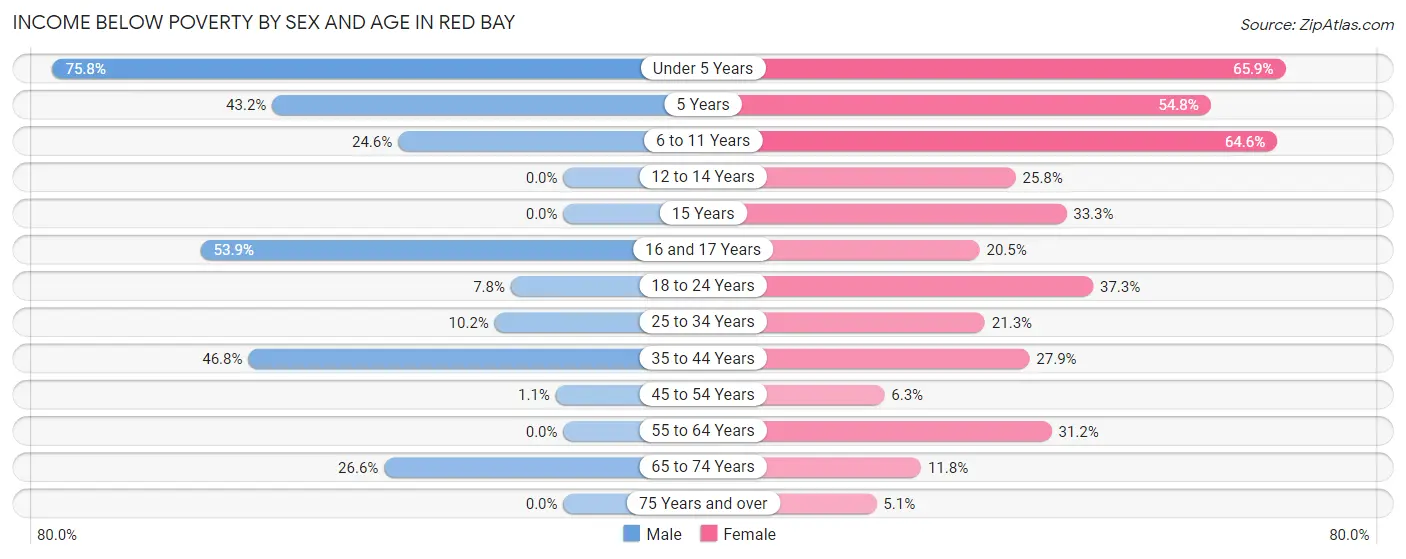
| Age Bracket | Male | Female |
| Under 5 Years | 113 (75.8%) | 54 (65.8%) |
| 5 Years | 16 (43.2%) | 23 (54.8%) |
| 6 to 11 Years | 27 (24.5%) | 53 (64.6%) |
| 12 to 14 Years | 0 (0.0%) | 8 (25.8%) |
| 15 Years | 0 (0.0%) | 8 (33.3%) |
| 16 and 17 Years | 7 (53.8%) | 9 (20.4%) |
| 18 to 24 Years | 5 (7.8%) | 25 (37.3%) |
| 25 to 34 Years | 20 (10.2%) | 51 (21.2%) |
| 35 to 44 Years | 80 (46.8%) | 39 (27.9%) |
| 45 to 54 Years | 4 (1.1%) | 12 (6.3%) |
| 55 to 64 Years | 0 (0.0%) | 95 (31.1%) |
| 65 to 74 Years | 33 (26.6%) | 20 (11.8%) |
| 75 Years and over | 0 (0.0%) | 16 (5.1%) |
| Total | 305 (21.2%) | 413 (23.9%) |
Income Above Poverty by Sex and Age in Red Bay
According to the poverty statistics in Red Bay, males aged 12 to 14 years and females aged 75 years and over are the age groups that are most secure financially, with 100.0% of males and 94.9% of females in these age groups living above the poverty line.
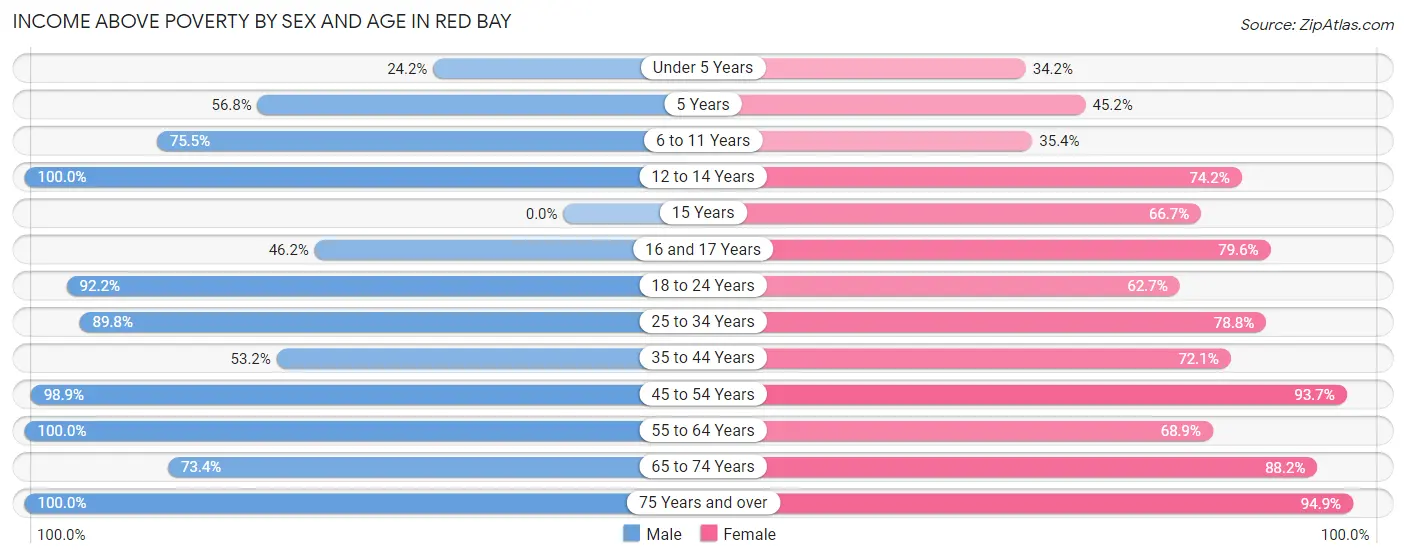
| Age Bracket | Male | Female |
| Under 5 Years | 36 (24.2%) | 28 (34.2%) |
| 5 Years | 21 (56.8%) | 19 (45.2%) |
| 6 to 11 Years | 83 (75.4%) | 29 (35.4%) |
| 12 to 14 Years | 52 (100.0%) | 23 (74.2%) |
| 15 Years | 0 (0.0%) | 16 (66.7%) |
| 16 and 17 Years | 6 (46.2%) | 35 (79.5%) |
| 18 to 24 Years | 59 (92.2%) | 42 (62.7%) |
| 25 to 34 Years | 176 (89.8%) | 189 (78.7%) |
| 35 to 44 Years | 91 (53.2%) | 101 (72.1%) |
| 45 to 54 Years | 346 (98.9%) | 178 (93.7%) |
| 55 to 64 Years | 58 (100.0%) | 210 (68.9%) |
| 65 to 74 Years | 91 (73.4%) | 150 (88.2%) |
| 75 Years and over | 116 (100.0%) | 295 (94.9%) |
| Total | 1,135 (78.8%) | 1,315 (76.1%) |
Income Below Poverty Among Married-Couple Families in Red Bay
The poverty statistics for married-couple families in Red Bay show that 7.2% or 33 of the total 459 families live below the poverty line. Families with 5 or more children have the highest poverty rate of 100.0%, comprising of 6 families. On the other hand, families with 1 or 2 children have the lowest poverty rate of 0.0%, which includes 0 families.
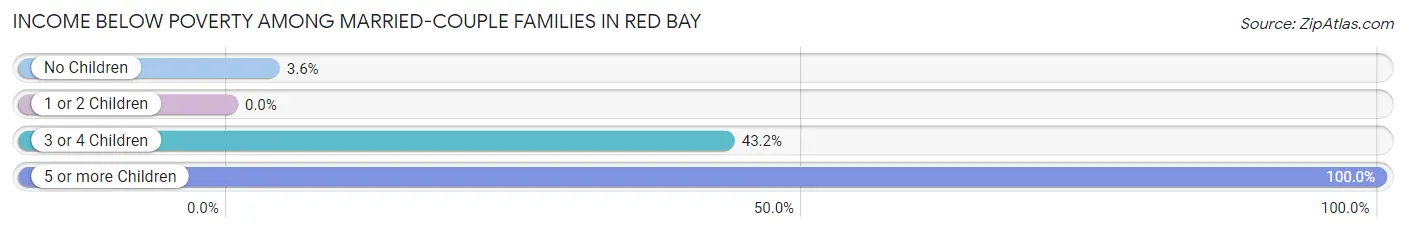
| Children | Above Poverty | Below Poverty |
| No Children | 291 (96.4%) | 11 (3.6%) |
| 1 or 2 Children | 114 (100.0%) | 0 (0.0%) |
| 3 or 4 Children | 21 (56.8%) | 16 (43.2%) |
| 5 or more Children | 0 (0.0%) | 6 (100.0%) |
| Total | 426 (92.8%) | 33 (7.2%) |
Income Below Poverty Among Single-Parent Households in Red Bay
According to the poverty data in Red Bay, 7.5% or 5 single-father households and 36.4% or 78 single-mother households are living below the poverty line. Among single-father households, those with no children have the highest poverty rate, with 5 households (8.5%) experiencing poverty. Likewise, among single-mother households, those with 1 or 2 children have the highest poverty rate, with 78 households (65.0%) falling below the poverty line.
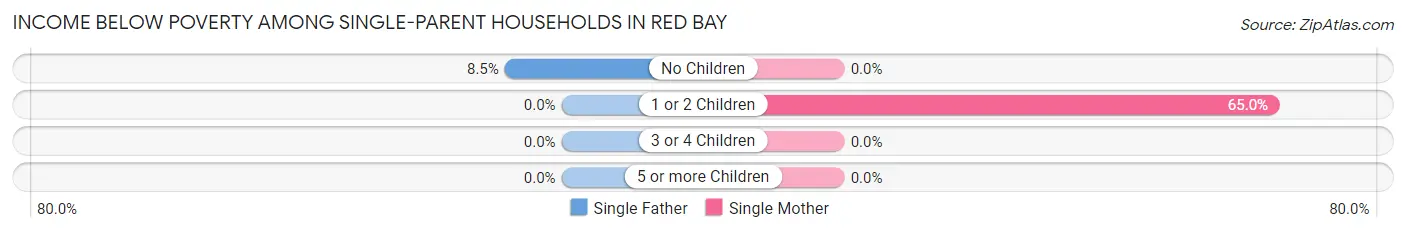
| Children | Single Father | Single Mother |
| No Children | 5 (8.5%) | 0 (0.0%) |
| 1 or 2 Children | 0 (0.0%) | 78 (65.0%) |
| 3 or 4 Children | 0 (0.0%) | 0 (0.0%) |
| 5 or more Children | 0 (0.0%) | 0 (0.0%) |
| Total | 5 (7.5%) | 78 (36.4%) |
Income Below Poverty Among Married-Couple vs Single-Parent Households in Red Bay
The poverty data for Red Bay shows that 33 of the married-couple family households (7.2%) and 83 of the single-parent households (29.5%) are living below the poverty level. Within the married-couple family households, those with 5 or more children have the highest poverty rate, with 6 households (100.0%) falling below the poverty line. Among the single-parent households, those with 1 or 2 children have the highest poverty rate, with 78 household (65.0%) living below poverty.
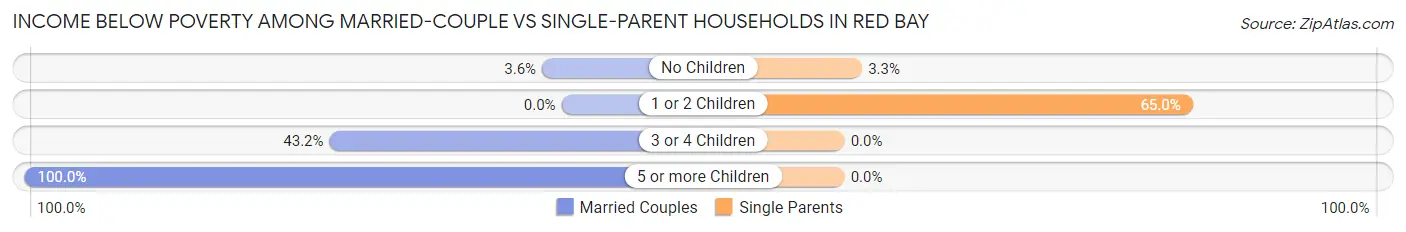
| Children | Married-Couple Families | Single-Parent Households |
| No Children | 11 (3.6%) | 5 (3.3%) |
| 1 or 2 Children | 0 (0.0%) | 78 (65.0%) |
| 3 or 4 Children | 16 (43.2%) | 0 (0.0%) |
| 5 or more Children | 6 (100.0%) | 0 (0.0%) |
| Total | 33 (7.2%) | 83 (29.5%) |
Race in Red Bay
The most populous races in Red Bay are White / Caucasian (2,902 | 90.4%), Hispanic or Latino (238 | 7.4%), and Two or more Races (198 | 6.2%).
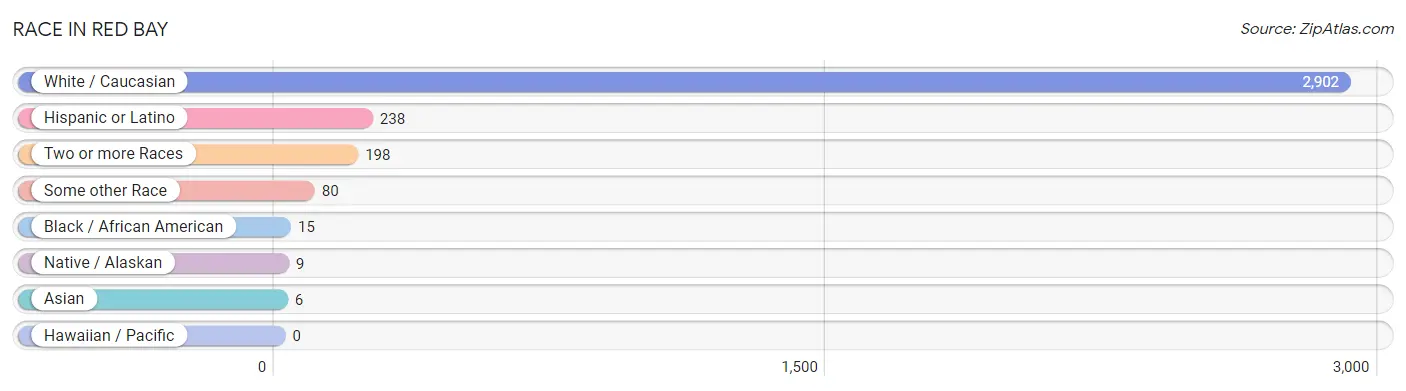
| Race | # Population | % Population |
| Asian | 6 | 0.2% |
| Black / African American | 15 | 0.5% |
| Hawaiian / Pacific | 0 | 0.0% |
| Hispanic or Latino | 238 | 7.4% |
| Native / Alaskan | 9 | 0.3% |
| White / Caucasian | 2,902 | 90.4% |
| Two or more Races | 198 | 6.2% |
| Some other Race | 80 | 2.5% |
| Total | 3,210 | 100.0% |
Ancestry in Red Bay
The most populous ancestries reported in Red Bay are American (1,351 | 42.1%), Irish (231 | 7.2%), Central American (186 | 5.8%), Scottish (137 | 4.3%), and German (128 | 4.0%), together accounting for 63.3% of all Red Bay residents.
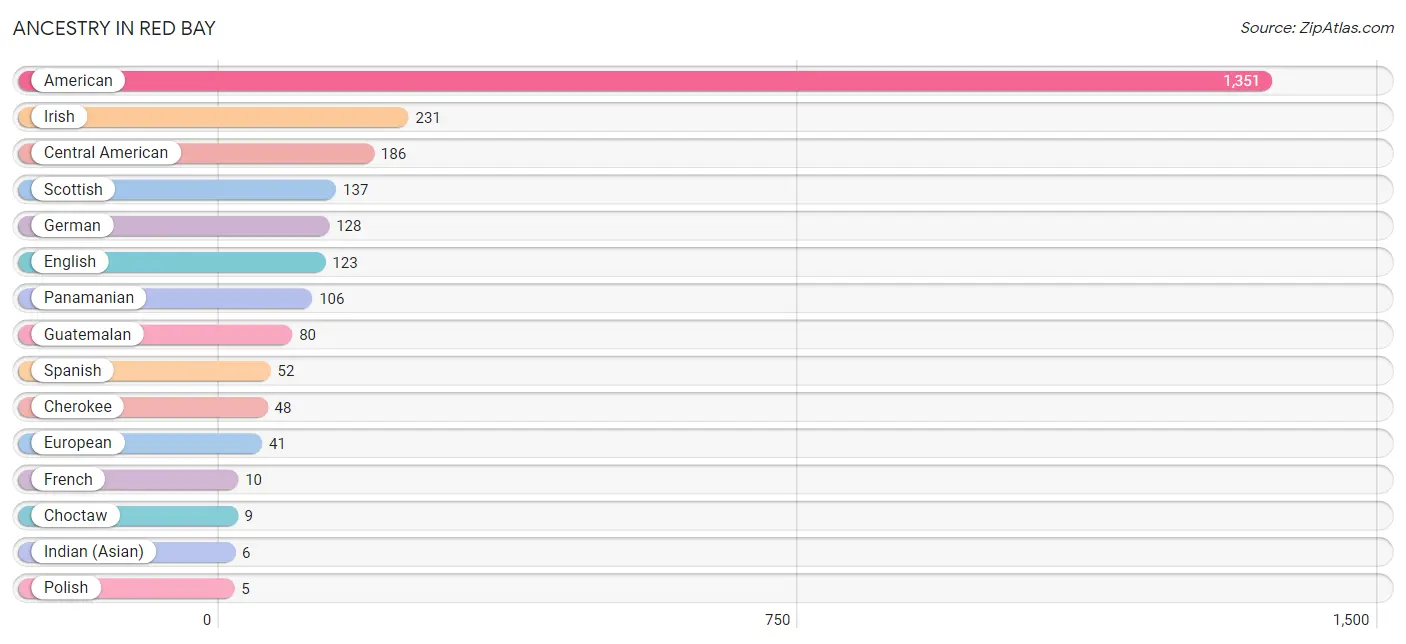
| Ancestry | # Population | % Population |
| American | 1,351 | 42.1% |
| Central American | 186 | 5.8% |
| Cherokee | 48 | 1.5% |
| Choctaw | 9 | 0.3% |
| English | 123 | 3.8% |
| European | 41 | 1.3% |
| French | 10 | 0.3% |
| German | 128 | 4.0% |
| Guatemalan | 80 | 2.5% |
| Indian (Asian) | 6 | 0.2% |
| Irish | 231 | 7.2% |
| Panamanian | 106 | 3.3% |
| Polish | 5 | 0.2% |
| Scotch-Irish | 5 | 0.2% |
| Scottish | 137 | 4.3% |
| Spanish | 52 | 1.6% | View All 16 Rows |
Immigrants in Red Bay
The most numerous immigrant groups reported in Red Bay came from Central America (20 | 0.6%), Guatemala (20 | 0.6%), Latin America (20 | 0.6%), Asia (6 | 0.2%), and China (6 | 0.2%), together accounting for 2.2% of all Red Bay residents.
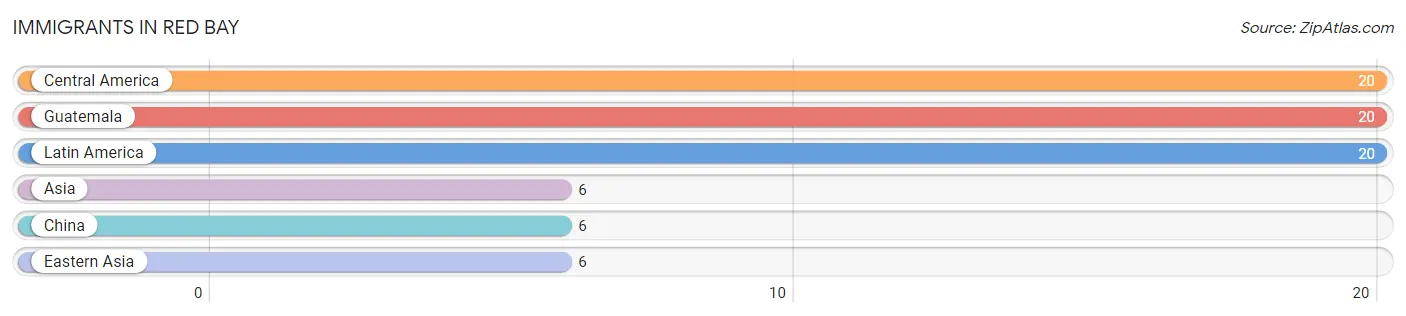
| Immigration Origin | # Population | % Population |
| Asia | 6 | 0.2% |
| Central America | 20 | 0.6% |
| China | 6 | 0.2% |
| Eastern Asia | 6 | 0.2% |
| Guatemala | 20 | 0.6% |
| Latin America | 20 | 0.6% | View All 6 Rows |
Sex and Age in Red Bay
Sex and Age in Red Bay
The most populous age groups in Red Bay are 50 to 54 Years (276 | 18.6%) for men and 55 to 59 Years (233 | 13.5%) for women.
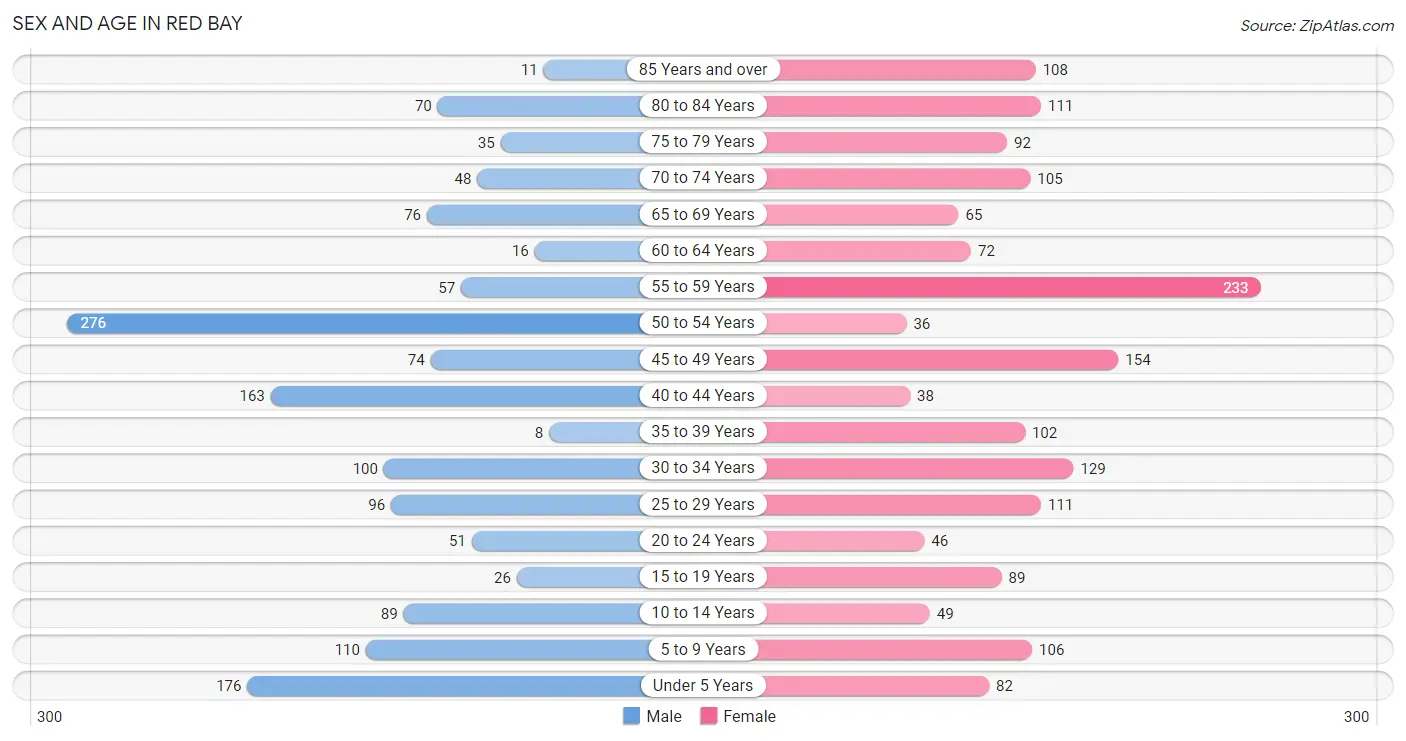
| Age Bracket | Male | Female |
| Under 5 Years | 176 (11.9%) | 82 (4.8%) |
| 5 to 9 Years | 110 (7.4%) | 106 (6.1%) |
| 10 to 14 Years | 89 (6.0%) | 49 (2.8%) |
| 15 to 19 Years | 26 (1.8%) | 89 (5.1%) |
| 20 to 24 Years | 51 (3.4%) | 46 (2.7%) |
| 25 to 29 Years | 96 (6.5%) | 111 (6.4%) |
| 30 to 34 Years | 100 (6.8%) | 129 (7.5%) |
| 35 to 39 Years | 8 (0.5%) | 102 (5.9%) |
| 40 to 44 Years | 163 (11.0%) | 38 (2.2%) |
| 45 to 49 Years | 74 (5.0%) | 154 (8.9%) |
| 50 to 54 Years | 276 (18.6%) | 36 (2.1%) |
| 55 to 59 Years | 57 (3.8%) | 233 (13.5%) |
| 60 to 64 Years | 16 (1.1%) | 72 (4.2%) |
| 65 to 69 Years | 76 (5.1%) | 65 (3.8%) |
| 70 to 74 Years | 48 (3.2%) | 105 (6.1%) |
| 75 to 79 Years | 35 (2.4%) | 92 (5.3%) |
| 80 to 84 Years | 70 (4.7%) | 111 (6.4%) |
| 85 Years and over | 11 (0.7%) | 108 (6.2%) |
| Total | 1,482 (100.0%) | 1,728 (100.0%) |
Families and Households in Red Bay
Median Family Size in Red Bay
The median family size in Red Bay is 3.08 persons per family, with single female/mother families (214 | 28.9%) accounting for the largest median family size of 3.77 persons per family. On the other hand, married-couple families (459 | 62.0%) represent the smallest median family size with 2.78 persons per family.
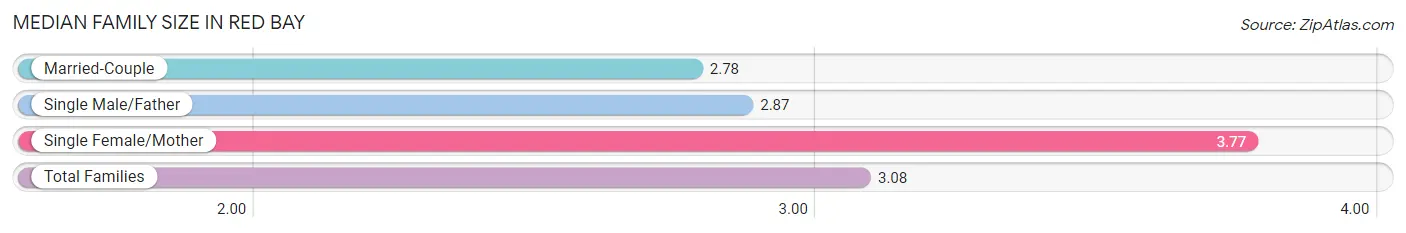
| Family Type | # Families | Family Size |
| Married-Couple | 459 (62.0%) | 2.78 |
| Single Male/Father | 67 (9.0%) | 2.87 |
| Single Female/Mother | 214 (28.9%) | 3.77 |
| Total Families | 740 (100.0%) | 3.08 |
Median Household Size in Red Bay
The median household size in Red Bay is 2.15 persons per household, with single female/mother households (214 | 14.4%) accounting for the largest median household size of 3.88 persons per household. non-family households (747 | 50.2%) represent the smallest median household size with 1.17 persons per household.
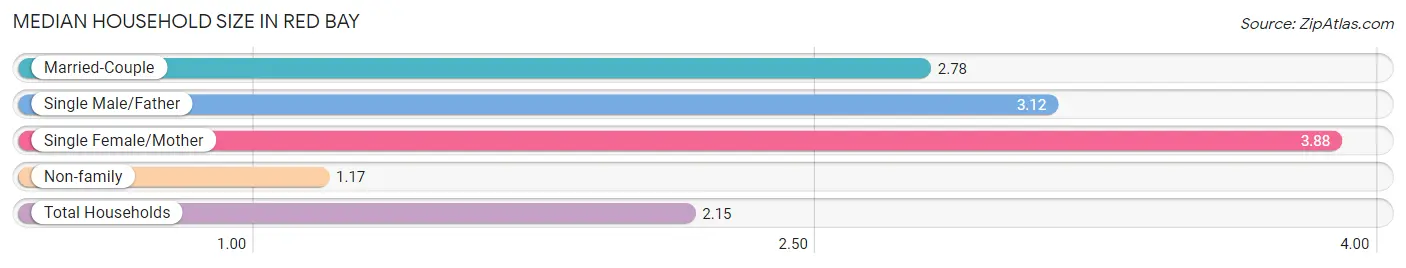
| Household Type | # Households | Household Size |
| Married-Couple | 459 (30.9%) | 2.78 |
| Single Male/Father | 67 (4.5%) | 3.12 |
| Single Female/Mother | 214 (14.4%) | 3.88 |
| Non-family | 747 (50.2%) | 1.17 |
| Total Households | 1,487 (100.0%) | 2.15 |
Household Size by Marriage Status in Red Bay
Out of a total of 1,487 households in Red Bay, 740 (49.8%) are family households, while 747 (50.2%) are nonfamily households. The most numerous type of family households are 2-person households, comprising 396, and the most common type of nonfamily households are 1-person households, comprising 612.
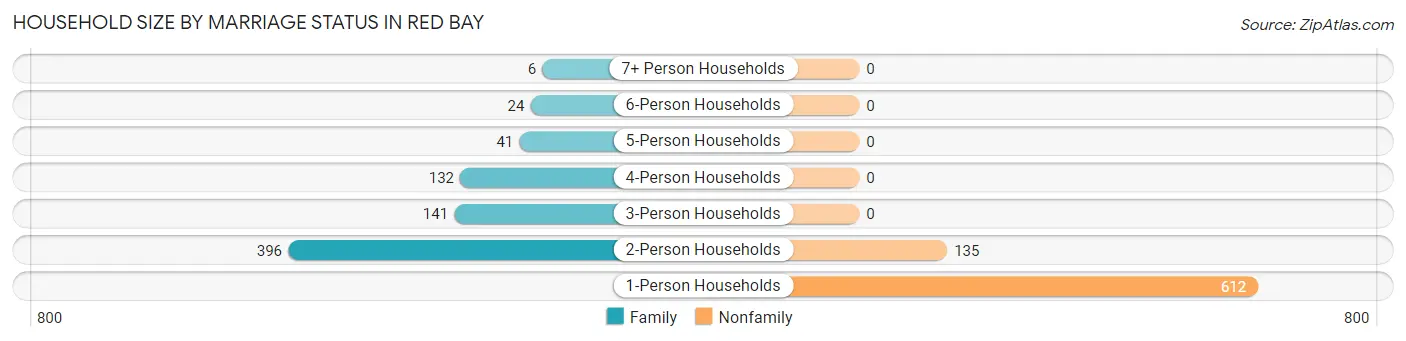
| Household Size | Family Households | Nonfamily Households |
| 1-Person Households | - | 612 (41.2%) |
| 2-Person Households | 396 (26.6%) | 135 (9.1%) |
| 3-Person Households | 141 (9.5%) | 0 (0.0%) |
| 4-Person Households | 132 (8.9%) | 0 (0.0%) |
| 5-Person Households | 41 (2.8%) | 0 (0.0%) |
| 6-Person Households | 24 (1.6%) | 0 (0.0%) |
| 7+ Person Households | 6 (0.4%) | 0 (0.0%) |
| Total | 740 (49.8%) | 747 (50.2%) |
Female Fertility in Red Bay
Fertility by Age in Red Bay
Average fertility rate in Red Bay is 30.0 births per 1,000 women. Women in the age bracket of 20 to 34 years have the highest fertility rate with 70.0 births per 1,000 women. Women in the age bracket of 20 to 34 years acount for 100.0% of all women with births.
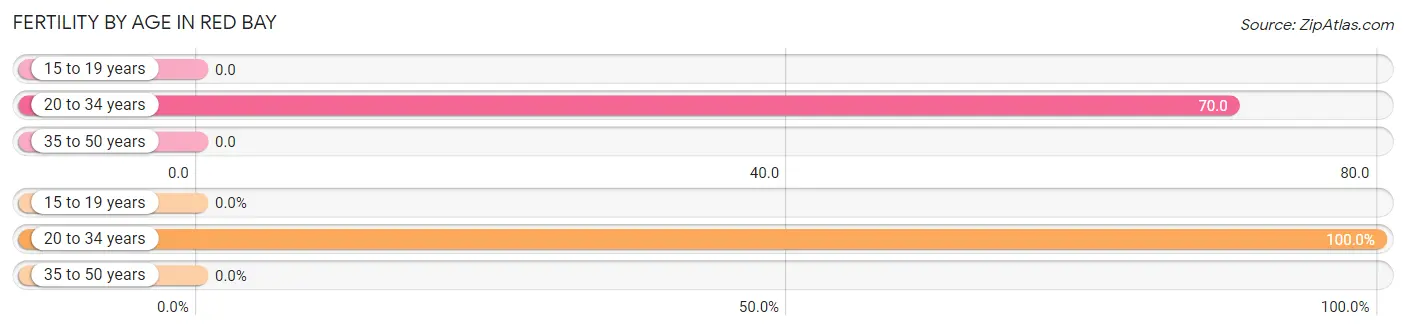
| Age Bracket | Women with Births | Births / 1,000 Women |
| 15 to 19 years | 0 (0.0%) | 0.0 |
| 20 to 34 years | 20 (100.0%) | 70.0 |
| 35 to 50 years | 0 (0.0%) | 0.0 |
| Total | 20 (100.0%) | 30.0 |
Fertility by Age by Marriage Status in Red Bay
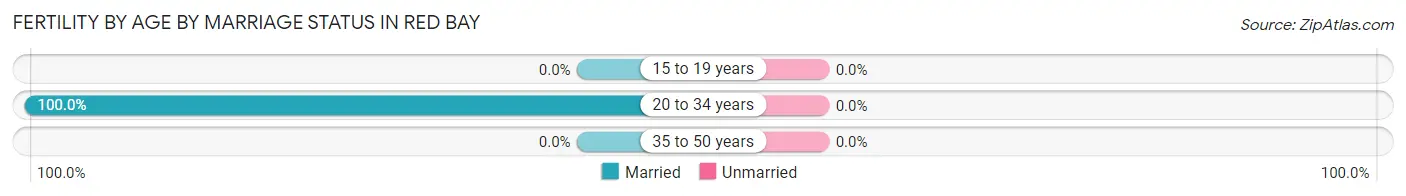
| Age Bracket | Married | Unmarried |
| 15 to 19 years | 0 (0.0%) | 0 (0.0%) |
| 20 to 34 years | 20 (100.0%) | 0 (0.0%) |
| 35 to 50 years | 0 (0.0%) | 0 (0.0%) |
| Total | 20 (100.0%) | 0 (0.0%) |
Fertility by Education in Red Bay
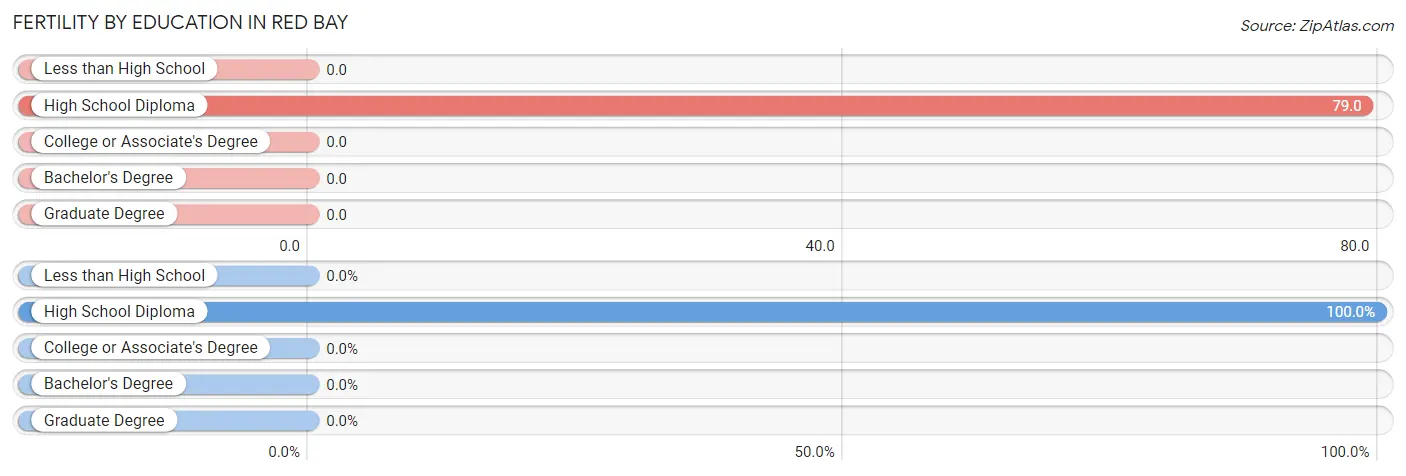
| Educational Attainment | Women with Births | Births / 1,000 Women |
| Less than High School | 0 (0.0%) | 0.0 |
| High School Diploma | 20 (100.0%) | 79.0 |
| College or Associate's Degree | 0 (0.0%) | 0.0 |
| Bachelor's Degree | 0 (0.0%) | 0.0 |
| Graduate Degree | 0 (0.0%) | 0.0 |
| Total | 20 (100.0%) | 30.0 |
Fertility by Education by Marriage Status in Red Bay
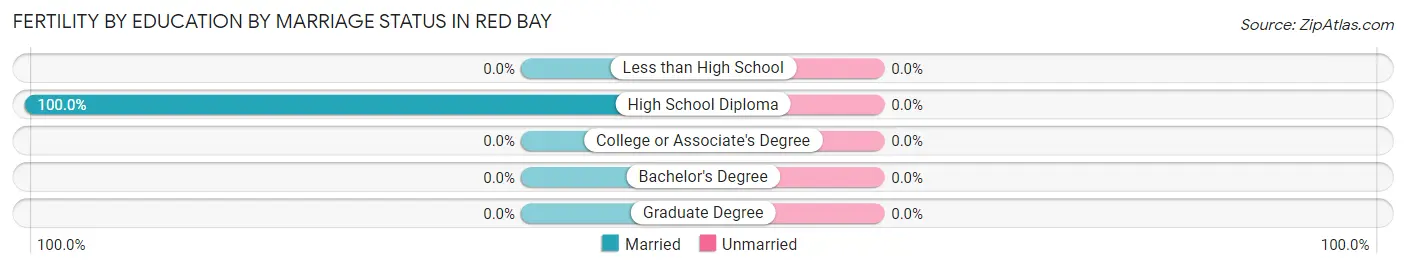
| Educational Attainment | Married | Unmarried |
| Less than High School | 0 (0.0%) | 0 (0.0%) |
| High School Diploma | 20 (100.0%) | 0 (0.0%) |
| College or Associate's Degree | 0 (0.0%) | 0 (0.0%) |
| Bachelor's Degree | 0 (0.0%) | 0 (0.0%) |
| Graduate Degree | 0 (0.0%) | 0 (0.0%) |
| Total | 20 (100.0%) | 0 (0.0%) |
Employment Characteristics in Red Bay
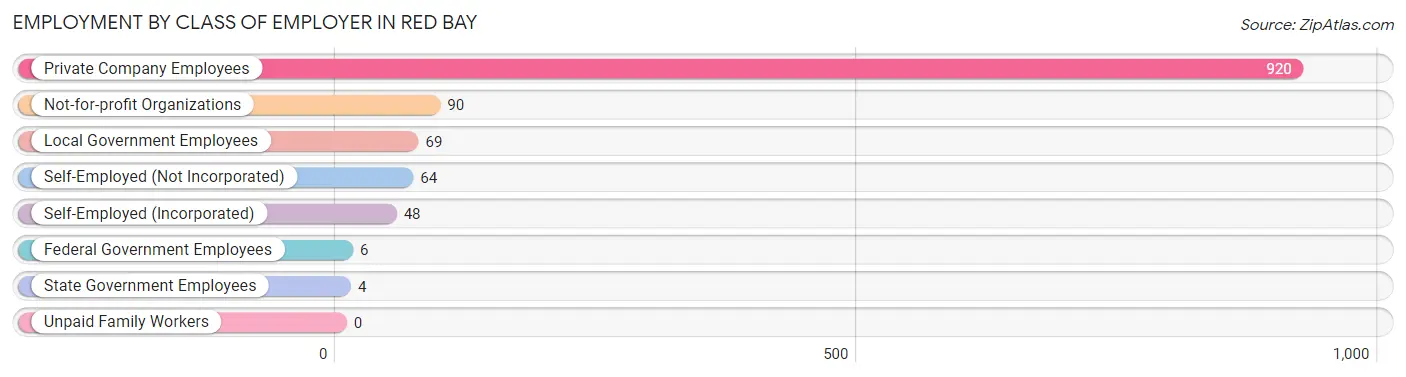
Employment by Class of Employer in Red Bay
Among the 1,201 employed individuals in Red Bay, private company employees (920 | 76.6%), not-for-profit organizations (90 | 7.5%), and local government employees (69 | 5.8%) make up the most common classes of employment.
| Employer Class | # Employees | % Employees |
| Private Company Employees | 920 | 76.6% |
| Self-Employed (Incorporated) | 48 | 4.0% |
| Self-Employed (Not Incorporated) | 64 | 5.3% |
| Not-for-profit Organizations | 90 | 7.5% |
| Local Government Employees | 69 | 5.8% |
| State Government Employees | 4 | 0.3% |
| Federal Government Employees | 6 | 0.5% |
| Unpaid Family Workers | 0 | 0.0% |
| Total | 1,201 | 100.0% |
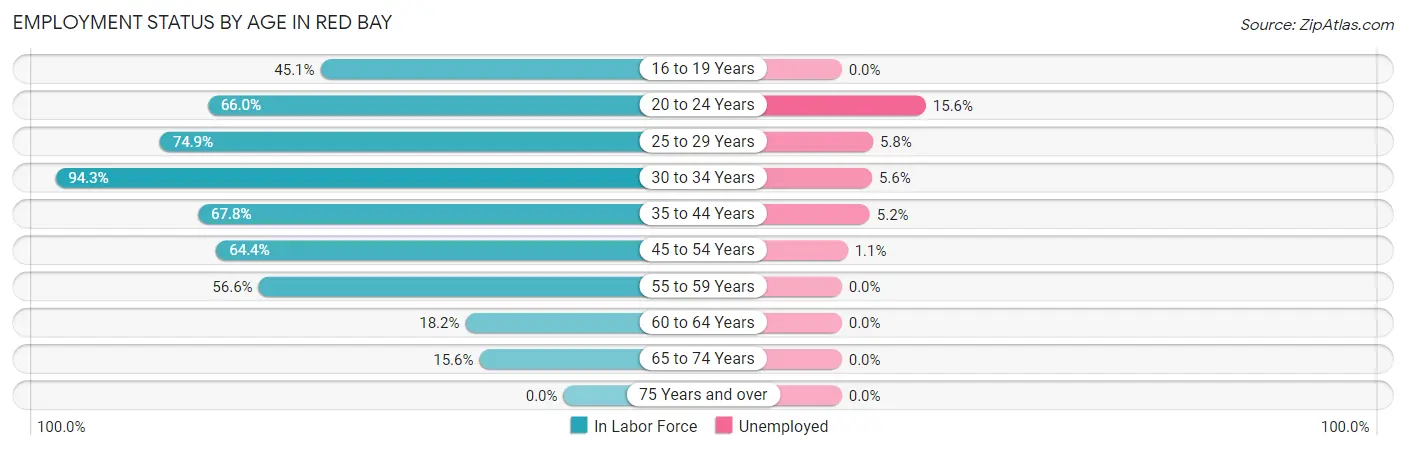
Employment Status by Age in Red Bay
According to the labor force statistics for Red Bay, out of the total population over 16 years of age (2,574), 49.0% or 1,261 individuals are in the labor force, with 3.6% or 45 of them unemployed. The age group with the highest labor force participation rate is 30 to 34 years, with 94.3% or 216 individuals in the labor force. Within the labor force, the 20 to 24 years age range has the highest percentage of unemployed individuals, with 15.6% or 10 of them being unemployed.
| Age Bracket | In Labor Force | Unemployed |
| 16 to 19 Years | 41 (45.1%) | 0 (0.0%) |
| 20 to 24 Years | 64 (66.0%) | 10 (15.6%) |
| 25 to 29 Years | 155 (74.9%) | 9 (5.8%) |
| 30 to 34 Years | 216 (94.3%) | 12 (5.6%) |
| 35 to 44 Years | 211 (67.8%) | 11 (5.2%) |
| 45 to 54 Years | 348 (64.4%) | 4 (1.1%) |
| 55 to 59 Years | 164 (56.6%) | 0 (0.0%) |
| 60 to 64 Years | 16 (18.2%) | 0 (0.0%) |
| 65 to 74 Years | 46 (15.6%) | 0 (0.0%) |
| 75 Years and over | 0 (0.0%) | 0 (0.0%) |
| Total | 1,261 (49.0%) | 45 (3.6%) |
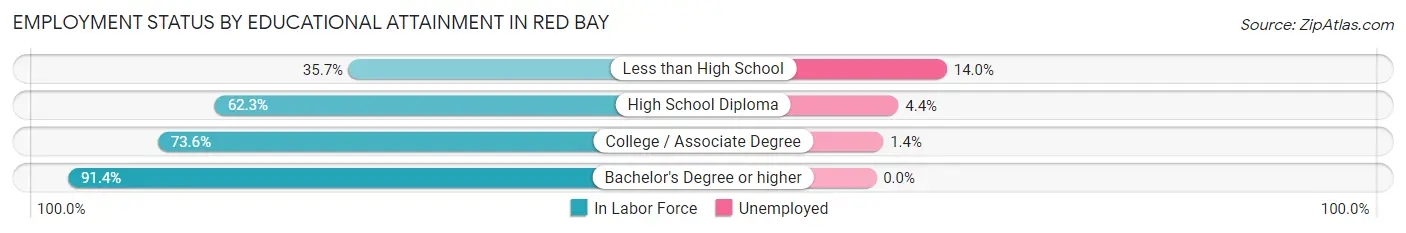
Employment Status by Educational Attainment in Red Bay
According to labor force statistics for Red Bay, 66.7% of individuals (1,111) out of the total population between 25 and 64 years of age (1,665) are in the labor force, with 3.2% or 36 of them being unemployed. The group with the highest labor force participation rate are those with the educational attainment of bachelor's degree or higher, with 91.4% or 296 individuals in the labor force. Within the labor force, individuals with less than high school education have the highest percentage of unemployment, with 14.0% or 12 of them being unemployed.
| Educational Attainment | In Labor Force | Unemployed |
| Less than High School | 86 (35.7%) | 34 (14.0%) |
| High School Diploma | 452 (62.3%) | 32 (4.4%) |
| College / Associate Degree | 276 (73.6%) | 5 (1.4%) |
| Bachelor's Degree or higher | 296 (91.4%) | 0 (0.0%) |
| Total | 1,111 (66.7%) | 53 (3.2%) |
Employment Occupations by Sex in Red Bay
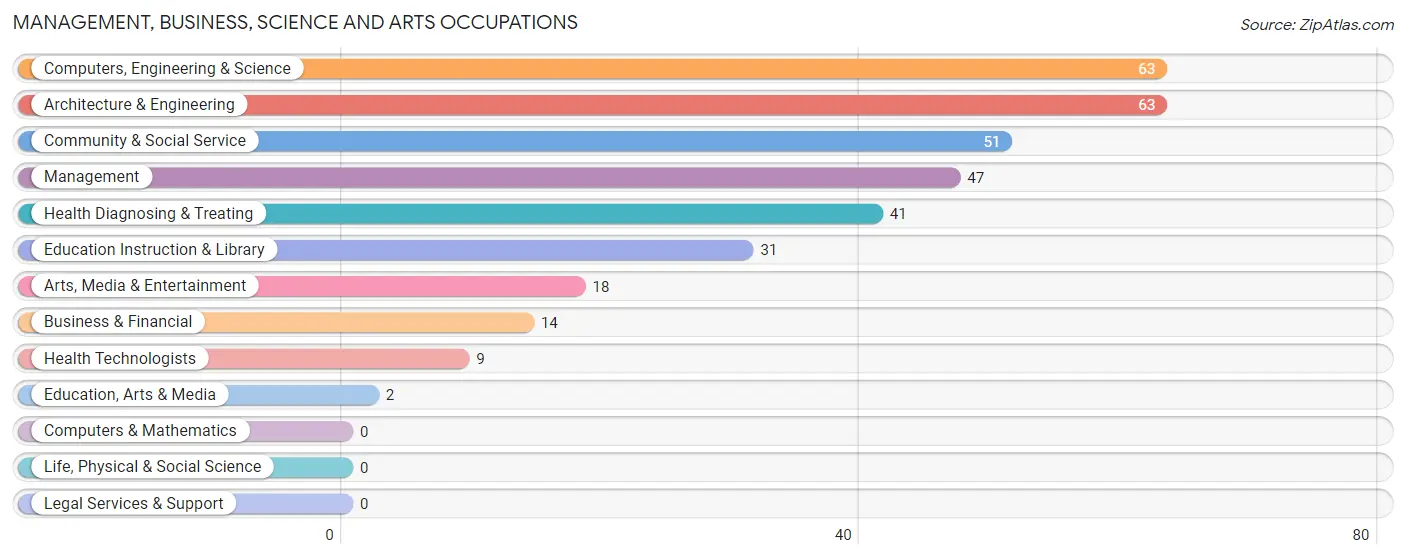
Management, Business, Science and Arts Occupations
The most common Management, Business, Science and Arts occupations in Red Bay are Computers, Engineering & Science (63 | 5.2%), Architecture & Engineering (63 | 5.2%), Community & Social Service (51 | 4.2%), Management (47 | 3.9%), and Health Diagnosing & Treating (41 | 3.4%).
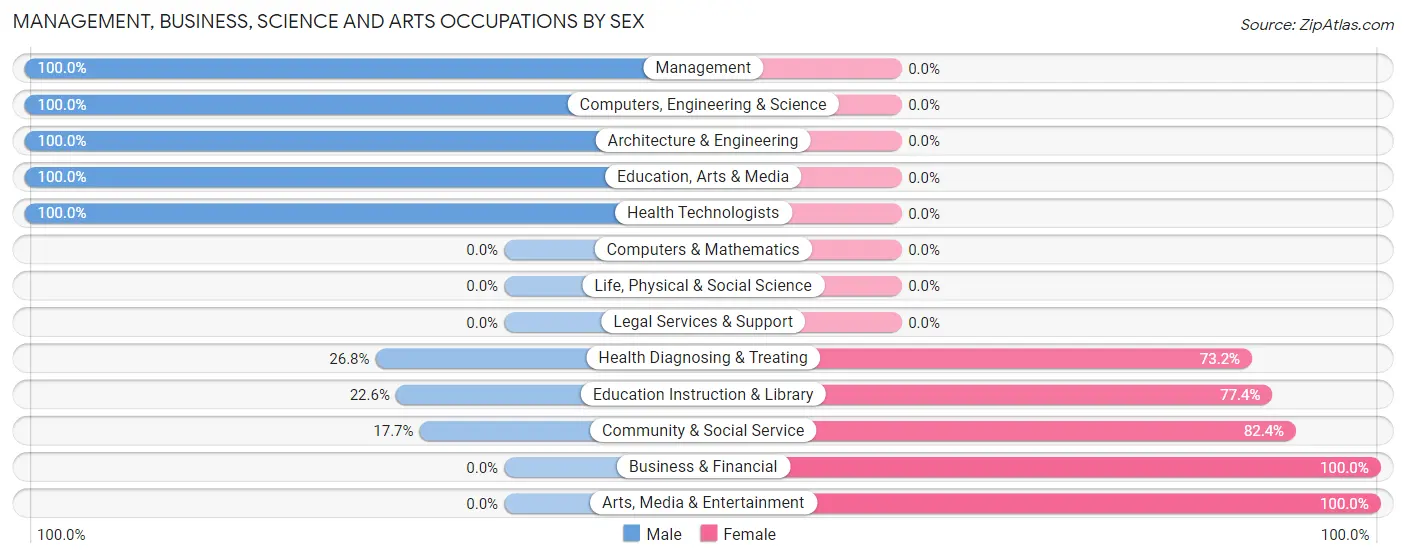
Management, Business, Science and Arts Occupations by Sex
Within the Management, Business, Science and Arts occupations in Red Bay, the most male-oriented occupations are Management (100.0%), Computers, Engineering & Science (100.0%), and Architecture & Engineering (100.0%), while the most female-oriented occupations are Business & Financial (100.0%), Arts, Media & Entertainment (100.0%), and Community & Social Service (82.4%).
| Occupation | Male | Female |
| Management | 47 (100.0%) | 0 (0.0%) |
| Business & Financial | 0 (0.0%) | 14 (100.0%) |
| Computers, Engineering & Science | 63 (100.0%) | 0 (0.0%) |
| Computers & Mathematics | 0 (0.0%) | 0 (0.0%) |
| Architecture & Engineering | 63 (100.0%) | 0 (0.0%) |
| Life, Physical & Social Science | 0 (0.0%) | 0 (0.0%) |
| Community & Social Service | 9 (17.6%) | 42 (82.4%) |
| Education, Arts & Media | 2 (100.0%) | 0 (0.0%) |
| Legal Services & Support | 0 (0.0%) | 0 (0.0%) |
| Education Instruction & Library | 7 (22.6%) | 24 (77.4%) |
| Arts, Media & Entertainment | 0 (0.0%) | 18 (100.0%) |
| Health Diagnosing & Treating | 11 (26.8%) | 30 (73.2%) |
| Health Technologists | 9 (100.0%) | 0 (0.0%) |
| Total (Category) | 130 (60.2%) | 86 (39.8%) |
| Total (Overall) | 646 (53.2%) | 569 (46.8%) |
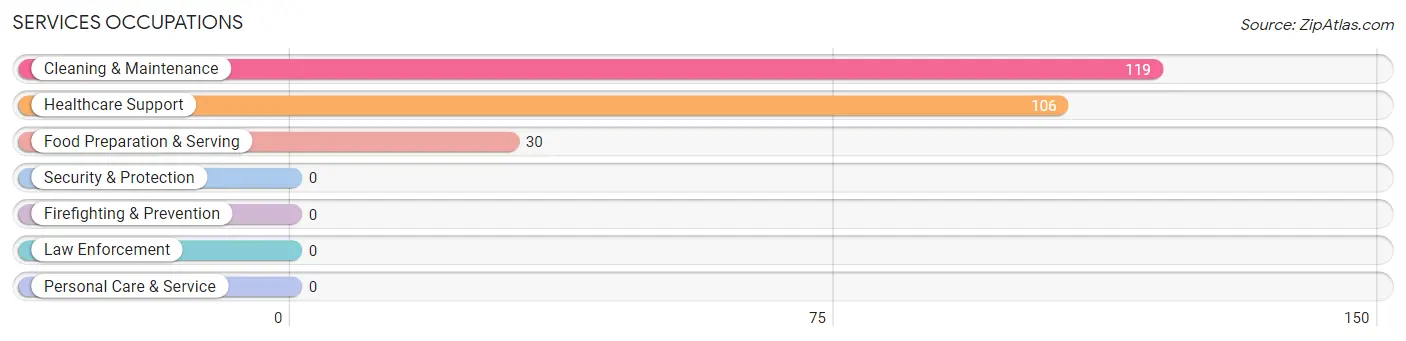
Services Occupations
The most common Services occupations in Red Bay are Cleaning & Maintenance (119 | 9.8%), Healthcare Support (106 | 8.7%), and Food Preparation & Serving (30 | 2.5%).
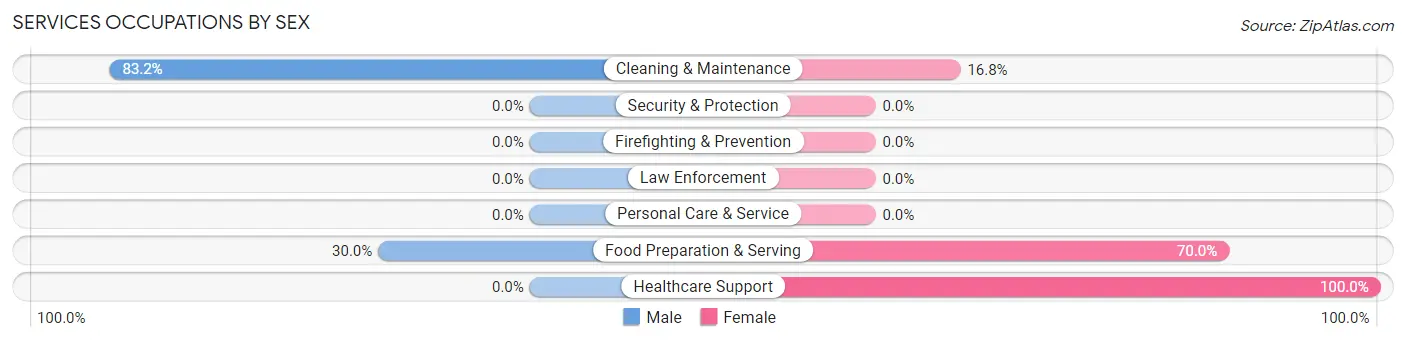
Services Occupations by Sex
Within the Services occupations in Red Bay, the most male-oriented occupations are Cleaning & Maintenance (83.2%), and Food Preparation & Serving (30.0%), while the most female-oriented occupations are Healthcare Support (100.0%), Food Preparation & Serving (70.0%), and Cleaning & Maintenance (16.8%).
| Occupation | Male | Female |
| Healthcare Support | 0 (0.0%) | 106 (100.0%) |
| Security & Protection | 0 (0.0%) | 0 (0.0%) |
| Firefighting & Prevention | 0 (0.0%) | 0 (0.0%) |
| Law Enforcement | 0 (0.0%) | 0 (0.0%) |
| Food Preparation & Serving | 9 (30.0%) | 21 (70.0%) |
| Cleaning & Maintenance | 99 (83.2%) | 20 (16.8%) |
| Personal Care & Service | 0 (0.0%) | 0 (0.0%) |
| Total (Category) | 108 (42.3%) | 147 (57.7%) |
| Total (Overall) | 646 (53.2%) | 569 (46.8%) |
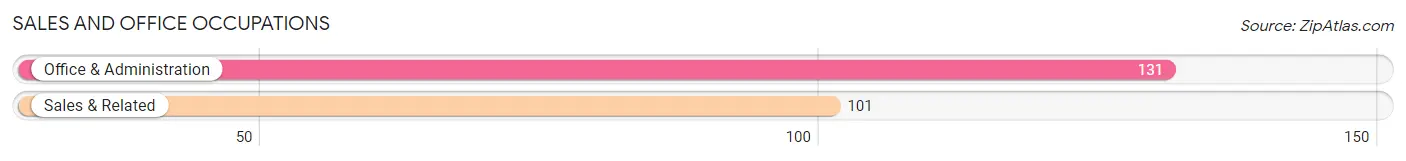
Sales and Office Occupations
The most common Sales and Office occupations in Red Bay are Office & Administration (131 | 10.8%), and Sales & Related (101 | 8.3%).
Sales and Office Occupations by Sex
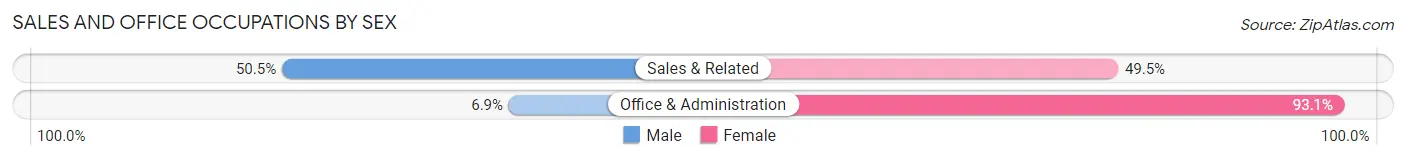
| Occupation | Male | Female |
| Sales & Related | 51 (50.5%) | 50 (49.5%) |
| Office & Administration | 9 (6.9%) | 122 (93.1%) |
| Total (Category) | 60 (25.9%) | 172 (74.1%) |
| Total (Overall) | 646 (53.2%) | 569 (46.8%) |
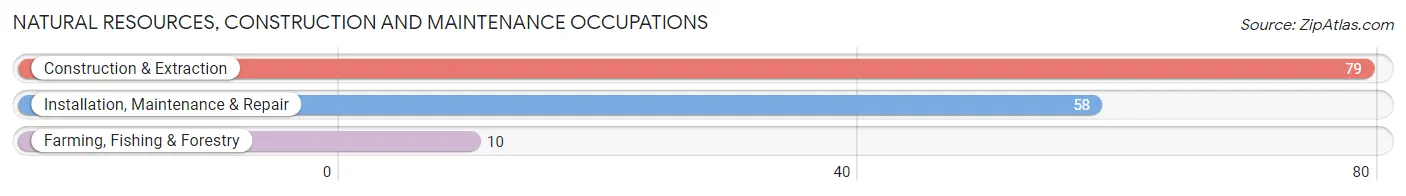
Natural Resources, Construction and Maintenance Occupations
The most common Natural Resources, Construction and Maintenance occupations in Red Bay are Construction & Extraction (79 | 6.5%), Installation, Maintenance & Repair (58 | 4.8%), and Farming, Fishing & Forestry (10 | 0.8%).
Natural Resources, Construction and Maintenance Occupations by Sex
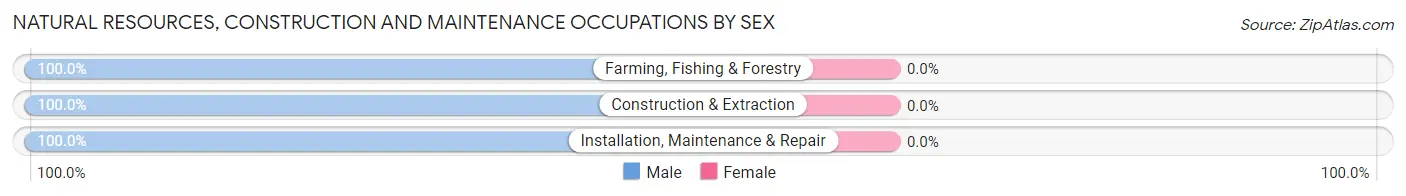
| Occupation | Male | Female |
| Farming, Fishing & Forestry | 10 (100.0%) | 0 (0.0%) |
| Construction & Extraction | 79 (100.0%) | 0 (0.0%) |
| Installation, Maintenance & Repair | 58 (100.0%) | 0 (0.0%) |
| Total (Category) | 147 (100.0%) | 0 (0.0%) |
| Total (Overall) | 646 (53.2%) | 569 (46.8%) |
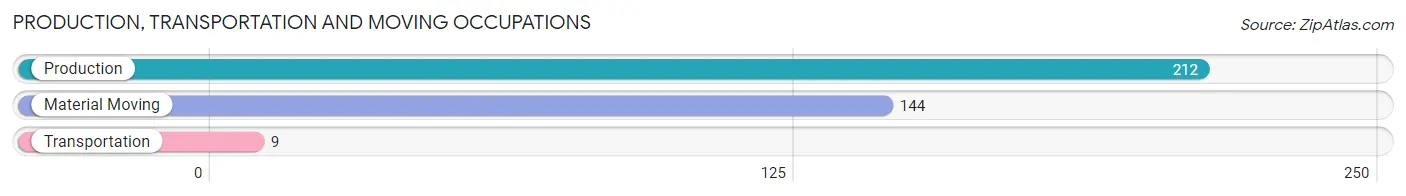
Production, Transportation and Moving Occupations
The most common Production, Transportation and Moving occupations in Red Bay are Production (212 | 17.4%), Material Moving (144 | 11.8%), and Transportation (9 | 0.7%).
Production, Transportation and Moving Occupations by Sex
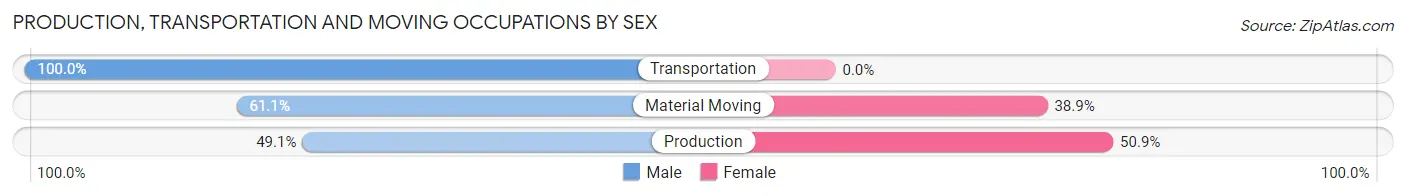
| Occupation | Male | Female |
| Production | 104 (49.1%) | 108 (50.9%) |
| Transportation | 9 (100.0%) | 0 (0.0%) |
| Material Moving | 88 (61.1%) | 56 (38.9%) |
| Total (Category) | 201 (55.1%) | 164 (44.9%) |
| Total (Overall) | 646 (53.2%) | 569 (46.8%) |
Employment Industries by Sex in Red Bay
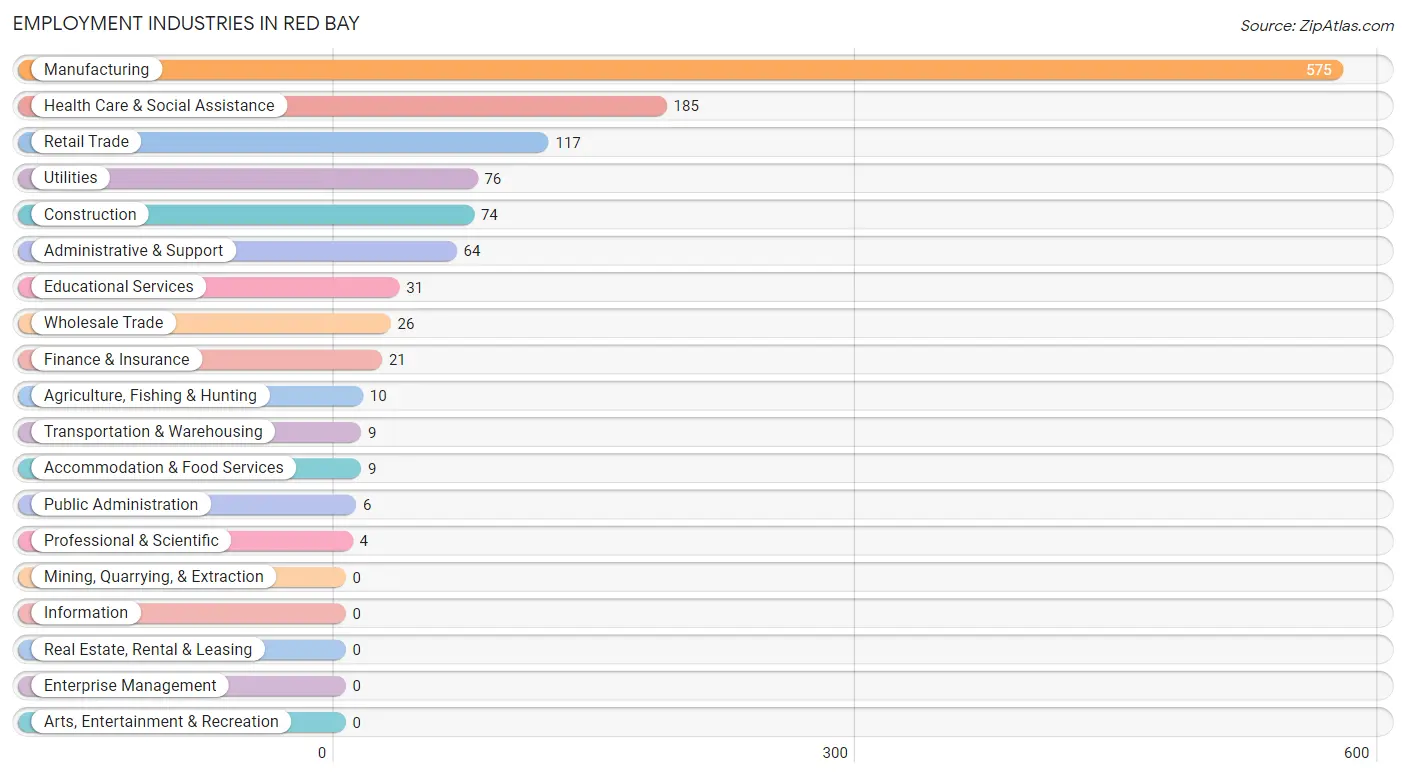
Employment Industries in Red Bay
The major employment industries in Red Bay include Manufacturing (575 | 47.3%), Health Care & Social Assistance (185 | 15.2%), Retail Trade (117 | 9.6%), Utilities (76 | 6.3%), and Construction (74 | 6.1%).
Employment Industries by Sex in Red Bay
The Red Bay industries that see more men than women are Agriculture, Fishing & Hunting (100.0%), Construction (100.0%), and Wholesale Trade (100.0%), whereas the industries that tend to have a higher number of women are Finance & Insurance (100.0%), Professional & Scientific (100.0%), and Public Administration (100.0%).
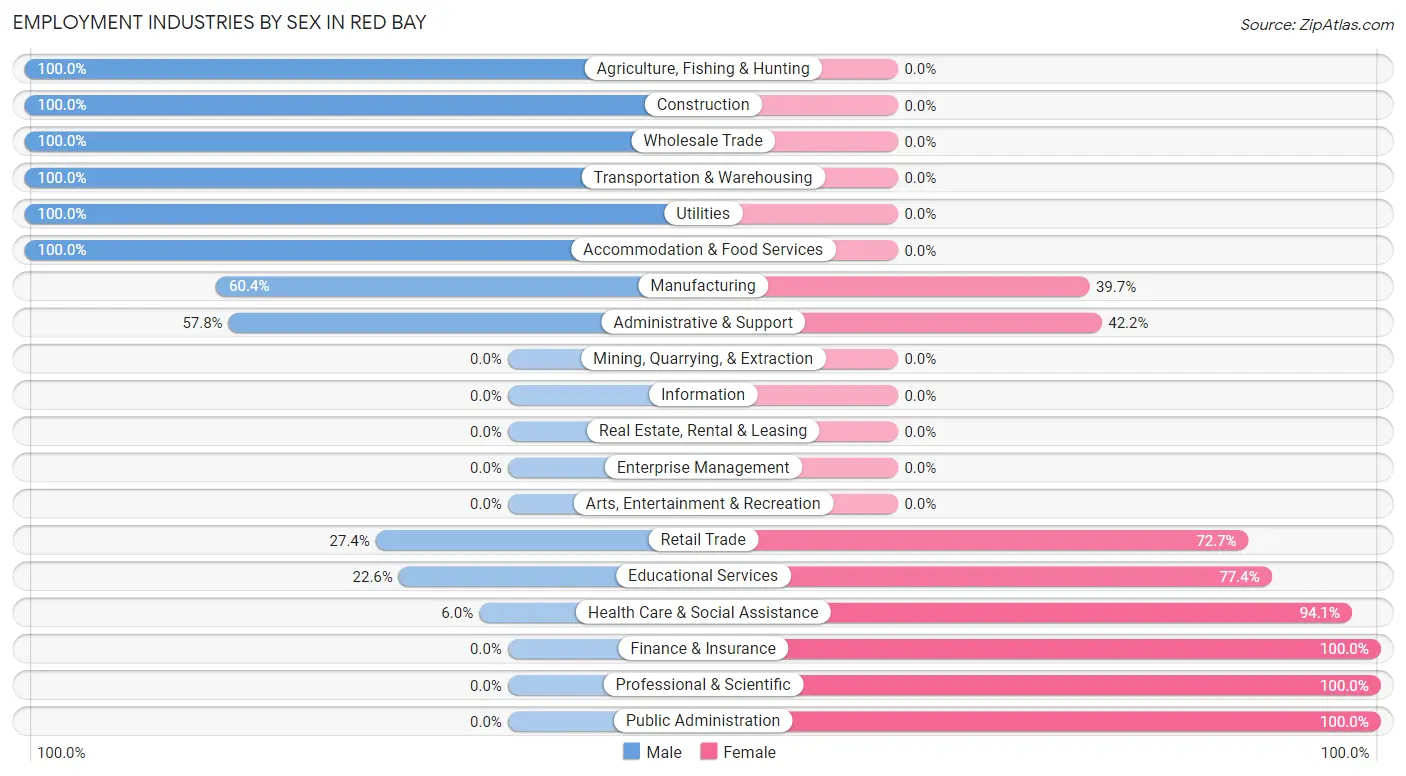
| Industry | Male | Female |
| Agriculture, Fishing & Hunting | 10 (100.0%) | 0 (0.0%) |
| Mining, Quarrying, & Extraction | 0 (0.0%) | 0 (0.0%) |
| Construction | 74 (100.0%) | 0 (0.0%) |
| Manufacturing | 347 (60.4%) | 228 (39.7%) |
| Wholesale Trade | 26 (100.0%) | 0 (0.0%) |
| Retail Trade | 32 (27.4%) | 85 (72.7%) |
| Transportation & Warehousing | 9 (100.0%) | 0 (0.0%) |
| Utilities | 76 (100.0%) | 0 (0.0%) |
| Information | 0 (0.0%) | 0 (0.0%) |
| Finance & Insurance | 0 (0.0%) | 21 (100.0%) |
| Real Estate, Rental & Leasing | 0 (0.0%) | 0 (0.0%) |
| Professional & Scientific | 0 (0.0%) | 4 (100.0%) |
| Enterprise Management | 0 (0.0%) | 0 (0.0%) |
| Administrative & Support | 37 (57.8%) | 27 (42.2%) |
| Educational Services | 7 (22.6%) | 24 (77.4%) |
| Health Care & Social Assistance | 11 (5.9%) | 174 (94.1%) |
| Arts, Entertainment & Recreation | 0 (0.0%) | 0 (0.0%) |
| Accommodation & Food Services | 9 (100.0%) | 0 (0.0%) |
| Public Administration | 0 (0.0%) | 6 (100.0%) |
| Total | 646 (53.2%) | 569 (46.8%) |
Education in Red Bay
School Enrollment in Red Bay
The most common levels of schooling among the 482 students in Red Bay are elementary school (138 | 28.6%), high school (123 | 25.5%), and middle school (93 | 19.3%).
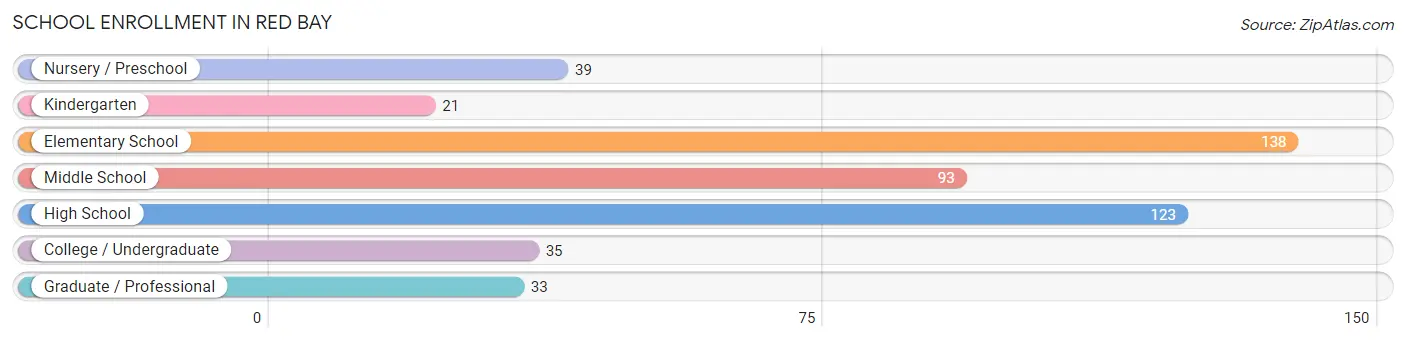
| School Level | # Students | % Students |
| Nursery / Preschool | 39 | 8.1% |
| Kindergarten | 21 | 4.4% |
| Elementary School | 138 | 28.6% |
| Middle School | 93 | 19.3% |
| High School | 123 | 25.5% |
| College / Undergraduate | 35 | 7.3% |
| Graduate / Professional | 33 | 6.9% |
| Total | 482 | 100.0% |
School Enrollment by Age by Funding Source in Red Bay
Out of a total of 482 students who are enrolled in schools in Red Bay, 78 (16.2%) attend a private institution, while the remaining 404 (83.8%) are enrolled in public schools. The age group of 35 years and over has the highest likelihood of being enrolled in private schools, with 25 (43.9% in the age bracket) enrolled. Conversely, the age group of 3 to 4 year olds has the lowest likelihood of being enrolled in a private school, with 3 (100.0% in the age bracket) attending a public institution.
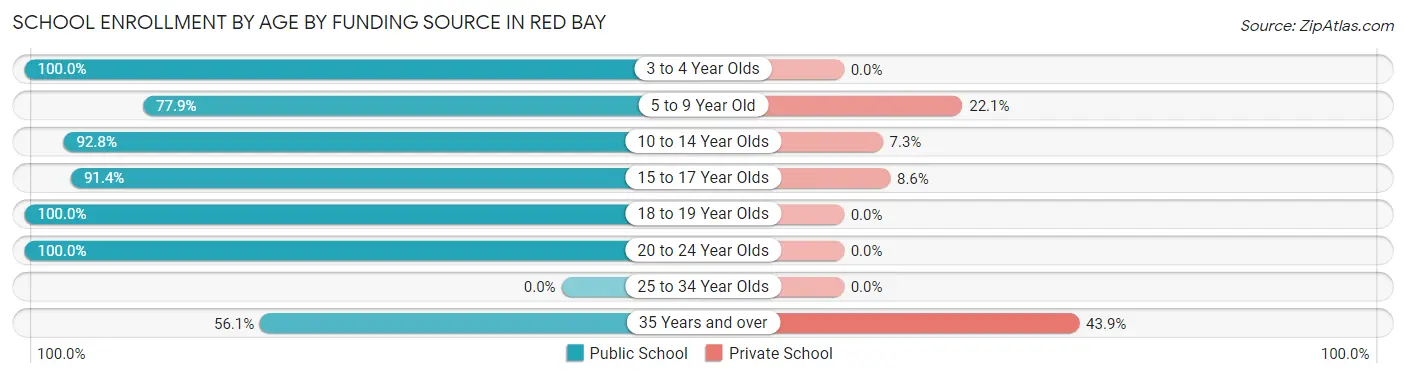
| Age Bracket | Public School | Private School |
| 3 to 4 Year Olds | 3 (100.0%) | 0 (0.0%) |
| 5 to 9 Year Old | 127 (77.9%) | 36 (22.1%) |
| 10 to 14 Year Olds | 128 (92.7%) | 10 (7.2%) |
| 15 to 17 Year Olds | 74 (91.4%) | 7 (8.6%) |
| 18 to 19 Year Olds | 21 (100.0%) | 0 (0.0%) |
| 20 to 24 Year Olds | 19 (100.0%) | 0 (0.0%) |
| 25 to 34 Year Olds | 0 (0.0%) | 0 (0.0%) |
| 35 Years and over | 32 (56.1%) | 25 (43.9%) |
| Total | 404 (83.8%) | 78 (16.2%) |
Educational Attainment by Field of Study in Red Bay
Education (83 | 22.3%), social sciences (81 | 21.8%), business (66 | 17.7%), engineering (63 | 16.9%), and arts & humanities (44 | 11.8%) are the most common fields of study among 372 individuals in Red Bay who have obtained a bachelor's degree or higher.
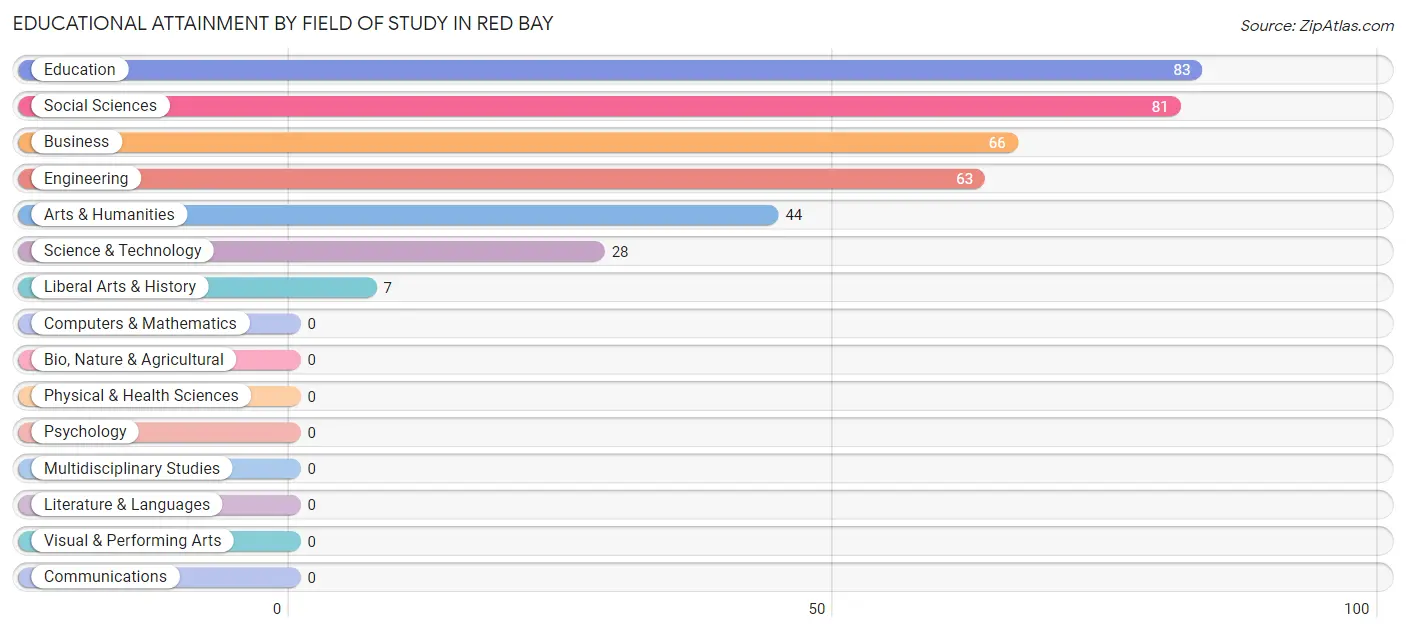
| Field of Study | # Graduates | % Graduates |
| Computers & Mathematics | 0 | 0.0% |
| Bio, Nature & Agricultural | 0 | 0.0% |
| Physical & Health Sciences | 0 | 0.0% |
| Psychology | 0 | 0.0% |
| Social Sciences | 81 | 21.8% |
| Engineering | 63 | 16.9% |
| Multidisciplinary Studies | 0 | 0.0% |
| Science & Technology | 28 | 7.5% |
| Business | 66 | 17.7% |
| Education | 83 | 22.3% |
| Literature & Languages | 0 | 0.0% |
| Liberal Arts & History | 7 | 1.9% |
| Visual & Performing Arts | 0 | 0.0% |
| Communications | 0 | 0.0% |
| Arts & Humanities | 44 | 11.8% |
| Total | 372 | 100.0% |
Transportation & Commute in Red Bay
Vehicle Availability by Sex in Red Bay
The most prevalent vehicle ownership categories in Red Bay are males with 1 vehicle (265, accounting for 41.0%) and females with 1 vehicle (83, making up 47.7%).
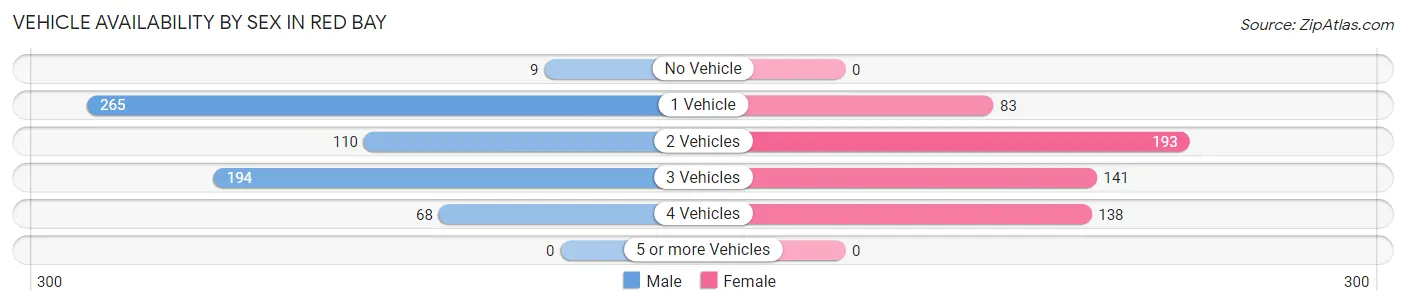
| Vehicles Available | Male | Female |
| No Vehicle | 9 (1.4%) | 0 (0.0%) |
| 1 Vehicle | 265 (41.0%) | 83 (14.9%) |
| 2 Vehicles | 110 (17.0%) | 193 (34.8%) |
| 3 Vehicles | 194 (30.0%) | 141 (25.4%) |
| 4 Vehicles | 68 (10.5%) | 138 (24.9%) |
| 5 or more Vehicles | 0 (0.0%) | 0 (0.0%) |
| Total | 646 (100.0%) | 555 (100.0%) |
Commute Time in Red Bay
The most frequently occuring commute durations in Red Bay are 10 to 14 minutes (243 commuters, 20.3%), 30 to 34 minutes (224 commuters, 18.7%), and 5 to 9 minutes (180 commuters, 15.1%).
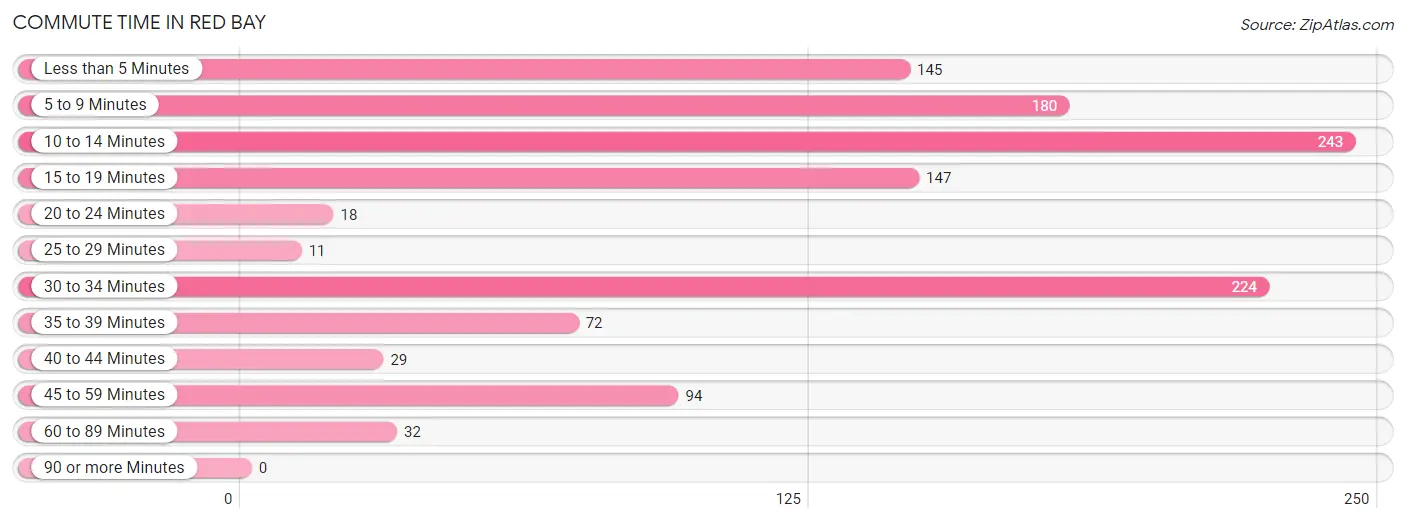
| Commute Time | # Commuters | % Commuters |
| Less than 5 Minutes | 145 | 12.1% |
| 5 to 9 Minutes | 180 | 15.1% |
| 10 to 14 Minutes | 243 | 20.3% |
| 15 to 19 Minutes | 147 | 12.3% |
| 20 to 24 Minutes | 18 | 1.5% |
| 25 to 29 Minutes | 11 | 0.9% |
| 30 to 34 Minutes | 224 | 18.7% |
| 35 to 39 Minutes | 72 | 6.0% |
| 40 to 44 Minutes | 29 | 2.4% |
| 45 to 59 Minutes | 94 | 7.9% |
| 60 to 89 Minutes | 32 | 2.7% |
| 90 or more Minutes | 0 | 0.0% |
Commute Time by Sex in Red Bay
The most common commute times in Red Bay are 10 to 14 minutes (147 commuters, 23.0%) for males and 10 to 14 minutes (96 commuters, 17.3%) for females.
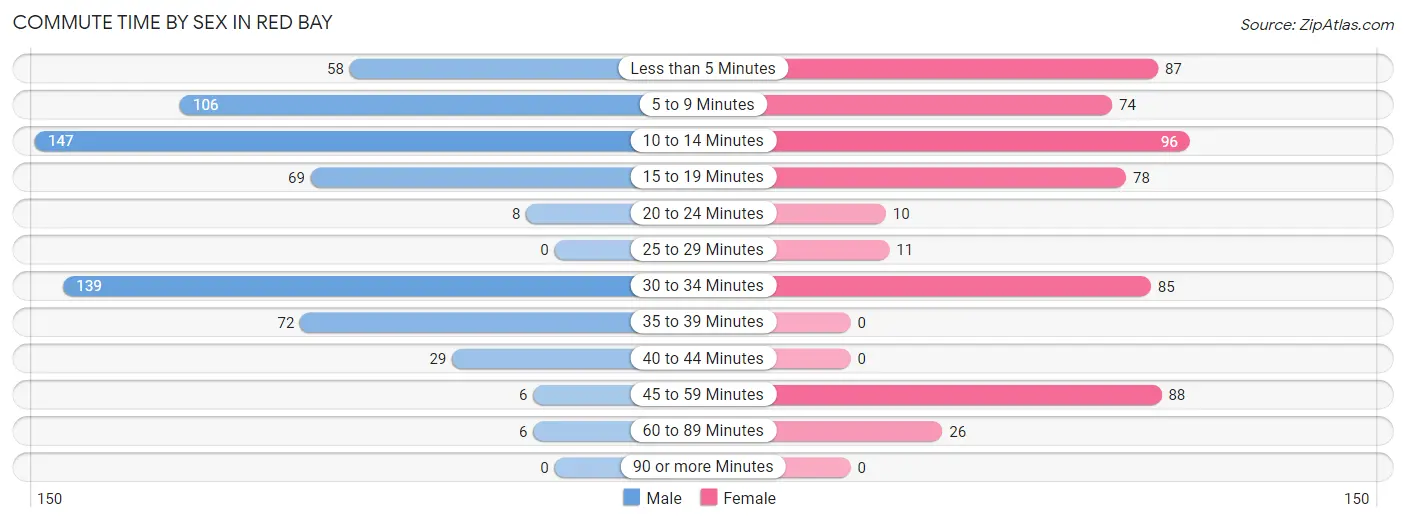
| Commute Time | Male | Female |
| Less than 5 Minutes | 58 (9.1%) | 87 (15.7%) |
| 5 to 9 Minutes | 106 (16.6%) | 74 (13.3%) |
| 10 to 14 Minutes | 147 (23.0%) | 96 (17.3%) |
| 15 to 19 Minutes | 69 (10.8%) | 78 (14.1%) |
| 20 to 24 Minutes | 8 (1.3%) | 10 (1.8%) |
| 25 to 29 Minutes | 0 (0.0%) | 11 (2.0%) |
| 30 to 34 Minutes | 139 (21.7%) | 85 (15.3%) |
| 35 to 39 Minutes | 72 (11.3%) | 0 (0.0%) |
| 40 to 44 Minutes | 29 (4.5%) | 0 (0.0%) |
| 45 to 59 Minutes | 6 (0.9%) | 88 (15.9%) |
| 60 to 89 Minutes | 6 (0.9%) | 26 (4.7%) |
| 90 or more Minutes | 0 (0.0%) | 0 (0.0%) |
Time of Departure to Work by Sex in Red Bay
The most frequent times of departure to work in Red Bay are 6:30 AM to 6:59 AM (149, 23.3%) for males and 7:00 AM to 7:29 AM (122, 22.0%) for females.
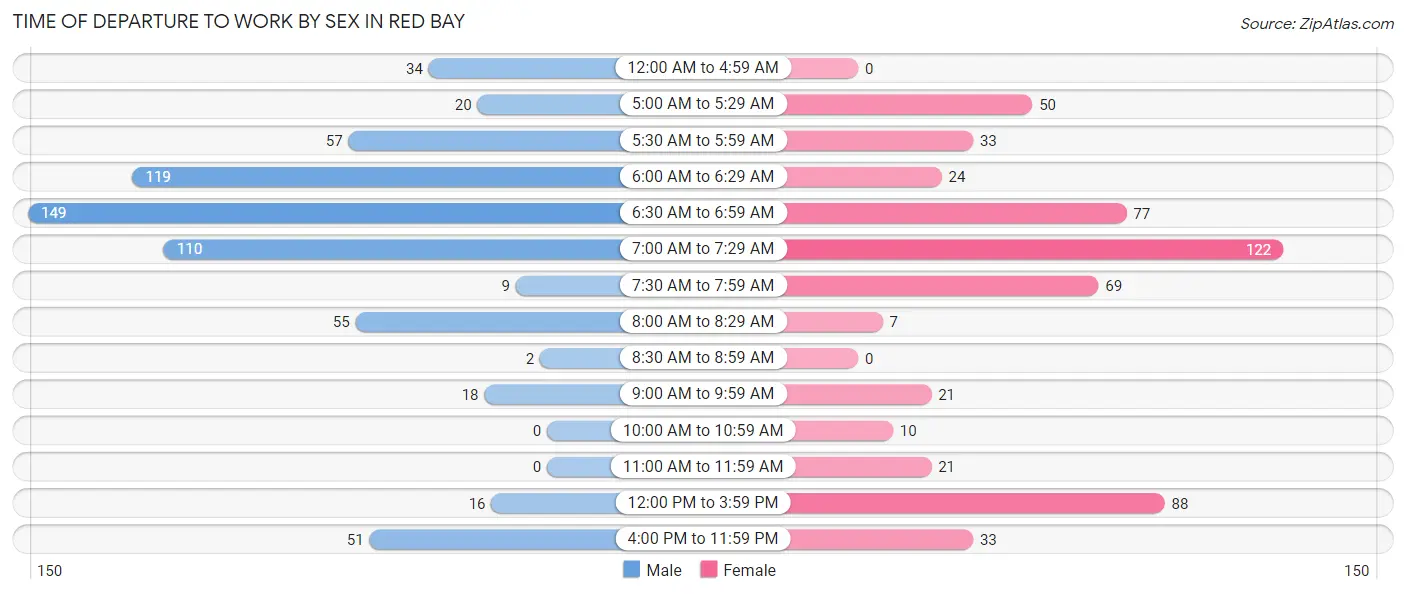
| Time of Departure | Male | Female |
| 12:00 AM to 4:59 AM | 34 (5.3%) | 0 (0.0%) |
| 5:00 AM to 5:29 AM | 20 (3.1%) | 50 (9.0%) |
| 5:30 AM to 5:59 AM | 57 (8.9%) | 33 (5.9%) |
| 6:00 AM to 6:29 AM | 119 (18.6%) | 24 (4.3%) |
| 6:30 AM to 6:59 AM | 149 (23.3%) | 77 (13.9%) |
| 7:00 AM to 7:29 AM | 110 (17.2%) | 122 (22.0%) |
| 7:30 AM to 7:59 AM | 9 (1.4%) | 69 (12.4%) |
| 8:00 AM to 8:29 AM | 55 (8.6%) | 7 (1.3%) |
| 8:30 AM to 8:59 AM | 2 (0.3%) | 0 (0.0%) |
| 9:00 AM to 9:59 AM | 18 (2.8%) | 21 (3.8%) |
| 10:00 AM to 10:59 AM | 0 (0.0%) | 10 (1.8%) |
| 11:00 AM to 11:59 AM | 0 (0.0%) | 21 (3.8%) |
| 12:00 PM to 3:59 PM | 16 (2.5%) | 88 (15.9%) |
| 4:00 PM to 11:59 PM | 51 (8.0%) | 33 (5.9%) |
| Total | 640 (100.0%) | 555 (100.0%) |
Housing Occupancy in Red Bay
Occupancy by Ownership in Red Bay
Of the total 1,487 dwellings in Red Bay, owner-occupied units account for 918 (61.7%), while renter-occupied units make up 569 (38.3%).
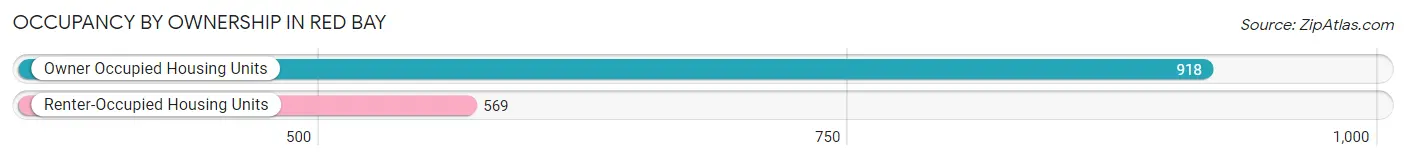
| Occupancy | # Housing Units | % Housing Units |
| Owner Occupied Housing Units | 918 | 61.7% |
| Renter-Occupied Housing Units | 569 | 38.3% |
| Total Occupied Housing Units | 1,487 | 100.0% |
Occupancy by Household Size in Red Bay
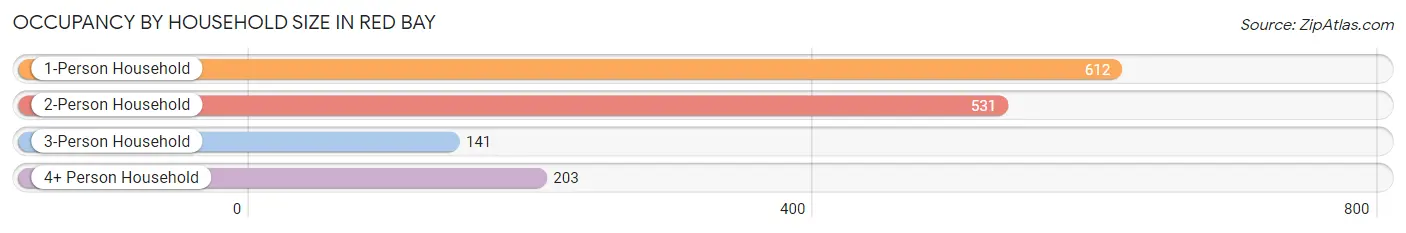
| Household Size | # Housing Units | % Housing Units |
| 1-Person Household | 612 | 41.2% |
| 2-Person Household | 531 | 35.7% |
| 3-Person Household | 141 | 9.5% |
| 4+ Person Household | 203 | 13.7% |
| Total Housing Units | 1,487 | 100.0% |
Occupancy by Ownership by Household Size in Red Bay
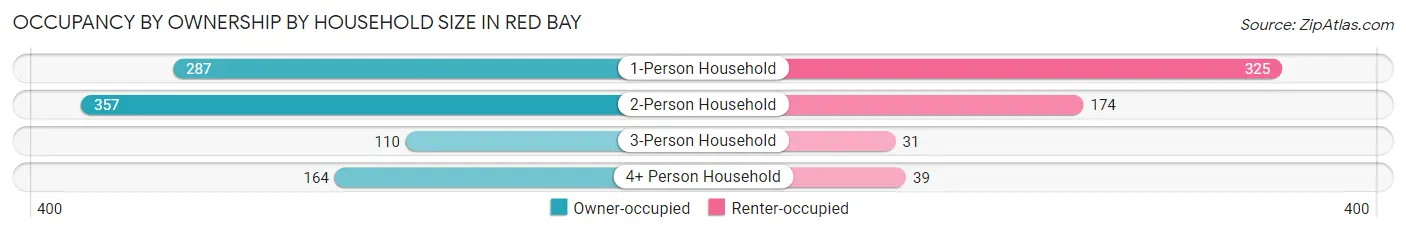
| Household Size | Owner-occupied | Renter-occupied |
| 1-Person Household | 287 (46.9%) | 325 (53.1%) |
| 2-Person Household | 357 (67.2%) | 174 (32.8%) |
| 3-Person Household | 110 (78.0%) | 31 (22.0%) |
| 4+ Person Household | 164 (80.8%) | 39 (19.2%) |
| Total Housing Units | 918 (61.7%) | 569 (38.3%) |
Occupancy by Educational Attainment in Red Bay
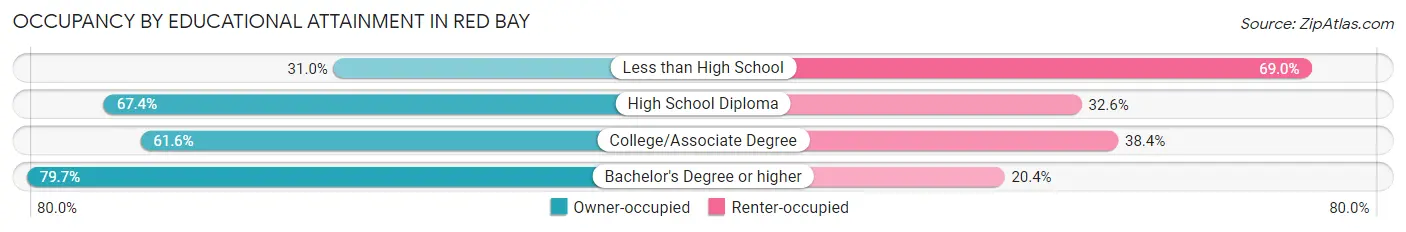
| Household Size | Owner-occupied | Renter-occupied |
| Less than High School | 79 (31.0%) | 176 (69.0%) |
| High School Diploma | 443 (67.4%) | 214 (32.6%) |
| College/Associate Degree | 212 (61.6%) | 132 (38.4%) |
| Bachelor's Degree or higher | 184 (79.6%) | 47 (20.3%) |
Occupancy by Age of Householder in Red Bay
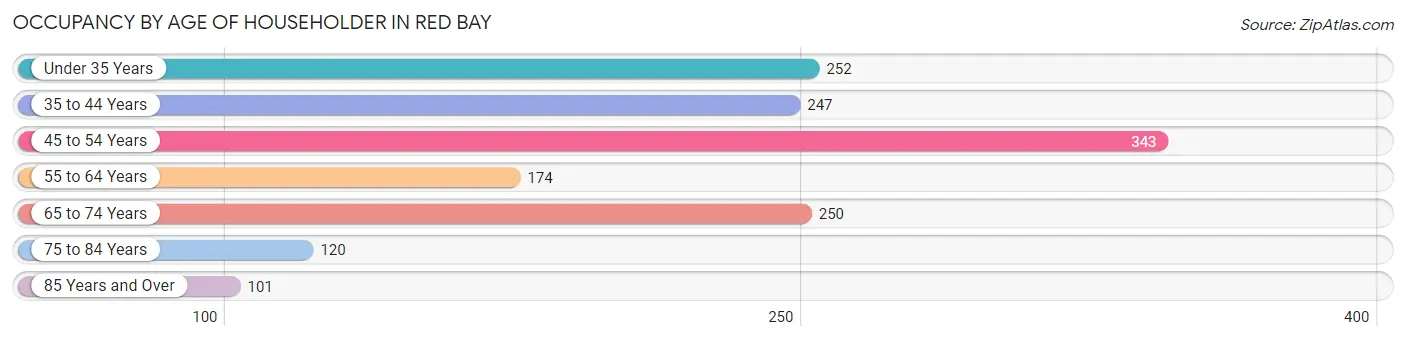
| Age Bracket | # Households | % Households |
| Under 35 Years | 252 | 17.0% |
| 35 to 44 Years | 247 | 16.6% |
| 45 to 54 Years | 343 | 23.1% |
| 55 to 64 Years | 174 | 11.7% |
| 65 to 74 Years | 250 | 16.8% |
| 75 to 84 Years | 120 | 8.1% |
| 85 Years and Over | 101 | 6.8% |
| Total | 1,487 | 100.0% |
Housing Finances in Red Bay
Median Income by Occupancy in Red Bay
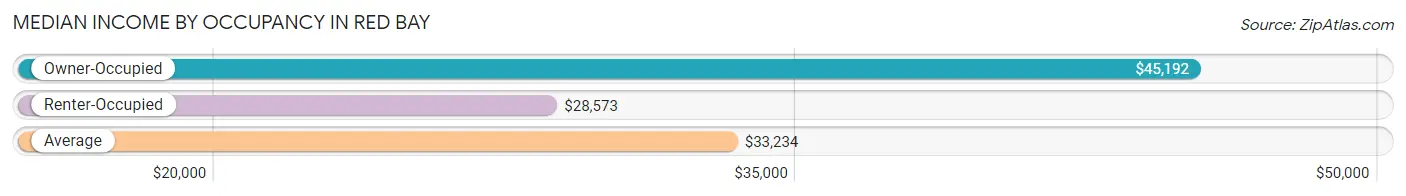
| Occupancy Type | # Households | Median Income |
| Owner-Occupied | 918 (61.7%) | $45,192 |
| Renter-Occupied | 569 (38.3%) | $28,573 |
| Average | 1,487 (100.0%) | $33,234 |
Occupancy by Householder Income Bracket in Red Bay
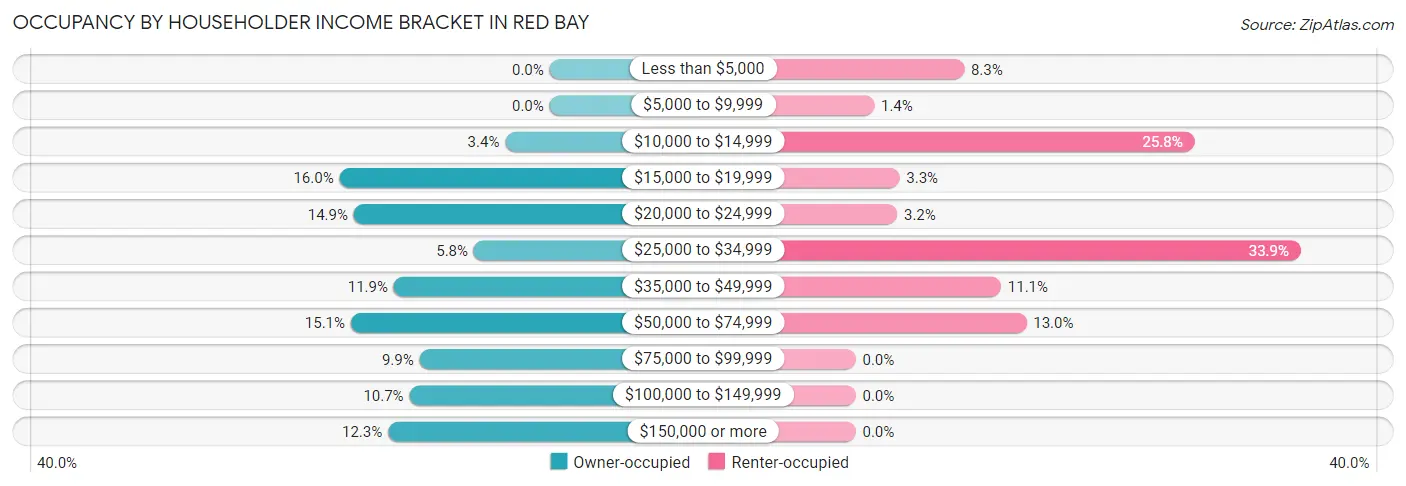
| Income Bracket | Owner-occupied | Renter-occupied |
| Less than $5,000 | 0 (0.0%) | 47 (8.3%) |
| $5,000 to $9,999 | 0 (0.0%) | 8 (1.4%) |
| $10,000 to $14,999 | 31 (3.4%) | 147 (25.8%) |
| $15,000 to $19,999 | 147 (16.0%) | 19 (3.3%) |
| $20,000 to $24,999 | 137 (14.9%) | 18 (3.2%) |
| $25,000 to $34,999 | 53 (5.8%) | 193 (33.9%) |
| $35,000 to $49,999 | 109 (11.9%) | 63 (11.1%) |
| $50,000 to $74,999 | 139 (15.1%) | 74 (13.0%) |
| $75,000 to $99,999 | 91 (9.9%) | 0 (0.0%) |
| $100,000 to $149,999 | 98 (10.7%) | 0 (0.0%) |
| $150,000 or more | 113 (12.3%) | 0 (0.0%) |
| Total | 918 (100.0%) | 569 (100.0%) |
Monthly Housing Cost Tiers in Red Bay
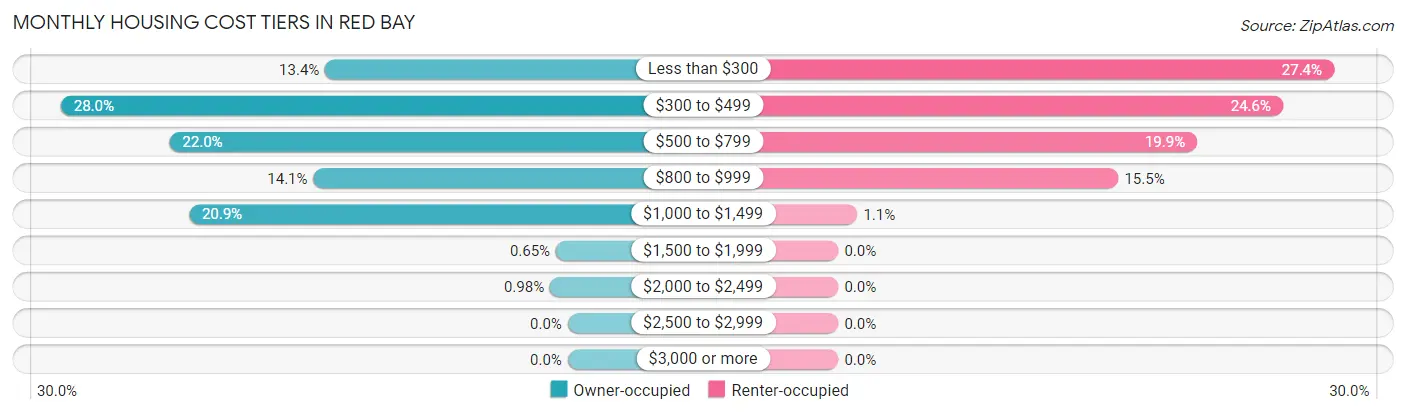
| Monthly Cost | Owner-occupied | Renter-occupied |
| Less than $300 | 123 (13.4%) | 156 (27.4%) |
| $300 to $499 | 257 (28.0%) | 140 (24.6%) |
| $500 to $799 | 202 (22.0%) | 113 (19.9%) |
| $800 to $999 | 129 (14.1%) | 88 (15.5%) |
| $1,000 to $1,499 | 192 (20.9%) | 6 (1.1%) |
| $1,500 to $1,999 | 6 (0.6%) | 0 (0.0%) |
| $2,000 to $2,499 | 9 (1.0%) | 0 (0.0%) |
| $2,500 to $2,999 | 0 (0.0%) | 0 (0.0%) |
| $3,000 or more | 0 (0.0%) | 0 (0.0%) |
| Total | 918 (100.0%) | 569 (100.0%) |
Physical Housing Characteristics in Red Bay
Housing Structures in Red Bay
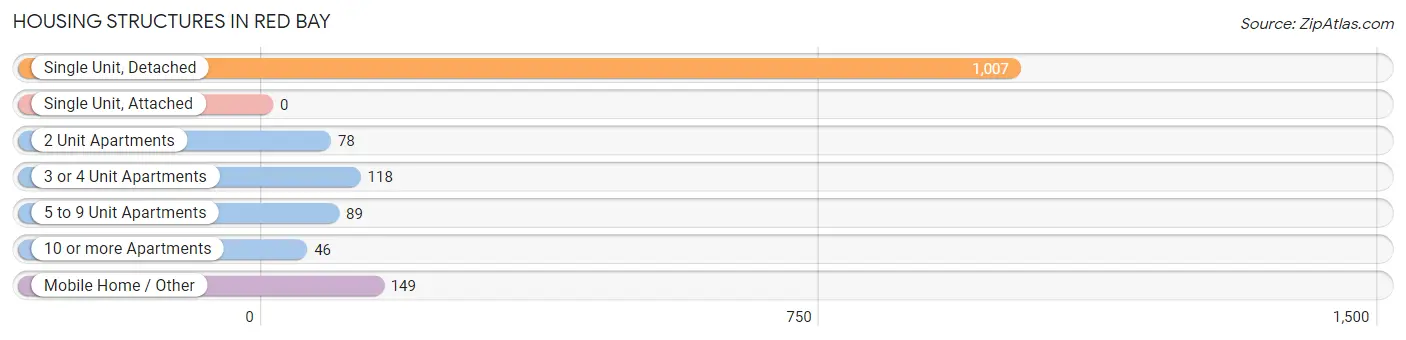
| Structure Type | # Housing Units | % Housing Units |
| Single Unit, Detached | 1,007 | 67.7% |
| Single Unit, Attached | 0 | 0.0% |
| 2 Unit Apartments | 78 | 5.2% |
| 3 or 4 Unit Apartments | 118 | 7.9% |
| 5 to 9 Unit Apartments | 89 | 6.0% |
| 10 or more Apartments | 46 | 3.1% |
| Mobile Home / Other | 149 | 10.0% |
| Total | 1,487 | 100.0% |
Housing Structures by Occupancy in Red Bay
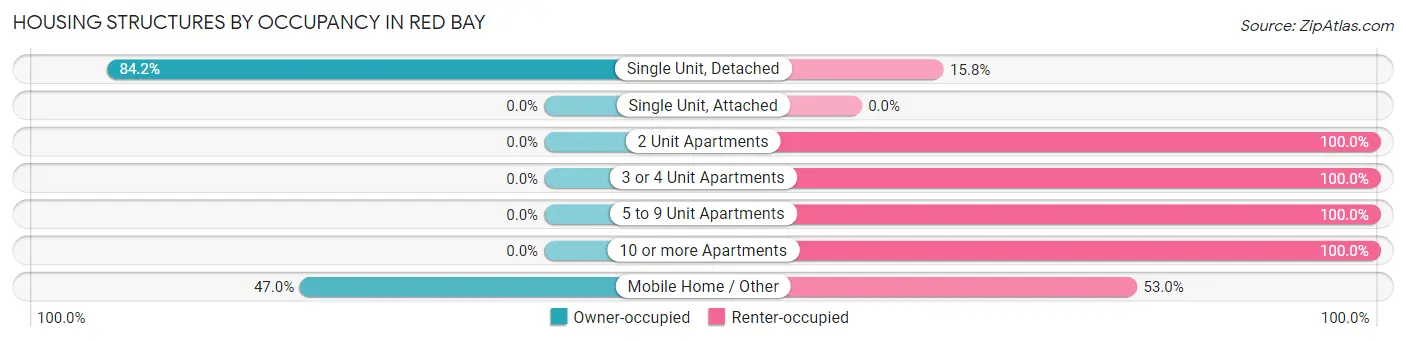
| Structure Type | Owner-occupied | Renter-occupied |
| Single Unit, Detached | 848 (84.2%) | 159 (15.8%) |
| Single Unit, Attached | 0 (0.0%) | 0 (0.0%) |
| 2 Unit Apartments | 0 (0.0%) | 78 (100.0%) |
| 3 or 4 Unit Apartments | 0 (0.0%) | 118 (100.0%) |
| 5 to 9 Unit Apartments | 0 (0.0%) | 89 (100.0%) |
| 10 or more Apartments | 0 (0.0%) | 46 (100.0%) |
| Mobile Home / Other | 70 (47.0%) | 79 (53.0%) |
| Total | 918 (61.7%) | 569 (38.3%) |
Housing Structures by Number of Rooms in Red Bay
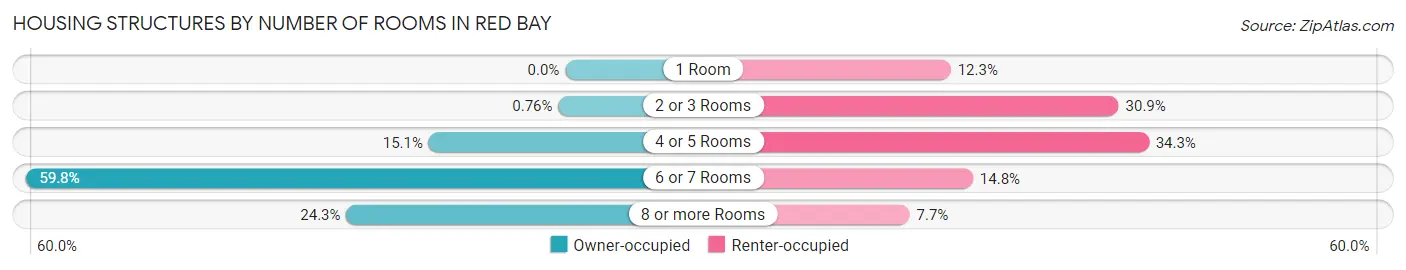
| Number of Rooms | Owner-occupied | Renter-occupied |
| 1 Room | 0 (0.0%) | 70 (12.3%) |
| 2 or 3 Rooms | 7 (0.8%) | 176 (30.9%) |
| 4 or 5 Rooms | 139 (15.1%) | 195 (34.3%) |
| 6 or 7 Rooms | 549 (59.8%) | 84 (14.8%) |
| 8 or more Rooms | 223 (24.3%) | 44 (7.7%) |
| Total | 918 (100.0%) | 569 (100.0%) |
Housing Structure by Heating Type in Red Bay
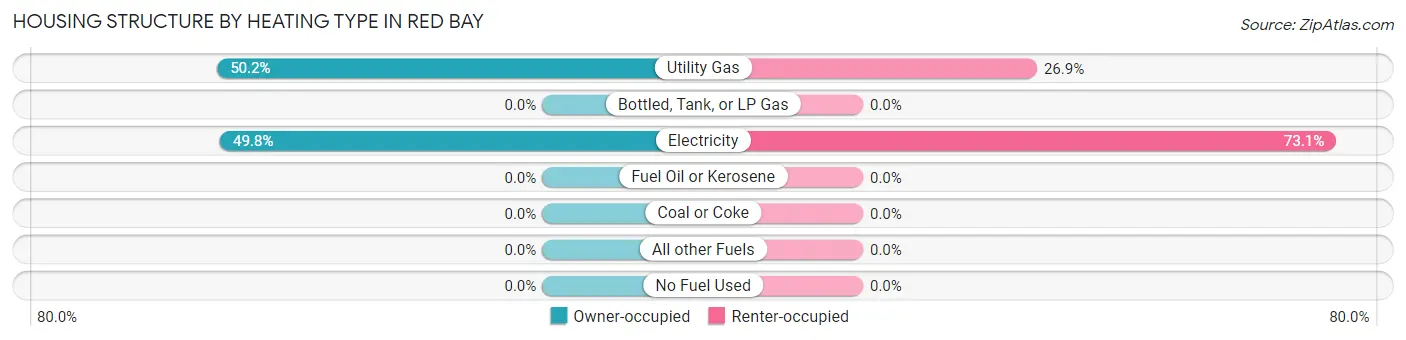
| Heating Type | Owner-occupied | Renter-occupied |
| Utility Gas | 461 (50.2%) | 153 (26.9%) |
| Bottled, Tank, or LP Gas | 0 (0.0%) | 0 (0.0%) |
| Electricity | 457 (49.8%) | 416 (73.1%) |
| Fuel Oil or Kerosene | 0 (0.0%) | 0 (0.0%) |
| Coal or Coke | 0 (0.0%) | 0 (0.0%) |
| All other Fuels | 0 (0.0%) | 0 (0.0%) |
| No Fuel Used | 0 (0.0%) | 0 (0.0%) |
| Total | 918 (100.0%) | 569 (100.0%) |
Household Vehicle Usage in Red Bay
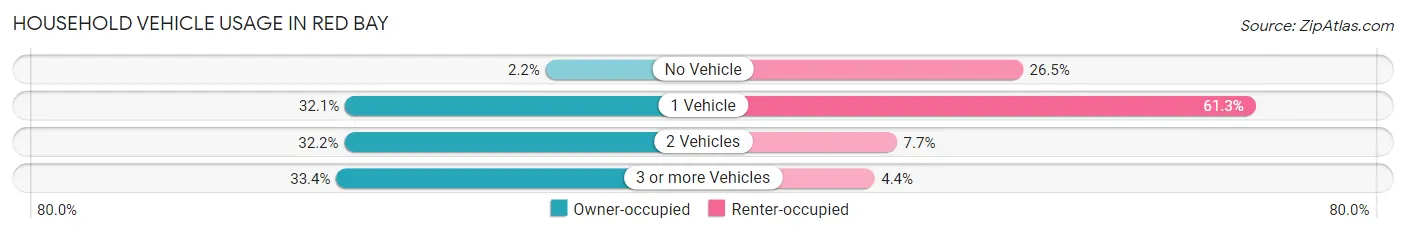
| Vehicles per Household | Owner-occupied | Renter-occupied |
| No Vehicle | 20 (2.2%) | 151 (26.5%) |
| 1 Vehicle | 295 (32.1%) | 349 (61.3%) |
| 2 Vehicles | 296 (32.2%) | 44 (7.7%) |
| 3 or more Vehicles | 307 (33.4%) | 25 (4.4%) |
| Total | 918 (100.0%) | 569 (100.0%) |
Real Estate & Mortgages in Red Bay
Real Estate and Mortgage Overview in Red Bay
| Characteristic | Without Mortgage | With Mortgage |
| Housing Units | 501 | 417 |
| Median Property Value | $98,400 | $67,700 |
| Median Household Income | $39,509 | $78 |
| Monthly Housing Costs | $388 | $0 |
| Real Estate Taxes | $339 | $38 |
Property Value by Mortgage Status in Red Bay
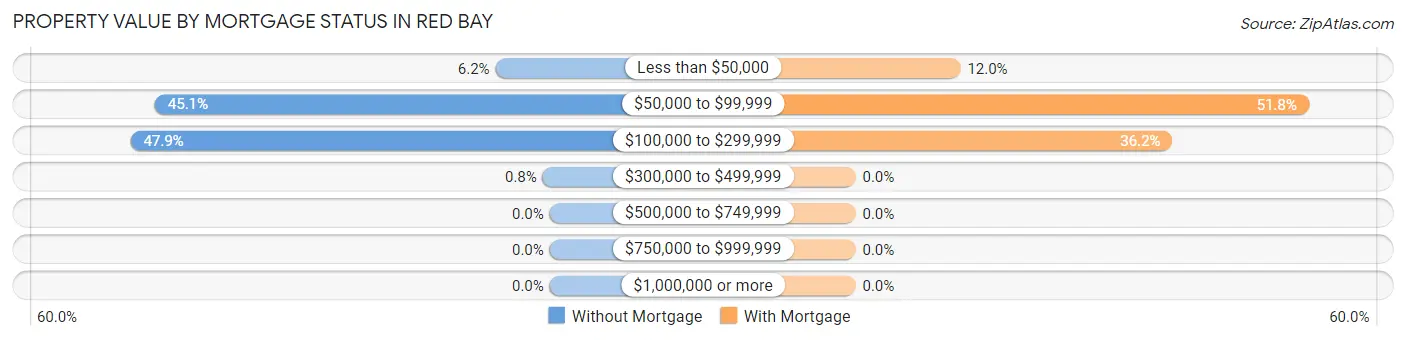
| Property Value | Without Mortgage | With Mortgage |
| Less than $50,000 | 31 (6.2%) | 50 (12.0%) |
| $50,000 to $99,999 | 226 (45.1%) | 216 (51.8%) |
| $100,000 to $299,999 | 240 (47.9%) | 151 (36.2%) |
| $300,000 to $499,999 | 4 (0.8%) | 0 (0.0%) |
| $500,000 to $749,999 | 0 (0.0%) | 0 (0.0%) |
| $750,000 to $999,999 | 0 (0.0%) | 0 (0.0%) |
| $1,000,000 or more | 0 (0.0%) | 0 (0.0%) |
| Total | 501 (100.0%) | 417 (100.0%) |
Household Income by Mortgage Status in Red Bay
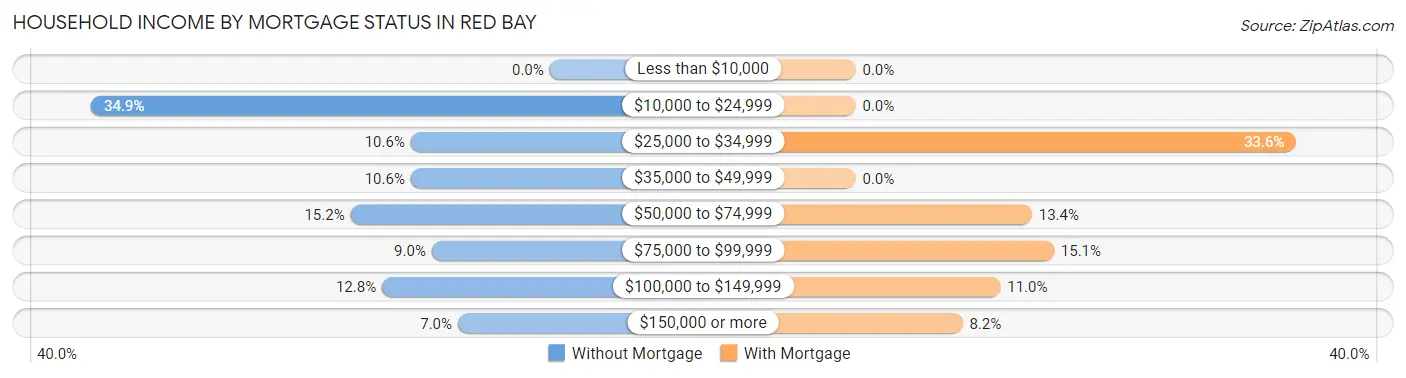
| Household Income | Without Mortgage | With Mortgage |
| Less than $10,000 | 0 (0.0%) | 0 (0.0%) |
| $10,000 to $24,999 | 175 (34.9%) | 0 (0.0%) |
| $25,000 to $34,999 | 53 (10.6%) | 140 (33.6%) |
| $35,000 to $49,999 | 53 (10.6%) | 0 (0.0%) |
| $50,000 to $74,999 | 76 (15.2%) | 56 (13.4%) |
| $75,000 to $99,999 | 45 (9.0%) | 63 (15.1%) |
| $100,000 to $149,999 | 64 (12.8%) | 46 (11.0%) |
| $150,000 or more | 35 (7.0%) | 34 (8.2%) |
| Total | 501 (100.0%) | 417 (100.0%) |
Property Value to Household Income Ratio in Red Bay
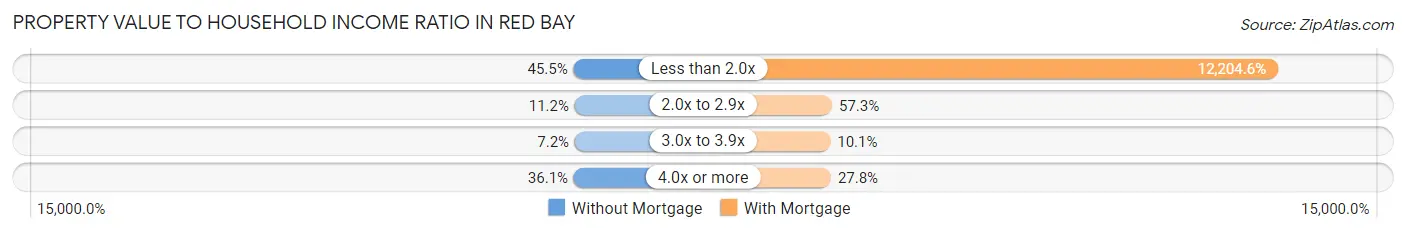
| Value-to-Income Ratio | Without Mortgage | With Mortgage |
| Less than 2.0x | 228 (45.5%) | 50,893 (12,204.6%) |
| 2.0x to 2.9x | 56 (11.2%) | 239 (57.3%) |
| 3.0x to 3.9x | 36 (7.2%) | 42 (10.1%) |
| 4.0x or more | 181 (36.1%) | 116 (27.8%) |
| Total | 501 (100.0%) | 417 (100.0%) |
Real Estate Taxes by Mortgage Status in Red Bay
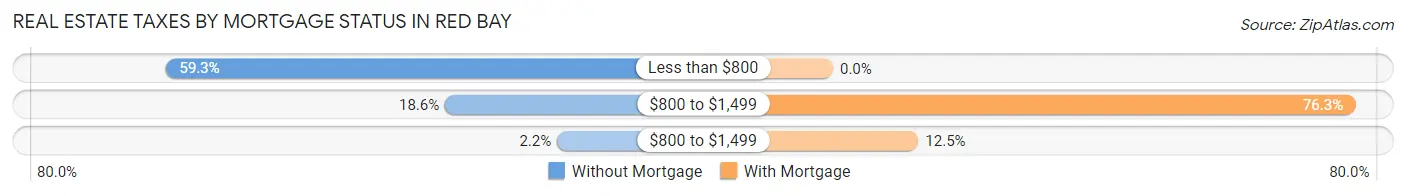
| Property Taxes | Without Mortgage | With Mortgage |
| Less than $800 | 297 (59.3%) | 0 (0.0%) |
| $800 to $1,499 | 93 (18.6%) | 318 (76.3%) |
| $800 to $1,499 | 11 (2.2%) | 52 (12.5%) |
| Total | 501 (100.0%) | 417 (100.0%) |
Health & Disability in Red Bay
Health Insurance Coverage by Age in Red Bay
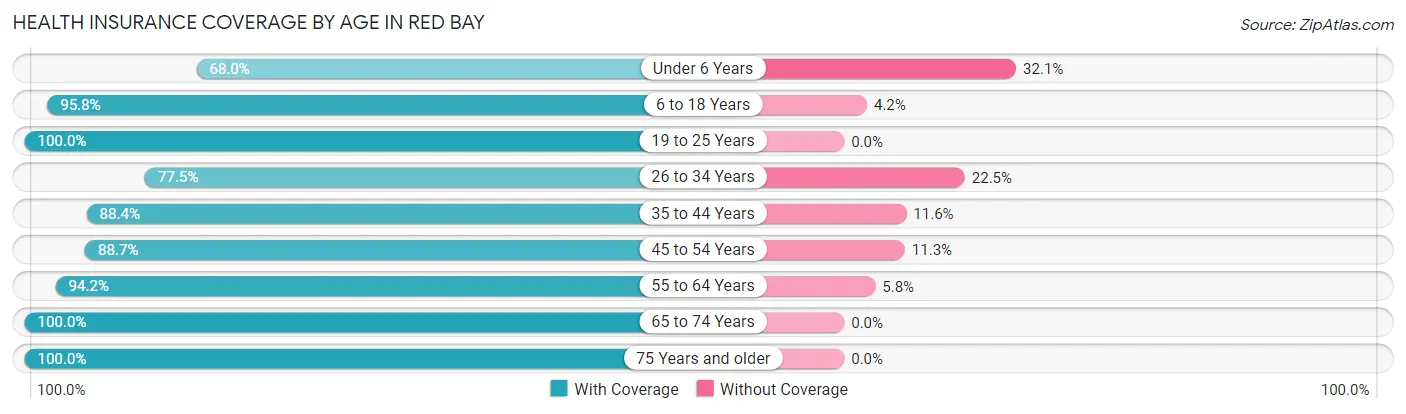
| Age Bracket | With Coverage | Without Coverage |
| Under 6 Years | 229 (67.9%) | 108 (32.1%) |
| 6 to 18 Years | 361 (95.8%) | 16 (4.2%) |
| 19 to 25 Years | 119 (100.0%) | 0 (0.0%) |
| 26 to 34 Years | 331 (77.5%) | 96 (22.5%) |
| 35 to 44 Years | 275 (88.4%) | 36 (11.6%) |
| 45 to 54 Years | 479 (88.7%) | 61 (11.3%) |
| 55 to 64 Years | 342 (94.2%) | 21 (5.8%) |
| 65 to 74 Years | 294 (100.0%) | 0 (0.0%) |
| 75 Years and older | 427 (100.0%) | 0 (0.0%) |
| Total | 2,857 (89.4%) | 338 (10.6%) |
Health Insurance Coverage by Citizenship Status in Red Bay
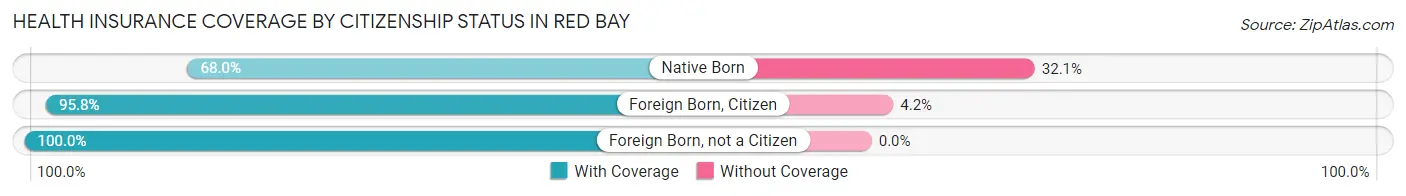
| Citizenship Status | With Coverage | Without Coverage |
| Native Born | 229 (67.9%) | 108 (32.1%) |
| Foreign Born, Citizen | 361 (95.8%) | 16 (4.2%) |
| Foreign Born, not a Citizen | 119 (100.0%) | 0 (0.0%) |
Health Insurance Coverage by Household Income in Red Bay
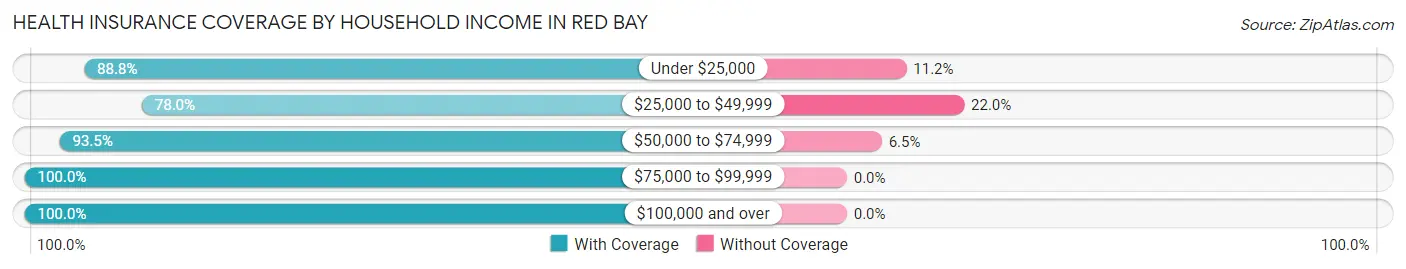
| Household Income | With Coverage | Without Coverage |
| Under $25,000 | 653 (88.8%) | 82 (11.2%) |
| $25,000 to $49,999 | 802 (78.0%) | 226 (22.0%) |
| $50,000 to $74,999 | 429 (93.5%) | 30 (6.5%) |
| $75,000 to $99,999 | 278 (100.0%) | 0 (0.0%) |
| $100,000 and over | 695 (100.0%) | 0 (0.0%) |
Public vs Private Health Insurance Coverage by Age in Red Bay
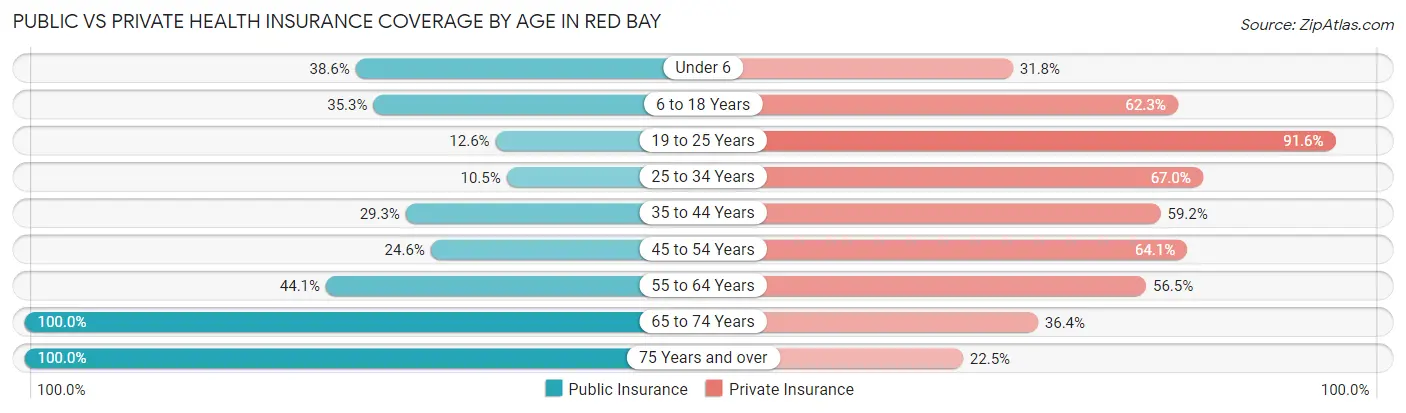
| Age Bracket | Public Insurance | Private Insurance |
| Under 6 | 130 (38.6%) | 107 (31.8%) |
| 6 to 18 Years | 133 (35.3%) | 235 (62.3%) |
| 19 to 25 Years | 15 (12.6%) | 109 (91.6%) |
| 25 to 34 Years | 45 (10.5%) | 286 (67.0%) |
| 35 to 44 Years | 91 (29.3%) | 184 (59.2%) |
| 45 to 54 Years | 133 (24.6%) | 346 (64.1%) |
| 55 to 64 Years | 160 (44.1%) | 205 (56.5%) |
| 65 to 74 Years | 294 (100.0%) | 107 (36.4%) |
| 75 Years and over | 427 (100.0%) | 96 (22.5%) |
| Total | 1,428 (44.7%) | 1,675 (52.4%) |
Disability Status by Sex by Age in Red Bay
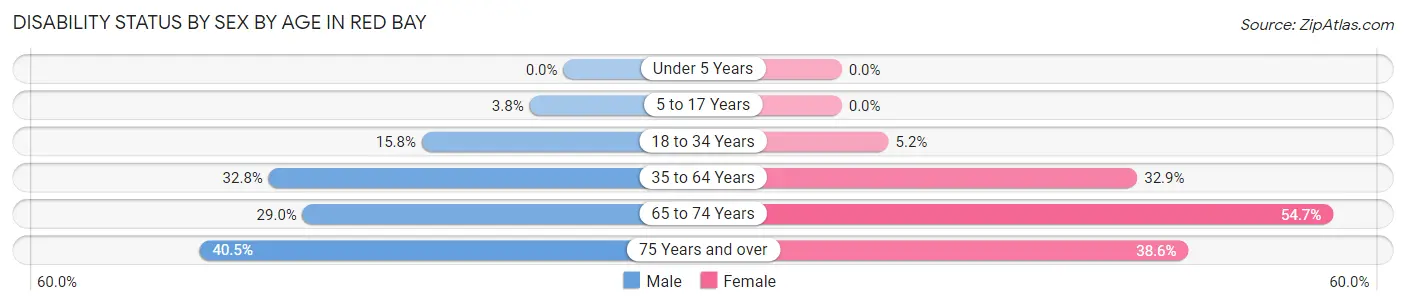
| Age Bracket | Male | Female |
| Under 5 Years | 0 (0.0%) | 0 (0.0%) |
| 5 to 17 Years | 8 (3.8%) | 0 (0.0%) |
| 18 to 34 Years | 41 (15.8%) | 16 (5.2%) |
| 35 to 64 Years | 190 (32.8%) | 209 (32.9%) |
| 65 to 74 Years | 36 (29.0%) | 93 (54.7%) |
| 75 Years and over | 47 (40.5%) | 120 (38.6%) |
Disability Class by Sex by Age in Red Bay
Disability Class: Hearing Difficulty
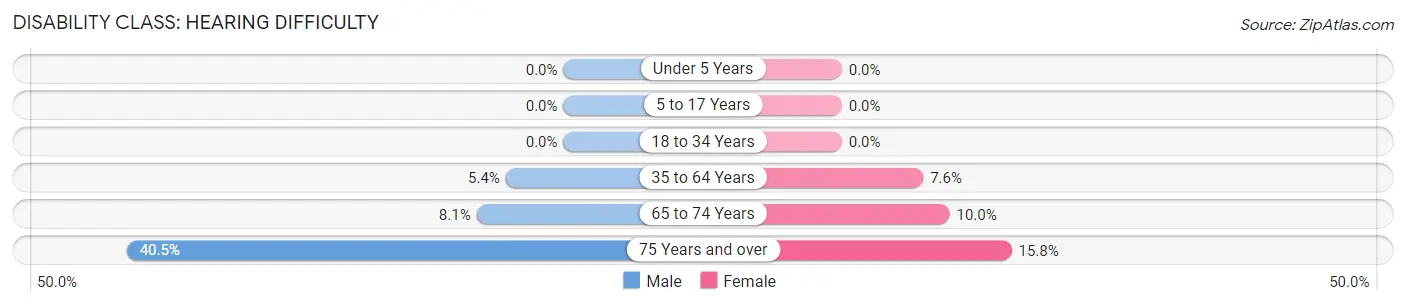
| Age Bracket | Male | Female |
| Under 5 Years | 0 (0.0%) | 0 (0.0%) |
| 5 to 17 Years | 0 (0.0%) | 0 (0.0%) |
| 18 to 34 Years | 0 (0.0%) | 0 (0.0%) |
| 35 to 64 Years | 31 (5.3%) | 48 (7.6%) |
| 65 to 74 Years | 10 (8.1%) | 17 (10.0%) |
| 75 Years and over | 47 (40.5%) | 49 (15.8%) |
Disability Class: Vision Difficulty
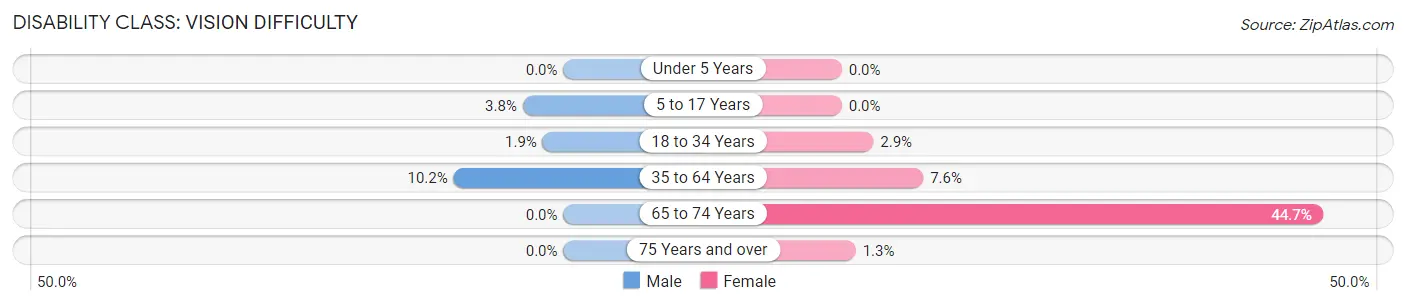
| Age Bracket | Male | Female |
| Under 5 Years | 0 (0.0%) | 0 (0.0%) |
| 5 to 17 Years | 8 (3.8%) | 0 (0.0%) |
| 18 to 34 Years | 5 (1.9%) | 9 (2.9%) |
| 35 to 64 Years | 59 (10.2%) | 48 (7.6%) |
| 65 to 74 Years | 0 (0.0%) | 76 (44.7%) |
| 75 Years and over | 0 (0.0%) | 4 (1.3%) |
Disability Class: Cognitive Difficulty
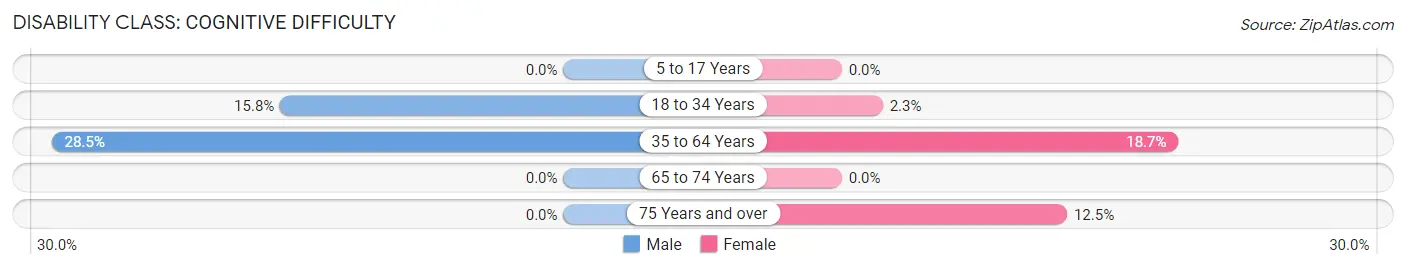
| Age Bracket | Male | Female |
| 5 to 17 Years | 0 (0.0%) | 0 (0.0%) |
| 18 to 34 Years | 41 (15.8%) | 7 (2.3%) |
| 35 to 64 Years | 165 (28.5%) | 119 (18.7%) |
| 65 to 74 Years | 0 (0.0%) | 0 (0.0%) |
| 75 Years and over | 0 (0.0%) | 39 (12.5%) |
Disability Class: Ambulatory Difficulty
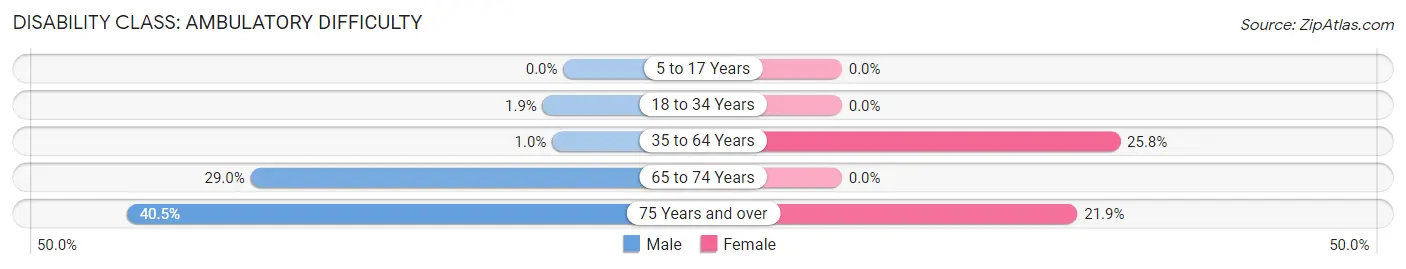
| Age Bracket | Male | Female |
| 5 to 17 Years | 0 (0.0%) | 0 (0.0%) |
| 18 to 34 Years | 5 (1.9%) | 0 (0.0%) |
| 35 to 64 Years | 6 (1.0%) | 164 (25.8%) |
| 65 to 74 Years | 36 (29.0%) | 0 (0.0%) |
| 75 Years and over | 47 (40.5%) | 68 (21.9%) |
Disability Class: Self-Care Difficulty
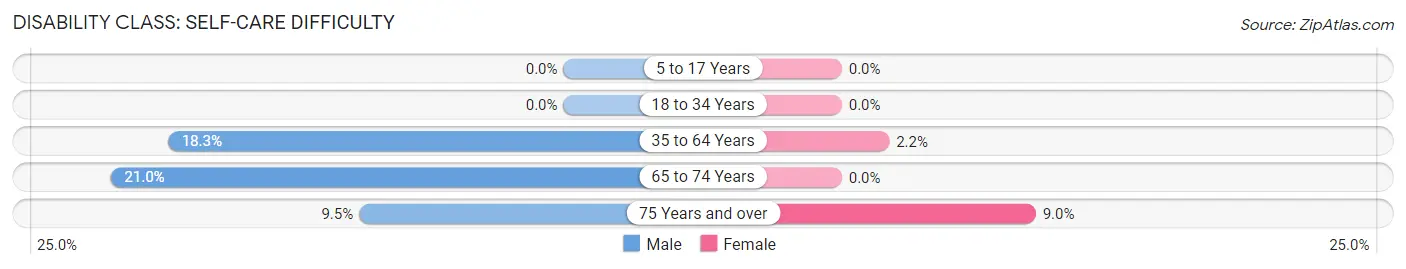
| Age Bracket | Male | Female |
| 5 to 17 Years | 0 (0.0%) | 0 (0.0%) |
| 18 to 34 Years | 0 (0.0%) | 0 (0.0%) |
| 35 to 64 Years | 106 (18.3%) | 14 (2.2%) |
| 65 to 74 Years | 26 (21.0%) | 0 (0.0%) |
| 75 Years and over | 11 (9.5%) | 28 (9.0%) |
Technology Access in Red Bay
Computing Device Access in Red Bay
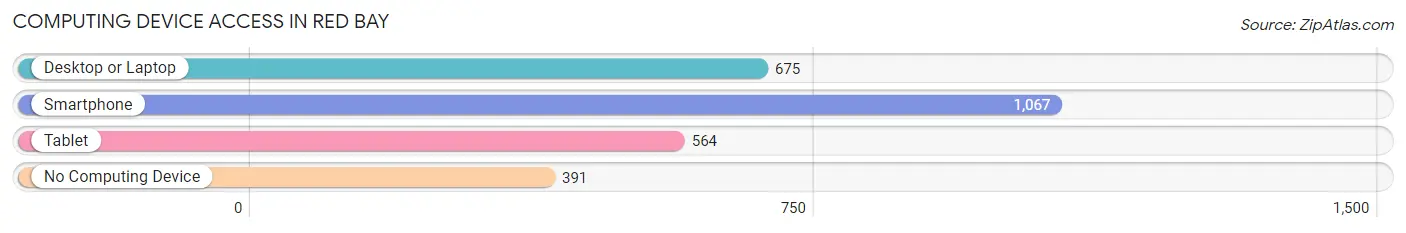
| Device Type | # Households | % Households |
| Desktop or Laptop | 675 | 45.4% |
| Smartphone | 1,067 | 71.8% |
| Tablet | 564 | 37.9% |
| No Computing Device | 391 | 26.3% |
| Total | 1,487 | 100.0% |
Internet Access in Red Bay
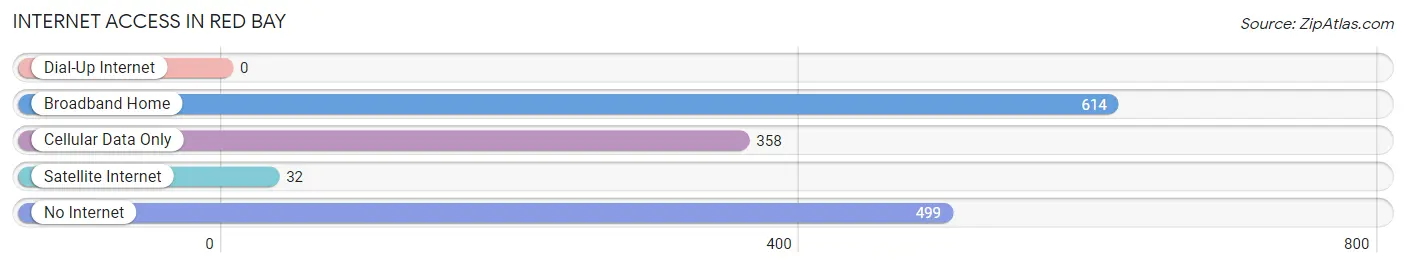
| Internet Type | # Households | % Households |
| Dial-Up Internet | 0 | 0.0% |
| Broadband Home | 614 | 41.3% |
| Cellular Data Only | 358 | 24.1% |
| Satellite Internet | 32 | 2.1% |
| No Internet | 499 | 33.6% |
| Total | 1,487 | 100.0% |
Red Bay Summary
Introduction
Red Bay, Alabama is a small town located in Franklin County, Alabama. It is situated on the banks of the Tennessee River and is home to a population of approximately 2,500 people. The town was founded in 1818 and has a rich history of industry, agriculture, and culture. Red Bay is known for its strong sense of community and its commitment to preserving its history and culture.
History
Red Bay was founded in 1818 by settlers from North Carolina and Virginia. The town was named after the red clay found in the area. The town was originally a trading post and was used as a stopover for travelers on their way to the Gulf of Mexico. The town grew quickly and by the mid-1800s, it had become a thriving agricultural and industrial center.
The town was home to several cotton mills, sawmills, and other industries. The town also had a thriving riverboat trade. In the late 1800s, the town was home to a large number of African American residents who worked in the mills and on the riverboats.
In the early 1900s, the town began to decline as the cotton industry moved away from the area. The town was also affected by the Great Depression and World War II. After the war, the town began to recover and the population began to grow again.
Geography
Red Bay is located in Franklin County, Alabama. The town is situated on the banks of the Tennessee River and is surrounded by rolling hills and forests. The town is located approximately 30 miles from the Alabama-Tennessee border. The town is also located near the Natchez Trace Parkway, a scenic byway that runs through the area.
The climate in Red Bay is humid subtropical, with hot summers and mild winters. The average temperature in the summer is around 90 degrees Fahrenheit and the average temperature in the winter is around 40 degrees Fahrenheit. The town receives an average of 48 inches of rain per year.
Economy
The economy of Red Bay is largely based on agriculture and manufacturing. The town is home to several large farms that produce cotton, soybeans, corn, and other crops. The town is also home to several manufacturing companies that produce furniture, textiles, and other products.
The town is also home to several small businesses, including restaurants, shops, and other services. The town is also home to a number of tourist attractions, including the Natchez Trace Parkway, the Red Bay Museum, and the Red Bay National Wildlife Refuge.
Demographics
As of the 2010 census, the population of Red Bay was 2,500. The town is predominantly white, with a small African American population. The median household income in the town is $35,000 and the median home value is $90,000. The town has a low unemployment rate and a high rate of homeownership.
Conclusion
Red Bay, Alabama is a small town with a rich history and a strong sense of community. The town is home to a diverse economy and a population of approximately 2,500 people. The town is known for its commitment to preserving its history and culture and for its scenic beauty. Red Bay is a great place to live and work and is a great place to visit.
Common Questions
What is Per Capita Income in Red Bay?
Per Capita income in Red Bay is $24,009.
What is the Median Family Income in Red Bay?
Median Family Income in Red Bay is $53,600.
What is the Median Household income in Red Bay?
Median Household Income in Red Bay is $33,234.
What is Income or Wage Gap in Red Bay?
Income or Wage Gap in Red Bay is 29.2%.
Women in Red Bay earn 70.8 cents for every dollar earned by a man.
What is Inequality or Gini Index in Red Bay?
Inequality or Gini Index in Red Bay is 0.48.
What is the Total Population of Red Bay?
Total Population of Red Bay is 3,210.
What is the Total Male Population of Red Bay?
Total Male Population of Red Bay is 1,482.
What is the Total Female Population of Red Bay?
Total Female Population of Red Bay is 1,728.
What is the Ratio of Males per 100 Females in Red Bay?
There are 85.76 Males per 100 Females in Red Bay.
What is the Ratio of Females per 100 Males in Red Bay?
There are 116.60 Females per 100 Males in Red Bay.
What is the Median Population Age in Red Bay?
Median Population Age in Red Bay is 46.3 Years.
What is the Average Family Size in Red Bay
Average Family Size in Red Bay is 3.1 People.
What is the Average Household Size in Red Bay
Average Household Size in Red Bay is 2.1 People.
How Large is the Labor Force in Red Bay?
There are 1,261 People in the Labor Forcein in Red Bay.
What is the Percentage of People in the Labor Force in Red Bay?
49.0% of People are in the Labor Force in Red Bay.
What is the Unemployment Rate in Red Bay?
Unemployment Rate in Red Bay is 3.6%.