Peruvian vs Jordanian 3 or more Vehicles in Household
COMPARE
Peruvian
Jordanian
3 or more Vehicles in Household
3 or more Vehicles in Household Comparison
Peruvians
Jordanians
19.6%
3 OR MORE VEHICLES IN HOUSEHOLD
58.8/ 100
METRIC RATING
168th/ 347
METRIC RANK
20.1%
3 OR MORE VEHICLES IN HOUSEHOLD
84.4/ 100
METRIC RATING
142nd/ 347
METRIC RANK
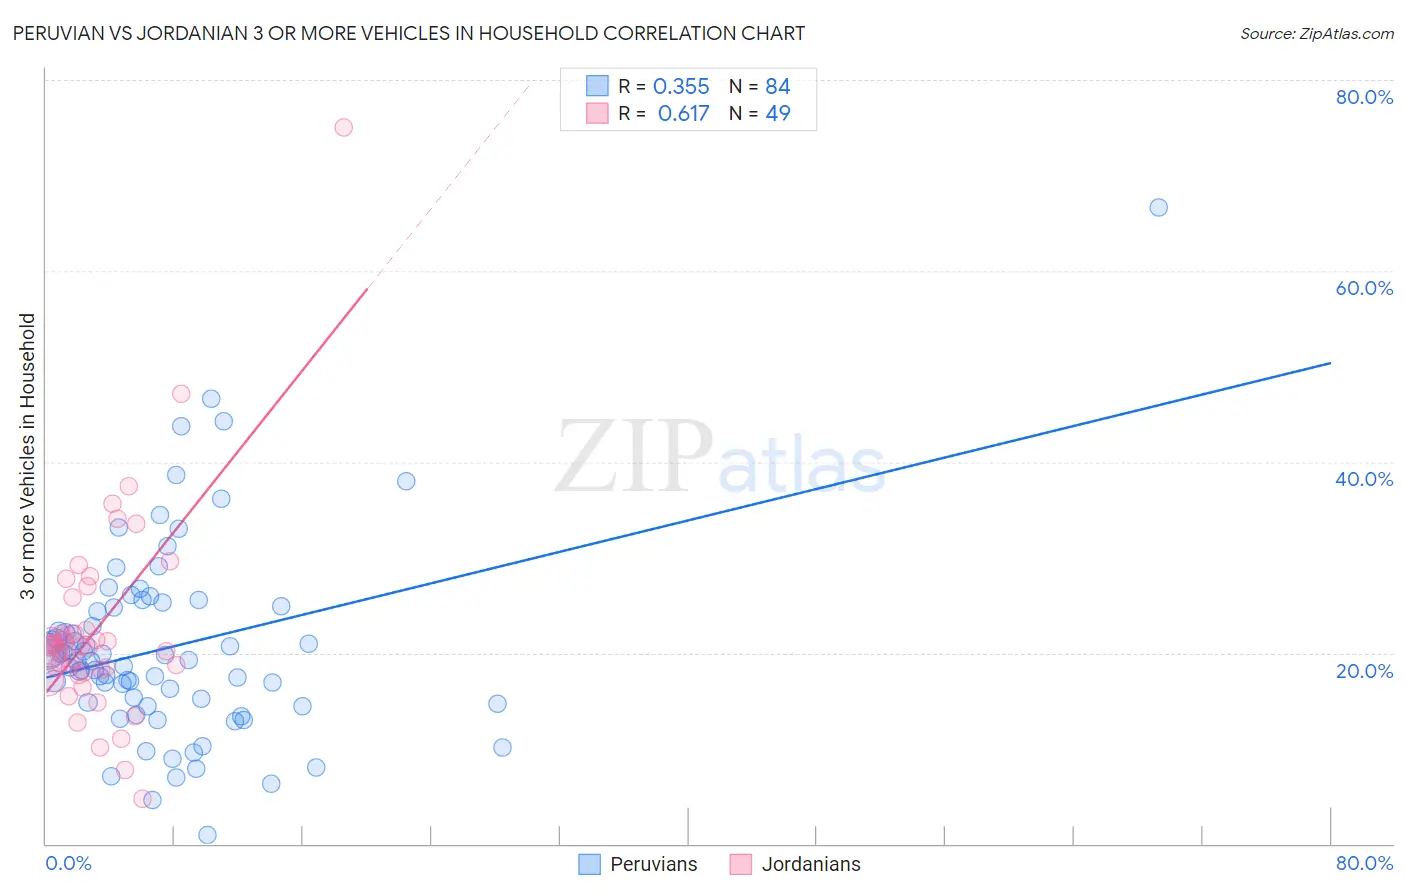
Peruvian vs Jordanian 3 or more Vehicles in Household Correlation Chart
The statistical analysis conducted on geographies consisting of 362,865,457 people shows a mild positive correlation between the proportion of Peruvians and percentage of households with 3 or more vehicles available in the United States with a correlation coefficient (R) of 0.355 and weighted average of 19.6%. Similarly, the statistical analysis conducted on geographies consisting of 166,358,031 people shows a significant positive correlation between the proportion of Jordanians and percentage of households with 3 or more vehicles available in the United States with a correlation coefficient (R) of 0.617 and weighted average of 20.1%, a difference of 2.5%.
3 or more Vehicles in Household Correlation Summary
| Measurement | Peruvian | Jordanian |
| Minimum | 0.93% | 4.7% |
| Maximum | 66.7% | 75.0% |
| Range | 65.7% | 70.3% |
| Mean | 20.6% | 22.4% |
| Median | 19.2% | 20.7% |
| Interquartile 25% (IQ1) | 14.8% | 18.0% |
| Interquartile 75% (IQ3) | 24.8% | 24.1% |
| Interquartile Range (IQR) | 10.1% | 6.0% |
| Standard Deviation (Sample) | 10.2% | 10.8% |
| Standard Deviation (Population) | 10.1% | 10.7% |
Similar Demographics by 3 or more Vehicles in Household
Demographics Similar to Peruvians by 3 or more Vehicles in Household
In terms of 3 or more vehicles in household, the demographic groups most similar to Peruvians are Ukrainian (19.6%, a difference of 0.010%), Immigrants from Denmark (19.6%, a difference of 0.090%), Immigrants from Cameroon (19.7%, a difference of 0.17%), Iraqi (19.6%, a difference of 0.21%), and Immigrants from Costa Rica (19.7%, a difference of 0.25%).
| Demographics | Rating | Rank | 3 or more Vehicles in Household |
| Immigrants | Guatemala | 65.6 /100 | #161 | Good 19.7% |
| Estonians | 63.2 /100 | #162 | Good 19.7% |
| Chileans | 63.0 /100 | #163 | Good 19.7% |
| Yugoslavians | 62.9 /100 | #164 | Good 19.7% |
| Immigrants | Costa Rica | 61.9 /100 | #165 | Good 19.7% |
| Immigrants | Cameroon | 60.9 /100 | #166 | Good 19.7% |
| Ukrainians | 58.9 /100 | #167 | Average 19.6% |
| Peruvians | 58.8 /100 | #168 | Average 19.6% |
| Immigrants | Denmark | 57.6 /100 | #169 | Average 19.6% |
| Iraqis | 56.0 /100 | #170 | Average 19.6% |
| Immigrants | Western Europe | 53.2 /100 | #171 | Average 19.5% |
| Kiowa | 50.9 /100 | #172 | Average 19.5% |
| Immigrants | Northern Europe | 50.2 /100 | #173 | Average 19.5% |
| Immigrants | South Africa | 50.0 /100 | #174 | Average 19.5% |
| Syrians | 47.0 /100 | #175 | Average 19.5% |
Demographics Similar to Jordanians by 3 or more Vehicles in Household
In terms of 3 or more vehicles in household, the demographic groups most similar to Jordanians are Lithuanian (20.1%, a difference of 0.0%), Ottawa (20.1%, a difference of 0.060%), Iranian (20.1%, a difference of 0.060%), Palestinian (20.1%, a difference of 0.070%), and Australian (20.1%, a difference of 0.11%).
| Demographics | Rating | Rank | 3 or more Vehicles in Household |
| Immigrants | India | 87.2 /100 | #135 | Excellent 20.2% |
| Immigrants | Nicaragua | 87.1 /100 | #136 | Excellent 20.2% |
| Immigrants | Iraq | 87.1 /100 | #137 | Excellent 20.2% |
| Aleuts | 86.3 /100 | #138 | Excellent 20.2% |
| Slovenes | 85.5 /100 | #139 | Excellent 20.2% |
| French American Indians | 85.3 /100 | #140 | Excellent 20.1% |
| Ottawa | 84.9 /100 | #141 | Excellent 20.1% |
| Jordanians | 84.4 /100 | #142 | Excellent 20.1% |
| Lithuanians | 84.4 /100 | #143 | Excellent 20.1% |
| Iranians | 84.0 /100 | #144 | Excellent 20.1% |
| Palestinians | 83.9 /100 | #145 | Excellent 20.1% |
| Australians | 83.6 /100 | #146 | Excellent 20.1% |
| Slovaks | 83.0 /100 | #147 | Excellent 20.1% |
| Guatemalans | 82.6 /100 | #148 | Excellent 20.1% |
| Immigrants | Iran | 80.9 /100 | #149 | Excellent 20.0% |