Peruvian vs Paiute 3 or more Vehicles in Household
COMPARE
Peruvian
Paiute
3 or more Vehicles in Household
3 or more Vehicles in Household Comparison
Peruvians
Paiute
19.6%
3 OR MORE VEHICLES IN HOUSEHOLD
58.8/ 100
METRIC RATING
168th/ 347
METRIC RANK
23.8%
3 OR MORE VEHICLES IN HOUSEHOLD
100.0/ 100
METRIC RATING
20th/ 347
METRIC RANK
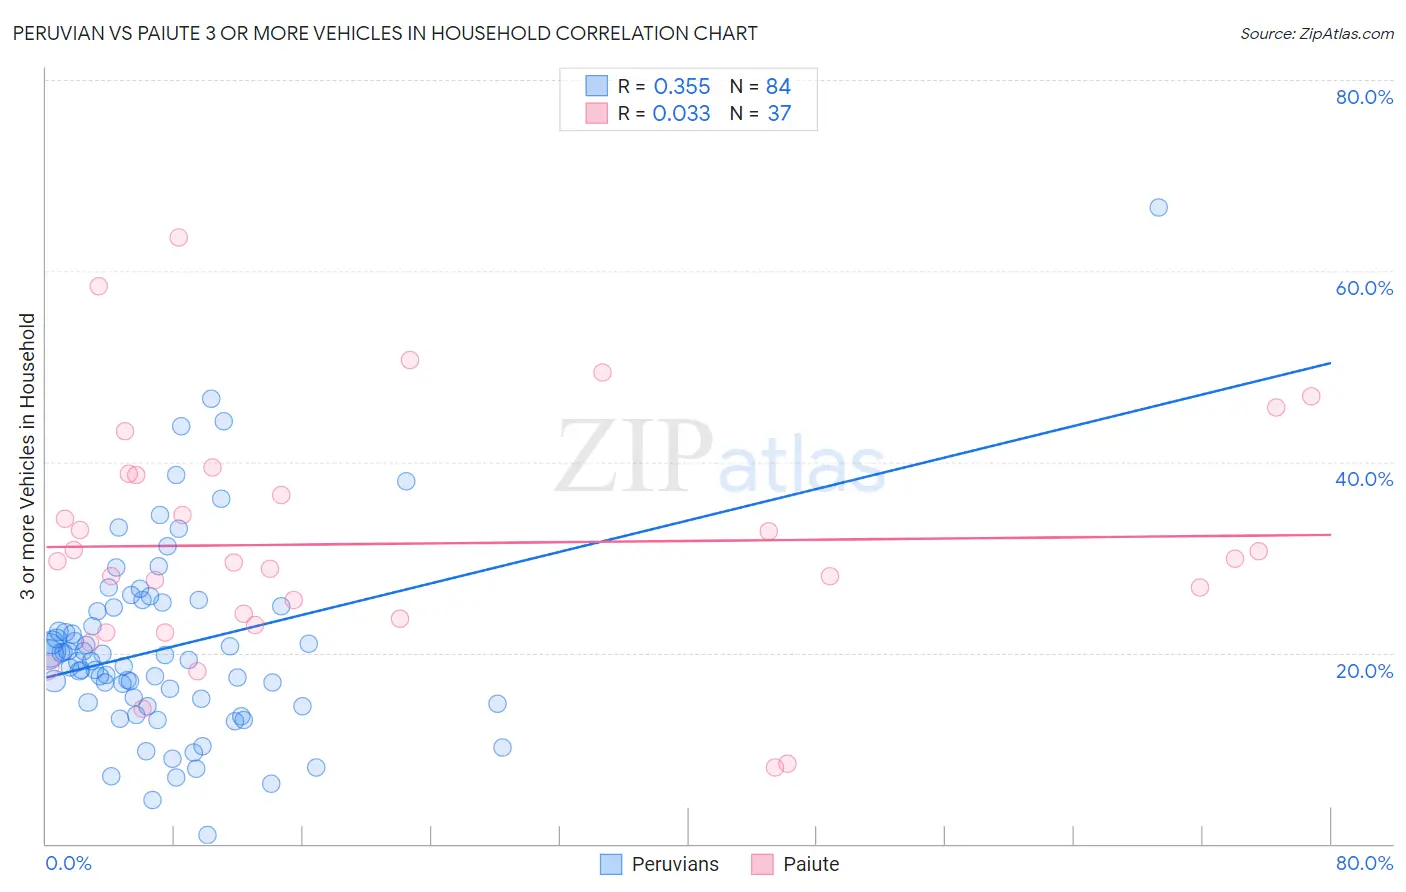
Peruvian vs Paiute 3 or more Vehicles in Household Correlation Chart
The statistical analysis conducted on geographies consisting of 362,865,457 people shows a mild positive correlation between the proportion of Peruvians and percentage of households with 3 or more vehicles available in the United States with a correlation coefficient (R) of 0.355 and weighted average of 19.6%. Similarly, the statistical analysis conducted on geographies consisting of 58,394,165 people shows no correlation between the proportion of Paiute and percentage of households with 3 or more vehicles available in the United States with a correlation coefficient (R) of 0.033 and weighted average of 23.8%, a difference of 21.2%.
3 or more Vehicles in Household Correlation Summary
| Measurement | Peruvian | Paiute |
| Minimum | 0.93% | 7.9% |
| Maximum | 66.7% | 63.5% |
| Range | 65.7% | 55.5% |
| Mean | 20.6% | 31.4% |
| Median | 19.2% | 29.6% |
| Interquartile 25% (IQ1) | 14.8% | 23.2% |
| Interquartile 75% (IQ3) | 24.8% | 38.7% |
| Interquartile Range (IQR) | 10.1% | 15.5% |
| Standard Deviation (Sample) | 10.2% | 12.4% |
| Standard Deviation (Population) | 10.1% | 12.3% |
Similar Demographics by 3 or more Vehicles in Household
Demographics Similar to Peruvians by 3 or more Vehicles in Household
In terms of 3 or more vehicles in household, the demographic groups most similar to Peruvians are Ukrainian (19.6%, a difference of 0.010%), Immigrants from Denmark (19.6%, a difference of 0.090%), Immigrants from Cameroon (19.7%, a difference of 0.17%), Iraqi (19.6%, a difference of 0.21%), and Immigrants from Costa Rica (19.7%, a difference of 0.25%).
| Demographics | Rating | Rank | 3 or more Vehicles in Household |
| Immigrants | Guatemala | 65.6 /100 | #161 | Good 19.7% |
| Estonians | 63.2 /100 | #162 | Good 19.7% |
| Chileans | 63.0 /100 | #163 | Good 19.7% |
| Yugoslavians | 62.9 /100 | #164 | Good 19.7% |
| Immigrants | Costa Rica | 61.9 /100 | #165 | Good 19.7% |
| Immigrants | Cameroon | 60.9 /100 | #166 | Good 19.7% |
| Ukrainians | 58.9 /100 | #167 | Average 19.6% |
| Peruvians | 58.8 /100 | #168 | Average 19.6% |
| Immigrants | Denmark | 57.6 /100 | #169 | Average 19.6% |
| Iraqis | 56.0 /100 | #170 | Average 19.6% |
| Immigrants | Western Europe | 53.2 /100 | #171 | Average 19.5% |
| Kiowa | 50.9 /100 | #172 | Average 19.5% |
| Immigrants | Northern Europe | 50.2 /100 | #173 | Average 19.5% |
| Immigrants | South Africa | 50.0 /100 | #174 | Average 19.5% |
| Syrians | 47.0 /100 | #175 | Average 19.5% |
Demographics Similar to Paiute by 3 or more Vehicles in Household
In terms of 3 or more vehicles in household, the demographic groups most similar to Paiute are Immigrants from Vietnam (23.8%, a difference of 0.12%), Immigrants from Philippines (23.8%, a difference of 0.18%), Chinese (23.9%, a difference of 0.29%), Norwegian (23.9%, a difference of 0.33%), and Scandinavian (23.6%, a difference of 0.77%).
| Demographics | Rating | Rank | 3 or more Vehicles in Household |
| Mexicans | 100.0 /100 | #13 | Exceptional 24.7% |
| Immigrants | Mexico | 100.0 /100 | #14 | Exceptional 24.6% |
| Hawaiians | 100.0 /100 | #15 | Exceptional 24.3% |
| Basques | 100.0 /100 | #16 | Exceptional 24.3% |
| Koreans | 100.0 /100 | #17 | Exceptional 24.1% |
| Norwegians | 100.0 /100 | #18 | Exceptional 23.9% |
| Chinese | 100.0 /100 | #19 | Exceptional 23.9% |
| Paiute | 100.0 /100 | #20 | Exceptional 23.8% |
| Immigrants | Vietnam | 100.0 /100 | #21 | Exceptional 23.8% |
| Immigrants | Philippines | 100.0 /100 | #22 | Exceptional 23.8% |
| Scandinavians | 100.0 /100 | #23 | Exceptional 23.6% |
| Sri Lankans | 100.0 /100 | #24 | Exceptional 23.6% |
| Immigrants | Central America | 100.0 /100 | #25 | Exceptional 23.4% |
| Mexican American Indians | 100.0 /100 | #26 | Exceptional 23.3% |
| Guamanians/Chamorros | 100.0 /100 | #27 | Exceptional 23.2% |