Peruvian vs Immigrants from Dominican Republic 3 or more Vehicles in Household
COMPARE
Peruvian
Immigrants from Dominican Republic
3 or more Vehicles in Household
3 or more Vehicles in Household Comparison
Peruvians
Immigrants from Dominican Republic
19.6%
3 OR MORE VEHICLES IN HOUSEHOLD
58.8/ 100
METRIC RATING
168th/ 347
METRIC RANK
10.4%
3 OR MORE VEHICLES IN HOUSEHOLD
0.0/ 100
METRIC RATING
345th/ 347
METRIC RANK
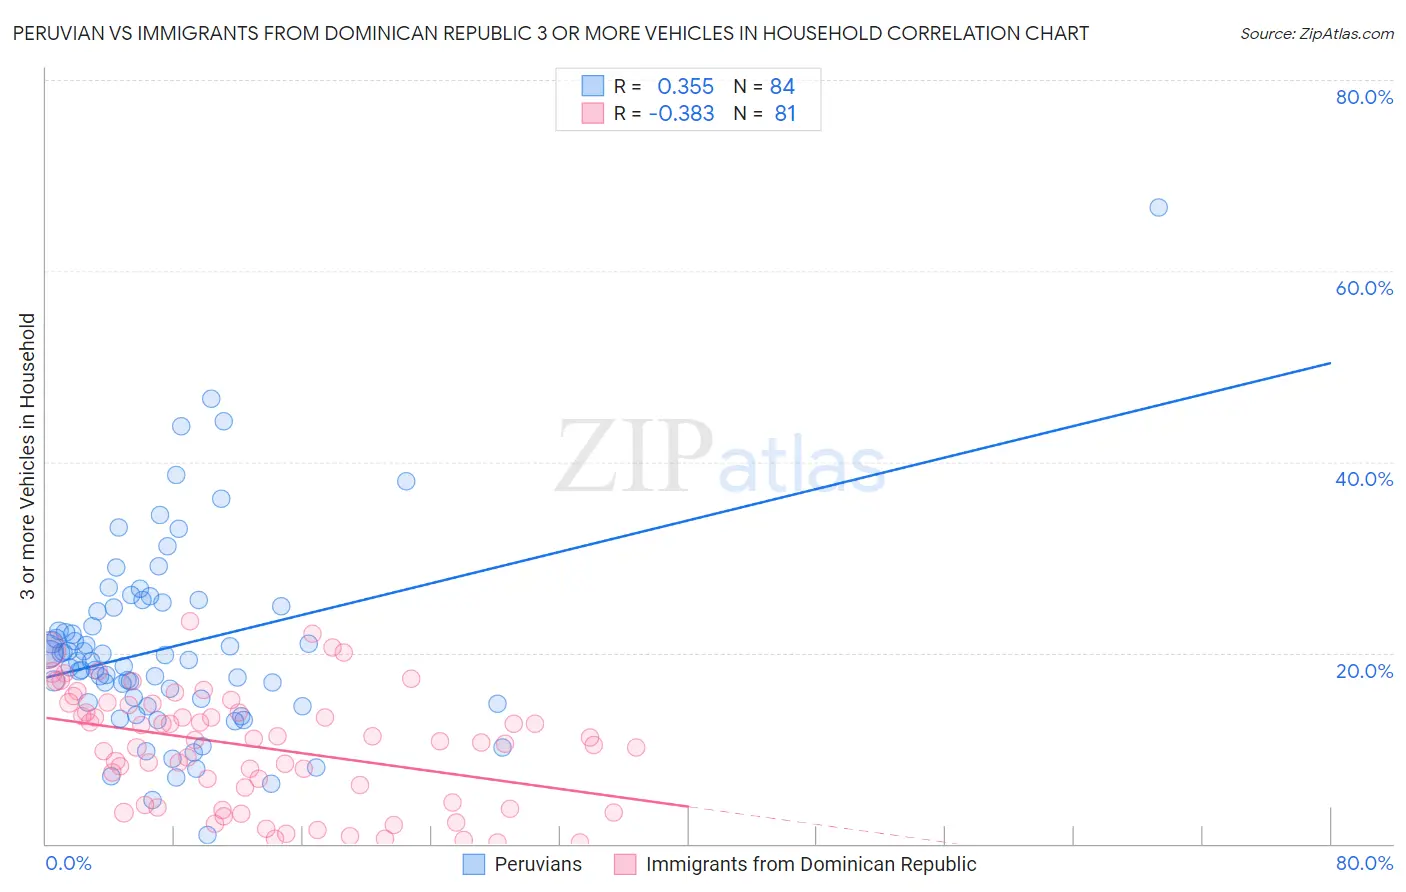
Peruvian vs Immigrants from Dominican Republic 3 or more Vehicles in Household Correlation Chart
The statistical analysis conducted on geographies consisting of 362,865,457 people shows a mild positive correlation between the proportion of Peruvians and percentage of households with 3 or more vehicles available in the United States with a correlation coefficient (R) of 0.355 and weighted average of 19.6%. Similarly, the statistical analysis conducted on geographies consisting of 274,888,789 people shows a mild negative correlation between the proportion of Immigrants from Dominican Republic and percentage of households with 3 or more vehicles available in the United States with a correlation coefficient (R) of -0.383 and weighted average of 10.4%, a difference of 88.3%.
3 or more Vehicles in Household Correlation Summary
| Measurement | Peruvian | Immigrants from Dominican Republic |
| Minimum | 0.93% | 0.12% |
| Maximum | 66.7% | 23.3% |
| Range | 65.7% | 23.2% |
| Mean | 20.6% | 10.1% |
| Median | 19.2% | 10.8% |
| Interquartile 25% (IQ1) | 14.8% | 4.2% |
| Interquartile 75% (IQ3) | 24.8% | 14.6% |
| Interquartile Range (IQR) | 10.1% | 10.4% |
| Standard Deviation (Sample) | 10.2% | 6.0% |
| Standard Deviation (Population) | 10.1% | 5.9% |
Similar Demographics by 3 or more Vehicles in Household
Demographics Similar to Peruvians by 3 or more Vehicles in Household
In terms of 3 or more vehicles in household, the demographic groups most similar to Peruvians are Ukrainian (19.6%, a difference of 0.010%), Immigrants from Denmark (19.6%, a difference of 0.090%), Immigrants from Cameroon (19.7%, a difference of 0.17%), Iraqi (19.6%, a difference of 0.21%), and Immigrants from Costa Rica (19.7%, a difference of 0.25%).
| Demographics | Rating | Rank | 3 or more Vehicles in Household |
| Immigrants | Guatemala | 65.6 /100 | #161 | Good 19.7% |
| Estonians | 63.2 /100 | #162 | Good 19.7% |
| Chileans | 63.0 /100 | #163 | Good 19.7% |
| Yugoslavians | 62.9 /100 | #164 | Good 19.7% |
| Immigrants | Costa Rica | 61.9 /100 | #165 | Good 19.7% |
| Immigrants | Cameroon | 60.9 /100 | #166 | Good 19.7% |
| Ukrainians | 58.9 /100 | #167 | Average 19.6% |
| Peruvians | 58.8 /100 | #168 | Average 19.6% |
| Immigrants | Denmark | 57.6 /100 | #169 | Average 19.6% |
| Iraqis | 56.0 /100 | #170 | Average 19.6% |
| Immigrants | Western Europe | 53.2 /100 | #171 | Average 19.5% |
| Kiowa | 50.9 /100 | #172 | Average 19.5% |
| Immigrants | Northern Europe | 50.2 /100 | #173 | Average 19.5% |
| Immigrants | South Africa | 50.0 /100 | #174 | Average 19.5% |
| Syrians | 47.0 /100 | #175 | Average 19.5% |
Demographics Similar to Immigrants from Dominican Republic by 3 or more Vehicles in Household
In terms of 3 or more vehicles in household, the demographic groups most similar to Immigrants from Dominican Republic are Immigrants from St. Vincent and the Grenadines (10.1%, a difference of 3.7%), Dominican (11.2%, a difference of 7.7%), Immigrants from Guyana (11.2%, a difference of 7.9%), British West Indian (11.4%, a difference of 9.8%), and Guyanese (11.5%, a difference of 9.9%).
| Demographics | Rating | Rank | 3 or more Vehicles in Household |
| Immigrants | Cabo Verde | 0.0 /100 | #333 | Tragic 13.6% |
| Immigrants | Ecuador | 0.0 /100 | #334 | Tragic 13.4% |
| Immigrants | Trinidad and Tobago | 0.0 /100 | #335 | Tragic 13.3% |
| Barbadians | 0.0 /100 | #336 | Tragic 12.6% |
| Immigrants | Bangladesh | 0.0 /100 | #337 | Tragic 12.5% |
| Vietnamese | 0.0 /100 | #338 | Tragic 12.5% |
| Immigrants | Uzbekistan | 0.0 /100 | #339 | Tragic 12.0% |
| Immigrants | Barbados | 0.0 /100 | #340 | Tragic 11.7% |
| Guyanese | 0.0 /100 | #341 | Tragic 11.5% |
| British West Indians | 0.0 /100 | #342 | Tragic 11.4% |
| Immigrants | Guyana | 0.0 /100 | #343 | Tragic 11.2% |
| Dominicans | 0.0 /100 | #344 | Tragic 11.2% |
| Immigrants | Dominican Republic | 0.0 /100 | #345 | Tragic 10.4% |
| Immigrants | St. Vincent and the Grenadines | 0.0 /100 | #346 | Tragic 10.1% |
| Immigrants | Grenada | 0.0 /100 | #347 | Tragic 9.1% |