Peruvian vs Immigrants from Korea 3 or more Vehicles in Household
COMPARE
Peruvian
Immigrants from Korea
3 or more Vehicles in Household
3 or more Vehicles in Household Comparison
Peruvians
Immigrants from Korea
19.6%
3 OR MORE VEHICLES IN HOUSEHOLD
58.8/ 100
METRIC RATING
168th/ 347
METRIC RANK
20.5%
3 OR MORE VEHICLES IN HOUSEHOLD
93.7/ 100
METRIC RATING
123rd/ 347
METRIC RANK
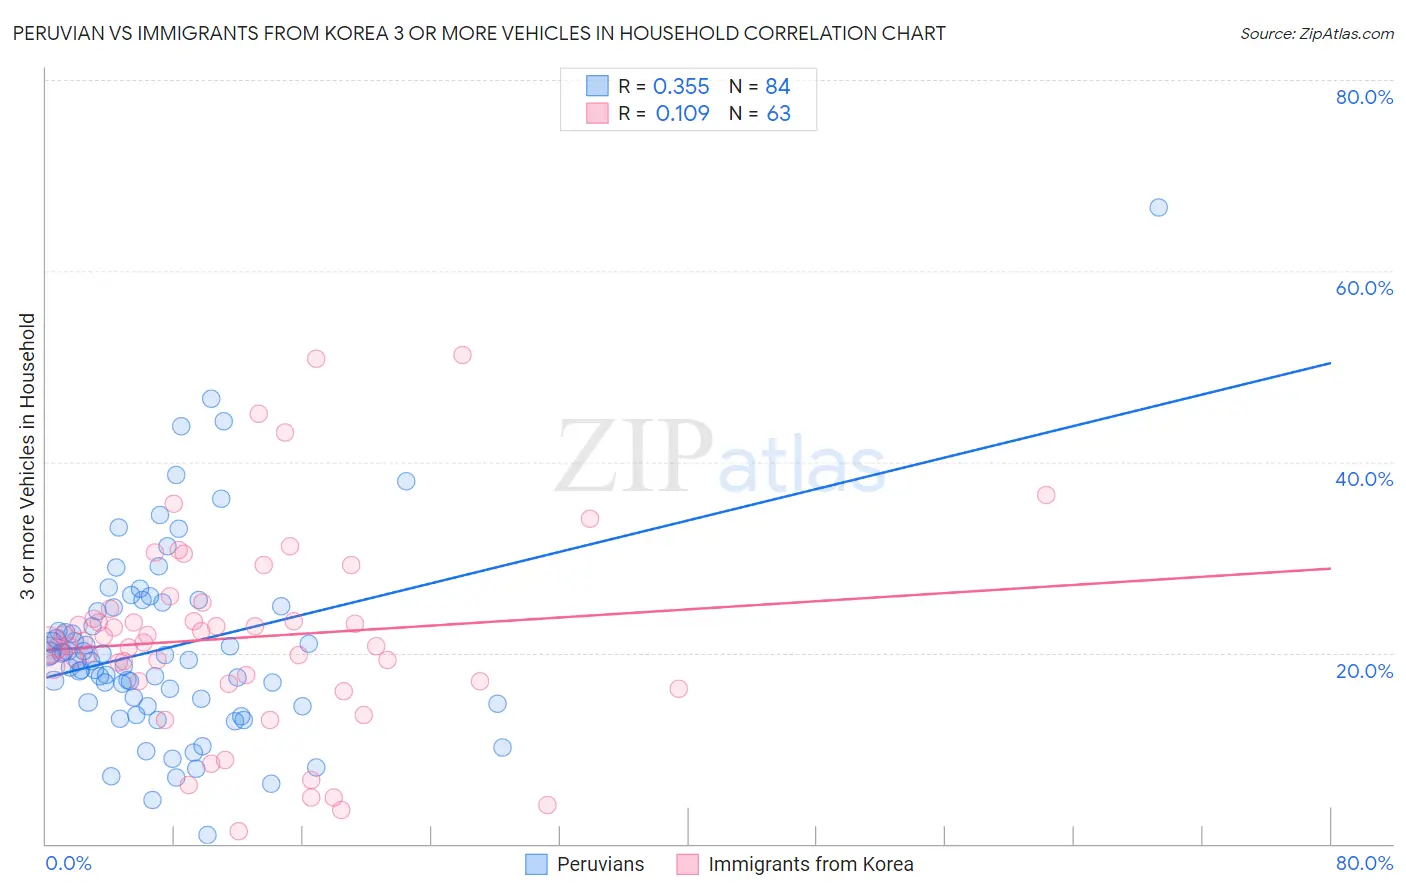
Peruvian vs Immigrants from Korea 3 or more Vehicles in Household Correlation Chart
The statistical analysis conducted on geographies consisting of 362,865,457 people shows a mild positive correlation between the proportion of Peruvians and percentage of households with 3 or more vehicles available in the United States with a correlation coefficient (R) of 0.355 and weighted average of 19.6%. Similarly, the statistical analysis conducted on geographies consisting of 415,786,030 people shows a poor positive correlation between the proportion of Immigrants from Korea and percentage of households with 3 or more vehicles available in the United States with a correlation coefficient (R) of 0.109 and weighted average of 20.5%, a difference of 4.4%.
3 or more Vehicles in Household Correlation Summary
| Measurement | Peruvian | Immigrants from Korea |
| Minimum | 0.93% | 1.2% |
| Maximum | 66.7% | 51.2% |
| Range | 65.7% | 50.0% |
| Mean | 20.6% | 21.6% |
| Median | 19.2% | 21.1% |
| Interquartile 25% (IQ1) | 14.8% | 17.0% |
| Interquartile 75% (IQ3) | 24.8% | 24.6% |
| Interquartile Range (IQR) | 10.1% | 7.6% |
| Standard Deviation (Sample) | 10.2% | 10.3% |
| Standard Deviation (Population) | 10.1% | 10.3% |
Similar Demographics by 3 or more Vehicles in Household
Demographics Similar to Peruvians by 3 or more Vehicles in Household
In terms of 3 or more vehicles in household, the demographic groups most similar to Peruvians are Ukrainian (19.6%, a difference of 0.010%), Immigrants from Denmark (19.6%, a difference of 0.090%), Immigrants from Cameroon (19.7%, a difference of 0.17%), Iraqi (19.6%, a difference of 0.21%), and Immigrants from Costa Rica (19.7%, a difference of 0.25%).
| Demographics | Rating | Rank | 3 or more Vehicles in Household |
| Immigrants | Guatemala | 65.6 /100 | #161 | Good 19.7% |
| Estonians | 63.2 /100 | #162 | Good 19.7% |
| Chileans | 63.0 /100 | #163 | Good 19.7% |
| Yugoslavians | 62.9 /100 | #164 | Good 19.7% |
| Immigrants | Costa Rica | 61.9 /100 | #165 | Good 19.7% |
| Immigrants | Cameroon | 60.9 /100 | #166 | Good 19.7% |
| Ukrainians | 58.9 /100 | #167 | Average 19.6% |
| Peruvians | 58.8 /100 | #168 | Average 19.6% |
| Immigrants | Denmark | 57.6 /100 | #169 | Average 19.6% |
| Iraqis | 56.0 /100 | #170 | Average 19.6% |
| Immigrants | Western Europe | 53.2 /100 | #171 | Average 19.5% |
| Kiowa | 50.9 /100 | #172 | Average 19.5% |
| Immigrants | Northern Europe | 50.2 /100 | #173 | Average 19.5% |
| Immigrants | South Africa | 50.0 /100 | #174 | Average 19.5% |
| Syrians | 47.0 /100 | #175 | Average 19.5% |
Demographics Similar to Immigrants from Korea by 3 or more Vehicles in Household
In terms of 3 or more vehicles in household, the demographic groups most similar to Immigrants from Korea are German Russian (20.5%, a difference of 0.010%), Immigrants from Thailand (20.5%, a difference of 0.050%), Maltese (20.5%, a difference of 0.060%), Central American (20.5%, a difference of 0.17%), and Immigrants from Netherlands (20.4%, a difference of 0.20%).
| Demographics | Rating | Rank | 3 or more Vehicles in Household |
| Italians | 94.9 /100 | #116 | Exceptional 20.6% |
| Croatians | 94.9 /100 | #117 | Exceptional 20.6% |
| Costa Ricans | 94.6 /100 | #118 | Exceptional 20.6% |
| Immigrants | Latin America | 94.5 /100 | #119 | Exceptional 20.5% |
| Maltese | 93.9 /100 | #120 | Exceptional 20.5% |
| Immigrants | Thailand | 93.8 /100 | #121 | Exceptional 20.5% |
| German Russians | 93.7 /100 | #122 | Exceptional 20.5% |
| Immigrants | Korea | 93.7 /100 | #123 | Exceptional 20.5% |
| Central Americans | 93.1 /100 | #124 | Exceptional 20.5% |
| Immigrants | Netherlands | 92.9 /100 | #125 | Exceptional 20.4% |
| Slavs | 92.1 /100 | #126 | Exceptional 20.4% |
| Immigrants | Bolivia | 92.0 /100 | #127 | Exceptional 20.4% |
| New Zealanders | 91.3 /100 | #128 | Exceptional 20.4% |
| Zimbabweans | 88.7 /100 | #129 | Excellent 20.3% |
| Greeks | 88.6 /100 | #130 | Excellent 20.3% |