Hopi vs Venezuelan 3 or more Vehicles in Household
COMPARE
Hopi
Venezuelan
3 or more Vehicles in Household
3 or more Vehicles in Household Comparison
Hopi
Venezuelans
18.2%
3 OR MORE VEHICLES IN HOUSEHOLD
2.5/ 100
METRIC RATING
242nd/ 347
METRIC RANK
18.0%
3 OR MORE VEHICLES IN HOUSEHOLD
1.7/ 100
METRIC RATING
250th/ 347
METRIC RANK
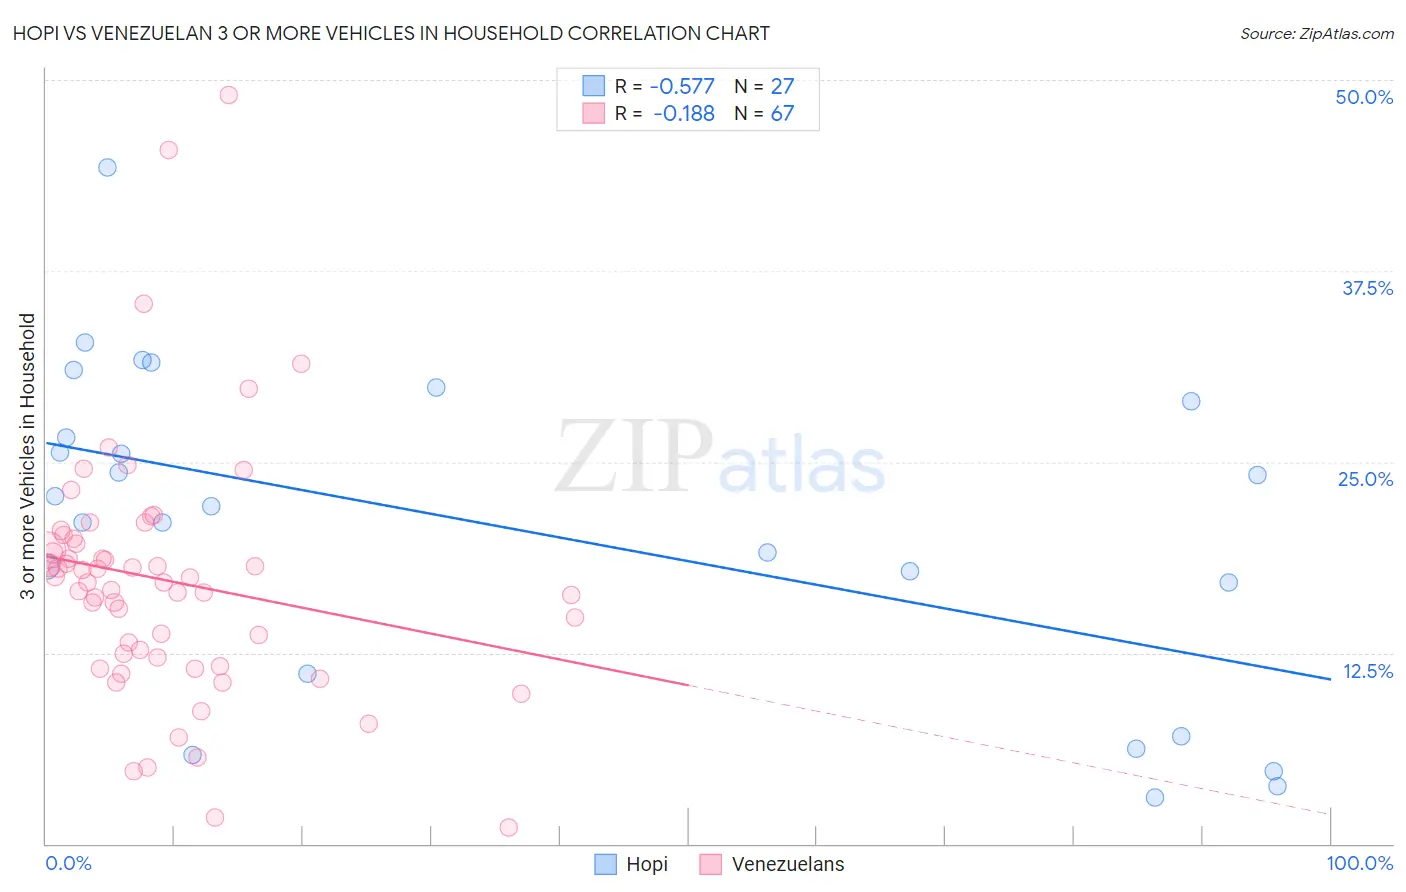
Hopi vs Venezuelan 3 or more Vehicles in Household Correlation Chart
The statistical analysis conducted on geographies consisting of 74,728,795 people shows a substantial negative correlation between the proportion of Hopi and percentage of households with 3 or more vehicles available in the United States with a correlation coefficient (R) of -0.577 and weighted average of 18.2%. Similarly, the statistical analysis conducted on geographies consisting of 306,053,229 people shows a poor negative correlation between the proportion of Venezuelans and percentage of households with 3 or more vehicles available in the United States with a correlation coefficient (R) of -0.188 and weighted average of 18.0%, a difference of 0.84%.
3 or more Vehicles in Household Correlation Summary
| Measurement | Hopi | Venezuelan |
| Minimum | 3.0% | 1.1% |
| Maximum | 44.3% | 49.0% |
| Range | 41.2% | 47.9% |
| Mean | 20.6% | 17.2% |
| Median | 22.1% | 17.1% |
| Interquartile 25% (IQ1) | 11.1% | 12.2% |
| Interquartile 75% (IQ3) | 29.0% | 20.0% |
| Interquartile Range (IQR) | 17.9% | 7.8% |
| Standard Deviation (Sample) | 10.6% | 8.3% |
| Standard Deviation (Population) | 10.4% | 8.2% |
Demographics Similar to Hopi and Venezuelans by 3 or more Vehicles in Household
In terms of 3 or more vehicles in household, the demographic groups most similar to Hopi are African (18.2%, a difference of 0.11%), Immigrants from Europe (18.1%, a difference of 0.12%), Mongolian (18.1%, a difference of 0.24%), Immigrants from China (18.2%, a difference of 0.31%), and Immigrants from Belize (18.1%, a difference of 0.39%). Similarly, the demographic groups most similar to Venezuelans are Immigrants from Saudi Arabia (18.0%, a difference of 0.020%), Immigrants from Eastern Africa (18.0%, a difference of 0.080%), Alsatian (18.0%, a difference of 0.20%), Carpatho Rusyn (18.0%, a difference of 0.21%), and Immigrants from Australia (18.1%, a difference of 0.37%).
| Demographics | Rating | Rank | 3 or more Vehicles in Household |
| Immigrants | Malaysia | 3.6 /100 | #236 | Tragic 18.3% |
| Indonesians | 3.5 /100 | #237 | Tragic 18.3% |
| Immigrants | Honduras | 3.1 /100 | #238 | Tragic 18.2% |
| Immigrants | Middle Africa | 3.1 /100 | #239 | Tragic 18.2% |
| Immigrants | China | 2.9 /100 | #240 | Tragic 18.2% |
| Africans | 2.7 /100 | #241 | Tragic 18.2% |
| Hopi | 2.5 /100 | #242 | Tragic 18.2% |
| Immigrants | Europe | 2.4 /100 | #243 | Tragic 18.1% |
| Mongolians | 2.3 /100 | #244 | Tragic 18.1% |
| Immigrants | Belize | 2.1 /100 | #245 | Tragic 18.1% |
| Immigrants | Australia | 2.0 /100 | #246 | Tragic 18.1% |
| Carpatho Rusyns | 1.9 /100 | #247 | Tragic 18.0% |
| Immigrants | Eastern Africa | 1.8 /100 | #248 | Tragic 18.0% |
| Immigrants | Saudi Arabia | 1.7 /100 | #249 | Tragic 18.0% |
| Venezuelans | 1.7 /100 | #250 | Tragic 18.0% |
| Alsatians | 1.5 /100 | #251 | Tragic 18.0% |
| Immigrants | Southern Europe | 1.4 /100 | #252 | Tragic 17.9% |
| Immigrants | Ethiopia | 1.3 /100 | #253 | Tragic 17.9% |
| Ethiopians | 1.2 /100 | #254 | Tragic 17.9% |
| Immigrants | Turkey | 1.2 /100 | #255 | Tragic 17.9% |
| Sub-Saharan Africans | 1.1 /100 | #256 | Tragic 17.9% |