Hopi vs Immigrants from Guatemala 3 or more Vehicles in Household
COMPARE
Hopi
Immigrants from Guatemala
3 or more Vehicles in Household
3 or more Vehicles in Household Comparison
Hopi
Immigrants from Guatemala
18.2%
3 OR MORE VEHICLES IN HOUSEHOLD
2.5/ 100
METRIC RATING
242nd/ 347
METRIC RANK
19.7%
3 OR MORE VEHICLES IN HOUSEHOLD
65.6/ 100
METRIC RATING
161st/ 347
METRIC RANK
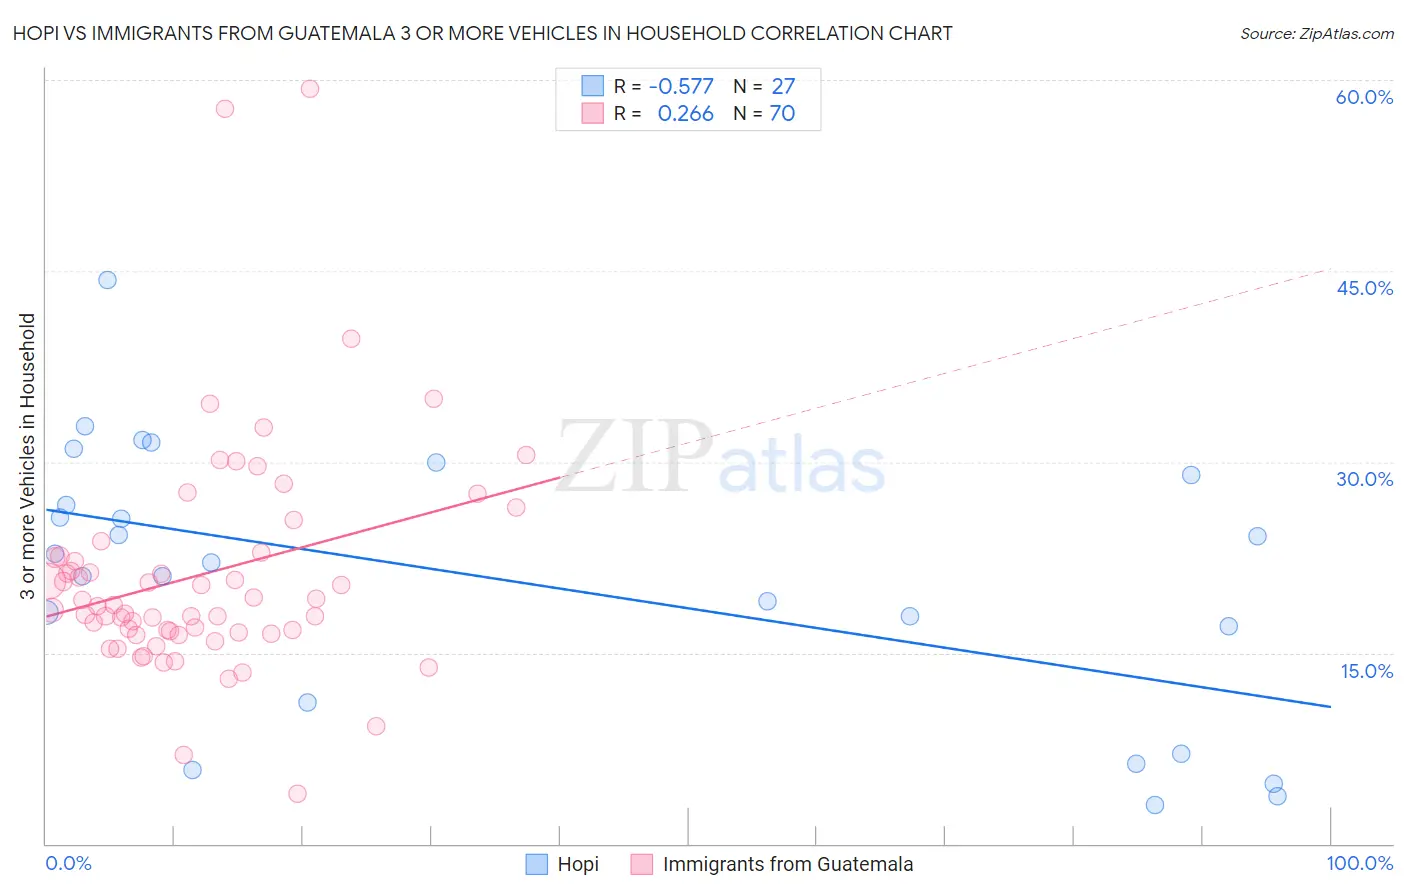
Hopi vs Immigrants from Guatemala 3 or more Vehicles in Household Correlation Chart
The statistical analysis conducted on geographies consisting of 74,728,795 people shows a substantial negative correlation between the proportion of Hopi and percentage of households with 3 or more vehicles available in the United States with a correlation coefficient (R) of -0.577 and weighted average of 18.2%. Similarly, the statistical analysis conducted on geographies consisting of 377,138,976 people shows a weak positive correlation between the proportion of Immigrants from Guatemala and percentage of households with 3 or more vehicles available in the United States with a correlation coefficient (R) of 0.266 and weighted average of 19.7%, a difference of 8.7%.
3 or more Vehicles in Household Correlation Summary
| Measurement | Hopi | Immigrants from Guatemala |
| Minimum | 3.0% | 3.9% |
| Maximum | 44.3% | 59.3% |
| Range | 41.2% | 55.5% |
| Mean | 20.6% | 21.1% |
| Median | 22.1% | 18.7% |
| Interquartile 25% (IQ1) | 11.1% | 16.6% |
| Interquartile 75% (IQ3) | 29.0% | 22.6% |
| Interquartile Range (IQR) | 17.9% | 6.0% |
| Standard Deviation (Sample) | 10.6% | 9.0% |
| Standard Deviation (Population) | 10.4% | 9.0% |
Similar Demographics by 3 or more Vehicles in Household
Demographics Similar to Hopi by 3 or more Vehicles in Household
In terms of 3 or more vehicles in household, the demographic groups most similar to Hopi are African (18.2%, a difference of 0.11%), Immigrants from Europe (18.1%, a difference of 0.12%), Mongolian (18.1%, a difference of 0.24%), Immigrants from China (18.2%, a difference of 0.31%), and Immigrants from Belize (18.1%, a difference of 0.39%).
| Demographics | Rating | Rank | 3 or more Vehicles in Household |
| Sierra Leoneans | 3.9 /100 | #235 | Tragic 18.3% |
| Immigrants | Malaysia | 3.6 /100 | #236 | Tragic 18.3% |
| Indonesians | 3.5 /100 | #237 | Tragic 18.3% |
| Immigrants | Honduras | 3.1 /100 | #238 | Tragic 18.2% |
| Immigrants | Middle Africa | 3.1 /100 | #239 | Tragic 18.2% |
| Immigrants | China | 2.9 /100 | #240 | Tragic 18.2% |
| Africans | 2.7 /100 | #241 | Tragic 18.2% |
| Hopi | 2.5 /100 | #242 | Tragic 18.2% |
| Immigrants | Europe | 2.4 /100 | #243 | Tragic 18.1% |
| Mongolians | 2.3 /100 | #244 | Tragic 18.1% |
| Immigrants | Belize | 2.1 /100 | #245 | Tragic 18.1% |
| Immigrants | Australia | 2.0 /100 | #246 | Tragic 18.1% |
| Carpatho Rusyns | 1.9 /100 | #247 | Tragic 18.0% |
| Immigrants | Eastern Africa | 1.8 /100 | #248 | Tragic 18.0% |
| Immigrants | Saudi Arabia | 1.7 /100 | #249 | Tragic 18.0% |
Demographics Similar to Immigrants from Guatemala by 3 or more Vehicles in Household
In terms of 3 or more vehicles in household, the demographic groups most similar to Immigrants from Guatemala are Immigrants from Lebanon (19.8%, a difference of 0.16%), Estonian (19.7%, a difference of 0.19%), Chilean (19.7%, a difference of 0.21%), Immigrants from Pakistan (19.8%, a difference of 0.22%), and Yugoslavian (19.7%, a difference of 0.22%).
| Demographics | Rating | Rank | 3 or more Vehicles in Household |
| Immigrants | Jordan | 75.0 /100 | #154 | Good 19.9% |
| Tlingit-Haida | 73.4 /100 | #155 | Good 19.9% |
| Thais | 71.1 /100 | #156 | Good 19.8% |
| Hungarians | 70.5 /100 | #157 | Good 19.8% |
| Armenians | 68.8 /100 | #158 | Good 19.8% |
| Immigrants | Pakistan | 68.2 /100 | #159 | Good 19.8% |
| Immigrants | Lebanon | 67.6 /100 | #160 | Good 19.8% |
| Immigrants | Guatemala | 65.6 /100 | #161 | Good 19.7% |
| Estonians | 63.2 /100 | #162 | Good 19.7% |
| Chileans | 63.0 /100 | #163 | Good 19.7% |
| Yugoslavians | 62.9 /100 | #164 | Good 19.7% |
| Immigrants | Costa Rica | 61.9 /100 | #165 | Good 19.7% |
| Immigrants | Cameroon | 60.9 /100 | #166 | Good 19.7% |
| Ukrainians | 58.9 /100 | #167 | Average 19.6% |
| Peruvians | 58.8 /100 | #168 | Average 19.6% |