Hopi 6th Grade
COMPARE
Hopi
Select to Compare
6th Grade
Hopi 6th Grade
97.2%
6TH GRADE
78.8/ 100
METRIC RATING
146th/ 347
METRIC RANK
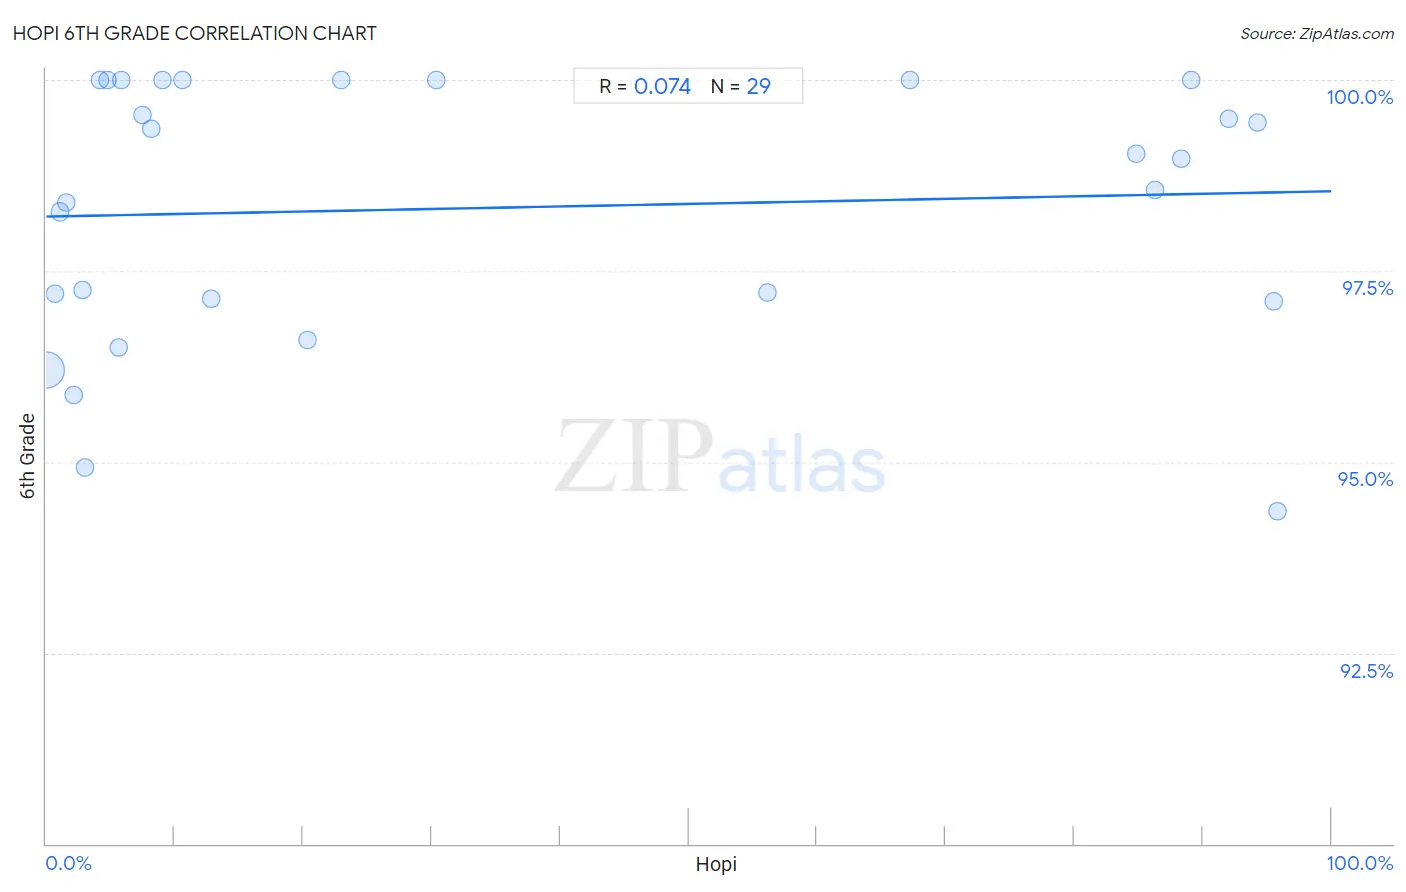
Hopi 6th Grade Correlation Chart
The statistical analysis conducted on geographies consisting of 74,739,957 people shows a slight positive correlation between the proportion of Hopi and percentage of population with at least 6th grade education in the United States with a correlation coefficient (R) of 0.074 and weighted average of 97.2%. On average, for every 1% (one percent) increase in Hopi within a typical geography, there is an increase of 0.0033% in percentage of population with at least 6th grade education.
It is essential to understand that the correlation between the percentage of Hopi and percentage of population with at least 6th grade education does not imply a direct cause-and-effect relationship. It remains uncertain whether the presence of Hopi influences an upward or downward trend in the level of percentage of population with at least 6th grade education within an area, or if Hopi simply ended up residing in those areas with higher or lower levels of percentage of population with at least 6th grade education due to other factors.
Demographics Similar to Hopi by 6th Grade
In terms of 6th grade, the demographic groups most similar to Hopi are Spaniard (97.2%, a difference of 0.010%), Immigrants from South Central Asia (97.2%, a difference of 0.010%), Immigrants from Greece (97.2%, a difference of 0.010%), Immigrants from Israel (97.2%, a difference of 0.020%), and Pima (97.2%, a difference of 0.030%).
| Demographics | Rating | Rank | 6th Grade |
| Immigrants from Turkey | 86.1 /100 | #139 | Excellent 97.3% |
| Immigrants from North Macedonia | 85.5 /100 | #140 | Excellent 97.2% |
| Seminole | 84.8 /100 | #141 | Excellent 97.2% |
| Jordanians | 84.6 /100 | #142 | Excellent 97.2% |
| Pima | 82.9 /100 | #143 | Excellent 97.2% |
| Israelis | 82.9 /100 | #144 | Excellent 97.2% |
| Spaniards | 80.1 /100 | #145 | Excellent 97.2% |
| Hopi | 78.8 /100 | #146 | Good 97.2% |
| Immigrants from South Central Asia | 78.1 /100 | #147 | Good 97.2% |
| Immigrants from Greece | 77.8 /100 | #148 | Good 97.2% |
| Immigrants from Israel | 76.0 /100 | #149 | Good 97.2% |
| Immigrants from Bosnia and Herzegovina | 74.8 /100 | #150 | Good 97.2% |
| French American Indians | 74.0 /100 | #151 | Good 97.2% |
| Immigrants from Jordan | 73.0 /100 | #152 | Good 97.2% |
| Immigrants from Eastern Europe | 72.6 /100 | #153 | Good 97.2% |
Hopi 6th Grade Correlation Summary
| Measurement | Hopi Data | 6th Grade Data |
| Minimum | 0.030% | 94.4% |
| Maximum | 95.9% | 100.0% |
| Range | 95.8% | 5.6% |
| Mean | 34.6% | 98.3% |
| Median | 10.6% | 99.0% |
| Interquartile 25% (IQ1) | 3.6% | 97.1% |
| Interquartile 75% (IQ3) | 85.5% | 100.0% |
| Interquartile Range (IQR) | 81.9% | 2.9% |
| Standard Deviation (Sample) | 38.5% | 1.7% |
| Standard Deviation (Population) | 37.8% | 1.7% |
Correlation Details
| Hopi Percentile | Sample Size | 6th Grade |
[ 0.0% - 0.5% ] 0.030% | 73,938,146 | 96.2% |
[ 0.5% - 1.0% ] 0.66% | 426,363 | 97.2% |
[ 1.0% - 1.5% ] 1.09% | 214,089 | 98.3% |
[ 1.5% - 2.0% ] 1.57% | 55,648 | 98.4% |
[ 2.0% - 2.5% ] 2.09% | 21,914 | 95.9% |
[ 2.5% - 3.0% ] 2.78% | 20,646 | 97.3% |
[ 3.0% - 3.5% ] 3.01% | 7,317 | 94.9% |
[ 4.0% - 4.5% ] 4.19% | 1,478 | 100.0% |
[ 4.5% - 5.0% ] 4.73% | 824 | 100.0% |
[ 5.5% - 6.0% ] 5.61% | 8,887 | 96.5% |
[ 5.5% - 6.0% ] 5.86% | 1,347 | 100.0% |
[ 7.5% - 8.0% ] 7.50% | 6,771 | 99.5% |
[ 8.0% - 8.5% ] 8.22% | 4,842 | 99.4% |
[ 9.0% - 9.5% ] 9.06% | 574 | 100.0% |
[ 10.5% - 11.0% ] 10.64% | 47 | 100.0% |
[ 12.5% - 13.0% ] 12.87% | 11,154 | 97.1% |
[ 20.0% - 20.5% ] 20.32% | 3,918 | 96.6% |
[ 22.5% - 23.0% ] 22.99% | 1,914 | 100.0% |
[ 30.0% - 30.5% ] 30.32% | 343 | 100.0% |
[ 56.0% - 56.5% ] 56.12% | 1,504 | 97.2% |
[ 67.0% - 67.5% ] 67.20% | 436 | 100.0% |
[ 84.5% - 85.0% ] 84.79% | 1,966 | 99.0% |
[ 86.0% - 86.5% ] 86.24% | 1,454 | 98.6% |
[ 88.0% - 88.5% ] 88.35% | 1,064 | 99.0% |
[ 89.0% - 89.5% ] 89.14% | 1,372 | 100.0% |
[ 91.5% - 92.0% ] 91.99% | 2,523 | 99.5% |
[ 94.0% - 94.5% ] 94.25% | 887 | 99.4% |
[ 95.5% - 96.0% ] 95.52% | 1,829 | 97.1% |
[ 95.5% - 96.0% ] 95.86% | 700 | 94.4% |