Hopi Male Disability
COMPARE
Hopi
Select to Compare
Male Disability
Hopi Male Disability
12.5%
DISABILITY | MALES
0.0/ 100
METRIC RATING
274th/ 347
METRIC RANK
Hopi Male Disability Correlation Chart
The statistical analysis conducted on geographies consisting of 74,731,740 people shows a mild negative correlation between the proportion of Hopi and percentage of males with a disability in the United States with a correlation coefficient (R) of -0.303 and weighted average of 12.5%. On average, for every 1% (one percent) increase in Hopi within a typical geography, there is a decrease of 0.049% in percentage of males with a disability.
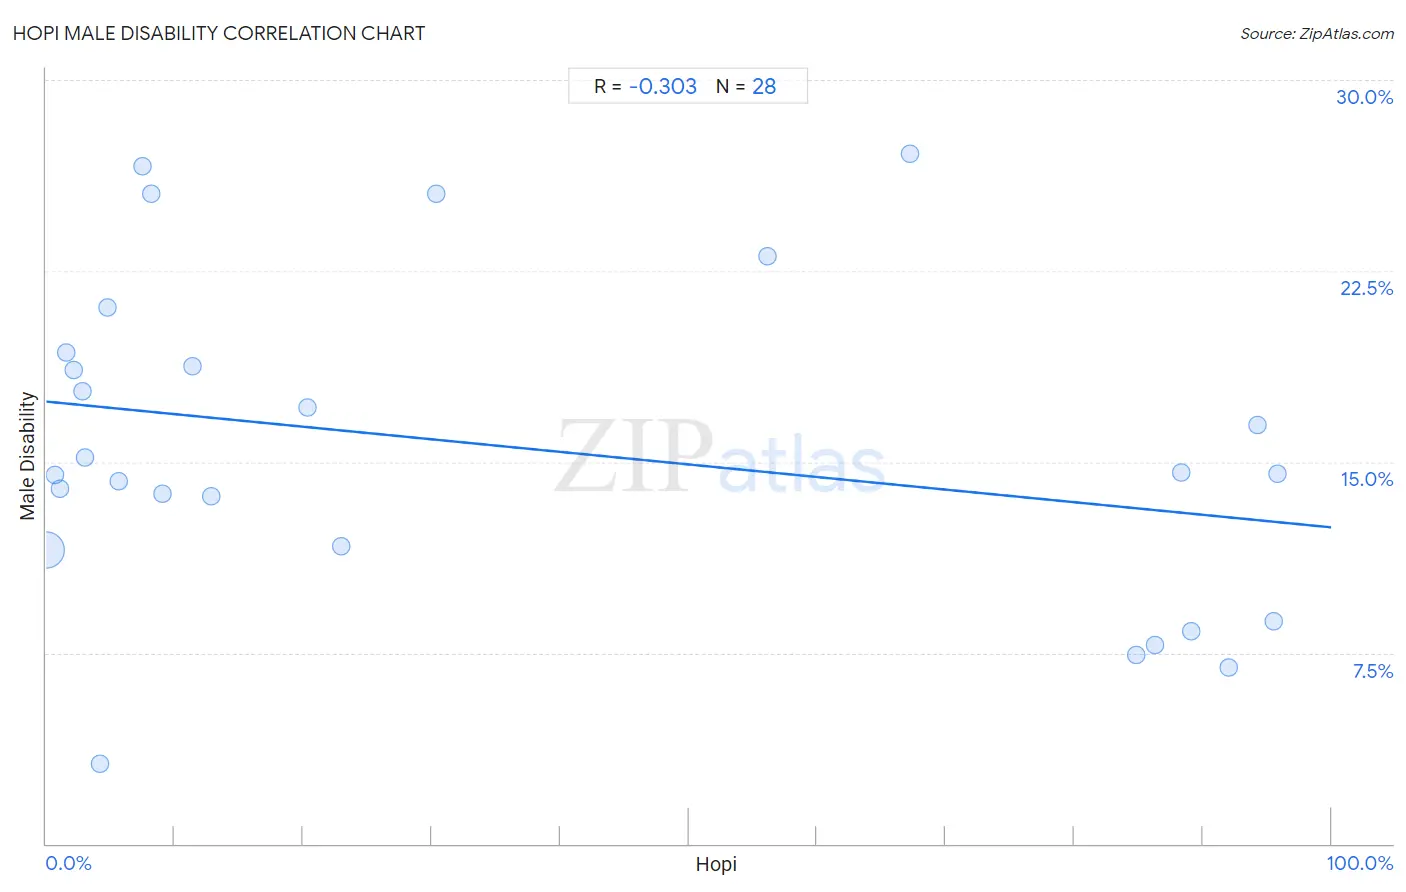
It is essential to understand that the correlation between the percentage of Hopi and percentage of males with a disability does not imply a direct cause-and-effect relationship. It remains uncertain whether the presence of Hopi influences an upward or downward trend in the level of percentage of males with a disability within an area, or if Hopi simply ended up residing in those areas with higher or lower levels of percentage of males with a disability due to other factors.
Demographics Similar to Hopi by Male Disability
In terms of male disability, the demographic groups most similar to Hopi are Native Hawaiian (12.5%, a difference of 0.33%), Fijian (12.6%, a difference of 0.35%), Hmong (12.5%, a difference of 0.39%), African (12.6%, a difference of 0.40%), and Finnish (12.6%, a difference of 0.72%).
| Demographics | Rating | Rank | Male Disability |
| Immigrants from Germany | 0.1 /100 | #267 | Tragic 12.3% |
| Portuguese | 0.1 /100 | #268 | Tragic 12.3% |
| Czechoslovakians | 0.1 /100 | #269 | Tragic 12.3% |
| Spaniards | 0.1 /100 | #270 | Tragic 12.3% |
| Scandinavians | 0.1 /100 | #271 | Tragic 12.3% |
| Hmong | 0.0 /100 | #272 | Tragic 12.5% |
| Native Hawaiians | 0.0 /100 | #273 | Tragic 12.5% |
| Hopi | 0.0 /100 | #274 | Tragic 12.5% |
| Fijians | 0.0 /100 | #275 | Tragic 12.6% |
| Africans | 0.0 /100 | #276 | Tragic 12.6% |
| Finns | 0.0 /100 | #277 | Tragic 12.6% |
| Central American Indians | 0.0 /100 | #278 | Tragic 12.7% |
| Slovaks | 0.0 /100 | #279 | Tragic 12.7% |
| Dutch | 0.0 /100 | #280 | Tragic 12.7% |
| Sioux | 0.0 /100 | #281 | Tragic 12.7% |
Hopi Male Disability Correlation Summary
| Measurement | Hopi Data | Male Disability Data |
| Minimum | 0.030% | 3.2% |
| Maximum | 95.9% | 27.1% |
| Range | 95.8% | 24.0% |
| Mean | 35.6% | 15.6% |
| Median | 12.1% | 14.5% |
| Interquartile 25% (IQ1) | 3.6% | 11.6% |
| Interquartile 75% (IQ3) | 85.5% | 19.0% |
| Interquartile Range (IQR) | 81.9% | 7.4% |
| Standard Deviation (Sample) | 38.8% | 6.3% |
| Standard Deviation (Population) | 38.1% | 6.2% |
Correlation Details
| Hopi Percentile | Sample Size | Male Disability |
[ 0.0% - 0.5% ] 0.030% | 73,932,771 | 11.6% |
[ 0.5% - 1.0% ] 0.66% | 425,102 | 14.5% |
[ 1.0% - 1.5% ] 1.09% | 214,089 | 13.9% |
[ 1.5% - 2.0% ] 1.57% | 55,648 | 19.3% |
[ 2.0% - 2.5% ] 2.09% | 21,914 | 18.6% |
[ 2.5% - 3.0% ] 2.78% | 20,646 | 17.8% |
[ 3.0% - 3.5% ] 3.01% | 6,919 | 15.2% |
[ 4.0% - 4.5% ] 4.19% | 1,478 | 3.2% |
[ 4.5% - 5.0% ] 4.73% | 824 | 21.0% |
[ 5.5% - 6.0% ] 5.61% | 8,887 | 14.2% |
[ 7.5% - 8.0% ] 7.50% | 6,771 | 26.6% |
[ 8.0% - 8.5% ] 8.22% | 4,842 | 25.5% |
[ 9.0% - 9.5% ] 9.06% | 574 | 13.8% |
[ 11.0% - 11.5% ] 11.37% | 211 | 18.8% |
[ 12.5% - 13.0% ] 12.87% | 11,154 | 13.7% |
[ 20.0% - 20.5% ] 20.32% | 3,918 | 17.1% |
[ 22.5% - 23.0% ] 22.99% | 1,914 | 11.7% |
[ 30.0% - 30.5% ] 30.32% | 343 | 25.5% |
[ 56.0% - 56.5% ] 56.12% | 1,504 | 23.1% |
[ 67.0% - 67.5% ] 67.20% | 436 | 27.1% |
[ 84.5% - 85.0% ] 84.79% | 1,966 | 7.4% |
[ 86.0% - 86.5% ] 86.24% | 1,454 | 7.8% |
[ 88.0% - 88.5% ] 88.35% | 1,064 | 14.6% |
[ 89.0% - 89.5% ] 89.14% | 1,372 | 8.4% |
[ 91.5% - 92.0% ] 91.99% | 2,523 | 6.9% |
[ 94.0% - 94.5% ] 94.25% | 887 | 16.5% |
[ 95.5% - 96.0% ] 95.52% | 1,829 | 8.8% |
[ 95.5% - 96.0% ] 95.86% | 700 | 14.5% |