Hopi Self-Care Disability
COMPARE
Hopi
Select to Compare
Self-Care Disability
Hopi Self-Care Disability
2.9%
SELF-CARE DISABILITY
0.0/ 100
METRIC RATING
328th/ 347
METRIC RANK
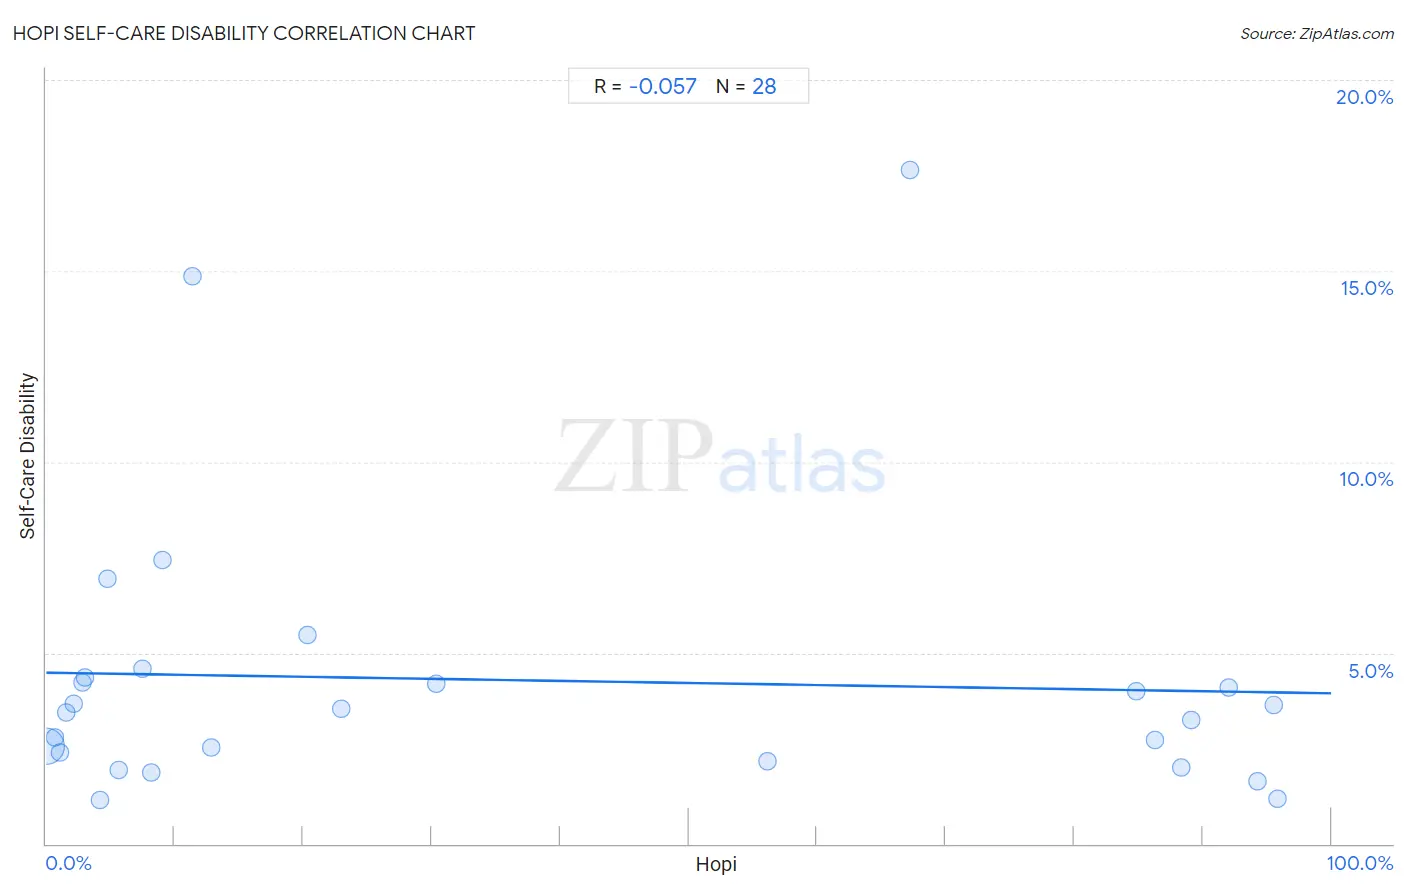
Hopi Self-Care Disability Correlation Chart
The statistical analysis conducted on geographies consisting of 74,708,657 people shows a slight negative correlation between the proportion of Hopi and percentage of population with self-care disability in the United States with a correlation coefficient (R) of -0.057 and weighted average of 2.9%. On average, for every 1% (one percent) increase in Hopi within a typical geography, there is a decrease of 0.0054% in percentage of population with self-care disability.
It is essential to understand that the correlation between the percentage of Hopi and percentage of population with self-care disability does not imply a direct cause-and-effect relationship. It remains uncertain whether the presence of Hopi influences an upward or downward trend in the level of percentage of population with self-care disability within an area, or if Hopi simply ended up residing in those areas with higher or lower levels of percentage of population with self-care disability due to other factors.
Demographics Similar to Hopi by Self-Care Disability
In terms of self-care disability, the demographic groups most similar to Hopi are Cajun (2.9%, a difference of 0.21%), Black/African American (2.9%, a difference of 0.39%), Paiute (2.9%, a difference of 0.45%), Nepalese (3.0%, a difference of 0.96%), and Lumbee (3.0%, a difference of 1.1%).
| Demographics | Rating | Rank | Self-Care Disability |
| Navajo | 0.0 /100 | #321 | Tragic 2.9% |
| Comanche | 0.0 /100 | #322 | Tragic 2.9% |
| Seminole | 0.0 /100 | #323 | Tragic 2.9% |
| Cherokee | 0.0 /100 | #324 | Tragic 2.9% |
| Immigrants from Uzbekistan | 0.0 /100 | #325 | Tragic 2.9% |
| Paiute | 0.0 /100 | #326 | Tragic 2.9% |
| Blacks/African Americans | 0.0 /100 | #327 | Tragic 2.9% |
| Hopi | 0.0 /100 | #328 | Tragic 2.9% |
| Cajuns | 0.0 /100 | #329 | Tragic 2.9% |
| Nepalese | 0.0 /100 | #330 | Tragic 3.0% |
| Lumbee | 0.0 /100 | #331 | Tragic 3.0% |
| Kiowa | 0.0 /100 | #332 | Tragic 3.0% |
| Dutch West Indians | 0.0 /100 | #333 | Tragic 3.0% |
| Houma | 0.0 /100 | #334 | Tragic 3.0% |
| Immigrants from the Azores | 0.0 /100 | #335 | Tragic 3.0% |
Hopi Self-Care Disability Correlation Summary
| Measurement | Hopi Data | Self-Care Disability Data |
| Minimum | 0.030% | 1.2% |
| Maximum | 95.9% | 17.6% |
| Range | 95.8% | 16.5% |
| Mean | 35.6% | 4.3% |
| Median | 12.1% | 3.5% |
| Interquartile 25% (IQ1) | 3.6% | 2.3% |
| Interquartile 75% (IQ3) | 85.5% | 4.3% |
| Interquartile Range (IQR) | 81.9% | 2.0% |
| Standard Deviation (Sample) | 38.8% | 3.7% |
| Standard Deviation (Population) | 38.1% | 3.7% |
Correlation Details
| Hopi Percentile | Sample Size | Self-Care Disability |
[ 0.0% - 0.5% ] 0.030% | 73,918,625 | 2.5% |
[ 0.5% - 1.0% ] 0.66% | 420,850 | 2.8% |
[ 1.0% - 1.5% ] 1.08% | 210,635 | 2.4% |
[ 1.5% - 2.0% ] 1.57% | 54,811 | 3.4% |
[ 2.0% - 2.5% ] 2.09% | 21,914 | 3.7% |
[ 2.5% - 3.0% ] 2.78% | 20,646 | 4.2% |
[ 3.0% - 3.5% ] 3.01% | 6,919 | 4.4% |
[ 4.0% - 4.5% ] 4.19% | 1,478 | 1.2% |
[ 4.5% - 5.0% ] 4.73% | 824 | 6.9% |
[ 5.5% - 6.0% ] 5.61% | 8,887 | 1.9% |
[ 7.0% - 7.5% ] 7.50% | 6,377 | 4.6% |
[ 8.0% - 8.5% ] 8.22% | 4,842 | 1.9% |
[ 9.0% - 9.5% ] 9.06% | 574 | 7.4% |
[ 11.0% - 11.5% ] 11.37% | 211 | 14.9% |
[ 12.5% - 13.0% ] 12.87% | 11,154 | 2.5% |
[ 20.0% - 20.5% ] 20.32% | 3,918 | 5.5% |
[ 22.5% - 23.0% ] 22.99% | 1,914 | 3.5% |
[ 30.0% - 30.5% ] 30.32% | 343 | 4.2% |
[ 56.0% - 56.5% ] 56.12% | 1,504 | 2.1% |
[ 67.0% - 67.5% ] 67.20% | 436 | 17.6% |
[ 84.5% - 85.0% ] 84.79% | 1,966 | 4.0% |
[ 86.0% - 86.5% ] 86.24% | 1,454 | 2.7% |
[ 88.0% - 88.5% ] 88.35% | 1,064 | 2.0% |
[ 89.0% - 89.5% ] 89.14% | 1,372 | 3.2% |
[ 91.5% - 92.0% ] 91.99% | 2,523 | 4.1% |
[ 94.0% - 94.5% ] 94.25% | 887 | 1.6% |
[ 95.5% - 96.0% ] 95.52% | 1,829 | 3.6% |
[ 95.5% - 96.0% ] 95.86% | 700 | 1.2% |