Hopi vs Guamanian/Chamorro 3 or more Vehicles in Household
COMPARE
Hopi
Guamanian/Chamorro
3 or more Vehicles in Household
3 or more Vehicles in Household Comparison
Hopi
Guamanians/Chamorros
18.2%
3 OR MORE VEHICLES IN HOUSEHOLD
2.5/ 100
METRIC RATING
242nd/ 347
METRIC RANK
23.2%
3 OR MORE VEHICLES IN HOUSEHOLD
100.0/ 100
METRIC RATING
27th/ 347
METRIC RANK
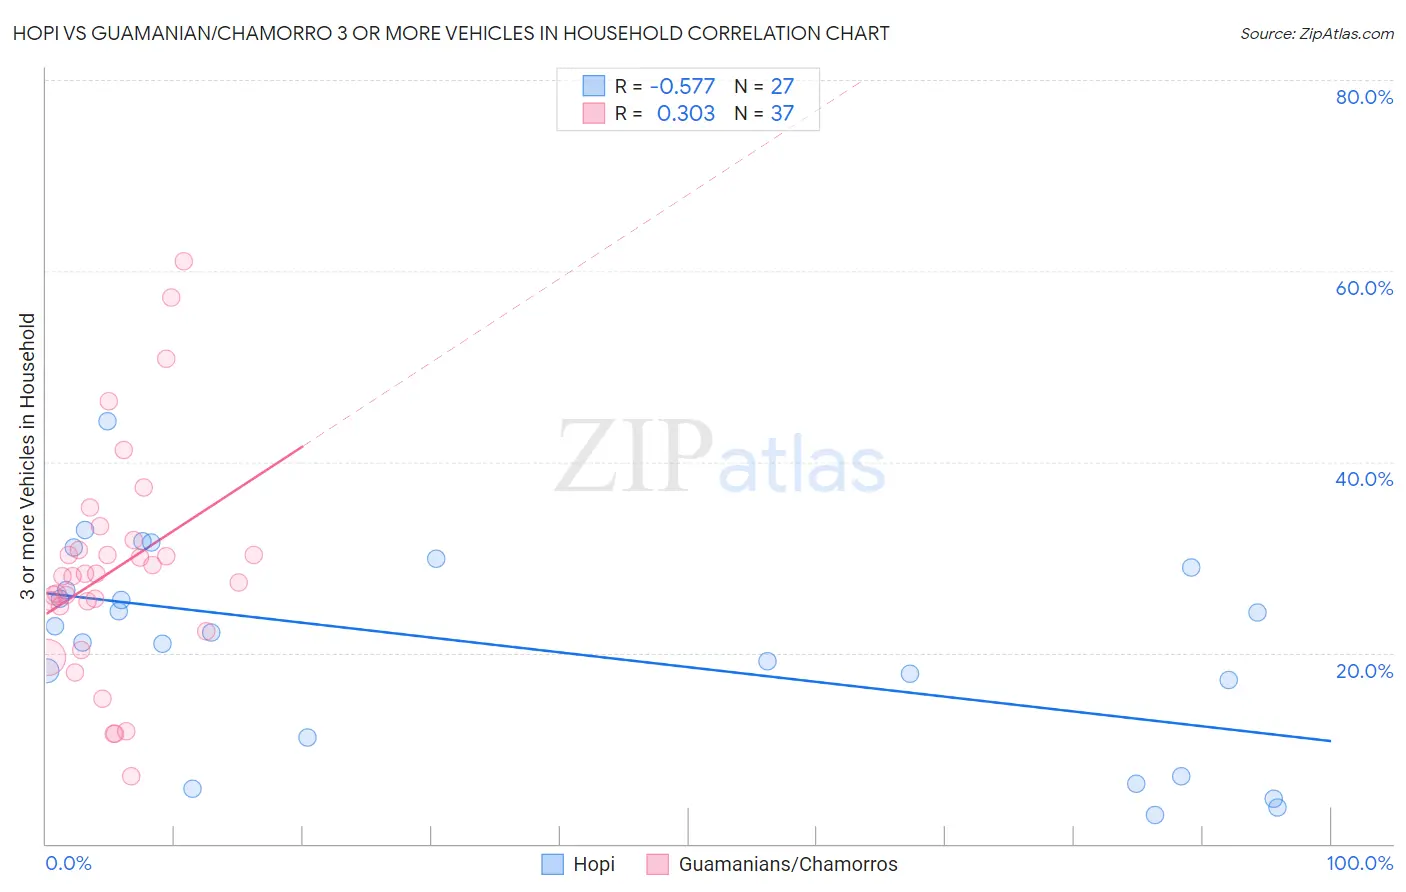
Hopi vs Guamanian/Chamorro 3 or more Vehicles in Household Correlation Chart
The statistical analysis conducted on geographies consisting of 74,728,795 people shows a substantial negative correlation between the proportion of Hopi and percentage of households with 3 or more vehicles available in the United States with a correlation coefficient (R) of -0.577 and weighted average of 18.2%. Similarly, the statistical analysis conducted on geographies consisting of 221,863,982 people shows a mild positive correlation between the proportion of Guamanians/Chamorros and percentage of households with 3 or more vehicles available in the United States with a correlation coefficient (R) of 0.303 and weighted average of 23.2%, a difference of 27.9%.
3 or more Vehicles in Household Correlation Summary
| Measurement | Hopi | Guamanian/Chamorro |
| Minimum | 3.0% | 7.1% |
| Maximum | 44.3% | 61.0% |
| Range | 41.2% | 53.9% |
| Mean | 20.6% | 28.7% |
| Median | 22.1% | 28.0% |
| Interquartile 25% (IQ1) | 11.1% | 23.6% |
| Interquartile 75% (IQ3) | 29.0% | 31.3% |
| Interquartile Range (IQR) | 17.9% | 7.8% |
| Standard Deviation (Sample) | 10.6% | 11.6% |
| Standard Deviation (Population) | 10.4% | 11.5% |
Similar Demographics by 3 or more Vehicles in Household
Demographics Similar to Hopi by 3 or more Vehicles in Household
In terms of 3 or more vehicles in household, the demographic groups most similar to Hopi are African (18.2%, a difference of 0.11%), Immigrants from Europe (18.1%, a difference of 0.12%), Mongolian (18.1%, a difference of 0.24%), Immigrants from China (18.2%, a difference of 0.31%), and Immigrants from Belize (18.1%, a difference of 0.39%).
| Demographics | Rating | Rank | 3 or more Vehicles in Household |
| Sierra Leoneans | 3.9 /100 | #235 | Tragic 18.3% |
| Immigrants | Malaysia | 3.6 /100 | #236 | Tragic 18.3% |
| Indonesians | 3.5 /100 | #237 | Tragic 18.3% |
| Immigrants | Honduras | 3.1 /100 | #238 | Tragic 18.2% |
| Immigrants | Middle Africa | 3.1 /100 | #239 | Tragic 18.2% |
| Immigrants | China | 2.9 /100 | #240 | Tragic 18.2% |
| Africans | 2.7 /100 | #241 | Tragic 18.2% |
| Hopi | 2.5 /100 | #242 | Tragic 18.2% |
| Immigrants | Europe | 2.4 /100 | #243 | Tragic 18.1% |
| Mongolians | 2.3 /100 | #244 | Tragic 18.1% |
| Immigrants | Belize | 2.1 /100 | #245 | Tragic 18.1% |
| Immigrants | Australia | 2.0 /100 | #246 | Tragic 18.1% |
| Carpatho Rusyns | 1.9 /100 | #247 | Tragic 18.0% |
| Immigrants | Eastern Africa | 1.8 /100 | #248 | Tragic 18.0% |
| Immigrants | Saudi Arabia | 1.7 /100 | #249 | Tragic 18.0% |
Demographics Similar to Guamanians/Chamorros by 3 or more Vehicles in Household
In terms of 3 or more vehicles in household, the demographic groups most similar to Guamanians/Chamorros are Mexican American Indian (23.3%, a difference of 0.13%), Lumbee (23.1%, a difference of 0.33%), Spanish (23.1%, a difference of 0.40%), Immigrants from South Eastern Asia (23.1%, a difference of 0.57%), and English (23.1%, a difference of 0.76%).
| Demographics | Rating | Rank | 3 or more Vehicles in Household |
| Paiute | 100.0 /100 | #20 | Exceptional 23.8% |
| Immigrants | Vietnam | 100.0 /100 | #21 | Exceptional 23.8% |
| Immigrants | Philippines | 100.0 /100 | #22 | Exceptional 23.8% |
| Scandinavians | 100.0 /100 | #23 | Exceptional 23.6% |
| Sri Lankans | 100.0 /100 | #24 | Exceptional 23.6% |
| Immigrants | Central America | 100.0 /100 | #25 | Exceptional 23.4% |
| Mexican American Indians | 100.0 /100 | #26 | Exceptional 23.3% |
| Guamanians/Chamorros | 100.0 /100 | #27 | Exceptional 23.2% |
| Lumbee | 100.0 /100 | #28 | Exceptional 23.1% |
| Spanish | 100.0 /100 | #29 | Exceptional 23.1% |
| Immigrants | South Eastern Asia | 100.0 /100 | #30 | Exceptional 23.1% |
| English | 100.0 /100 | #31 | Exceptional 23.1% |
| Pueblo | 100.0 /100 | #32 | Exceptional 23.0% |
| Spanish Americans | 100.0 /100 | #33 | Exceptional 23.0% |
| Swiss | 100.0 /100 | #34 | Exceptional 23.0% |