Canadian Disability Age Under 5
COMPARE
Canadian
Select to Compare
Disability Age Under 5
Canadian Disability Age Under 5
1.5%
DISABILITY | AGE UNDER 5
0.0/ 100
METRIC RATING
277th/ 347
METRIC RANK
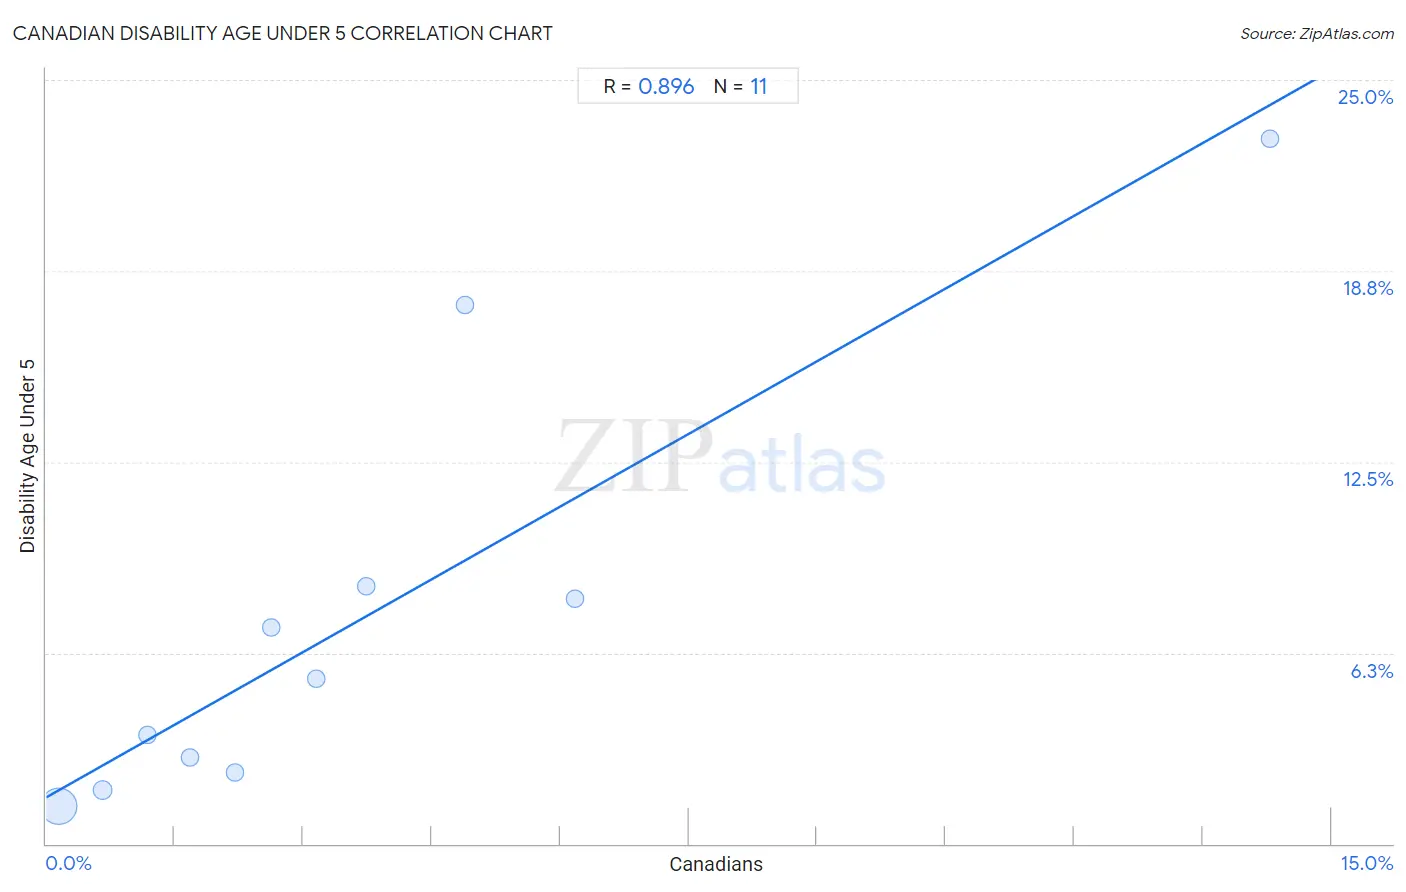
Canadian Disability Age Under 5 Correlation Chart
The statistical analysis conducted on geographies consisting of 226,239,251 people shows a very strong positive correlation between the proportion of Canadians and percentage of population with a disability under the age of 5 in the United States with a correlation coefficient (R) of 0.896 and weighted average of 1.5%. On average, for every 1% (one percent) increase in Canadians within a typical geography, there is an increase of 1.6% in percentage of population with a disability under the age of 5.
It is essential to understand that the correlation between the percentage of Canadians and percentage of population with a disability under the age of 5 does not imply a direct cause-and-effect relationship. It remains uncertain whether the presence of Canadians influences an upward or downward trend in the level of percentage of population with a disability under the age of 5 within an area, or if Canadians simply ended up residing in those areas with higher or lower levels of percentage of population with a disability under the age of 5 due to other factors.
Demographics Similar to Canadians by Disability Age Under 5
In terms of disability age under 5, the demographic groups most similar to Canadians are Kiowa (1.5%, a difference of 0.080%), Danish (1.5%, a difference of 0.090%), Greek (1.5%, a difference of 0.70%), British (1.5%, a difference of 0.85%), and Brazilian (1.5%, a difference of 1.3%).
| Demographics | Rating | Rank | Disability Age Under 5 |
| Immigrants from North America | 0.1 /100 | #270 | Tragic 1.4% |
| Immigrants from Canada | 0.1 /100 | #271 | Tragic 1.4% |
| Blacks/African Americans | 0.1 /100 | #272 | Tragic 1.4% |
| Alaskan Athabascans | 0.1 /100 | #273 | Tragic 1.5% |
| Iroquois | 0.0 /100 | #274 | Tragic 1.5% |
| Brazilians | 0.0 /100 | #275 | Tragic 1.5% |
| Greeks | 0.0 /100 | #276 | Tragic 1.5% |
| Canadians | 0.0 /100 | #277 | Tragic 1.5% |
| Kiowa | 0.0 /100 | #278 | Tragic 1.5% |
| Danes | 0.0 /100 | #279 | Tragic 1.5% |
| British | 0.0 /100 | #280 | Tragic 1.5% |
| Czechoslovakians | 0.0 /100 | #281 | Tragic 1.5% |
| Cheyenne | 0.0 /100 | #282 | Tragic 1.5% |
| Delaware | 0.0 /100 | #283 | Tragic 1.5% |
| Europeans | 0.0 /100 | #284 | Tragic 1.5% |
Canadian Disability Age Under 5 Correlation Summary
| Measurement | Canadian Data | Disability Age Under 5 Data |
| Minimum | 0.15% | 1.2% |
| Maximum | 14.3% | 23.1% |
| Range | 14.1% | 21.8% |
| Mean | 3.7% | 7.4% |
| Median | 2.6% | 5.4% |
| Interquartile 25% (IQ1) | 1.2% | 2.3% |
| Interquartile 75% (IQ3) | 4.9% | 8.4% |
| Interquartile Range (IQR) | 3.7% | 6.1% |
| Standard Deviation (Sample) | 3.9% | 7.0% |
| Standard Deviation (Population) | 3.8% | 6.7% |
Correlation Details
| Canadian Percentile | Sample Size | Disability Age Under 5 |
[ 0.0% - 0.5% ] 0.15% | 212,384,008 | 1.2% |
[ 0.5% - 1.0% ] 0.66% | 12,017,214 | 1.8% |
[ 1.0% - 1.5% ] 1.18% | 1,245,576 | 3.6% |
[ 1.5% - 2.0% ] 1.67% | 392,515 | 2.8% |
[ 2.0% - 2.5% ] 2.21% | 161,213 | 2.3% |
[ 2.5% - 3.0% ] 2.63% | 8,105 | 7.1% |
[ 3.0% - 3.5% ] 3.15% | 9,383 | 5.4% |
[ 3.5% - 4.0% ] 3.74% | 13,345 | 8.4% |
[ 4.5% - 5.0% ] 4.90% | 572 | 17.6% |
[ 6.0% - 6.5% ] 6.17% | 7,180 | 8.0% |
[ 14.0% - 14.5% ] 14.29% | 140 | 23.1% |