Canadian vs Immigrants from Caribbean 3 or more Vehicles in Household
COMPARE
Canadian
Immigrants from Caribbean
3 or more Vehicles in Household
3 or more Vehicles in Household Comparison
Canadians
Immigrants from Caribbean
21.0%
3 OR MORE VEHICLES IN HOUSEHOLD
98.3/ 100
METRIC RATING
97th/ 347
METRIC RANK
14.6%
3 OR MORE VEHICLES IN HOUSEHOLD
0.0/ 100
METRIC RATING
323rd/ 347
METRIC RANK
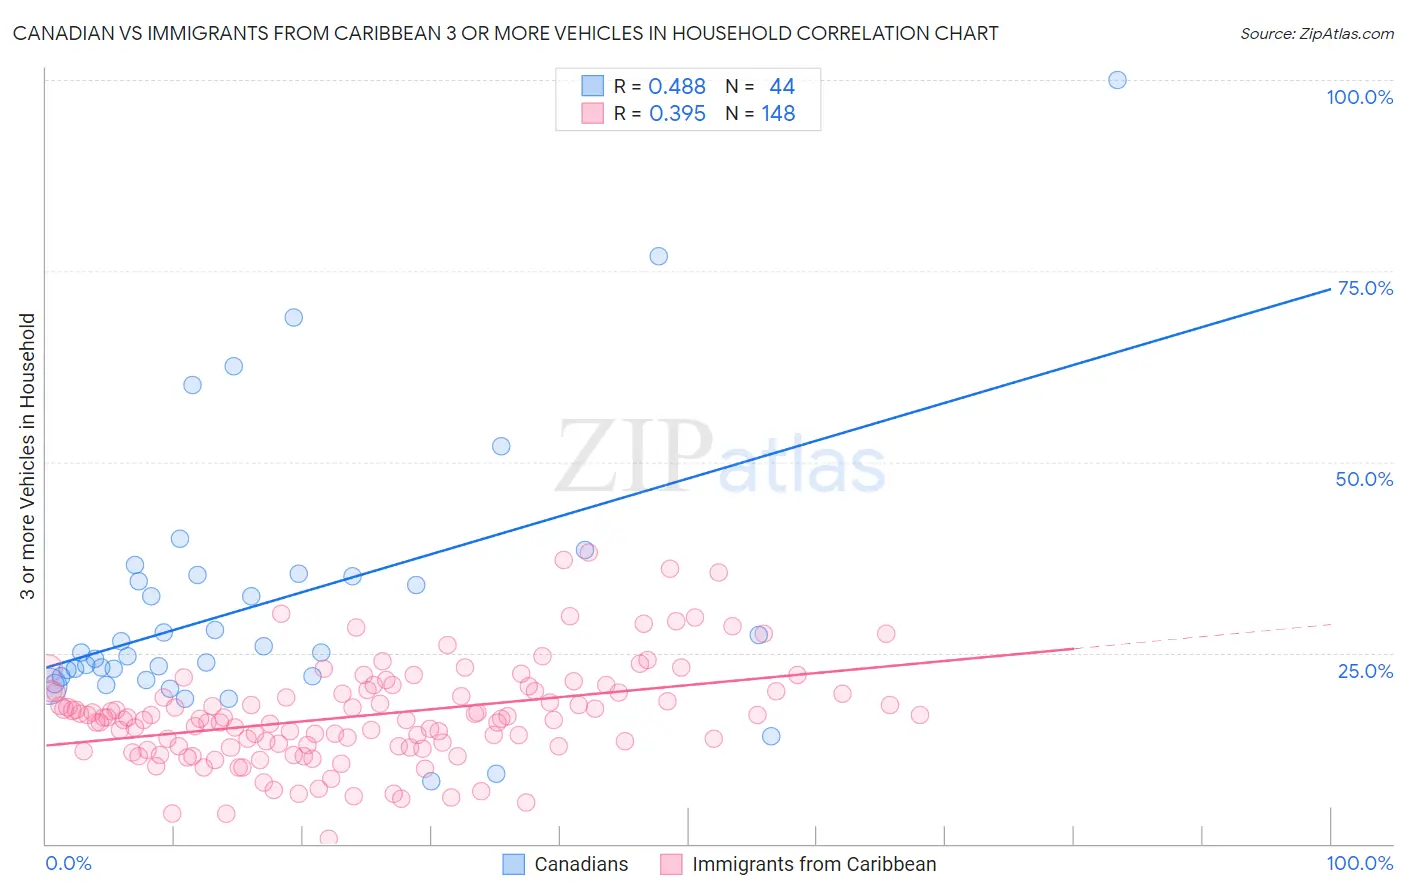
Canadian vs Immigrants from Caribbean 3 or more Vehicles in Household Correlation Chart
The statistical analysis conducted on geographies consisting of 437,139,388 people shows a moderate positive correlation between the proportion of Canadians and percentage of households with 3 or more vehicles available in the United States with a correlation coefficient (R) of 0.488 and weighted average of 21.0%. Similarly, the statistical analysis conducted on geographies consisting of 449,504,192 people shows a mild positive correlation between the proportion of Immigrants from Caribbean and percentage of households with 3 or more vehicles available in the United States with a correlation coefficient (R) of 0.395 and weighted average of 14.6%, a difference of 44.2%.
3 or more Vehicles in Household Correlation Summary
| Measurement | Canadian | Immigrants from Caribbean |
| Minimum | 8.2% | 0.62% |
| Maximum | 100.0% | 38.1% |
| Range | 91.8% | 37.5% |
| Mean | 31.5% | 16.8% |
| Median | 25.0% | 16.5% |
| Interquartile 25% (IQ1) | 21.9% | 12.8% |
| Interquartile 75% (IQ3) | 35.1% | 19.9% |
| Interquartile Range (IQR) | 13.2% | 7.1% |
| Standard Deviation (Sample) | 17.9% | 6.6% |
| Standard Deviation (Population) | 17.7% | 6.5% |
Similar Demographics by 3 or more Vehicles in Household
Demographics Similar to Canadians by 3 or more Vehicles in Household
In terms of 3 or more vehicles in household, the demographic groups most similar to Canadians are Hmong (21.0%, a difference of 0.060%), Alaska Native (21.0%, a difference of 0.060%), Comanche (21.0%, a difference of 0.10%), Cree (21.0%, a difference of 0.11%), and Pakistani (21.0%, a difference of 0.20%).
| Demographics | Rating | Rank | 3 or more Vehicles in Household |
| Immigrants | Afghanistan | 99.1 /100 | #90 | Exceptional 21.2% |
| Belgians | 98.9 /100 | #91 | Exceptional 21.2% |
| Apache | 98.9 /100 | #92 | Exceptional 21.2% |
| Immigrants | Indonesia | 98.8 /100 | #93 | Exceptional 21.1% |
| Immigrants | Cambodia | 98.6 /100 | #94 | Exceptional 21.1% |
| Pakistanis | 98.5 /100 | #95 | Exceptional 21.0% |
| Cree | 98.4 /100 | #96 | Exceptional 21.0% |
| Canadians | 98.3 /100 | #97 | Exceptional 21.0% |
| Hmong | 98.2 /100 | #98 | Exceptional 21.0% |
| Alaska Natives | 98.2 /100 | #99 | Exceptional 21.0% |
| Comanche | 98.2 /100 | #100 | Exceptional 21.0% |
| Blackfeet | 97.9 /100 | #101 | Exceptional 20.9% |
| Seminole | 97.8 /100 | #102 | Exceptional 20.9% |
| Dutch West Indians | 97.8 /100 | #103 | Exceptional 20.9% |
| Luxembourgers | 97.7 /100 | #104 | Exceptional 20.9% |
Demographics Similar to Immigrants from Caribbean by 3 or more Vehicles in Household
In terms of 3 or more vehicles in household, the demographic groups most similar to Immigrants from Caribbean are Immigrants from West Indies (14.6%, a difference of 0.44%), Immigrants from Jamaica (14.7%, a difference of 0.75%), Yup'ik (14.8%, a difference of 1.9%), Immigrants from Yemen (14.2%, a difference of 2.3%), and Senegalese (14.2%, a difference of 2.4%).
| Demographics | Rating | Rank | 3 or more Vehicles in Household |
| U.S. Virgin Islanders | 0.0 /100 | #316 | Tragic 15.4% |
| Jamaicans | 0.0 /100 | #317 | Tragic 15.2% |
| Immigrants | Haiti | 0.0 /100 | #318 | Tragic 15.2% |
| Cape Verdeans | 0.0 /100 | #319 | Tragic 15.0% |
| Yup'ik | 0.0 /100 | #320 | Tragic 14.8% |
| Immigrants | Jamaica | 0.0 /100 | #321 | Tragic 14.7% |
| Immigrants | West Indies | 0.0 /100 | #322 | Tragic 14.6% |
| Immigrants | Caribbean | 0.0 /100 | #323 | Tragic 14.6% |
| Immigrants | Yemen | 0.0 /100 | #324 | Tragic 14.2% |
| Senegalese | 0.0 /100 | #325 | Tragic 14.2% |
| Soviet Union | 0.0 /100 | #326 | Tragic 14.2% |
| Ecuadorians | 0.0 /100 | #327 | Tragic 14.1% |
| Immigrants | Albania | 0.0 /100 | #328 | Tragic 14.0% |
| Immigrants | Senegal | 0.0 /100 | #329 | Tragic 13.8% |
| West Indians | 0.0 /100 | #330 | Tragic 13.7% |