Canadian Disability Age 65 to 74

COMPARE

Canadian
Race
Ancestry
AfghanAfricanAlaska NativeAlaskan AthabascanAlbanianAleutAlsatianAmericanApacheArabArapahoArgentineanArmenianAssyrian/Chaldean/SyriacAustralianAustrianBahamianBangladeshiBarbadianBasqueBelgianBelizeanBermudanBhutaneseBlackfeetBolivianBrazilianBritishBritish West IndianBulgarianBurmeseCajunCambodianCanadianCape VerdeanCarpatho RusynCelticCentral AmericanCentral American IndianCherokeeCheyenneChickasawChileanChineseChippewaChoctawColombianColvilleComancheCosta RicanCreeCreekCroatianCrowCubanCypriotCzechCzechoslovakianDanishDelawareDominicanDutchDutch West IndianEastern EuropeanEcuadorianEgyptianEnglishEstonianEthiopianEuropeanFijianFilipinoFinnishFrenchFrench American IndianFrench CanadianGermanGerman RussianGhanaianGreekGuamanian/ChamorroGuatemalanGuyaneseHaitianHmongHonduranHopiHoumaHungarianIcelanderIndian (Asian)IndonesianInupiatIranianIraqiIrishIroquoisIsraeliItalianJamaicanJapaneseJordanianKenyanKiowaKoreanLaotianLatvianLebaneseLiberianLithuanianLumbeeLuxembourgerMacedonianMalaysianMalteseMarshalleseMenomineeMexicanMexican American IndianMongolianMoroccanNative HawaiianNavajoNepaleseNew ZealanderNicaraguanNigerianNorthern EuropeanNorwegianOkinawanOsageOttawaPaiutePakistaniPalestinianPanamanianParaguayanPennsylvania GermanPeruvianPimaPolishPortuguesePotawatomiPuebloPuerto RicanPuget Sound SalishRomanianRussianSalvadoranSamoanScandinavianScotch-IrishScottishSeminoleSenegaleseSerbianShoshoneSierra LeoneanSiouxSlavicSlovakSloveneSomaliSouth AfricanSouth AmericanSouth American IndianSoviet UnionSpaniardSpanishSpanish AmericanSpanish American IndianSri LankanSubsaharan AfricanSudaneseSwedishSwissSyrianTaiwaneseThaiTlingit-HaidaTohono O'OdhamTonganTrinidadian and TobagonianTsimshianTurkishU.S. Virgin IslanderUgandanUkrainianUruguayanUteVenezuelanVietnameseWelshWest IndianYakamaYaquiYugoslavianYumanYup'ikZimbabwean
Immigration
NonimmigrantsImmigrantsAfghanistanAfricaAlbaniaArgentinaArmeniaAsiaAustraliaAustriaBahamasBangladeshBarbadosBelarusBelgiumBelizeBoliviaBosnia and HerzegovinaBrazilBulgariaBurma/MyanmarCabo VerdeCambodiaCameroonCanadaCaribbeanCentral AmericaChileChinaColombiaCongoCosta RicaCroatiaCubaCzechoslovakiaDenmarkDominicaDominican RepublicEastern AfricaEastern AsiaEastern EuropeEcuadorEgyptEl SalvadorEnglandEritreaEthiopiaEuropeFijiFranceGermanyGhanaGreeceGrenadaGuatemalaGuyanaHaitiHondurasHong KongHungaryIndiaIndonesiaIranIraqIrelandIsraelItalyJamaicaJapanJordanKazakhstanKenyaKoreaKuwaitLaosLatin AmericaLatviaLebanonLiberiaLithuaniaMalaysiaMexicoMicronesiaMiddle AfricaMoldovaMoroccoNepalNetherlandsNicaraguaNigeriaNorth AmericaNorth MacedoniaNorthern AfricaNorthern EuropeNorwayOceaniaPakistanPanamaPeruPhilippinesPolandPortugalRomaniaRussiaSaudi ArabiaScotlandSenegalSerbiaSierra LeoneSingaporeSomaliaSouth AfricaSouth AmericaSouth Central AsiaSouth Eastern AsiaSouthern EuropeSpainSri LankaSt. Vincent and the GrenadinesSudanSwedenSwitzerlandSyriaTaiwanThailandTrinidad and TobagoTurkeyUgandaUkraineUruguayUzbekistanVenezuelaVietnamWest IndiesWestern AfricaWestern AsiaWestern EuropeYemenZaireZimbabweAzores
Select to Compare
Race
Ancestry
AfghanAfricanAlaska NativeAlaskan AthabascanAlbanianAleutAlsatianAmericanApacheArabArapahoArgentineanArmenianAssyrian/Chaldean/SyriacAustralianAustrianBahamianBangladeshiBarbadianBasqueBelgianBelizeanBermudanBhutaneseBlackfeetBolivianBrazilianBritishBritish West IndianBulgarianBurmeseCajunCambodianCape VerdeanCarpatho RusynCelticCentral AmericanCentral American IndianCherokeeCheyenneChickasawChileanChineseChippewaChoctawColombianColvilleComancheCosta RicanCreeCreekCroatianCrowCubanCypriotCzechCzechoslovakianDanishDelawareDominicanDutchDutch West IndianEastern EuropeanEcuadorianEgyptianEnglishEstonianEthiopianEuropeanFijianFilipinoFinnishFrenchFrench American IndianFrench CanadianGermanGerman RussianGhanaianGreekGuamanian/ChamorroGuatemalanGuyaneseHaitianHmongHonduranHopiHoumaHungarianIcelanderIndian (Asian)IndonesianInupiatIranianIraqiIrishIroquoisIsraeliItalianJamaicanJapaneseJordanianKenyanKiowaKoreanLaotianLatvianLebaneseLiberianLithuanianLumbeeLuxembourgerMacedonianMalaysianMalteseMarshalleseMenomineeMexicanMexican American IndianMongolianMoroccanNative HawaiianNavajoNepaleseNew ZealanderNicaraguanNigerianNorthern EuropeanNorwegianOkinawanOsageOttawaPaiutePakistaniPalestinianPanamanianParaguayanPennsylvania GermanPeruvianPimaPolishPortuguesePotawatomiPuebloPuerto RicanPuget Sound SalishRomanianRussianSalvadoranSamoanScandinavianScotch-IrishScottishSeminoleSenegaleseSerbianShoshoneSierra LeoneanSiouxSlavicSlovakSloveneSomaliSouth AfricanSouth AmericanSouth American IndianSoviet UnionSpaniardSpanishSpanish AmericanSpanish American IndianSri LankanSubsaharan AfricanSudaneseSwedishSwissSyrianTaiwaneseThaiTlingit-HaidaTohono O'OdhamTonganTrinidadian and TobagonianTsimshianTurkishU.S. Virgin IslanderUgandanUkrainianUruguayanUteVenezuelanVietnameseWelshWest IndianYakamaYaquiYugoslavianYumanYup'ikZimbabwean
Immigration
NonimmigrantsImmigrantsAfghanistanAfricaAlbaniaArgentinaArmeniaAsiaAustraliaAustriaBahamasBangladeshBarbadosBelarusBelgiumBelizeBoliviaBosnia and HerzegovinaBrazilBulgariaBurma/MyanmarCabo VerdeCambodiaCameroonCanadaCaribbeanCentral AmericaChileChinaColombiaCongoCosta RicaCroatiaCubaCzechoslovakiaDenmarkDominicaDominican RepublicEastern AfricaEastern AsiaEastern EuropeEcuadorEgyptEl SalvadorEnglandEritreaEthiopiaEuropeFijiFranceGermanyGhanaGreeceGrenadaGuatemalaGuyanaHaitiHondurasHong KongHungaryIndiaIndonesiaIranIraqIrelandIsraelItalyJamaicaJapanJordanKazakhstanKenyaKoreaKuwaitLaosLatin AmericaLatviaLebanonLiberiaLithuaniaMalaysiaMexicoMicronesiaMiddle AfricaMoldovaMoroccoNepalNetherlandsNicaraguaNigeriaNorth AmericaNorth MacedoniaNorthern AfricaNorthern EuropeNorwayOceaniaPakistanPanamaPeruPhilippinesPolandPortugalRomaniaRussiaSaudi ArabiaScotlandSenegalSerbiaSierra LeoneSingaporeSomaliaSouth AfricaSouth AmericaSouth Central AsiaSouth Eastern AsiaSouthern EuropeSpainSri LankaSt. Vincent and the GrenadinesSudanSwedenSwitzerlandSyriaTaiwanThailandTrinidad and TobagoTurkeyUgandaUkraineUruguayUzbekistanVenezuelaVietnamWest IndiesWestern AfricaWestern AsiaWestern EuropeYemenZaireZimbabweAzores
Disability Age 65 to 74
Income
Poverty
Unemployment
Labor Participation
Family Structure
Vehicle Availability
Education Level
Disability

Canadian Disability Age 65 to 74
Good

22.9%
DISABILITY | AGE 65 TO 74
77.7/ 100
METRIC RATING
150th/ 347
METRIC RANK

Canadian Disability Age 65 to 74 Correlation Chart

The statistical analysis conducted on geographies consisting of 436,683,818 people shows a strong positive correlation between the proportion of Canadians and percentage of population with a disability between the ages 65 and 75 in the United States with a correlation coefficient (R) of 0.702 and weighted average of 22.9%. On average, for every 1% (one percent) increase in Canadians within a typical geography, there is an increase of 1.3% in percentage of population with a disability between the ages 65 and 75.
Canadian Disability Age 65 to 74
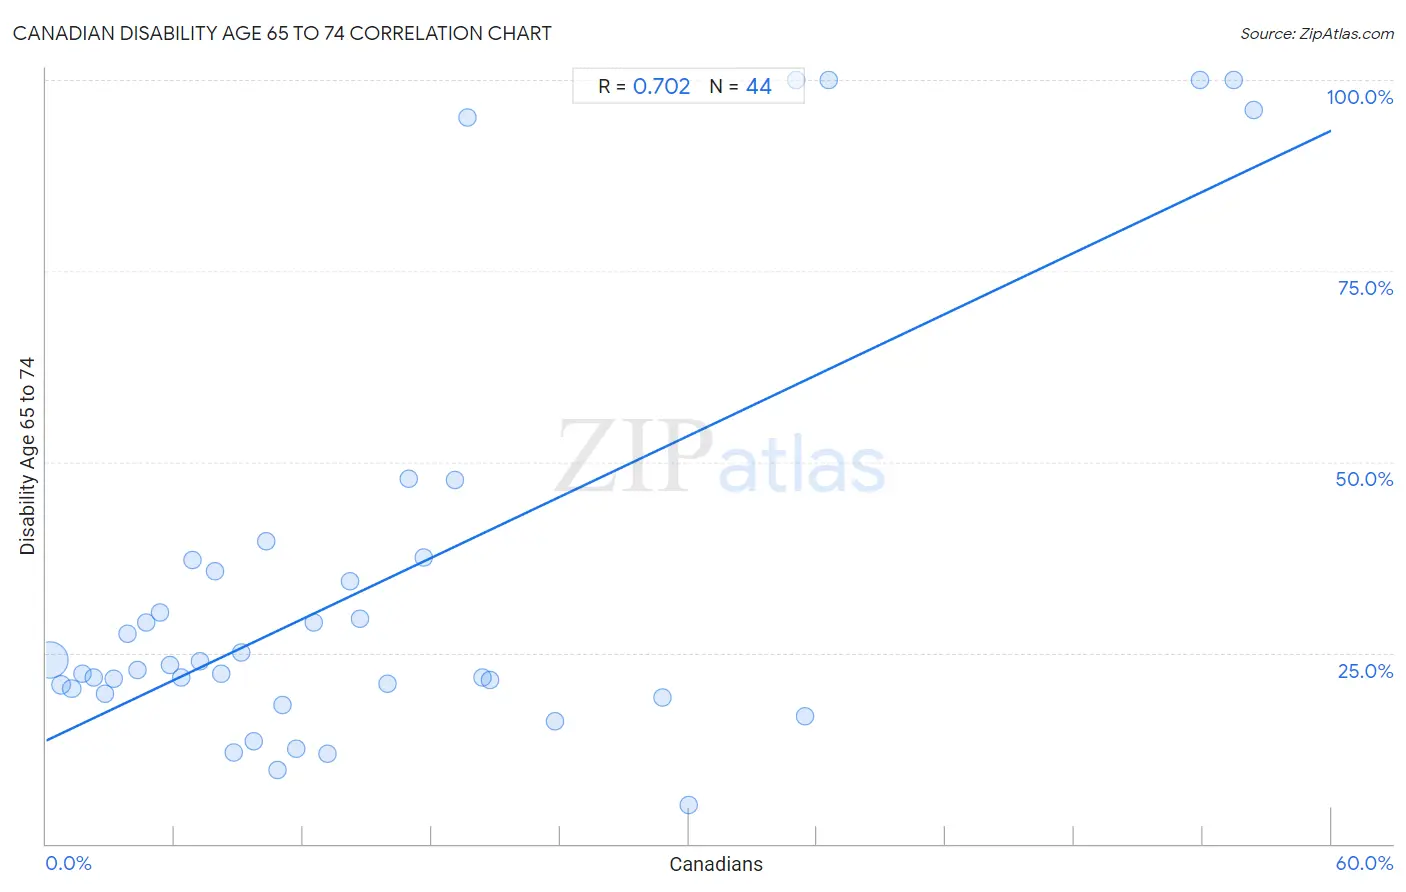
It is essential to understand that the correlation between the percentage of Canadians and percentage of population with a disability between the ages 65 and 75 does not imply a direct cause-and-effect relationship. It remains uncertain whether the presence of Canadians influences an upward or downward trend in the level of percentage of population with a disability between the ages 65 and 75 within an area, or if Canadians simply ended up residing in those areas with higher or lower levels of percentage of population with a disability between the ages 65 and 75 due to other factors.

Demographics Similar to Canadians by Disability Age 65 to 74

In terms of disability age 65 to 74, the demographic groups most similar to Canadians are Immigrants from Morocco (22.9%, a difference of 0.0%), Finnish (22.9%, a difference of 0.090%), Swiss (22.9%, a difference of 0.18%), New Zealander (22.9%, a difference of 0.20%), and Slavic (23.0%, a difference of 0.20%).
DemographicsRating | RankDisability Age 65 to 74
Arabs
84.8
/100
|
#143
Excellent
22.8%
Danes
84.4
/100
|
#144
Excellent
22.8%
Immigrants from Uganda
84.0
/100
|
#145
Excellent
22.8%
Alsatians
83.7
/100
|
#146
Excellent
22.8%
Immigrants from Uzbekistan
83.1
/100
|
#147
Excellent
22.8%
New Zealanders
79.9
/100
|
#148
Good
22.9%
Swiss
79.7
/100
|
#149
Good
22.9%
Canadians
77.7
/100
|
#150
Good
22.9%
Immigrants from Morocco
77.6
/100
|
#151
Good
22.9%
Finns
76.5
/100
|
#152
Good
22.9%
Slavs
75.2
/100
|
#153
Good
23.0%
Sri Lankans
74.0
/100
|
#154
Good
23.0%
British
73.9
/100
|
#155
Good
23.0%
Immigrants from Western Asia
73.8
/100
|
#156
Good
23.0%
Czechoslovakians
72.4
/100
|
#157
Good
23.0%

Canadian Disability Age 65 to 74 Correlation Summary

MeasurementCanadian DataDisability Age 65 to 74 Data
Minimum0.16%5.0%
Maximum56.4%100.0%
Range56.2%95.0%
Mean15.5%34.2%
Median10.9%23.0%
Interquartile 25% (IQ1)5.5%20.0%
Interquartile 75% (IQ3)20.0%36.4%
Interquartile Range (IQR)14.5%16.5%
Standard Deviation (Sample)14.5%27.4%
Standard Deviation (Population)14.3%27.1%

Correlation Details

Canadian PercentileSample SizeDisability Age 65 to 74
[
0.0%
-
0.5%
]
0.16%
393,044,52624.0%
[
0.5%
-
1.0%
]
0.67%
34,497,50820.8%
[
1.0%
-
1.5%
]
1.19%
5,631,64520.3%
[
1.5%
-
2.0%
]
1.68%
1,985,66622.2%
[
2.0%
-
2.5%
]
2.24%
711,04421.7%
[
2.5%
-
3.0%
]
2.76%
269,95519.6%
[
3.0%
-
3.5%
]
3.16%
174,58621.6%
[
3.5%
-
4.0%
]
3.79%
131,02327.6%
[
4.0%
-
4.5%
]
4.27%
49,74022.7%
[
4.5%
-
5.0%
]
4.68%
59,20328.9%
[
5.0%
-
5.5%
]
5.29%
13,23830.3%
[
5.5%
-
6.0%
]
5.78%
18,92323.3%
[
6.0%
-
6.5%
]
6.33%
41,16021.7%
[
6.5%
-
7.0%
]
6.85%
5,18537.1%
[
7.0%
-
7.5%
]
7.19%
12,12123.9%
[
7.5%
-
8.0%
]
7.87%
1,58835.8%
[
8.0%
-
8.5%
]
8.19%
4,38122.2%
[
8.5%
-
9.0%
]
8.73%
11,34611.9%
[
9.0%
-
9.5%
]
9.12%
3,01525.1%
[
9.5%
-
10.0%
]
9.67%
4,30013.4%
[
10.0%
-
10.5%
]
10.26%
1,18939.5%
[
10.5%
-
11.0%
]
10.81%
2,0089.7%
[
11.0%
-
11.5%
]
11.02%
61718.1%
[
11.5%
-
12.0%
]
11.66%
2,73512.4%
[
12.0%
-
12.5%
]
12.48%
1,61029.0%
[
13.0%
-
13.5%
]
13.13%
9911.8%
[
14.0%
-
14.5%
]
14.18%
1,35434.4%
[
14.5%
-
15.0%
]
14.63%
8229.4%
[
15.5%
-
16.0%
]
15.91%
2,03720.9%
[
16.5%
-
17.0%
]
16.90%
7147.8%
[
17.5%
-
18.0%
]
17.65%
1737.5%
[
19.0%
-
19.5%
]
19.08%
17347.6%
[
19.5%
-
20.0%
]
19.67%
23995.1%
[
20.0%
-
20.5%
]
20.37%
10821.7%
[
20.5%
-
21.0%
]
20.73%
8221.4%
[
23.5%
-
24.0%
]
23.75%
32016.0%
[
28.5%
-
29.0%
]
28.77%
28519.2%
[
30.0%
-
30.5%
]
30.00%
2005.0%
[
35.0%
-
35.5%
]
35.00%
20100.0%
[
35.0%
-
35.5%
]
35.42%
9616.7%
[
36.5%
-
37.0%
]
36.51%
63100.0%
[
53.5%
-
54.0%
]
53.85%
26100.0%
[
55.0%
-
55.5%
]
55.45%
101100.0%
[
56.0%
-
56.5%
]
56.39%
13396.2%