Canadian 1 or more Vehicles in Household
COMPARE
Canadian
Select to Compare
1 or more Vehicles in Household
Canadian 1 or more Vehicles in Household
91.8%
1+ VEHICLES AVAILABLE
99.8/ 100
METRIC RATING
66th/ 347
METRIC RANK
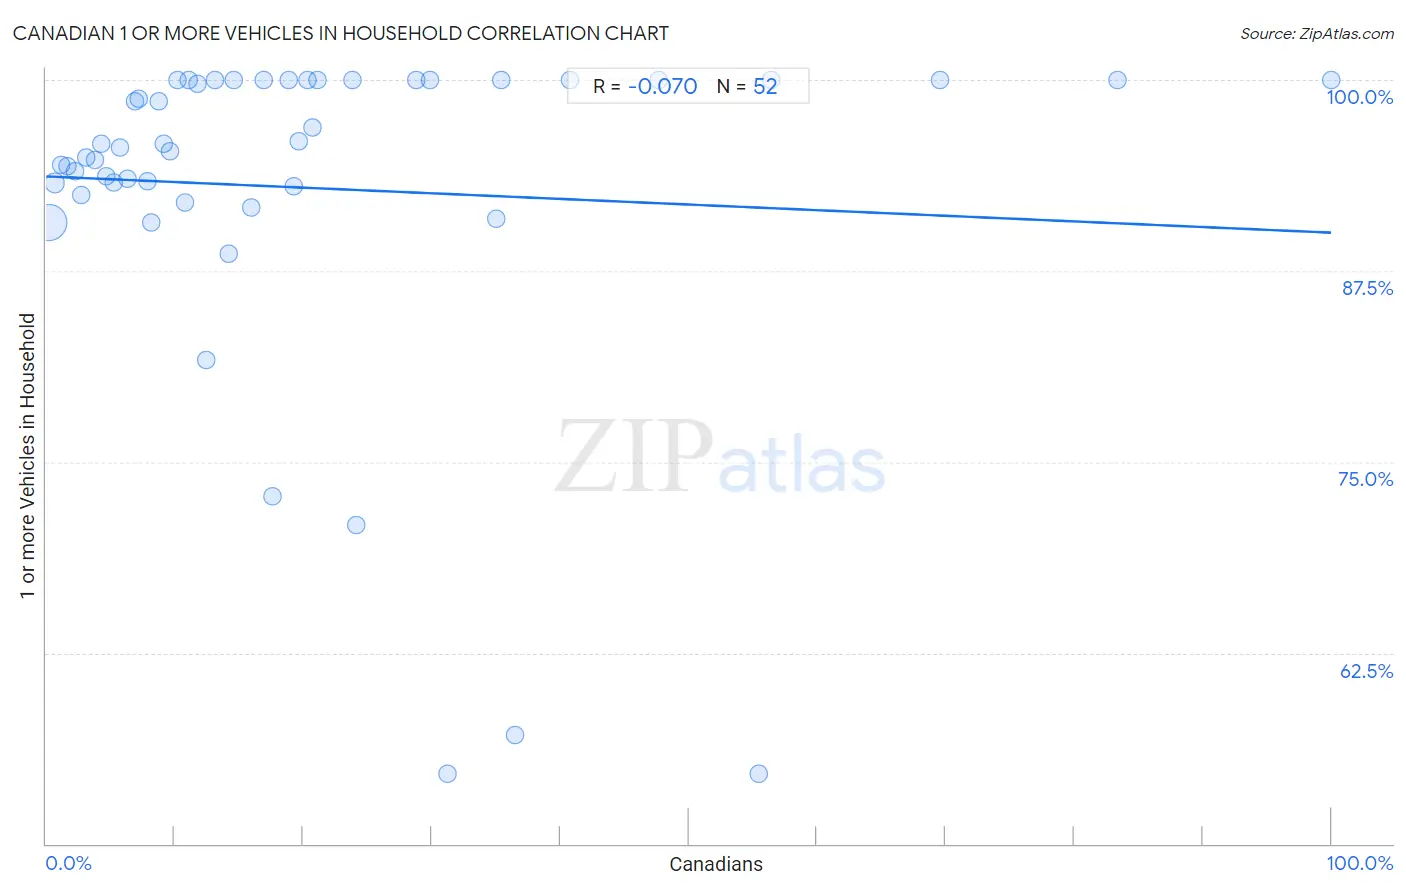
Canadian 1 or more Vehicles in Household Correlation Chart
The statistical analysis conducted on geographies consisting of 437,336,131 people shows a slight negative correlation between the proportion of Canadians and percentage of households with 1 or more vehicles available in the United States with a correlation coefficient (R) of -0.070 and weighted average of 91.8%. On average, for every 1% (one percent) increase in Canadians within a typical geography, there is a decrease of 0.037% in percentage of households with 1 or more vehicles available.
It is essential to understand that the correlation between the percentage of Canadians and percentage of households with 1 or more vehicles available does not imply a direct cause-and-effect relationship. It remains uncertain whether the presence of Canadians influences an upward or downward trend in the level of percentage of households with 1 or more vehicles available within an area, or if Canadians simply ended up residing in those areas with higher or lower levels of percentage of households with 1 or more vehicles available due to other factors.
Demographics Similar to Canadians by 1 or more Vehicles in Household
In terms of 1 or more vehicles in household, the demographic groups most similar to Canadians are Immigrants from Laos (91.8%, a difference of 0.020%), Spaniard (91.8%, a difference of 0.020%), Chinese (91.9%, a difference of 0.050%), Croatian (91.9%, a difference of 0.050%), and Immigrants from Scotland (91.8%, a difference of 0.060%).
| Demographics | Rating | Rank | 1 or more Vehicles in Household |
| Venezuelans | 99.8 /100 | #59 | Exceptional 91.9% |
| Slovaks | 99.8 /100 | #60 | Exceptional 91.9% |
| Immigrants from India | 99.8 /100 | #61 | Exceptional 91.9% |
| Thais | 99.8 /100 | #62 | Exceptional 91.9% |
| Chinese | 99.8 /100 | #63 | Exceptional 91.9% |
| Croatians | 99.8 /100 | #64 | Exceptional 91.9% |
| Immigrants from Laos | 99.8 /100 | #65 | Exceptional 91.8% |
| Canadians | 99.8 /100 | #66 | Exceptional 91.8% |
| Spaniards | 99.8 /100 | #67 | Exceptional 91.8% |
| Immigrants from Scotland | 99.7 /100 | #68 | Exceptional 91.8% |
| Palestinians | 99.7 /100 | #69 | Exceptional 91.7% |
| Lithuanians | 99.7 /100 | #70 | Exceptional 91.7% |
| Poles | 99.7 /100 | #71 | Exceptional 91.7% |
| Cajuns | 99.7 /100 | #72 | Exceptional 91.7% |
| Immigrants from Iran | 99.7 /100 | #73 | Exceptional 91.7% |
Canadian 1 or more Vehicles in Household Correlation Summary
| Measurement | Canadian Data | 1 or more Vehicles in Household Data |
| Minimum | 0.16% | 54.5% |
| Maximum | 100.0% | 100.0% |
| Range | 99.8% | 45.5% |
| Mean | 20.5% | 92.9% |
| Median | 13.7% | 95.7% |
| Interquartile 25% (IQ1) | 6.6% | 92.8% |
| Interquartile 75% (IQ3) | 26.5% | 100.0% |
| Interquartile Range (IQR) | 19.8% | 7.2% |
| Standard Deviation (Sample) | 21.2% | 11.2% |
| Standard Deviation (Population) | 21.0% | 11.1% |
Correlation Details
| Canadian Percentile | Sample Size | 1 or more Vehicles in Household |
[ 0.0% - 0.5% ] 0.16% | 393,500,453 | 90.7% |
[ 0.5% - 1.0% ] 0.67% | 34,565,554 | 93.3% |
[ 1.0% - 1.5% ] 1.19% | 5,668,364 | 94.4% |
[ 1.5% - 2.0% ] 1.68% | 2,007,657 | 94.3% |
[ 2.0% - 2.5% ] 2.24% | 728,044 | 94.0% |
[ 2.5% - 3.0% ] 2.76% | 277,477 | 92.5% |
[ 3.0% - 3.5% ] 3.16% | 178,364 | 94.9% |
[ 3.5% - 4.0% ] 3.79% | 144,728 | 94.7% |
[ 4.0% - 4.5% ] 4.29% | 61,371 | 95.8% |
[ 4.5% - 5.0% ] 4.68% | 61,187 | 93.7% |
[ 5.0% - 5.5% ] 5.28% | 13,892 | 93.3% |
[ 5.5% - 6.0% ] 5.78% | 20,813 | 95.6% |
[ 6.0% - 6.5% ] 6.33% | 41,354 | 93.5% |
[ 6.5% - 7.0% ] 6.89% | 8,794 | 98.6% |
[ 7.0% - 7.5% ] 7.19% | 12,121 | 98.8% |
[ 7.5% - 8.0% ] 7.87% | 2,642 | 93.3% |
[ 8.0% - 8.5% ] 8.20% | 4,575 | 90.7% |
[ 8.5% - 9.0% ] 8.72% | 12,765 | 98.6% |
[ 9.0% - 9.5% ] 9.11% | 3,478 | 95.8% |
[ 9.5% - 10.0% ] 9.67% | 5,168 | 95.3% |
[ 10.0% - 10.5% ] 10.26% | 1,189 | 100.0% |
[ 10.5% - 11.0% ] 10.81% | 2,211 | 92.0% |
[ 11.0% - 11.5% ] 11.06% | 859 | 100.0% |
[ 11.5% - 12.0% ] 11.73% | 3,589 | 99.8% |
[ 12.0% - 12.5% ] 12.46% | 2,560 | 81.6% |
[ 13.0% - 13.5% ] 13.13% | 99 | 100.0% |
[ 14.0% - 14.5% ] 14.22% | 1,702 | 88.6% |
[ 14.5% - 15.0% ] 14.63% | 82 | 100.0% |
[ 15.5% - 16.0% ] 15.91% | 2,037 | 91.7% |
[ 16.5% - 17.0% ] 16.90% | 71 | 100.0% |
[ 17.5% - 18.0% ] 17.65% | 17 | 72.7% |
[ 18.5% - 19.0% ] 18.89% | 180 | 100.0% |
[ 19.0% - 19.5% ] 19.24% | 447 | 93.1% |
[ 19.5% - 20.0% ] 19.67% | 239 | 96.0% |
[ 20.0% - 20.5% ] 20.37% | 108 | 100.0% |
[ 20.5% - 21.0% ] 20.73% | 82 | 96.9% |
[ 21.0% - 21.5% ] 21.15% | 104 | 100.0% |
[ 23.5% - 24.0% ] 23.79% | 391 | 100.0% |
[ 24.0% - 24.5% ] 24.14% | 29 | 70.8% |
[ 28.5% - 29.0% ] 28.77% | 285 | 100.0% |
[ 29.5% - 30.0% ] 29.84% | 315 | 100.0% |
[ 31.0% - 31.5% ] 31.25% | 16 | 54.5% |
[ 35.0% - 35.5% ] 35.00% | 20 | 90.9% |
[ 35.0% - 35.5% ] 35.42% | 96 | 100.0% |
[ 36.5% - 37.0% ] 36.51% | 63 | 57.1% |
[ 40.5% - 41.0% ] 40.74% | 54 | 100.0% |
[ 47.5% - 48.0% ] 47.62% | 105 | 100.0% |
[ 55.0% - 55.5% ] 55.45% | 101 | 54.5% |
[ 56.0% - 56.5% ] 56.39% | 133 | 100.0% |
[ 69.5% - 70.0% ] 69.57% | 23 | 100.0% |
[ 83.0% - 83.5% ] 83.33% | 120 | 100.0% |
[ 99.5% - 100.0% ] 100.00% | 3 | 100.0% |