Canadian vs Dominican 3 or more Vehicles in Household
COMPARE
Canadian
Dominican
3 or more Vehicles in Household
3 or more Vehicles in Household Comparison
Canadians
Dominicans
21.0%
3 OR MORE VEHICLES IN HOUSEHOLD
98.3/ 100
METRIC RATING
97th/ 347
METRIC RANK
11.2%
3 OR MORE VEHICLES IN HOUSEHOLD
0.0/ 100
METRIC RATING
344th/ 347
METRIC RANK
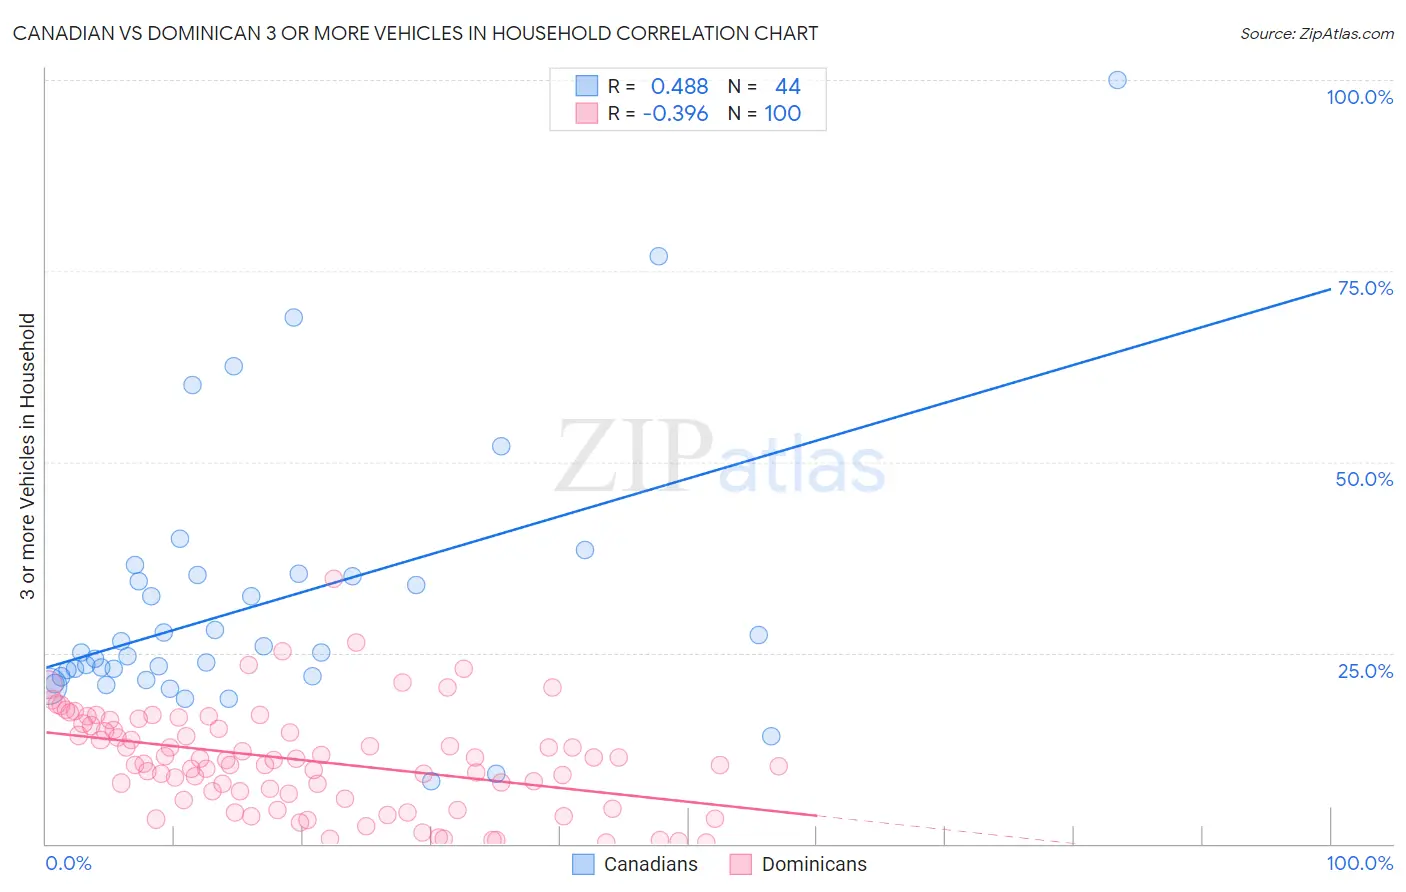
Canadian vs Dominican 3 or more Vehicles in Household Correlation Chart
The statistical analysis conducted on geographies consisting of 437,139,388 people shows a moderate positive correlation between the proportion of Canadians and percentage of households with 3 or more vehicles available in the United States with a correlation coefficient (R) of 0.488 and weighted average of 21.0%. Similarly, the statistical analysis conducted on geographies consisting of 354,643,903 people shows a mild negative correlation between the proportion of Dominicans and percentage of households with 3 or more vehicles available in the United States with a correlation coefficient (R) of -0.396 and weighted average of 11.2%, a difference of 87.1%.
3 or more Vehicles in Household Correlation Summary
| Measurement | Canadian | Dominican |
| Minimum | 8.2% | 0.12% |
| Maximum | 100.0% | 34.8% |
| Range | 91.8% | 34.6% |
| Mean | 31.5% | 10.9% |
| Median | 25.0% | 10.7% |
| Interquartile 25% (IQ1) | 21.9% | 6.2% |
| Interquartile 75% (IQ3) | 35.1% | 15.3% |
| Interquartile Range (IQR) | 13.2% | 9.1% |
| Standard Deviation (Sample) | 17.9% | 6.7% |
| Standard Deviation (Population) | 17.7% | 6.6% |
Similar Demographics by 3 or more Vehicles in Household
Demographics Similar to Canadians by 3 or more Vehicles in Household
In terms of 3 or more vehicles in household, the demographic groups most similar to Canadians are Hmong (21.0%, a difference of 0.060%), Alaska Native (21.0%, a difference of 0.060%), Comanche (21.0%, a difference of 0.10%), Cree (21.0%, a difference of 0.11%), and Pakistani (21.0%, a difference of 0.20%).
| Demographics | Rating | Rank | 3 or more Vehicles in Household |
| Immigrants | Afghanistan | 99.1 /100 | #90 | Exceptional 21.2% |
| Belgians | 98.9 /100 | #91 | Exceptional 21.2% |
| Apache | 98.9 /100 | #92 | Exceptional 21.2% |
| Immigrants | Indonesia | 98.8 /100 | #93 | Exceptional 21.1% |
| Immigrants | Cambodia | 98.6 /100 | #94 | Exceptional 21.1% |
| Pakistanis | 98.5 /100 | #95 | Exceptional 21.0% |
| Cree | 98.4 /100 | #96 | Exceptional 21.0% |
| Canadians | 98.3 /100 | #97 | Exceptional 21.0% |
| Hmong | 98.2 /100 | #98 | Exceptional 21.0% |
| Alaska Natives | 98.2 /100 | #99 | Exceptional 21.0% |
| Comanche | 98.2 /100 | #100 | Exceptional 21.0% |
| Blackfeet | 97.9 /100 | #101 | Exceptional 20.9% |
| Seminole | 97.8 /100 | #102 | Exceptional 20.9% |
| Dutch West Indians | 97.8 /100 | #103 | Exceptional 20.9% |
| Luxembourgers | 97.7 /100 | #104 | Exceptional 20.9% |
Demographics Similar to Dominicans by 3 or more Vehicles in Household
In terms of 3 or more vehicles in household, the demographic groups most similar to Dominicans are Immigrants from Guyana (11.2%, a difference of 0.15%), British West Indian (11.4%, a difference of 2.0%), Guyanese (11.5%, a difference of 2.0%), Immigrants from Barbados (11.7%, a difference of 4.4%), and Immigrants from Uzbekistan (12.0%, a difference of 6.8%).
| Demographics | Rating | Rank | 3 or more Vehicles in Household |
| Immigrants | Cabo Verde | 0.0 /100 | #333 | Tragic 13.6% |
| Immigrants | Ecuador | 0.0 /100 | #334 | Tragic 13.4% |
| Immigrants | Trinidad and Tobago | 0.0 /100 | #335 | Tragic 13.3% |
| Barbadians | 0.0 /100 | #336 | Tragic 12.6% |
| Immigrants | Bangladesh | 0.0 /100 | #337 | Tragic 12.5% |
| Vietnamese | 0.0 /100 | #338 | Tragic 12.5% |
| Immigrants | Uzbekistan | 0.0 /100 | #339 | Tragic 12.0% |
| Immigrants | Barbados | 0.0 /100 | #340 | Tragic 11.7% |
| Guyanese | 0.0 /100 | #341 | Tragic 11.5% |
| British West Indians | 0.0 /100 | #342 | Tragic 11.4% |
| Immigrants | Guyana | 0.0 /100 | #343 | Tragic 11.2% |
| Dominicans | 0.0 /100 | #344 | Tragic 11.2% |
| Immigrants | Dominican Republic | 0.0 /100 | #345 | Tragic 10.4% |
| Immigrants | St. Vincent and the Grenadines | 0.0 /100 | #346 | Tragic 10.1% |
| Immigrants | Grenada | 0.0 /100 | #347 | Tragic 9.1% |