Canadian vs Kiowa 3 or more Vehicles in Household
COMPARE
Canadian
Kiowa
3 or more Vehicles in Household
3 or more Vehicles in Household Comparison
Canadians
Kiowa
21.0%
3 OR MORE VEHICLES IN HOUSEHOLD
98.3/ 100
METRIC RATING
97th/ 347
METRIC RANK
19.5%
3 OR MORE VEHICLES IN HOUSEHOLD
50.9/ 100
METRIC RATING
172nd/ 347
METRIC RANK
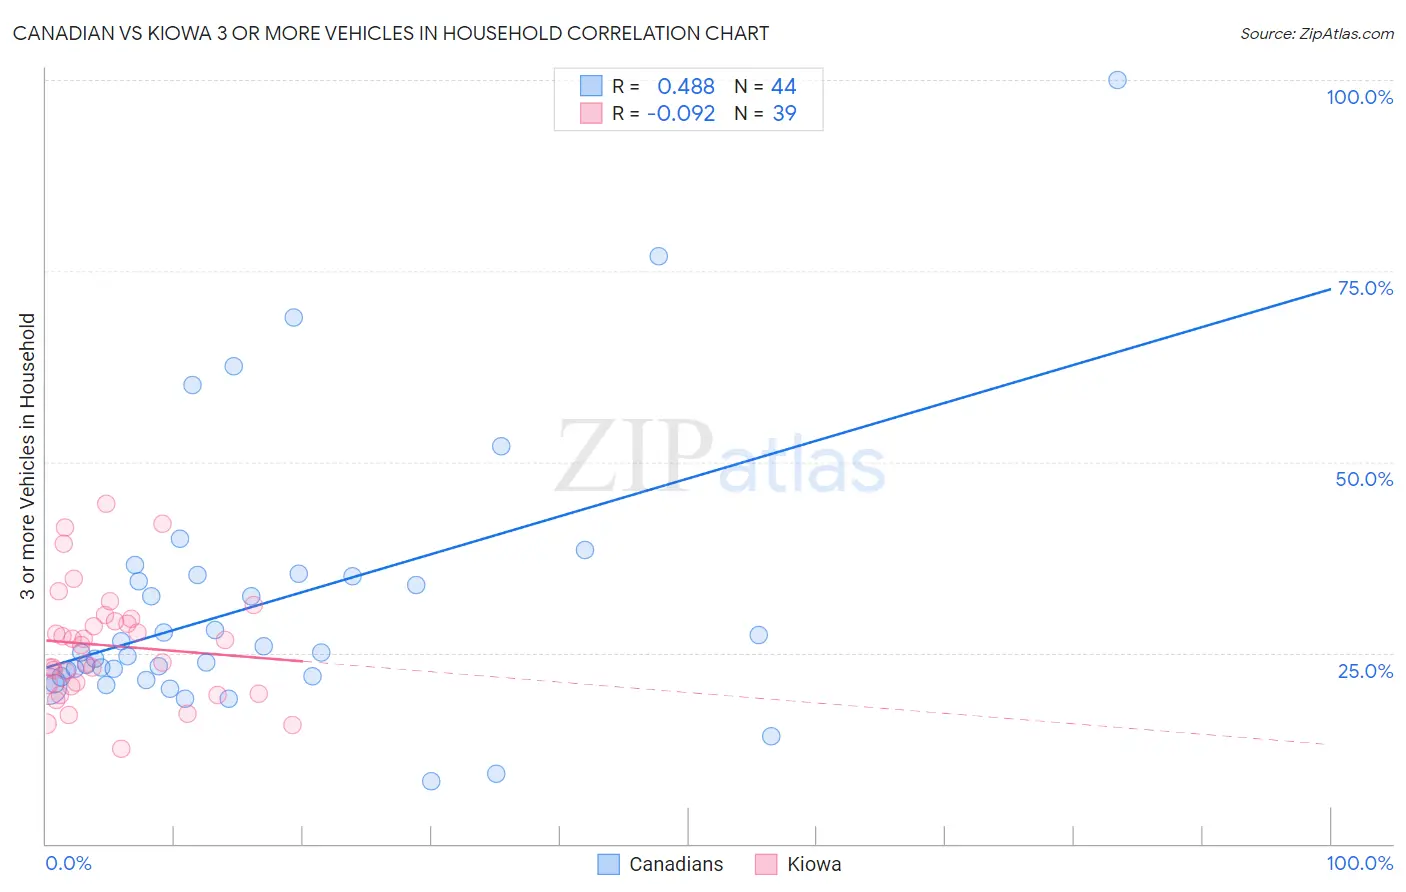
Canadian vs Kiowa 3 or more Vehicles in Household Correlation Chart
The statistical analysis conducted on geographies consisting of 437,139,388 people shows a moderate positive correlation between the proportion of Canadians and percentage of households with 3 or more vehicles available in the United States with a correlation coefficient (R) of 0.488 and weighted average of 21.0%. Similarly, the statistical analysis conducted on geographies consisting of 56,098,357 people shows a slight negative correlation between the proportion of Kiowa and percentage of households with 3 or more vehicles available in the United States with a correlation coefficient (R) of -0.092 and weighted average of 19.5%, a difference of 7.6%.
3 or more Vehicles in Household Correlation Summary
| Measurement | Canadian | Kiowa |
| Minimum | 8.2% | 12.5% |
| Maximum | 100.0% | 44.5% |
| Range | 91.8% | 32.0% |
| Mean | 31.5% | 25.9% |
| Median | 25.0% | 26.0% |
| Interquartile 25% (IQ1) | 21.9% | 20.6% |
| Interquartile 75% (IQ3) | 35.1% | 29.5% |
| Interquartile Range (IQR) | 13.2% | 8.9% |
| Standard Deviation (Sample) | 17.9% | 7.5% |
| Standard Deviation (Population) | 17.7% | 7.4% |
Similar Demographics by 3 or more Vehicles in Household
Demographics Similar to Canadians by 3 or more Vehicles in Household
In terms of 3 or more vehicles in household, the demographic groups most similar to Canadians are Hmong (21.0%, a difference of 0.060%), Alaska Native (21.0%, a difference of 0.060%), Comanche (21.0%, a difference of 0.10%), Cree (21.0%, a difference of 0.11%), and Pakistani (21.0%, a difference of 0.20%).
| Demographics | Rating | Rank | 3 or more Vehicles in Household |
| Immigrants | Afghanistan | 99.1 /100 | #90 | Exceptional 21.2% |
| Belgians | 98.9 /100 | #91 | Exceptional 21.2% |
| Apache | 98.9 /100 | #92 | Exceptional 21.2% |
| Immigrants | Indonesia | 98.8 /100 | #93 | Exceptional 21.1% |
| Immigrants | Cambodia | 98.6 /100 | #94 | Exceptional 21.1% |
| Pakistanis | 98.5 /100 | #95 | Exceptional 21.0% |
| Cree | 98.4 /100 | #96 | Exceptional 21.0% |
| Canadians | 98.3 /100 | #97 | Exceptional 21.0% |
| Hmong | 98.2 /100 | #98 | Exceptional 21.0% |
| Alaska Natives | 98.2 /100 | #99 | Exceptional 21.0% |
| Comanche | 98.2 /100 | #100 | Exceptional 21.0% |
| Blackfeet | 97.9 /100 | #101 | Exceptional 20.9% |
| Seminole | 97.8 /100 | #102 | Exceptional 20.9% |
| Dutch West Indians | 97.8 /100 | #103 | Exceptional 20.9% |
| Luxembourgers | 97.7 /100 | #104 | Exceptional 20.9% |
Demographics Similar to Kiowa by 3 or more Vehicles in Household
In terms of 3 or more vehicles in household, the demographic groups most similar to Kiowa are Immigrants from Northern Europe (19.5%, a difference of 0.050%), Immigrants from South Africa (19.5%, a difference of 0.070%), Immigrants from Western Europe (19.5%, a difference of 0.18%), Syrian (19.5%, a difference of 0.30%), and Iroquois (19.4%, a difference of 0.37%).
| Demographics | Rating | Rank | 3 or more Vehicles in Household |
| Immigrants | Costa Rica | 61.9 /100 | #165 | Good 19.7% |
| Immigrants | Cameroon | 60.9 /100 | #166 | Good 19.7% |
| Ukrainians | 58.9 /100 | #167 | Average 19.6% |
| Peruvians | 58.8 /100 | #168 | Average 19.6% |
| Immigrants | Denmark | 57.6 /100 | #169 | Average 19.6% |
| Iraqis | 56.0 /100 | #170 | Average 19.6% |
| Immigrants | Western Europe | 53.2 /100 | #171 | Average 19.5% |
| Kiowa | 50.9 /100 | #172 | Average 19.5% |
| Immigrants | Northern Europe | 50.2 /100 | #173 | Average 19.5% |
| Immigrants | South Africa | 50.0 /100 | #174 | Average 19.5% |
| Syrians | 47.0 /100 | #175 | Average 19.5% |
| Iroquois | 46.0 /100 | #176 | Average 19.4% |
| Immigrants | Peru | 41.1 /100 | #177 | Average 19.4% |
| Immigrants | Syria | 40.3 /100 | #178 | Average 19.4% |
| Immigrants | South Central Asia | 38.9 /100 | #179 | Fair 19.3% |