Canadian College, Under 1 year
COMPARE
Canadian
Select to Compare
College, Under 1 year
Canadian College, Under 1 year
66.8%
COLLEGE, UNDER 1 YEAR
87.9/ 100
METRIC RATING
135th/ 347
METRIC RANK
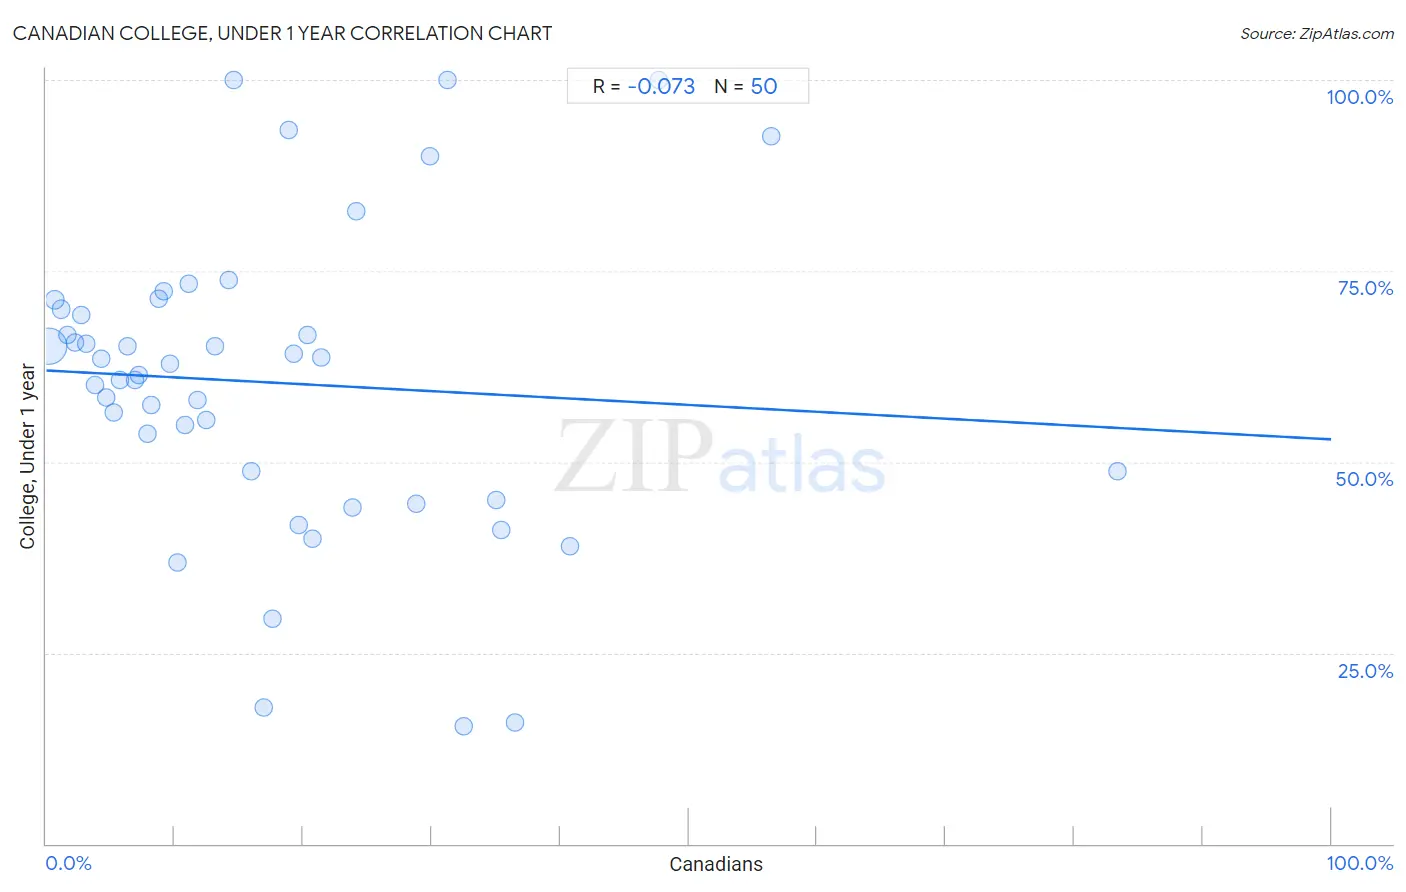
Canadian College, Under 1 year Correlation Chart
The statistical analysis conducted on geographies consisting of 437,553,139 people shows a slight negative correlation between the proportion of Canadians and percentage of population with at least college, under 1 year education in the United States with a correlation coefficient (R) of -0.073 and weighted average of 66.8%. On average, for every 1% (one percent) increase in Canadians within a typical geography, there is a decrease of 0.090% in percentage of population with at least college, under 1 year education.
It is essential to understand that the correlation between the percentage of Canadians and percentage of population with at least college, under 1 year education does not imply a direct cause-and-effect relationship. It remains uncertain whether the presence of Canadians influences an upward or downward trend in the level of percentage of population with at least college, under 1 year education within an area, or if Canadians simply ended up residing in those areas with higher or lower levels of percentage of population with at least college, under 1 year education due to other factors.
Demographics Similar to Canadians by College, Under 1 year
In terms of college, under 1 year, the demographic groups most similar to Canadians are Iraqi (66.8%, a difference of 0.010%), Ugandan (66.8%, a difference of 0.010%), Immigrants from Brazil (66.9%, a difference of 0.040%), Immigrants from Chile (66.8%, a difference of 0.050%), and Polish (66.9%, a difference of 0.060%).
| Demographics | Rating | Rank | College, Under 1 year |
| Scottish | 90.2 /100 | #128 | Exceptional 67.0% |
| Immigrants from Eastern Africa | 89.5 /100 | #129 | Excellent 67.0% |
| Immigrants from Syria | 89.0 /100 | #130 | Excellent 66.9% |
| Finns | 88.6 /100 | #131 | Excellent 66.9% |
| Poles | 88.4 /100 | #132 | Excellent 66.9% |
| Immigrants from Brazil | 88.3 /100 | #133 | Excellent 66.9% |
| Iraqis | 88.0 /100 | #134 | Excellent 66.8% |
| Canadians | 87.9 /100 | #135 | Excellent 66.8% |
| Ugandans | 87.8 /100 | #136 | Excellent 66.8% |
| Immigrants from Chile | 87.4 /100 | #137 | Excellent 66.8% |
| Immigrants from Italy | 86.9 /100 | #138 | Excellent 66.8% |
| Venezuelans | 85.9 /100 | #139 | Excellent 66.7% |
| Slavs | 85.9 /100 | #140 | Excellent 66.7% |
| Immigrants from Afghanistan | 85.1 /100 | #141 | Excellent 66.7% |
| English | 82.9 /100 | #142 | Excellent 66.6% |
Canadian College, Under 1 year Correlation Summary
| Measurement | Canadian Data | College, Under 1 year Data |
| Minimum | 0.16% | 15.4% |
| Maximum | 83.3% | 100.0% |
| Range | 83.2% | 84.6% |
| Mean | 17.5% | 60.4% |
| Median | 12.8% | 62.1% |
| Interquartile 25% (IQ1) | 6.3% | 48.8% |
| Interquartile 75% (IQ3) | 23.8% | 70.0% |
| Interquartile Range (IQR) | 17.5% | 21.2% |
| Standard Deviation (Sample) | 16.1% | 19.9% |
| Standard Deviation (Population) | 15.9% | 19.7% |
Correlation Details
| Canadian Percentile | Sample Size | College, Under 1 year |
[ 0.0% - 0.5% ] 0.16% | 393,662,886 | 65.1% |
[ 0.5% - 1.0% ] 0.67% | 34,606,079 | 71.2% |
[ 1.0% - 1.5% ] 1.19% | 5,677,977 | 70.0% |
[ 1.5% - 2.0% ] 1.68% | 2,008,787 | 66.6% |
[ 2.0% - 2.5% ] 2.24% | 731,337 | 65.7% |
[ 2.5% - 3.0% ] 2.76% | 277,477 | 69.2% |
[ 3.0% - 3.5% ] 3.16% | 178,428 | 65.4% |
[ 3.5% - 4.0% ] 3.79% | 144,728 | 60.0% |
[ 4.0% - 4.5% ] 4.29% | 61,880 | 63.5% |
[ 4.5% - 5.0% ] 4.68% | 61,187 | 58.5% |
[ 5.0% - 5.5% ] 5.28% | 13,892 | 56.5% |
[ 5.5% - 6.0% ] 5.78% | 21,180 | 60.7% |
[ 6.0% - 6.5% ] 6.33% | 41,354 | 65.1% |
[ 6.5% - 7.0% ] 6.89% | 8,794 | 60.8% |
[ 7.0% - 7.5% ] 7.19% | 12,121 | 61.5% |
[ 7.5% - 8.0% ] 7.87% | 2,642 | 53.7% |
[ 8.0% - 8.5% ] 8.18% | 3,812 | 57.4% |
[ 8.5% - 9.0% ] 8.72% | 12,765 | 71.3% |
[ 9.0% - 9.5% ] 9.11% | 3,478 | 72.4% |
[ 9.5% - 10.0% ] 9.67% | 5,168 | 62.8% |
[ 10.0% - 10.5% ] 10.26% | 1,189 | 36.9% |
[ 10.5% - 11.0% ] 10.81% | 2,211 | 54.8% |
[ 11.0% - 11.5% ] 11.06% | 859 | 73.3% |
[ 11.5% - 12.0% ] 11.73% | 3,589 | 58.1% |
[ 12.0% - 12.5% ] 12.46% | 2,560 | 55.5% |
[ 13.0% - 13.5% ] 13.13% | 99 | 65.1% |
[ 14.0% - 14.5% ] 14.22% | 1,702 | 73.8% |
[ 14.5% - 15.0% ] 14.63% | 82 | 100.0% |
[ 15.5% - 16.0% ] 15.91% | 2,037 | 48.8% |
[ 16.5% - 17.0% ] 16.90% | 71 | 17.8% |
[ 17.5% - 18.0% ] 17.65% | 17 | 29.4% |
[ 18.5% - 19.0% ] 18.89% | 180 | 93.4% |
[ 19.0% - 19.5% ] 19.24% | 447 | 64.2% |
[ 19.5% - 20.0% ] 19.67% | 239 | 41.8% |
[ 20.0% - 20.5% ] 20.37% | 108 | 66.7% |
[ 20.5% - 21.0% ] 20.73% | 82 | 40.0% |
[ 21.0% - 21.5% ] 21.43% | 28 | 63.6% |
[ 23.5% - 24.0% ] 23.79% | 391 | 44.0% |
[ 24.0% - 24.5% ] 24.14% | 29 | 82.8% |
[ 28.5% - 29.0% ] 28.77% | 285 | 44.6% |
[ 29.5% - 30.0% ] 29.84% | 315 | 90.0% |
[ 31.0% - 31.5% ] 31.25% | 16 | 100.0% |
[ 32.0% - 32.5% ] 32.50% | 40 | 15.4% |
[ 35.0% - 35.5% ] 35.00% | 20 | 45.0% |
[ 35.0% - 35.5% ] 35.42% | 96 | 41.0% |
[ 36.5% - 37.0% ] 36.51% | 63 | 15.9% |
[ 40.5% - 41.0% ] 40.74% | 54 | 38.9% |
[ 47.5% - 48.0% ] 47.62% | 105 | 100.0% |
[ 56.0% - 56.5% ] 56.39% | 133 | 92.6% |
[ 83.0% - 83.5% ] 83.33% | 120 | 48.8% |