Rushville, NE Map & Demographics
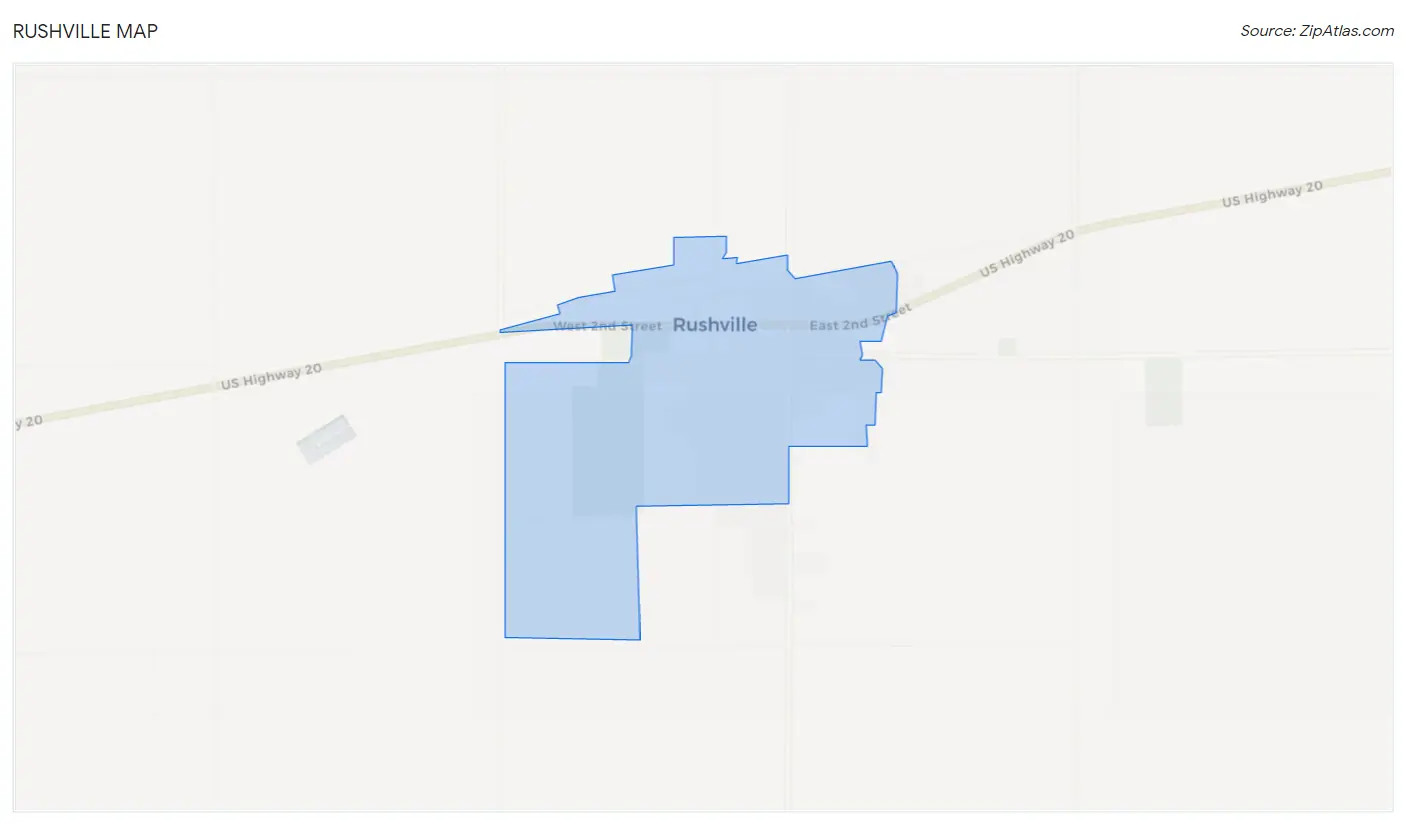
Rushville Map
Rushville Overview
$25,007
PER CAPITA INCOME
$62,600
AVG FAMILY INCOME
$47,180
AVG HOUSEHOLD INCOME
30.4%
WAGE / INCOME GAP [ % ]
69.6¢/ $1
WAGE / INCOME GAP [ $ ]
0.38
INEQUALITY / GINI INDEX
1,011
TOTAL POPULATION
477
MALE POPULATION
534
FEMALE POPULATION
89.33
MALES / 100 FEMALES
111.95
FEMALES / 100 MALES
42.6
MEDIAN AGE
3.3
AVG FAMILY SIZE
2.4
AVG HOUSEHOLD SIZE
434
LABOR FORCE [ PEOPLE ]
53.0%
PERCENT IN LABOR FORCE
6.2%
UNEMPLOYMENT RATE
Rushville Zip Codes
Rushville Area Codes
Income in Rushville
Income Overview in Rushville
Per Capita Income in Rushville is $25,007, while median incomes of families and households are $62,600 and $47,180 respectively.
| Characteristic | Number | Measure |
| Per Capita Income | 1,011 | $25,007 |
| Median Family Income | 234 | $62,600 |
| Mean Family Income | 234 | $74,670 |
| Median Household Income | 409 | $47,180 |
| Mean Household Income | 409 | $59,357 |
| Income Deficit | 234 | $0 |
| Wage / Income Gap (%) | 1,011 | 30.41% |
| Wage / Income Gap ($) | 1,011 | 69.59¢ per $1 |
| Gini / Inequality Index | 1,011 | 0.38 |
Earnings by Sex in Rushville
Average Earnings in Rushville are $23,144, $24,830 for men and $17,279 for women, a difference of 30.4%.
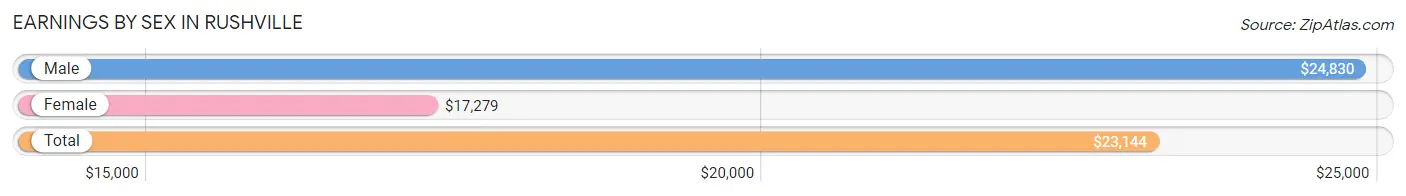
| Sex | Number | Average Earnings |
| Male | 235 (49.3%) | $24,830 |
| Female | 242 (50.7%) | $17,279 |
| Total | 477 (100.0%) | $23,144 |
Earnings by Sex by Income Bracket in Rushville
The most common earnings brackets in Rushville are $7,500 to $9,999 for men (23 | 9.8%) and $2,499 or less for women (42 | 17.4%).
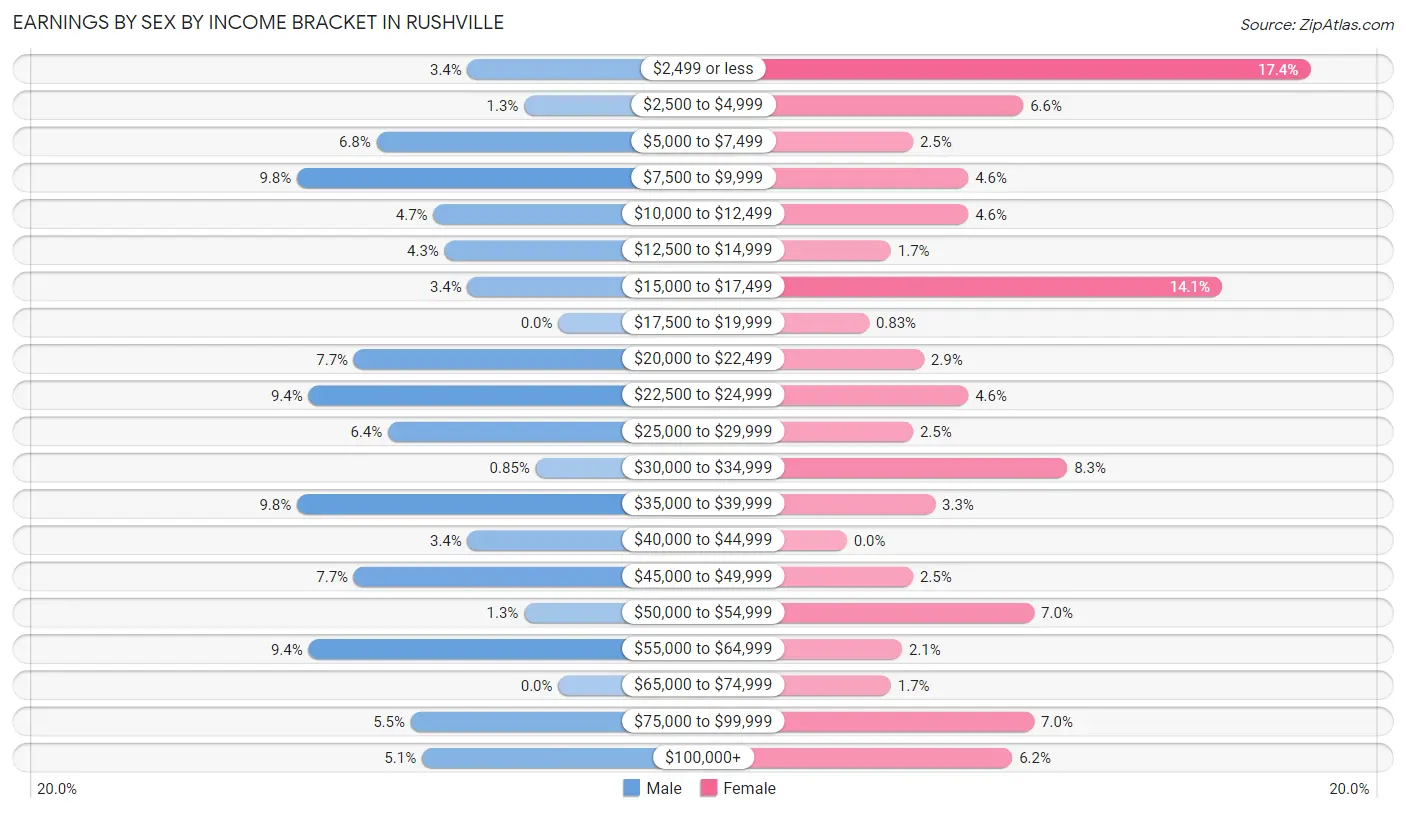
| Income | Male | Female |
| $2,499 or less | 8 (3.4%) | 42 (17.4%) |
| $2,500 to $4,999 | 3 (1.3%) | 16 (6.6%) |
| $5,000 to $7,499 | 16 (6.8%) | 6 (2.5%) |
| $7,500 to $9,999 | 23 (9.8%) | 11 (4.5%) |
| $10,000 to $12,499 | 11 (4.7%) | 11 (4.5%) |
| $12,500 to $14,999 | 10 (4.3%) | 4 (1.7%) |
| $15,000 to $17,499 | 8 (3.4%) | 34 (14.1%) |
| $17,500 to $19,999 | 0 (0.0%) | 2 (0.8%) |
| $20,000 to $22,499 | 18 (7.7%) | 7 (2.9%) |
| $22,500 to $24,999 | 22 (9.4%) | 11 (4.5%) |
| $25,000 to $29,999 | 15 (6.4%) | 6 (2.5%) |
| $30,000 to $34,999 | 2 (0.9%) | 20 (8.3%) |
| $35,000 to $39,999 | 23 (9.8%) | 8 (3.3%) |
| $40,000 to $44,999 | 8 (3.4%) | 0 (0.0%) |
| $45,000 to $49,999 | 18 (7.7%) | 6 (2.5%) |
| $50,000 to $54,999 | 3 (1.3%) | 17 (7.0%) |
| $55,000 to $64,999 | 22 (9.4%) | 5 (2.1%) |
| $65,000 to $74,999 | 0 (0.0%) | 4 (1.7%) |
| $75,000 to $99,999 | 13 (5.5%) | 17 (7.0%) |
| $100,000+ | 12 (5.1%) | 15 (6.2%) |
| Total | 235 (100.0%) | 242 (100.0%) |
Earnings by Sex by Educational Attainment in Rushville
Average earnings in Rushville are $29,750 for men and $24,773 for women, a difference of 16.7%. Men with an educational attainment of college or associate's degree enjoy the highest average annual earnings of $43,750, while those with less than high school education earn the least with $21,354. Women with an educational attainment of bachelor's degree earn the most with the average annual earnings of $34,028, while those with bachelor's degree education have the smallest earnings of $34,028.
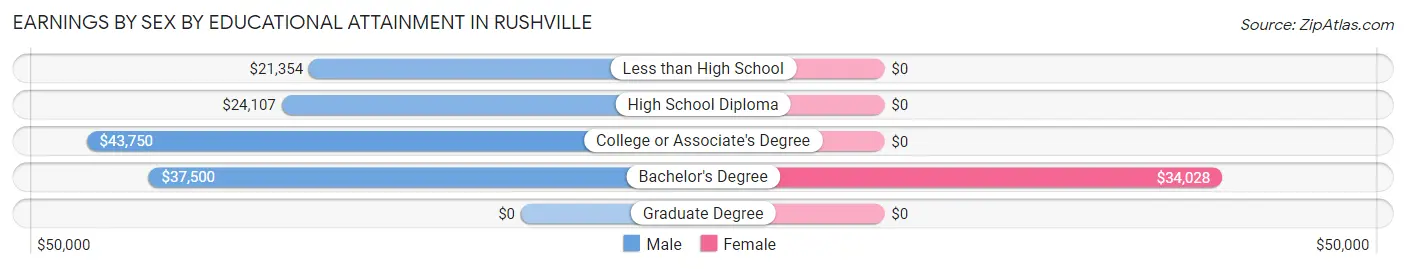
| Educational Attainment | Male Income | Female Income |
| Less than High School | $21,354 | $0 |
| High School Diploma | $24,107 | $0 |
| College or Associate's Degree | $43,750 | $0 |
| Bachelor's Degree | $37,500 | $34,028 |
| Graduate Degree | - | - |
| Total | $29,750 | $24,773 |
Family Income in Rushville
Family Income Brackets in Rushville
According to the Rushville family income data, there are 49 families falling into the $50,000 to $74,999 income range, which is the most common income bracket and makes up 20.9% of all families. Conversely, the less than $10,000 income bracket is the least frequent group with only 2 families (0.9%) belonging to this category.
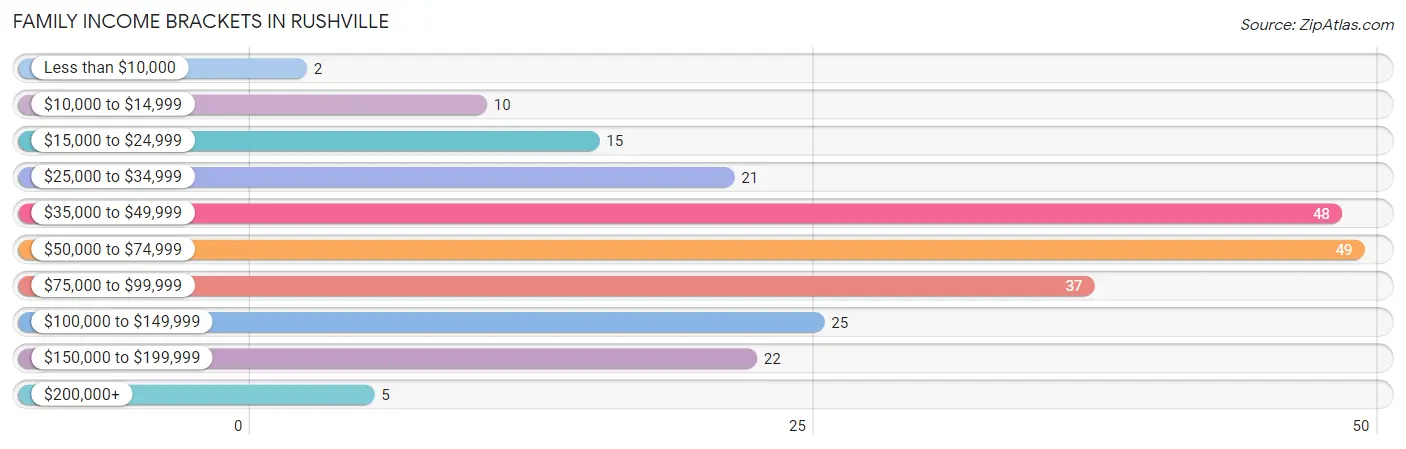
| Income Bracket | # Families | % Families |
| Less than $10,000 | 2 | 0.9% |
| $10,000 to $14,999 | 10 | 4.3% |
| $15,000 to $24,999 | 15 | 6.4% |
| $25,000 to $34,999 | 21 | 9.0% |
| $35,000 to $49,999 | 48 | 20.5% |
| $50,000 to $74,999 | 49 | 20.9% |
| $75,000 to $99,999 | 37 | 15.8% |
| $100,000 to $149,999 | 25 | 10.7% |
| $150,000 to $199,999 | 22 | 9.4% |
| $200,000+ | 5 | 2.1% |
Family Income by Famaliy Size in Rushville
3-person families (53 | 22.7%) account for the highest median family income in Rushville with $64,219 per family, while 2-person families (101 | 43.2%) have the highest median income of $23,663 per family member.
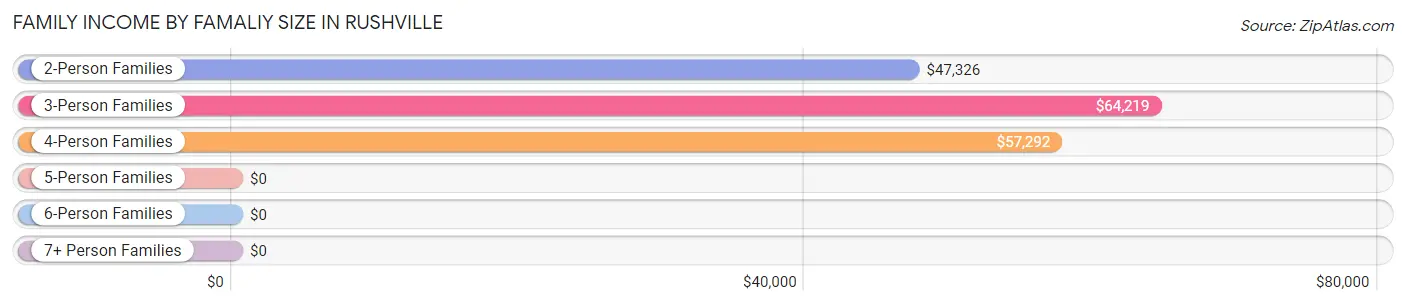
| Income Bracket | # Families | Median Income |
| 2-Person Families | 101 (43.2%) | $47,326 |
| 3-Person Families | 53 (22.7%) | $64,219 |
| 4-Person Families | 48 (20.5%) | $57,292 |
| 5-Person Families | 27 (11.5%) | $0 |
| 6-Person Families | 5 (2.1%) | $0 |
| 7+ Person Families | 0 (0.0%) | $0 |
| Total | 234 (100.0%) | $62,600 |
Family Income by Number of Earners in Rushville
The median family income in Rushville is $62,600, with families comprising 2 earners (106) having the highest median family income of $96,818, while families with 1 earner (66) have the lowest median family income of $33,571, accounting for 45.3% and 28.2% of families, respectively.
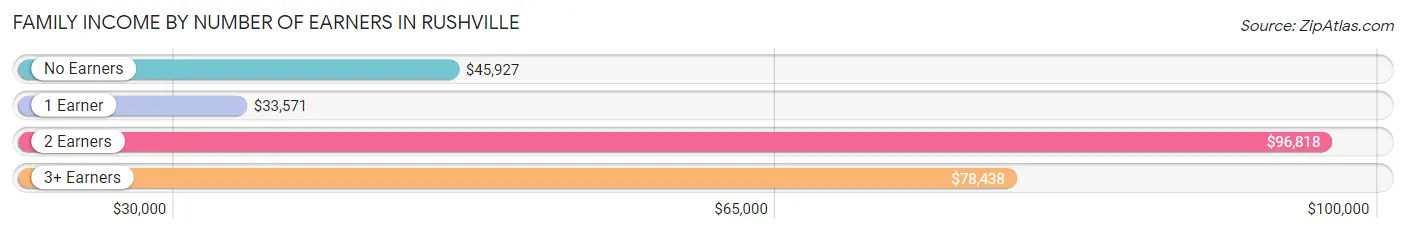
| Number of Earners | # Families | Median Income |
| No Earners | 43 (18.4%) | $45,927 |
| 1 Earner | 66 (28.2%) | $33,571 |
| 2 Earners | 106 (45.3%) | $96,818 |
| 3+ Earners | 19 (8.1%) | $78,438 |
| Total | 234 (100.0%) | $62,600 |
Household Income in Rushville
Household Income Brackets in Rushville
With 115 households falling in the category, the $35,000 to $49,999 income range is the most frequent in Rushville, accounting for 28.1% of all households. In contrast, only 5 households (1.2%) fall into the $200,000+ income bracket, making it the least populous group.
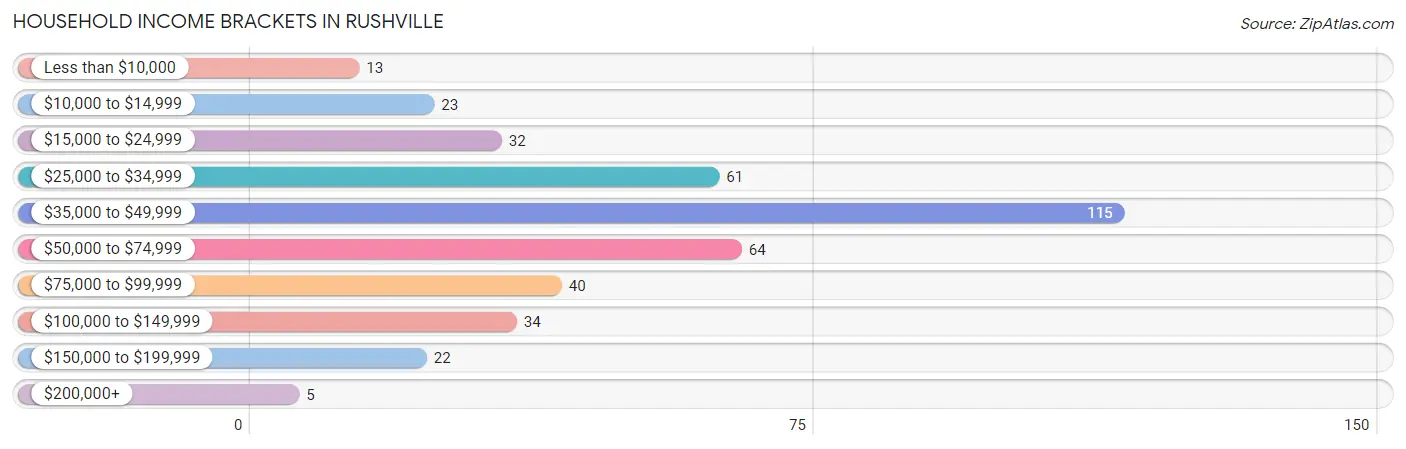
| Income Bracket | # Households | % Households |
| Less than $10,000 | 13 | 3.2% |
| $10,000 to $14,999 | 23 | 5.6% |
| $15,000 to $24,999 | 32 | 7.8% |
| $25,000 to $34,999 | 61 | 14.9% |
| $35,000 to $49,999 | 115 | 28.1% |
| $50,000 to $74,999 | 64 | 15.6% |
| $75,000 to $99,999 | 40 | 9.8% |
| $100,000 to $149,999 | 34 | 8.3% |
| $150,000 to $199,999 | 22 | 5.4% |
| $200,000+ | 5 | 1.2% |
Household Income by Householder Age in Rushville
The median household income in Rushville is $47,180, with the highest median household income of $83,125 found in the 45 to 64 years age bracket for the primary householder. A total of 101 households (24.7%) fall into this category. Meanwhile, the 15 to 24 years age bracket for the primary householder has the lowest median household income of $0, with 2 households (0.5%) in this group.
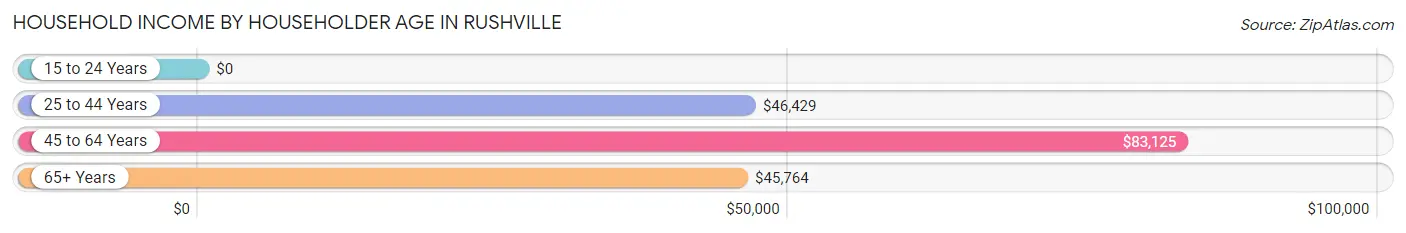
| Income Bracket | # Households | Median Income |
| 15 to 24 Years | 2 (0.5%) | $0 |
| 25 to 44 Years | 106 (25.9%) | $46,429 |
| 45 to 64 Years | 101 (24.7%) | $83,125 |
| 65+ Years | 200 (48.9%) | $45,764 |
| Total | 409 (100.0%) | $47,180 |
Poverty in Rushville
Income Below Poverty by Sex and Age in Rushville
With 13.8% poverty level for males and 10.2% for females among the residents of Rushville, 6 to 11 year old males and 6 to 11 year old females are the most vulnerable to poverty, with 12 males (35.3%) and 23 females (37.7%) in their respective age groups living below the poverty level.
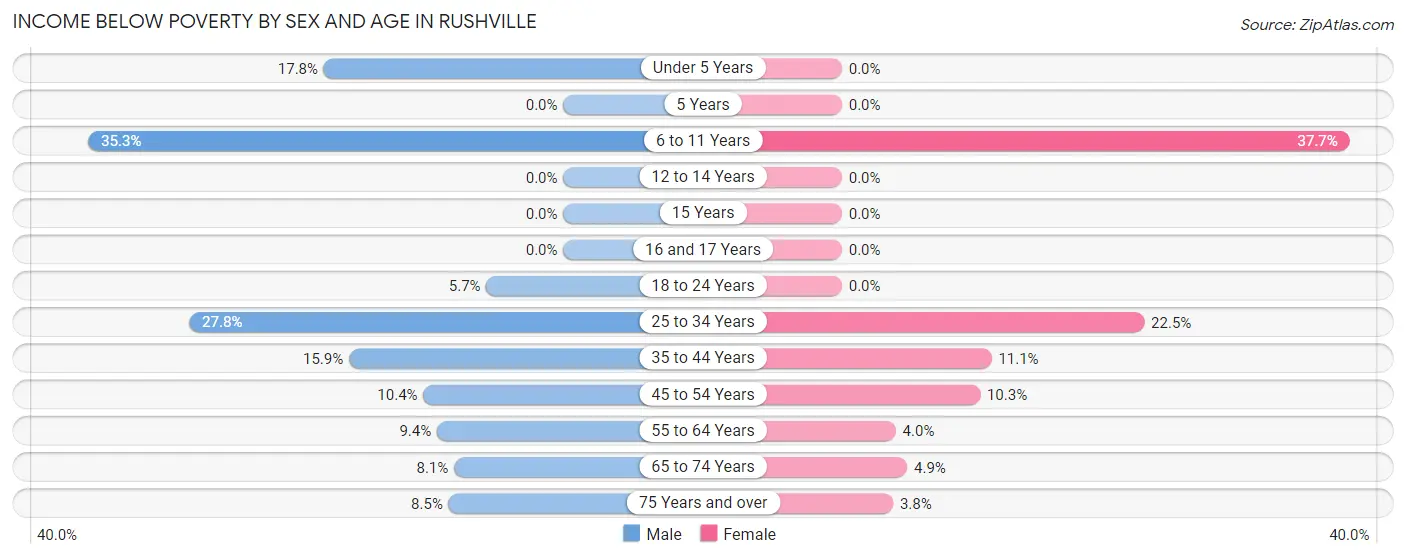
| Age Bracket | Male | Female |
| Under 5 Years | 8 (17.8%) | 0 (0.0%) |
| 5 Years | 0 (0.0%) | 0 (0.0%) |
| 6 to 11 Years | 12 (35.3%) | 23 (37.7%) |
| 12 to 14 Years | 0 (0.0%) | 0 (0.0%) |
| 15 Years | 0 (0.0%) | 0 (0.0%) |
| 16 and 17 Years | 0 (0.0%) | 0 (0.0%) |
| 18 to 24 Years | 2 (5.7%) | 0 (0.0%) |
| 25 to 34 Years | 15 (27.8%) | 11 (22.5%) |
| 35 to 44 Years | 7 (15.9%) | 6 (11.1%) |
| 45 to 54 Years | 8 (10.4%) | 4 (10.3%) |
| 55 to 64 Years | 3 (9.4%) | 2 (4.0%) |
| 65 to 74 Years | 3 (8.1%) | 5 (4.9%) |
| 75 Years and over | 4 (8.5%) | 3 (3.8%) |
| Total | 62 (13.8%) | 54 (10.2%) |
Income Above Poverty by Sex and Age in Rushville
According to the poverty statistics in Rushville, males aged 5 years and females aged under 5 years are the age groups that are most secure financially, with 100.0% of males and 100.0% of females in these age groups living above the poverty line.
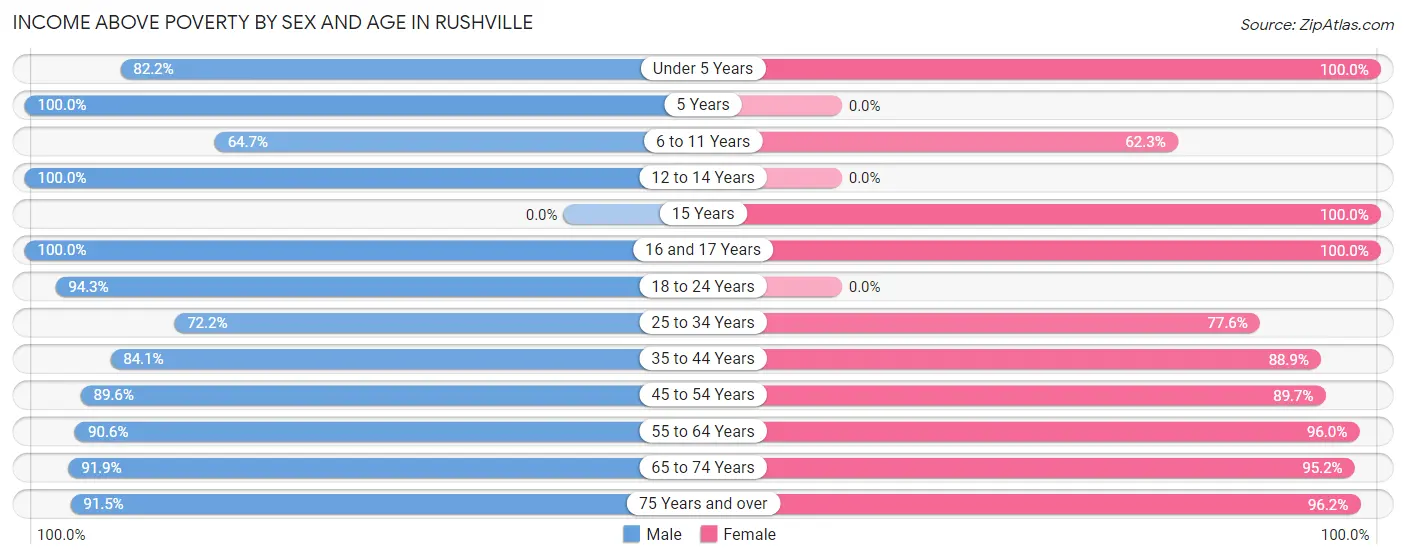
| Age Bracket | Male | Female |
| Under 5 Years | 37 (82.2%) | 18 (100.0%) |
| 5 Years | 8 (100.0%) | 0 (0.0%) |
| 6 to 11 Years | 22 (64.7%) | 38 (62.3%) |
| 12 to 14 Years | 24 (100.0%) | 0 (0.0%) |
| 15 Years | 0 (0.0%) | 2 (100.0%) |
| 16 and 17 Years | 13 (100.0%) | 74 (100.0%) |
| 18 to 24 Years | 33 (94.3%) | 0 (0.0%) |
| 25 to 34 Years | 39 (72.2%) | 38 (77.5%) |
| 35 to 44 Years | 37 (84.1%) | 48 (88.9%) |
| 45 to 54 Years | 69 (89.6%) | 35 (89.7%) |
| 55 to 64 Years | 29 (90.6%) | 48 (96.0%) |
| 65 to 74 Years | 34 (91.9%) | 98 (95.2%) |
| 75 Years and over | 43 (91.5%) | 76 (96.2%) |
| Total | 388 (86.2%) | 475 (89.8%) |
Income Below Poverty Among Married-Couple Families in Rushville
The poverty statistics for married-couple families in Rushville show that 10.1% or 19 of the total 189 families live below the poverty line. Families with 3 or 4 children have the highest poverty rate of 34.4%, comprising of 11 families. On the other hand, families with no children have the lowest poverty rate of 2.1%, which includes 2 families.
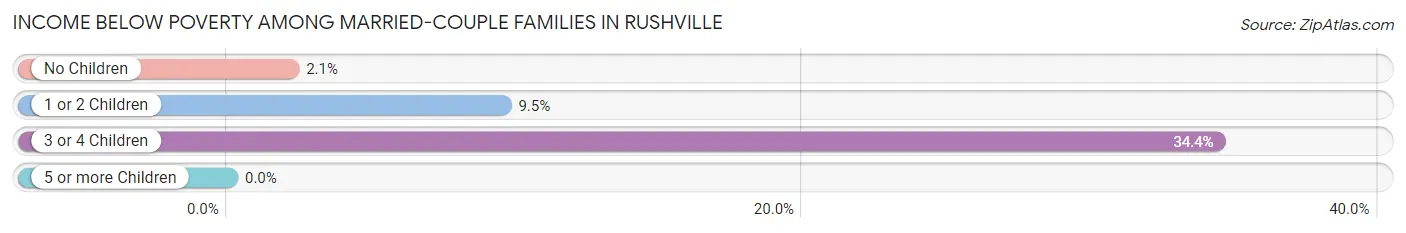
| Children | Above Poverty | Below Poverty |
| No Children | 92 (97.9%) | 2 (2.1%) |
| 1 or 2 Children | 57 (90.5%) | 6 (9.5%) |
| 3 or 4 Children | 21 (65.6%) | 11 (34.4%) |
| 5 or more Children | 0 (0.0%) | 0 (0.0%) |
| Total | 170 (89.9%) | 19 (10.1%) |
Income Below Poverty Among Single-Parent Households in Rushville
According to the poverty data in Rushville, 63.2% or 12 single-father households and 15.4% or 4 single-mother households are living below the poverty line. Among single-father households, those with 1 or 2 children have the highest poverty rate, with 12 households (100.0%) experiencing poverty. Likewise, among single-mother households, those with 1 or 2 children have the highest poverty rate, with 4 households (18.2%) falling below the poverty line.
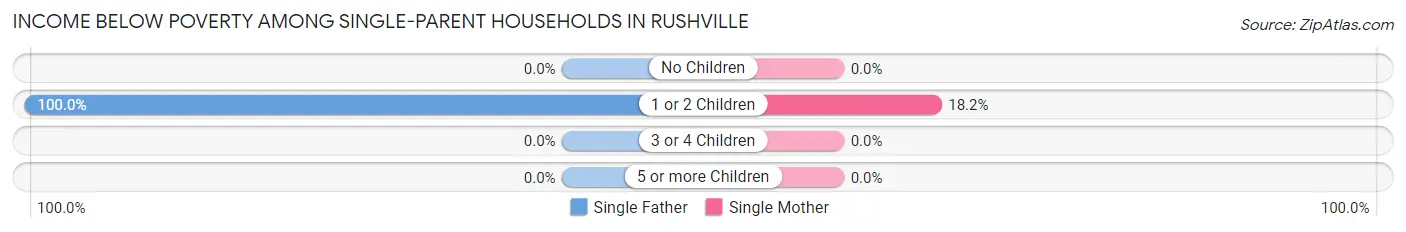
| Children | Single Father | Single Mother |
| No Children | 0 (0.0%) | 0 (0.0%) |
| 1 or 2 Children | 12 (100.0%) | 4 (18.2%) |
| 3 or 4 Children | 0 (0.0%) | 0 (0.0%) |
| 5 or more Children | 0 (0.0%) | 0 (0.0%) |
| Total | 12 (63.2%) | 4 (15.4%) |
Income Below Poverty Among Married-Couple vs Single-Parent Households in Rushville
The poverty data for Rushville shows that 19 of the married-couple family households (10.1%) and 16 of the single-parent households (35.6%) are living below the poverty level. Within the married-couple family households, those with 3 or 4 children have the highest poverty rate, with 11 households (34.4%) falling below the poverty line. Among the single-parent households, those with 1 or 2 children have the highest poverty rate, with 16 household (47.1%) living below poverty.
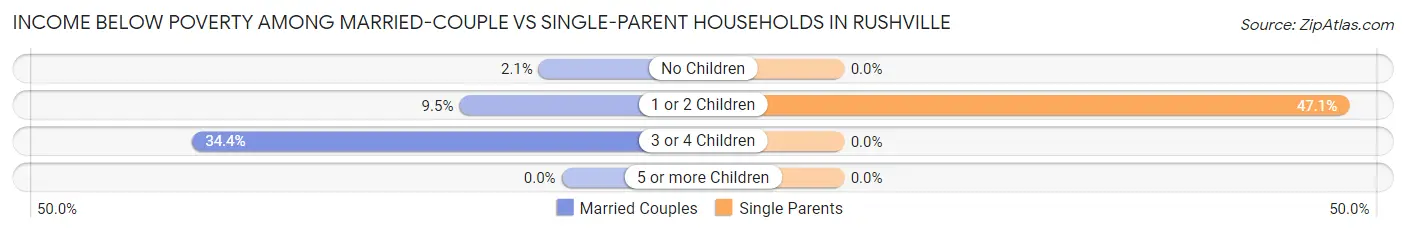
| Children | Married-Couple Families | Single-Parent Households |
| No Children | 2 (2.1%) | 0 (0.0%) |
| 1 or 2 Children | 6 (9.5%) | 16 (47.1%) |
| 3 or 4 Children | 11 (34.4%) | 0 (0.0%) |
| 5 or more Children | 0 (0.0%) | 0 (0.0%) |
| Total | 19 (10.1%) | 16 (35.6%) |
Race in Rushville
The most populous races in Rushville are White / Caucasian (707 | 69.9%), Native / Alaskan (189 | 18.7%), and Hispanic or Latino (115 | 11.4%).
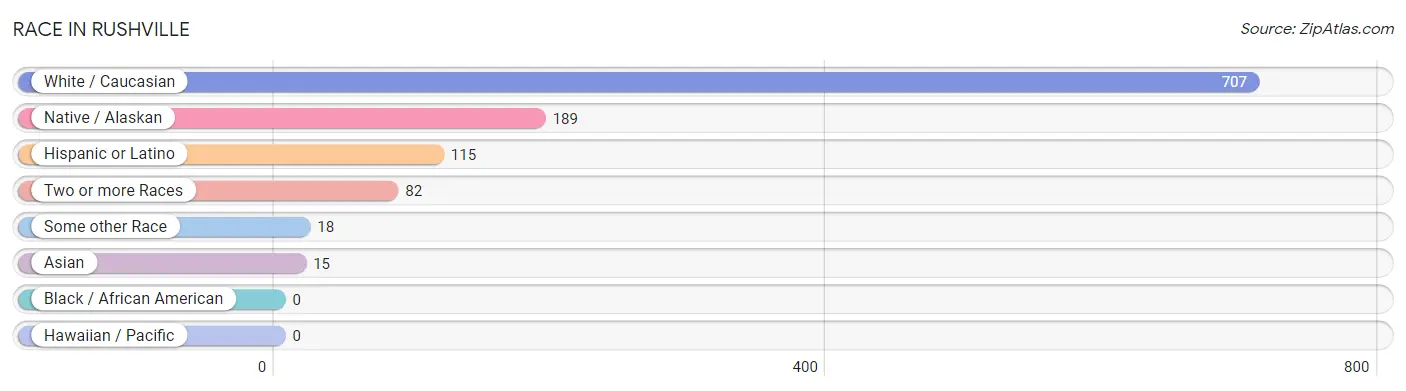
| Race | # Population | % Population |
| Asian | 15 | 1.5% |
| Black / African American | 0 | 0.0% |
| Hawaiian / Pacific | 0 | 0.0% |
| Hispanic or Latino | 115 | 11.4% |
| Native / Alaskan | 189 | 18.7% |
| White / Caucasian | 707 | 69.9% |
| Two or more Races | 82 | 8.1% |
| Some other Race | 18 | 1.8% |
| Total | 1,011 | 100.0% |
Ancestry in Rushville
The most populous ancestries reported in Rushville are German (279 | 27.6%), Sioux (214 | 21.2%), Irish (115 | 11.4%), Mexican (84 | 8.3%), and English (80 | 7.9%), together accounting for 76.4% of all Rushville residents.
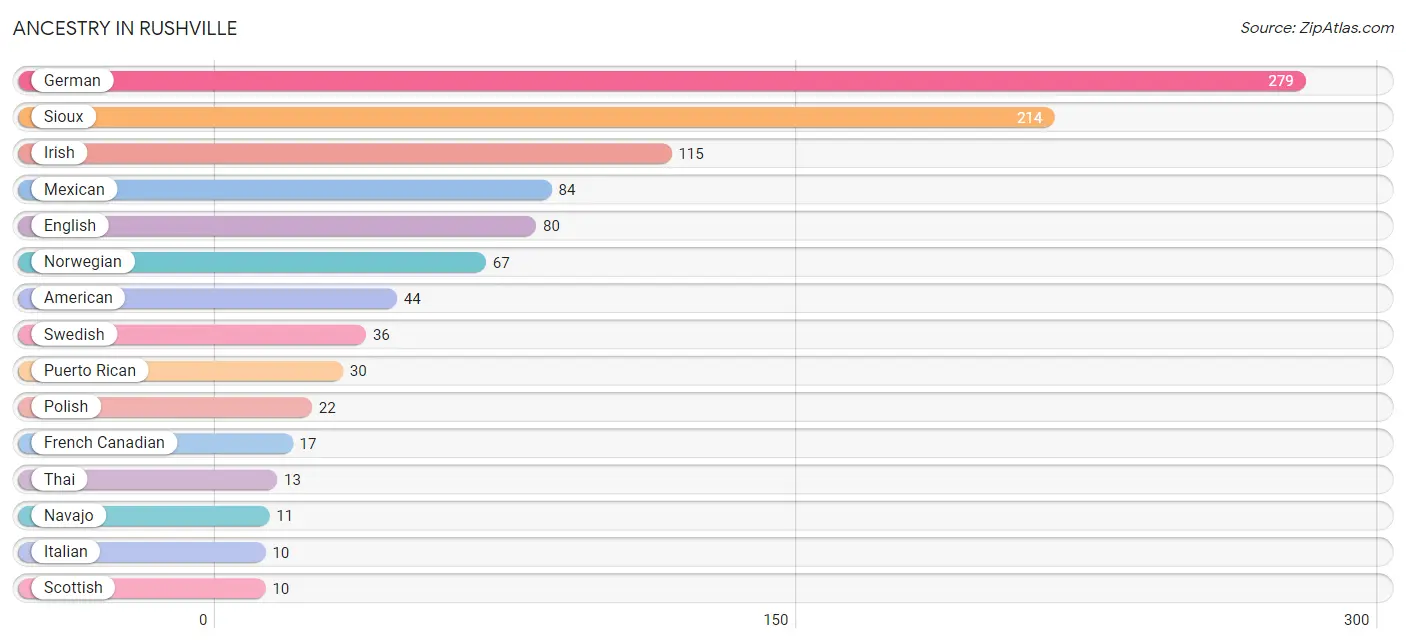
| Ancestry | # Population | % Population |
| American | 44 | 4.3% |
| British | 4 | 0.4% |
| Central American | 1 | 0.1% |
| Czech | 6 | 0.6% |
| Czechoslovakian | 6 | 0.6% |
| Dutch | 8 | 0.8% |
| English | 80 | 7.9% |
| French | 5 | 0.5% |
| French Canadian | 17 | 1.7% |
| German | 279 | 27.6% |
| Guatemalan | 1 | 0.1% |
| Irish | 115 | 11.4% |
| Iroquois | 9 | 0.9% |
| Italian | 10 | 1.0% |
| Korean | 2 | 0.2% |
| Mexican | 84 | 8.3% |
| Navajo | 11 | 1.1% |
| Norwegian | 67 | 6.6% |
| Polish | 22 | 2.2% |
| Puerto Rican | 30 | 3.0% |
| Scotch-Irish | 2 | 0.2% |
| Scottish | 10 | 1.0% |
| Sioux | 214 | 21.2% |
| Swedish | 36 | 3.6% |
| Swiss | 6 | 0.6% |
| Thai | 13 | 1.3% |
| Yugoslavian | 4 | 0.4% | View All 27 Rows |
Immigrants in Rushville
The most numerous immigrant groups reported in Rushville came from Asia (10 | 1.0%), India (8 | 0.8%), South Central Asia (8 | 0.8%), Philippines (2 | 0.2%), and South Eastern Asia (2 | 0.2%), together accounting for 3.0% of all Rushville residents.
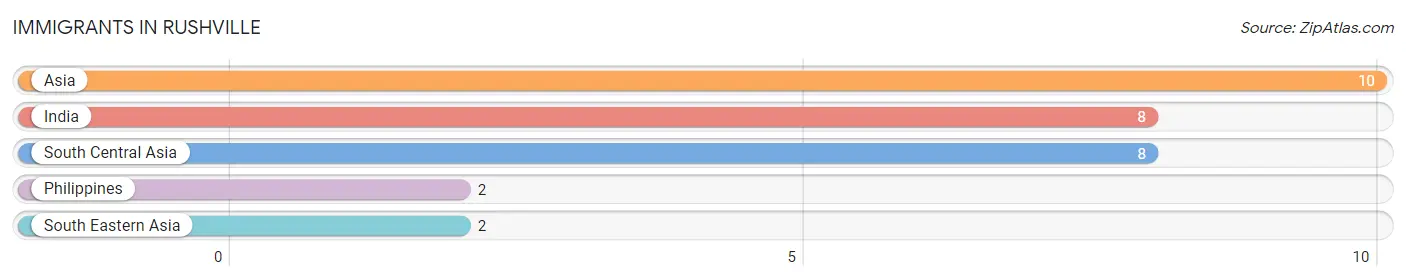
| Immigration Origin | # Population | % Population |
| Asia | 10 | 1.0% |
| India | 8 | 0.8% |
| Philippines | 2 | 0.2% |
| South Central Asia | 8 | 0.8% |
| South Eastern Asia | 2 | 0.2% | View All 5 Rows |
Sex and Age in Rushville
Sex and Age in Rushville
The most populous age groups in Rushville are 50 to 54 Years (55 | 11.5%) for men and 70 to 74 Years (79 | 14.8%) for women.
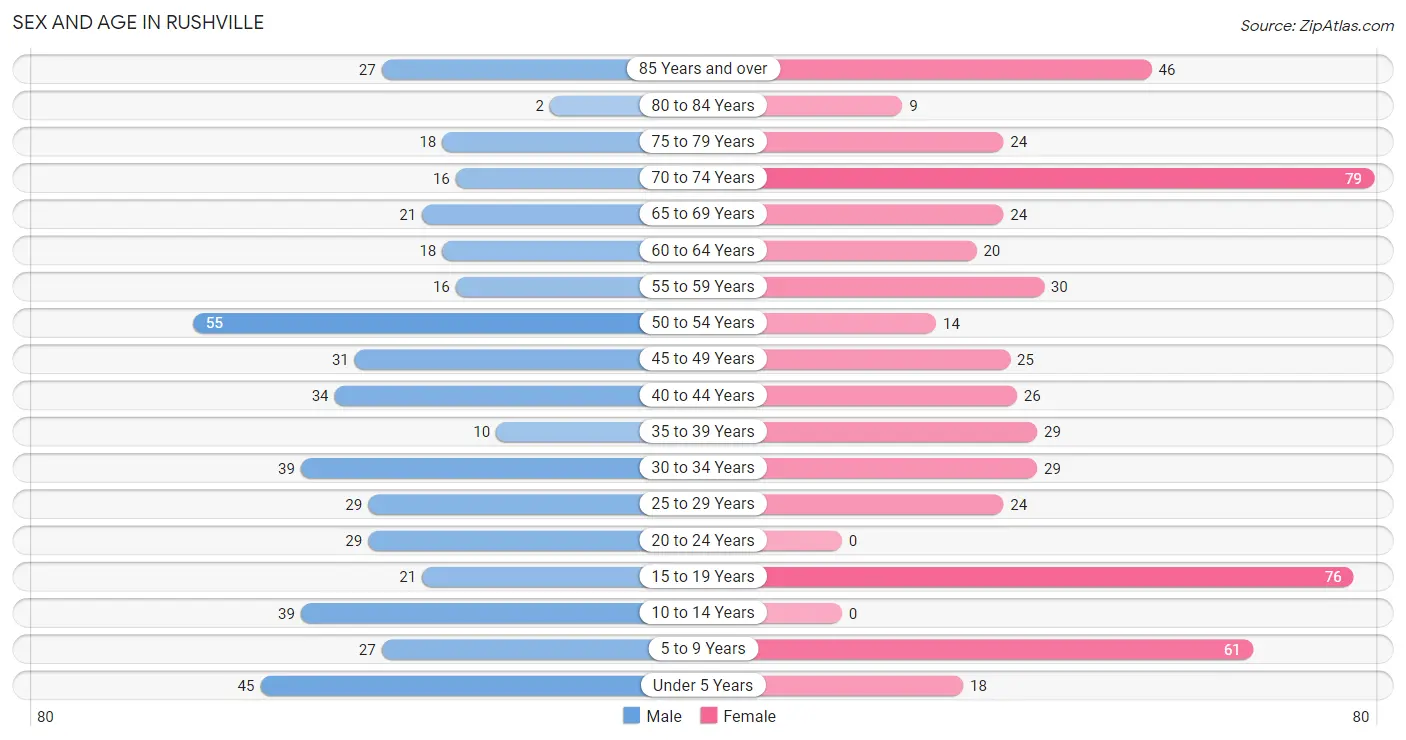
| Age Bracket | Male | Female |
| Under 5 Years | 45 (9.4%) | 18 (3.4%) |
| 5 to 9 Years | 27 (5.7%) | 61 (11.4%) |
| 10 to 14 Years | 39 (8.2%) | 0 (0.0%) |
| 15 to 19 Years | 21 (4.4%) | 76 (14.2%) |
| 20 to 24 Years | 29 (6.1%) | 0 (0.0%) |
| 25 to 29 Years | 29 (6.1%) | 24 (4.5%) |
| 30 to 34 Years | 39 (8.2%) | 29 (5.4%) |
| 35 to 39 Years | 10 (2.1%) | 29 (5.4%) |
| 40 to 44 Years | 34 (7.1%) | 26 (4.9%) |
| 45 to 49 Years | 31 (6.5%) | 25 (4.7%) |
| 50 to 54 Years | 55 (11.5%) | 14 (2.6%) |
| 55 to 59 Years | 16 (3.4%) | 30 (5.6%) |
| 60 to 64 Years | 18 (3.8%) | 20 (3.7%) |
| 65 to 69 Years | 21 (4.4%) | 24 (4.5%) |
| 70 to 74 Years | 16 (3.4%) | 79 (14.8%) |
| 75 to 79 Years | 18 (3.8%) | 24 (4.5%) |
| 80 to 84 Years | 2 (0.4%) | 9 (1.7%) |
| 85 Years and over | 27 (5.7%) | 46 (8.6%) |
| Total | 477 (100.0%) | 534 (100.0%) |
Families and Households in Rushville
Median Family Size in Rushville
The median family size in Rushville is 3.32 persons per family, with single female/mother families (26 | 11.1%) accounting for the largest median family size of 5.31 persons per family. On the other hand, single male/father families (19 | 8.1%) represent the smallest median family size with 2.58 persons per family.
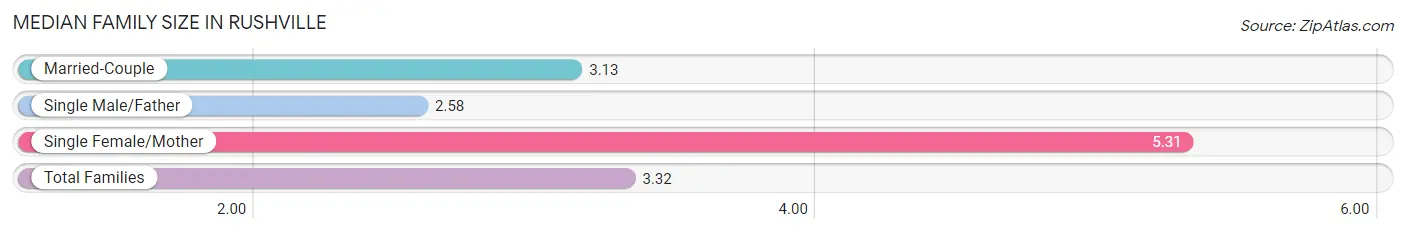
| Family Type | # Families | Family Size |
| Married-Couple | 189 (80.8%) | 3.13 |
| Single Male/Father | 19 (8.1%) | 2.58 |
| Single Female/Mother | 26 (11.1%) | 5.31 |
| Total Families | 234 (100.0%) | 3.32 |
Median Household Size in Rushville
The median household size in Rushville is 2.39 persons per household, with single female/mother households (26 | 6.4%) accounting for the largest median household size of 5.65 persons per household. non-family households (175 | 42.8%) represent the smallest median household size with 1.06 persons per household.
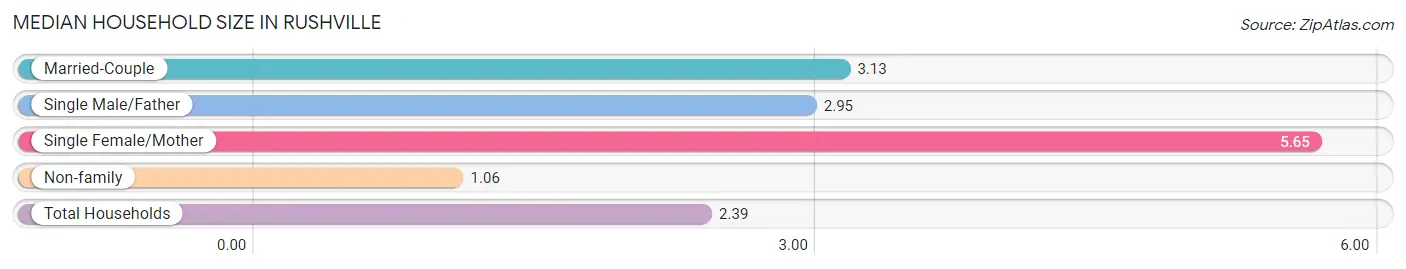
| Household Type | # Households | Household Size |
| Married-Couple | 189 (46.2%) | 3.13 |
| Single Male/Father | 19 (4.6%) | 2.95 |
| Single Female/Mother | 26 (6.4%) | 5.65 |
| Non-family | 175 (42.8%) | 1.06 |
| Total Households | 409 (100.0%) | 2.39 |
Household Size by Marriage Status in Rushville
Out of a total of 409 households in Rushville, 234 (57.2%) are family households, while 175 (42.8%) are nonfamily households. The most numerous type of family households are 2-person households, comprising 101, and the most common type of nonfamily households are 1-person households, comprising 168.
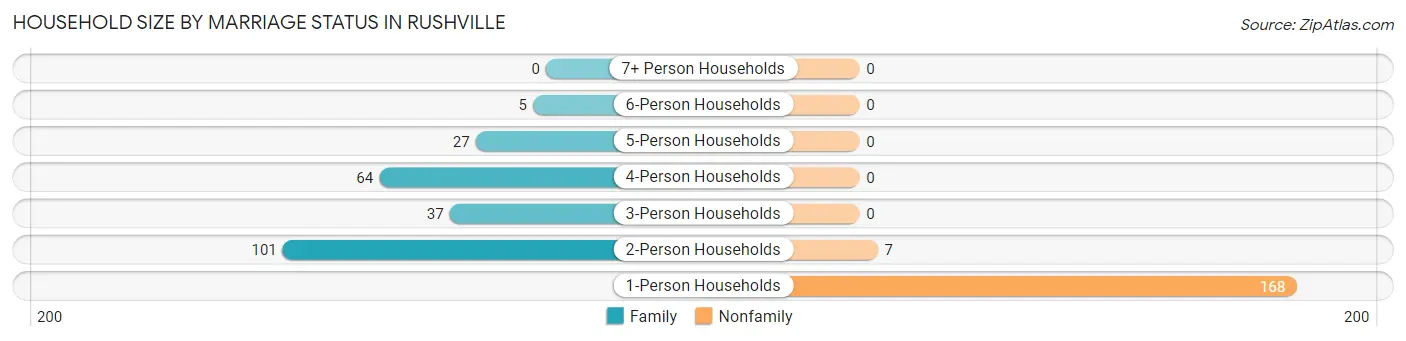
| Household Size | Family Households | Nonfamily Households |
| 1-Person Households | - | 168 (41.1%) |
| 2-Person Households | 101 (24.7%) | 7 (1.7%) |
| 3-Person Households | 37 (9.0%) | 0 (0.0%) |
| 4-Person Households | 64 (15.7%) | 0 (0.0%) |
| 5-Person Households | 27 (6.6%) | 0 (0.0%) |
| 6-Person Households | 5 (1.2%) | 0 (0.0%) |
| 7+ Person Households | 0 (0.0%) | 0 (0.0%) |
| Total | 234 (57.2%) | 175 (42.8%) |
Female Fertility in Rushville
Fertility by Age in Rushville
Average fertility rate in Rushville is 82.0 births per 1,000 women. Women in the age bracket of 20 to 34 years have the highest fertility rate with 208.0 births per 1,000 women. Women in the age bracket of 20 to 34 years acount for 61.1% of all women with births.
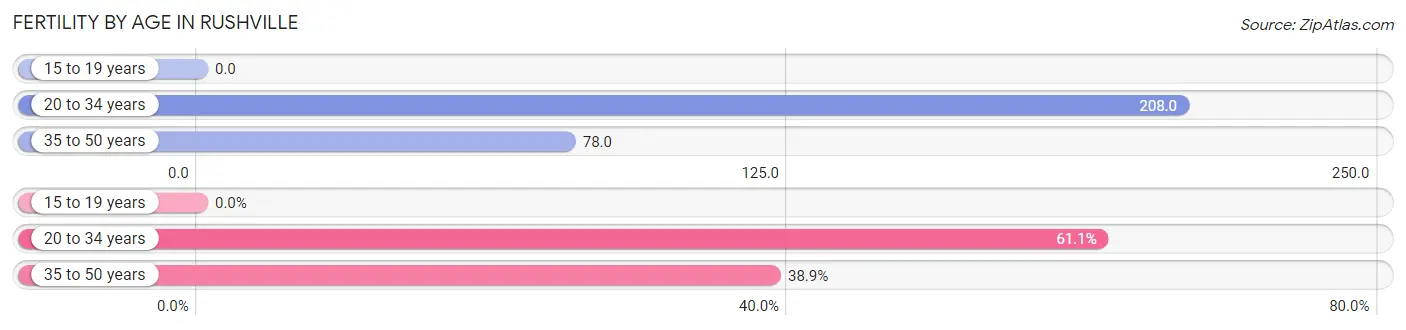
| Age Bracket | Women with Births | Births / 1,000 Women |
| 15 to 19 years | 0 (0.0%) | 0.0 |
| 20 to 34 years | 11 (61.1%) | 208.0 |
| 35 to 50 years | 7 (38.9%) | 78.0 |
| Total | 18 (100.0%) | 82.0 |
Fertility by Age by Marriage Status in Rushville
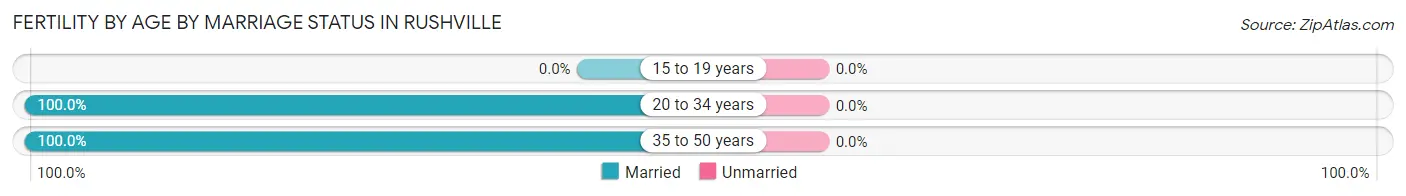
| Age Bracket | Married | Unmarried |
| 15 to 19 years | 0 (0.0%) | 0 (0.0%) |
| 20 to 34 years | 11 (100.0%) | 0 (0.0%) |
| 35 to 50 years | 7 (100.0%) | 0 (0.0%) |
| Total | 18 (100.0%) | 0 (0.0%) |
Fertility by Education in Rushville
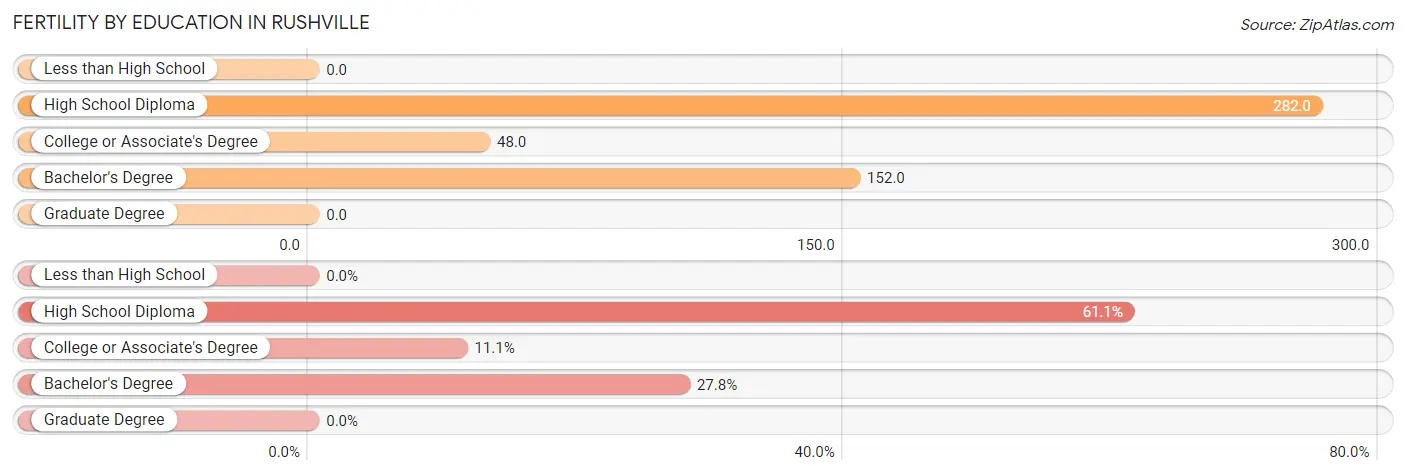
| Educational Attainment | Women with Births | Births / 1,000 Women |
| Less than High School | 0 (0.0%) | 0.0 |
| High School Diploma | 11 (61.1%) | 282.0 |
| College or Associate's Degree | 2 (11.1%) | 48.0 |
| Bachelor's Degree | 5 (27.8%) | 152.0 |
| Graduate Degree | 0 (0.0%) | 0.0 |
| Total | 18 (100.0%) | 82.0 |
Fertility by Education by Marriage Status in Rushville
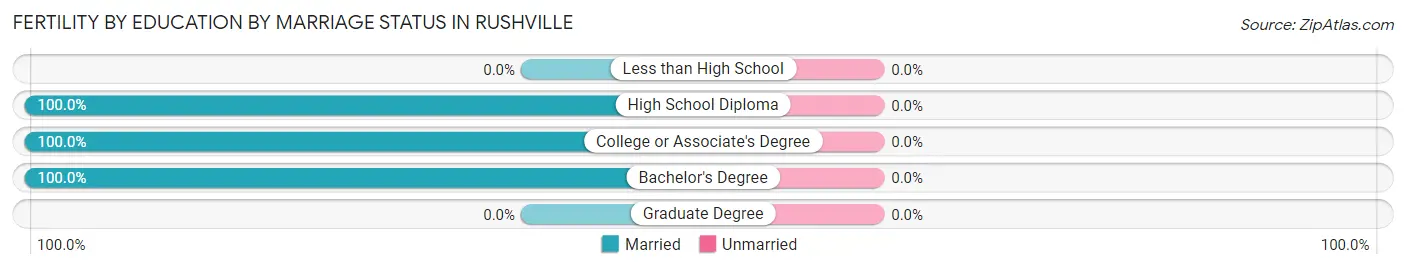
| Educational Attainment | Married | Unmarried |
| Less than High School | 0 (0.0%) | 0 (0.0%) |
| High School Diploma | 11 (100.0%) | 0 (0.0%) |
| College or Associate's Degree | 2 (100.0%) | 0 (0.0%) |
| Bachelor's Degree | 5 (100.0%) | 0 (0.0%) |
| Graduate Degree | 0 (0.0%) | 0 (0.0%) |
| Total | 18 (100.0%) | 0 (0.0%) |
Employment Characteristics in Rushville
Employment by Class of Employer in Rushville
Among the 406 employed individuals in Rushville, private company employees (158 | 38.9%), local government employees (137 | 33.7%), and self-employed (not incorporated) (43 | 10.6%) make up the most common classes of employment.
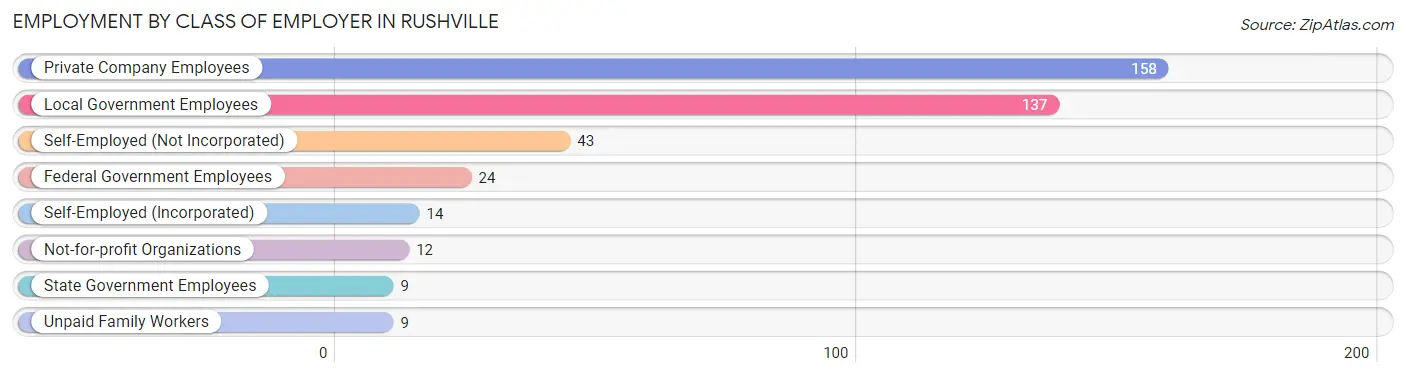
| Employer Class | # Employees | % Employees |
| Private Company Employees | 158 | 38.9% |
| Self-Employed (Incorporated) | 14 | 3.5% |
| Self-Employed (Not Incorporated) | 43 | 10.6% |
| Not-for-profit Organizations | 12 | 3.0% |
| Local Government Employees | 137 | 33.7% |
| State Government Employees | 9 | 2.2% |
| Federal Government Employees | 24 | 5.9% |
| Unpaid Family Workers | 9 | 2.2% |
| Total | 406 | 100.0% |
Employment Status by Age in Rushville
According to the labor force statistics for Rushville, out of the total population over 16 years of age (819), 53.0% or 434 individuals are in the labor force, with 6.2% or 27 of them unemployed. The age group with the highest labor force participation rate is 20 to 24 years, with 93.1% or 27 individuals in the labor force. Within the labor force, the 20 to 24 years age range has the highest percentage of unemployed individuals, with 81.5% or 22 of them being unemployed.
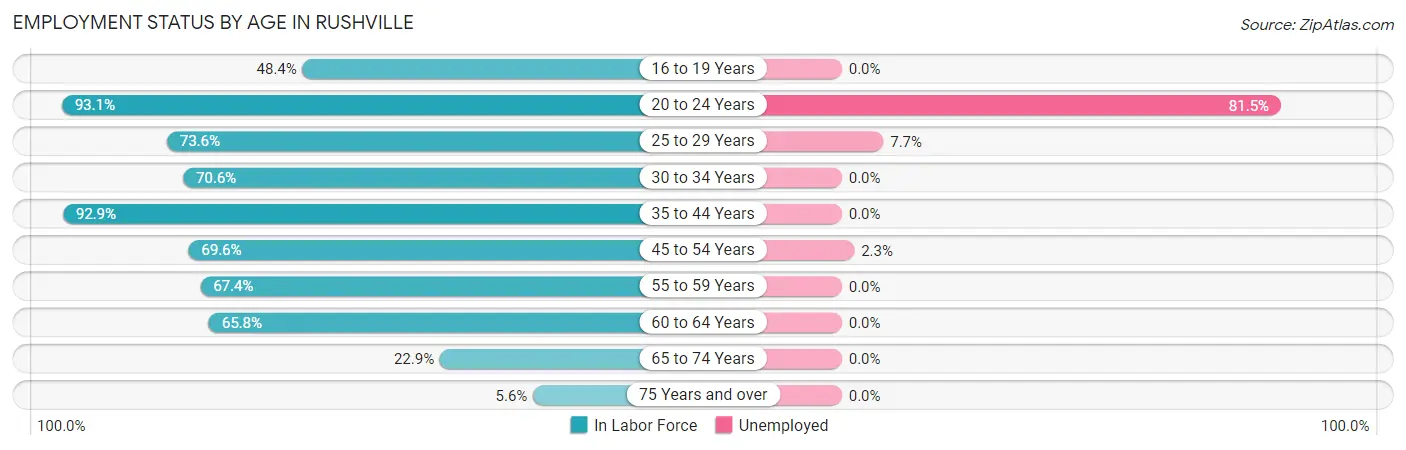
| Age Bracket | In Labor Force | Unemployed |
| 16 to 19 Years | 46 (48.4%) | 0 (0.0%) |
| 20 to 24 Years | 27 (93.1%) | 22 (81.5%) |
| 25 to 29 Years | 39 (73.6%) | 3 (7.7%) |
| 30 to 34 Years | 48 (70.6%) | 0 (0.0%) |
| 35 to 44 Years | 92 (92.9%) | 0 (0.0%) |
| 45 to 54 Years | 87 (69.6%) | 2 (2.3%) |
| 55 to 59 Years | 31 (67.4%) | 0 (0.0%) |
| 60 to 64 Years | 25 (65.8%) | 0 (0.0%) |
| 65 to 74 Years | 32 (22.9%) | 0 (0.0%) |
| 75 Years and over | 7 (5.6%) | 0 (0.0%) |
| Total | 434 (53.0%) | 27 (6.2%) |
Employment Status by Educational Attainment in Rushville
According to labor force statistics for Rushville, 75.1% of individuals (322) out of the total population between 25 and 64 years of age (429) are in the labor force, with 1.6% or 5 of them being unemployed. The group with the highest labor force participation rate are those with the educational attainment of bachelor's degree or higher, with 95.6% or 109 individuals in the labor force. Within the labor force, individuals with college / associate degree education have the highest percentage of unemployment, with 4.5% or 5 of them being unemployed.
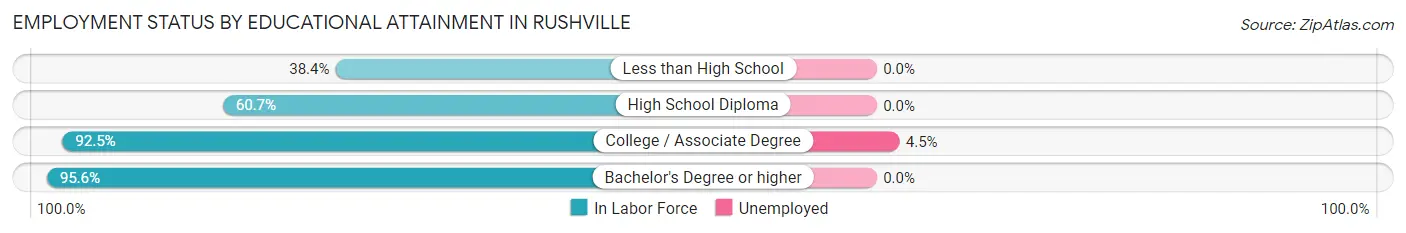
| Educational Attainment | In Labor Force | Unemployed |
| Less than High School | 28 (38.4%) | 0 (0.0%) |
| High School Diploma | 74 (60.7%) | 0 (0.0%) |
| College / Associate Degree | 111 (92.5%) | 5 (4.5%) |
| Bachelor's Degree or higher | 109 (95.6%) | 0 (0.0%) |
| Total | 322 (75.1%) | 7 (1.6%) |
Employment Occupations by Sex in Rushville
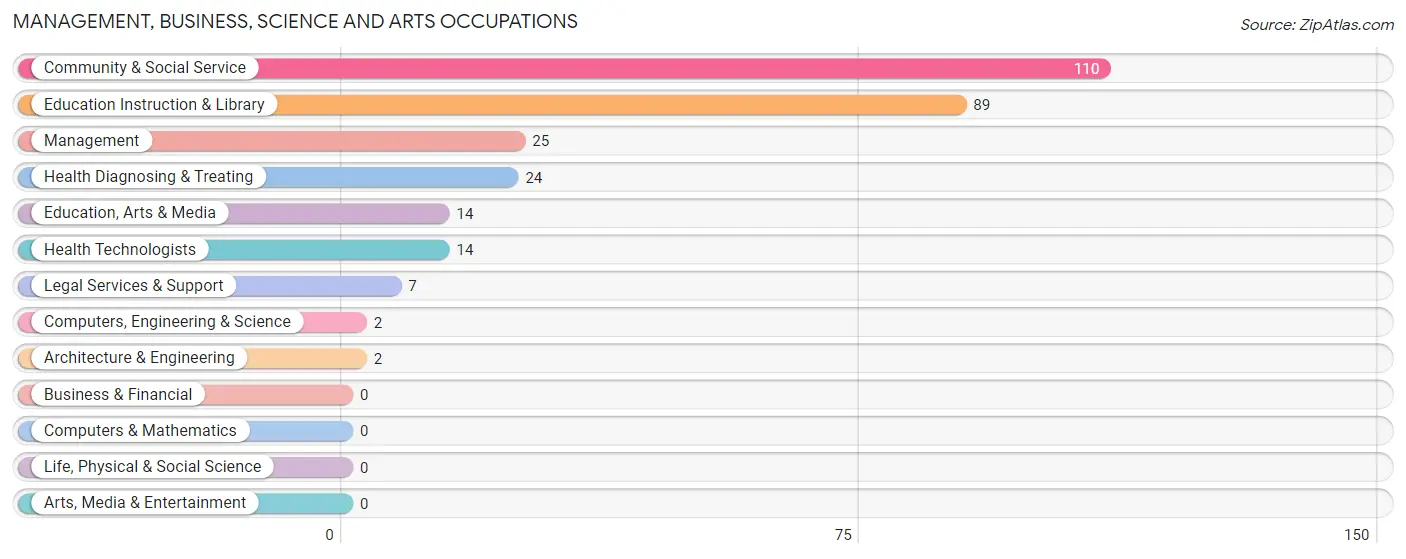
Management, Business, Science and Arts Occupations
The most common Management, Business, Science and Arts occupations in Rushville are Community & Social Service (110 | 27.0%), Education Instruction & Library (89 | 21.9%), Management (25 | 6.1%), Health Diagnosing & Treating (24 | 5.9%), and Education, Arts & Media (14 | 3.4%).
Management, Business, Science and Arts Occupations by Sex
Within the Management, Business, Science and Arts occupations in Rushville, the most male-oriented occupations are Computers, Engineering & Science (100.0%), Architecture & Engineering (100.0%), and Legal Services & Support (100.0%), while the most female-oriented occupations are Education, Arts & Media (100.0%), Health Diagnosing & Treating (100.0%), and Health Technologists (100.0%).
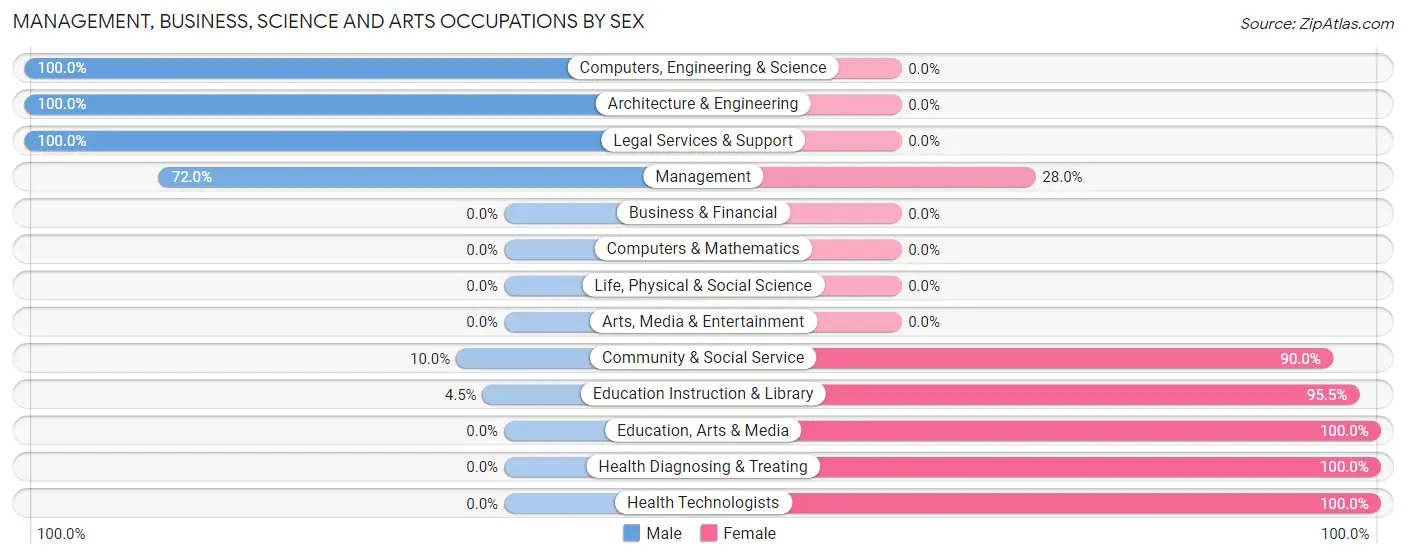
| Occupation | Male | Female |
| Management | 18 (72.0%) | 7 (28.0%) |
| Business & Financial | 0 (0.0%) | 0 (0.0%) |
| Computers, Engineering & Science | 2 (100.0%) | 0 (0.0%) |
| Computers & Mathematics | 0 (0.0%) | 0 (0.0%) |
| Architecture & Engineering | 2 (100.0%) | 0 (0.0%) |
| Life, Physical & Social Science | 0 (0.0%) | 0 (0.0%) |
| Community & Social Service | 11 (10.0%) | 99 (90.0%) |
| Education, Arts & Media | 0 (0.0%) | 14 (100.0%) |
| Legal Services & Support | 7 (100.0%) | 0 (0.0%) |
| Education Instruction & Library | 4 (4.5%) | 85 (95.5%) |
| Arts, Media & Entertainment | 0 (0.0%) | 0 (0.0%) |
| Health Diagnosing & Treating | 0 (0.0%) | 24 (100.0%) |
| Health Technologists | 0 (0.0%) | 14 (100.0%) |
| Total (Category) | 31 (19.3%) | 130 (80.7%) |
| Total (Overall) | 183 (45.0%) | 224 (55.0%) |
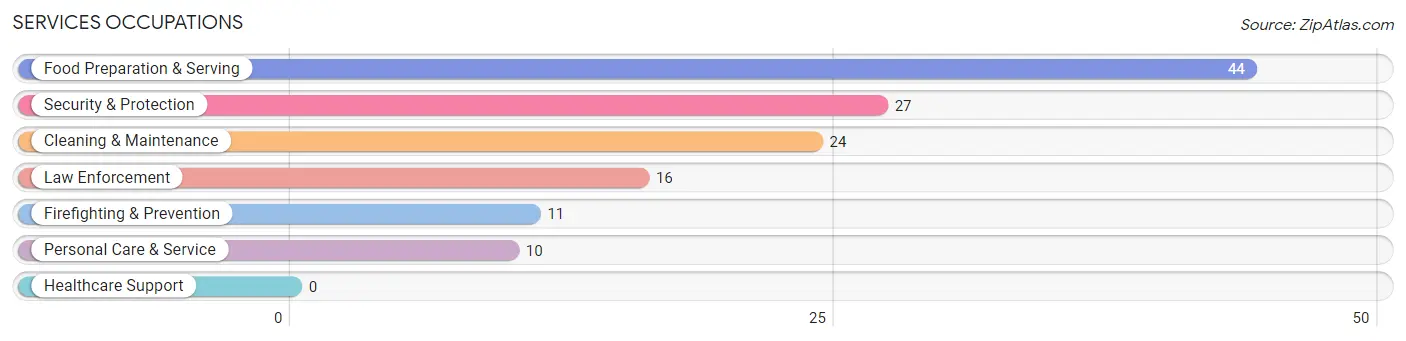
Services Occupations
The most common Services occupations in Rushville are Food Preparation & Serving (44 | 10.8%), Security & Protection (27 | 6.6%), Cleaning & Maintenance (24 | 5.9%), Law Enforcement (16 | 3.9%), and Firefighting & Prevention (11 | 2.7%).
Services Occupations by Sex
Within the Services occupations in Rushville, the most male-oriented occupations are Law Enforcement (93.8%), Cleaning & Maintenance (70.8%), and Security & Protection (55.6%), while the most female-oriented occupations are Firefighting & Prevention (100.0%), Personal Care & Service (100.0%), and Food Preparation & Serving (68.2%).
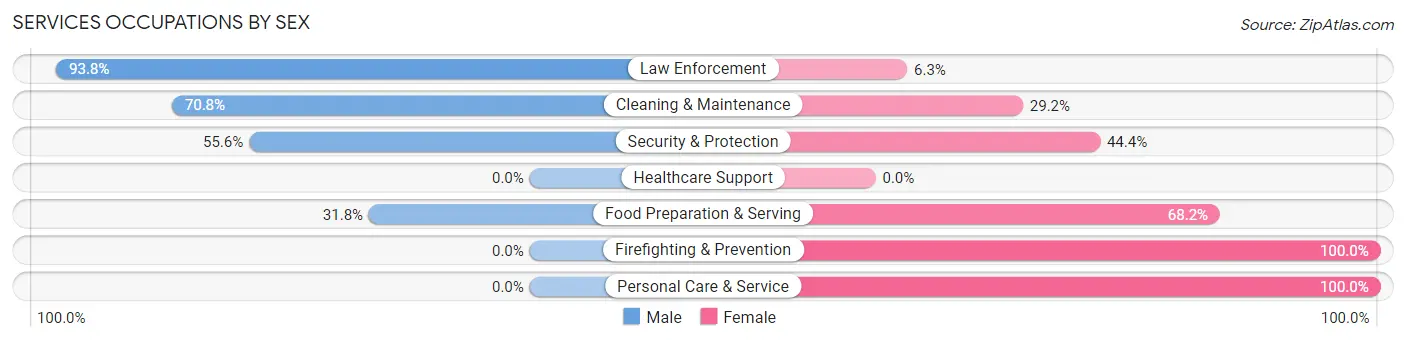
| Occupation | Male | Female |
| Healthcare Support | 0 (0.0%) | 0 (0.0%) |
| Security & Protection | 15 (55.6%) | 12 (44.4%) |
| Firefighting & Prevention | 0 (0.0%) | 11 (100.0%) |
| Law Enforcement | 15 (93.8%) | 1 (6.2%) |
| Food Preparation & Serving | 14 (31.8%) | 30 (68.2%) |
| Cleaning & Maintenance | 17 (70.8%) | 7 (29.2%) |
| Personal Care & Service | 0 (0.0%) | 10 (100.0%) |
| Total (Category) | 46 (43.8%) | 59 (56.2%) |
| Total (Overall) | 183 (45.0%) | 224 (55.0%) |
Sales and Office Occupations
The most common Sales and Office occupations in Rushville are Sales & Related (44 | 10.8%), and Office & Administration (27 | 6.6%).

Sales and Office Occupations by Sex

| Occupation | Male | Female |
| Sales & Related | 36 (81.8%) | 8 (18.2%) |
| Office & Administration | 0 (0.0%) | 27 (100.0%) |
| Total (Category) | 36 (50.7%) | 35 (49.3%) |
| Total (Overall) | 183 (45.0%) | 224 (55.0%) |
Natural Resources, Construction and Maintenance Occupations
The most common Natural Resources, Construction and Maintenance occupations in Rushville are Installation, Maintenance & Repair (19 | 4.7%), and Construction & Extraction (5 | 1.2%).
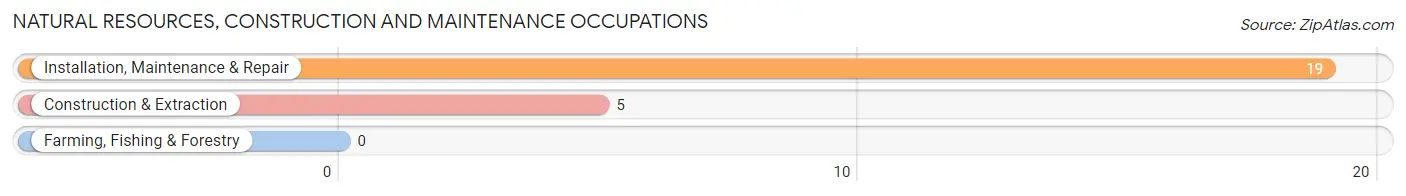
Natural Resources, Construction and Maintenance Occupations by Sex

| Occupation | Male | Female |
| Farming, Fishing & Forestry | 0 (0.0%) | 0 (0.0%) |
| Construction & Extraction | 5 (100.0%) | 0 (0.0%) |
| Installation, Maintenance & Repair | 19 (100.0%) | 0 (0.0%) |
| Total (Category) | 24 (100.0%) | 0 (0.0%) |
| Total (Overall) | 183 (45.0%) | 224 (55.0%) |
Production, Transportation and Moving Occupations
The most common Production, Transportation and Moving occupations in Rushville are Transportation (42 | 10.3%), and Production (4 | 1.0%).
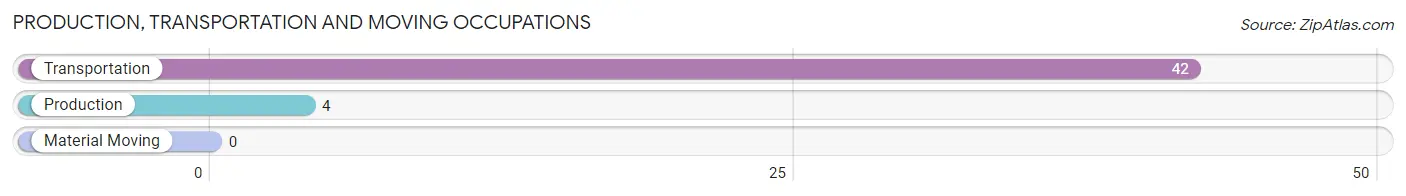
Production, Transportation and Moving Occupations by Sex
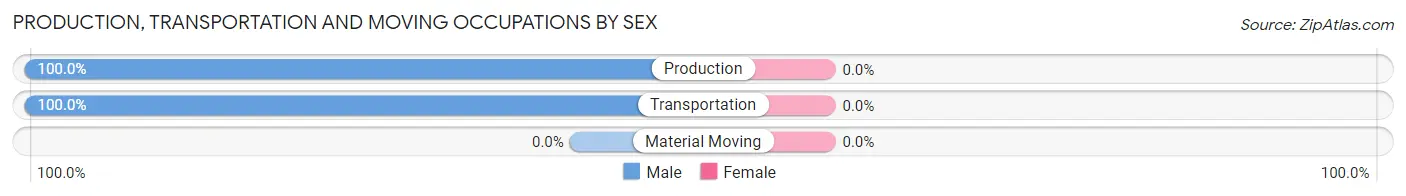
| Occupation | Male | Female |
| Production | 4 (100.0%) | 0 (0.0%) |
| Transportation | 42 (100.0%) | 0 (0.0%) |
| Material Moving | 0 (0.0%) | 0 (0.0%) |
| Total (Category) | 46 (100.0%) | 0 (0.0%) |
| Total (Overall) | 183 (45.0%) | 224 (55.0%) |
Employment Industries by Sex in Rushville
Employment Industries in Rushville
The major employment industries in Rushville include Educational Services (98 | 24.1%), Retail Trade (58 | 14.2%), Finance & Insurance (28 | 6.9%), Public Administration (27 | 6.6%), and Agriculture, Fishing & Hunting (25 | 6.1%).
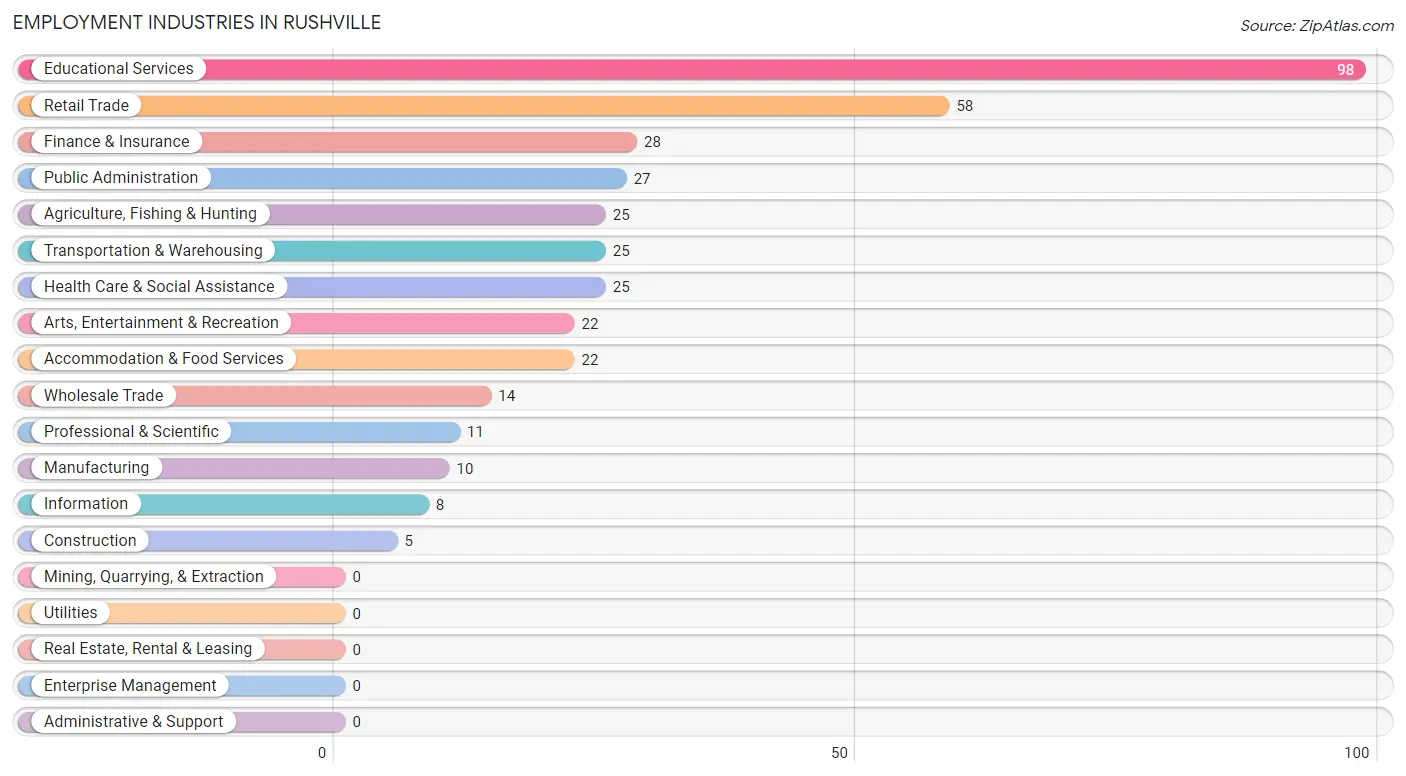
Employment Industries by Sex in Rushville
The Rushville industries that see more men than women are Agriculture, Fishing & Hunting (100.0%), Construction (100.0%), and Retail Trade (86.2%), whereas the industries that tend to have a higher number of women are Health Care & Social Assistance (100.0%), Arts, Entertainment & Recreation (100.0%), and Educational Services (95.9%).
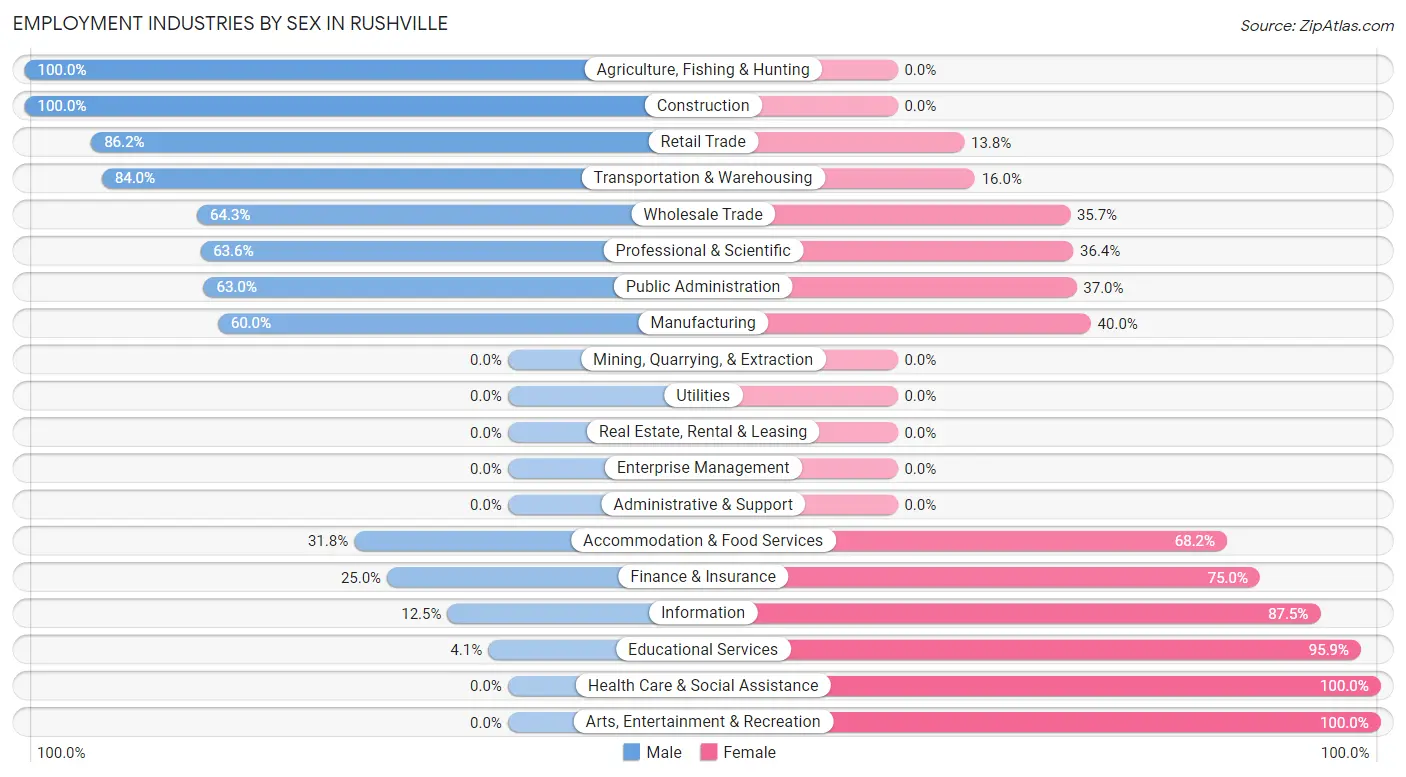
| Industry | Male | Female |
| Agriculture, Fishing & Hunting | 25 (100.0%) | 0 (0.0%) |
| Mining, Quarrying, & Extraction | 0 (0.0%) | 0 (0.0%) |
| Construction | 5 (100.0%) | 0 (0.0%) |
| Manufacturing | 6 (60.0%) | 4 (40.0%) |
| Wholesale Trade | 9 (64.3%) | 5 (35.7%) |
| Retail Trade | 50 (86.2%) | 8 (13.8%) |
| Transportation & Warehousing | 21 (84.0%) | 4 (16.0%) |
| Utilities | 0 (0.0%) | 0 (0.0%) |
| Information | 1 (12.5%) | 7 (87.5%) |
| Finance & Insurance | 7 (25.0%) | 21 (75.0%) |
| Real Estate, Rental & Leasing | 0 (0.0%) | 0 (0.0%) |
| Professional & Scientific | 7 (63.6%) | 4 (36.4%) |
| Enterprise Management | 0 (0.0%) | 0 (0.0%) |
| Administrative & Support | 0 (0.0%) | 0 (0.0%) |
| Educational Services | 4 (4.1%) | 94 (95.9%) |
| Health Care & Social Assistance | 0 (0.0%) | 25 (100.0%) |
| Arts, Entertainment & Recreation | 0 (0.0%) | 22 (100.0%) |
| Accommodation & Food Services | 7 (31.8%) | 15 (68.2%) |
| Public Administration | 17 (63.0%) | 10 (37.0%) |
| Total | 183 (45.0%) | 224 (55.0%) |
Education in Rushville
School Enrollment in Rushville
The most common levels of schooling among the 248 students in Rushville are high school (109 | 44.0%), elementary school (82 | 33.1%), and nursery / preschool (22 | 8.9%).
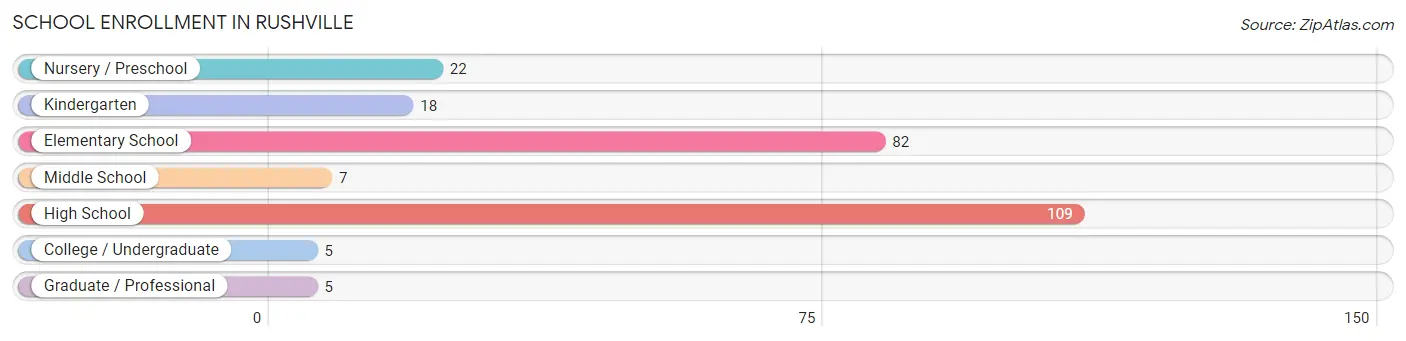
| School Level | # Students | % Students |
| Nursery / Preschool | 22 | 8.9% |
| Kindergarten | 18 | 7.3% |
| Elementary School | 82 | 33.1% |
| Middle School | 7 | 2.8% |
| High School | 109 | 44.0% |
| College / Undergraduate | 5 | 2.0% |
| Graduate / Professional | 5 | 2.0% |
| Total | 248 | 100.0% |
School Enrollment by Age by Funding Source in Rushville
Out of a total of 248 students who are enrolled in schools in Rushville, 6 (2.4%) attend a private institution, while the remaining 242 (97.6%) are enrolled in public schools. The age group of 5 to 9 year old has the highest likelihood of being enrolled in private schools, with 6 (6.8% in the age bracket) enrolled. Conversely, the age group of 3 to 4 year olds has the lowest likelihood of being enrolled in a private school, with 22 (100.0% in the age bracket) attending a public institution.
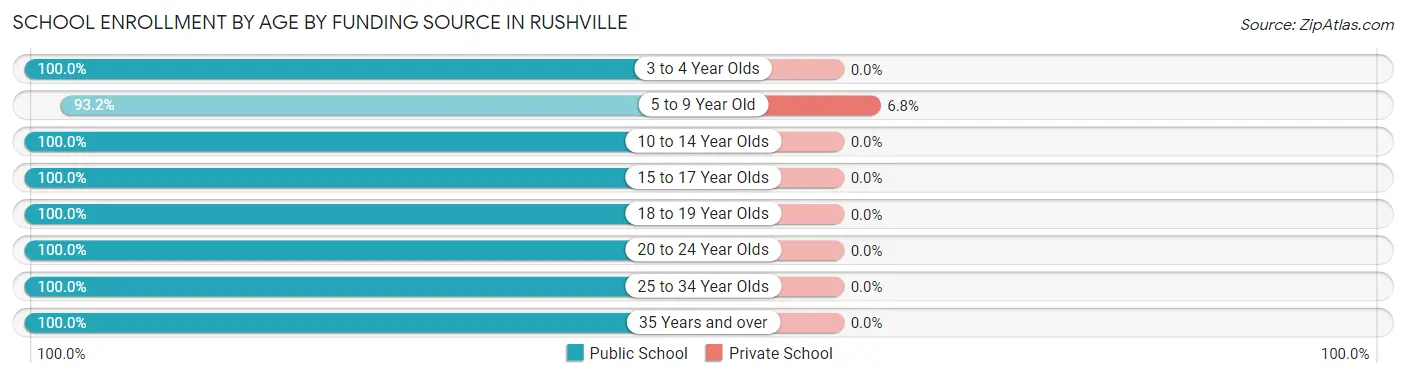
| Age Bracket | Public School | Private School |
| 3 to 4 Year Olds | 22 (100.0%) | 0 (0.0%) |
| 5 to 9 Year Old | 82 (93.2%) | 6 (6.8%) |
| 10 to 14 Year Olds | 19 (100.0%) | 0 (0.0%) |
| 15 to 17 Year Olds | 89 (100.0%) | 0 (0.0%) |
| 18 to 19 Year Olds | 8 (100.0%) | 0 (0.0%) |
| 20 to 24 Year Olds | 5 (100.0%) | 0 (0.0%) |
| 25 to 34 Year Olds | 12 (100.0%) | 0 (0.0%) |
| 35 Years and over | 5 (100.0%) | 0 (0.0%) |
| Total | 242 (97.6%) | 6 (2.4%) |
Educational Attainment by Field of Study in Rushville
Education (53 | 29.4%), science & technology (48 | 26.7%), bio, nature & agricultural (27 | 15.0%), business (17 | 9.4%), and arts & humanities (12 | 6.7%) are the most common fields of study among 180 individuals in Rushville who have obtained a bachelor's degree or higher.
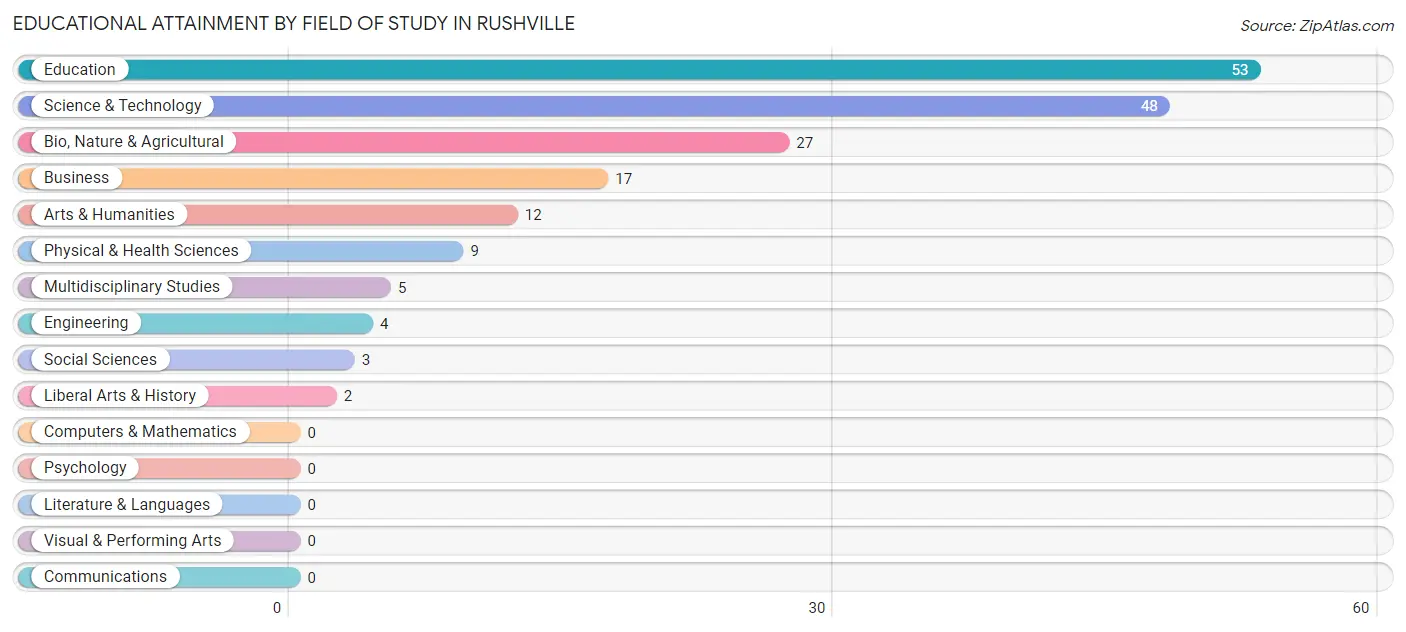
| Field of Study | # Graduates | % Graduates |
| Computers & Mathematics | 0 | 0.0% |
| Bio, Nature & Agricultural | 27 | 15.0% |
| Physical & Health Sciences | 9 | 5.0% |
| Psychology | 0 | 0.0% |
| Social Sciences | 3 | 1.7% |
| Engineering | 4 | 2.2% |
| Multidisciplinary Studies | 5 | 2.8% |
| Science & Technology | 48 | 26.7% |
| Business | 17 | 9.4% |
| Education | 53 | 29.4% |
| Literature & Languages | 0 | 0.0% |
| Liberal Arts & History | 2 | 1.1% |
| Visual & Performing Arts | 0 | 0.0% |
| Communications | 0 | 0.0% |
| Arts & Humanities | 12 | 6.7% |
| Total | 180 | 100.0% |
Transportation & Commute in Rushville
Vehicle Availability by Sex in Rushville
The most prevalent vehicle ownership categories in Rushville are males with 1 vehicle (51, accounting for 27.9%) and females with 1 vehicle (35, making up 22.9%).
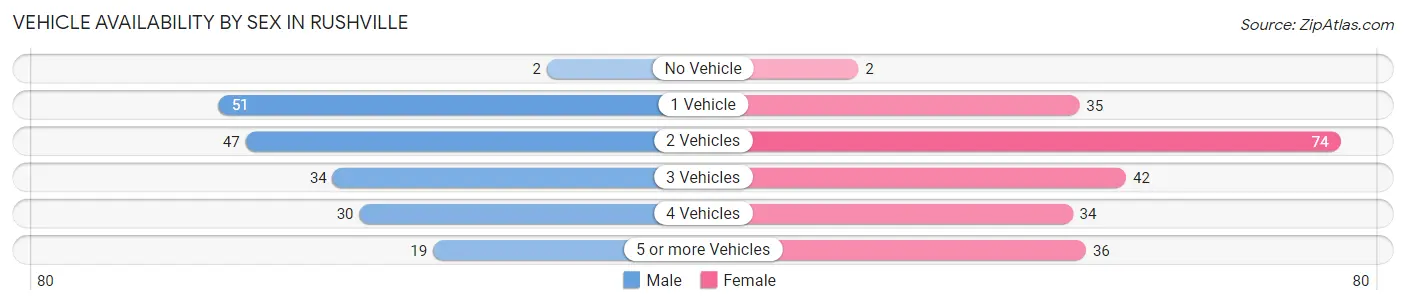
| Vehicles Available | Male | Female |
| No Vehicle | 2 (1.1%) | 2 (0.9%) |
| 1 Vehicle | 51 (27.9%) | 35 (15.7%) |
| 2 Vehicles | 47 (25.7%) | 74 (33.2%) |
| 3 Vehicles | 34 (18.6%) | 42 (18.8%) |
| 4 Vehicles | 30 (16.4%) | 34 (15.2%) |
| 5 or more Vehicles | 19 (10.4%) | 36 (16.1%) |
| Total | 183 (100.0%) | 223 (100.0%) |
Commute Time in Rushville
The most frequently occuring commute durations in Rushville are 5 to 9 minutes (91 commuters, 23.8%), less than 5 minutes (75 commuters, 19.6%), and 15 to 19 minutes (69 commuters, 18.0%).
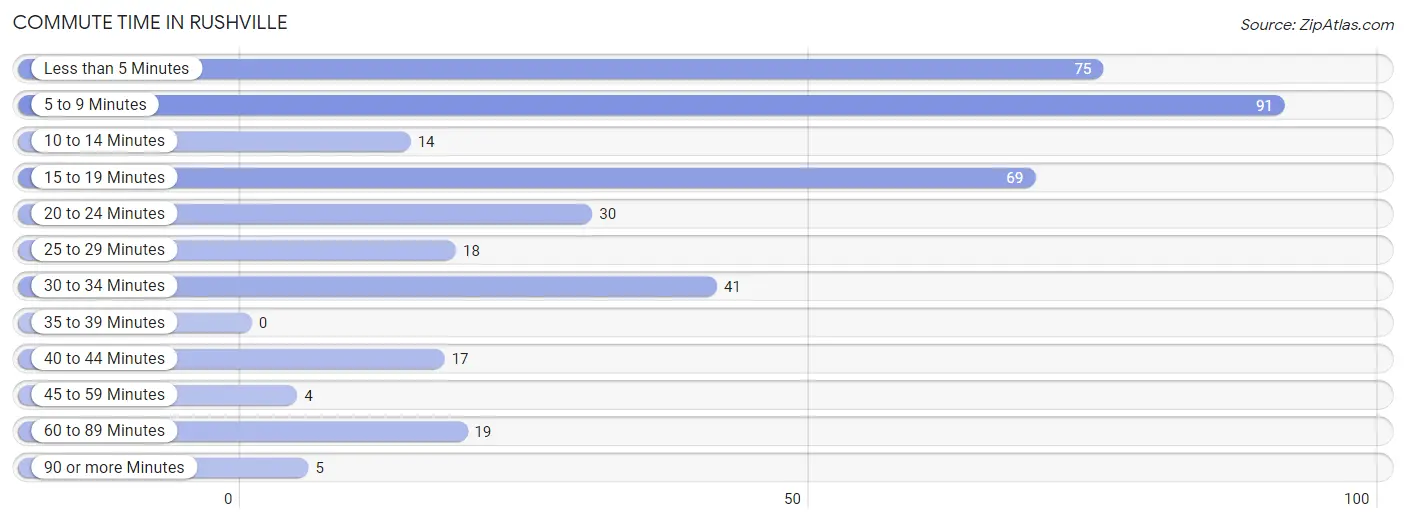
| Commute Time | # Commuters | % Commuters |
| Less than 5 Minutes | 75 | 19.6% |
| 5 to 9 Minutes | 91 | 23.8% |
| 10 to 14 Minutes | 14 | 3.7% |
| 15 to 19 Minutes | 69 | 18.0% |
| 20 to 24 Minutes | 30 | 7.8% |
| 25 to 29 Minutes | 18 | 4.7% |
| 30 to 34 Minutes | 41 | 10.7% |
| 35 to 39 Minutes | 0 | 0.0% |
| 40 to 44 Minutes | 17 | 4.4% |
| 45 to 59 Minutes | 4 | 1.0% |
| 60 to 89 Minutes | 19 | 5.0% |
| 90 or more Minutes | 5 | 1.3% |
Commute Time by Sex in Rushville
The most common commute times in Rushville are 5 to 9 minutes (41 commuters, 24.0%) for males and 5 to 9 minutes (50 commuters, 23.6%) for females.
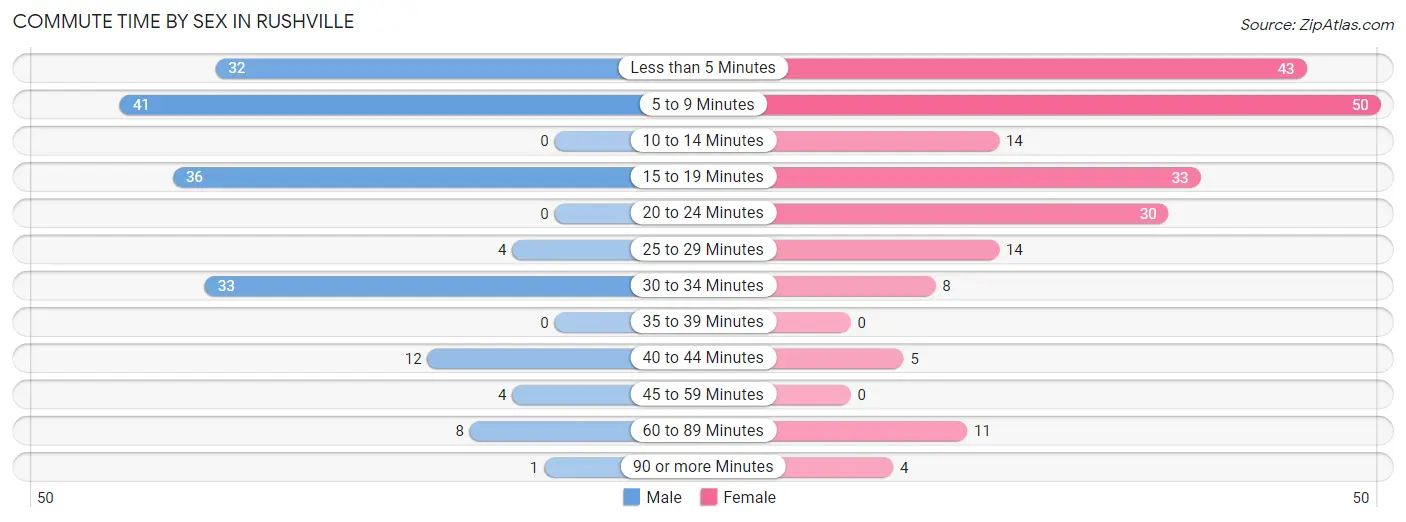
| Commute Time | Male | Female |
| Less than 5 Minutes | 32 (18.7%) | 43 (20.3%) |
| 5 to 9 Minutes | 41 (24.0%) | 50 (23.6%) |
| 10 to 14 Minutes | 0 (0.0%) | 14 (6.6%) |
| 15 to 19 Minutes | 36 (21.0%) | 33 (15.6%) |
| 20 to 24 Minutes | 0 (0.0%) | 30 (14.1%) |
| 25 to 29 Minutes | 4 (2.3%) | 14 (6.6%) |
| 30 to 34 Minutes | 33 (19.3%) | 8 (3.8%) |
| 35 to 39 Minutes | 0 (0.0%) | 0 (0.0%) |
| 40 to 44 Minutes | 12 (7.0%) | 5 (2.4%) |
| 45 to 59 Minutes | 4 (2.3%) | 0 (0.0%) |
| 60 to 89 Minutes | 8 (4.7%) | 11 (5.2%) |
| 90 or more Minutes | 1 (0.6%) | 4 (1.9%) |
Time of Departure to Work by Sex in Rushville
The most frequent times of departure to work in Rushville are 6:30 AM to 6:59 AM (32, 18.7%) for males and 7:00 AM to 7:29 AM (52, 24.5%) for females.
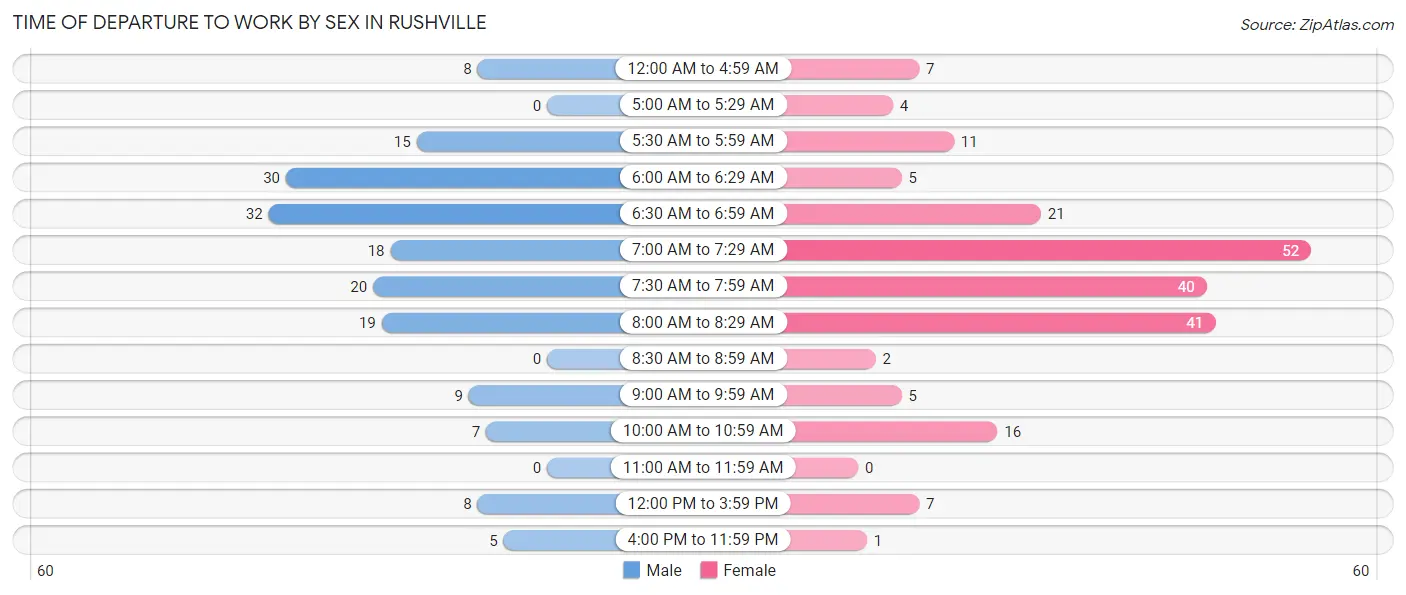
| Time of Departure | Male | Female |
| 12:00 AM to 4:59 AM | 8 (4.7%) | 7 (3.3%) |
| 5:00 AM to 5:29 AM | 0 (0.0%) | 4 (1.9%) |
| 5:30 AM to 5:59 AM | 15 (8.8%) | 11 (5.2%) |
| 6:00 AM to 6:29 AM | 30 (17.5%) | 5 (2.4%) |
| 6:30 AM to 6:59 AM | 32 (18.7%) | 21 (9.9%) |
| 7:00 AM to 7:29 AM | 18 (10.5%) | 52 (24.5%) |
| 7:30 AM to 7:59 AM | 20 (11.7%) | 40 (18.9%) |
| 8:00 AM to 8:29 AM | 19 (11.1%) | 41 (19.3%) |
| 8:30 AM to 8:59 AM | 0 (0.0%) | 2 (0.9%) |
| 9:00 AM to 9:59 AM | 9 (5.3%) | 5 (2.4%) |
| 10:00 AM to 10:59 AM | 7 (4.1%) | 16 (7.5%) |
| 11:00 AM to 11:59 AM | 0 (0.0%) | 0 (0.0%) |
| 12:00 PM to 3:59 PM | 8 (4.7%) | 7 (3.3%) |
| 4:00 PM to 11:59 PM | 5 (2.9%) | 1 (0.5%) |
| Total | 171 (100.0%) | 212 (100.0%) |
Housing Occupancy in Rushville
Occupancy by Ownership in Rushville
Of the total 409 dwellings in Rushville, owner-occupied units account for 237 (58.0%), while renter-occupied units make up 172 (42.0%).
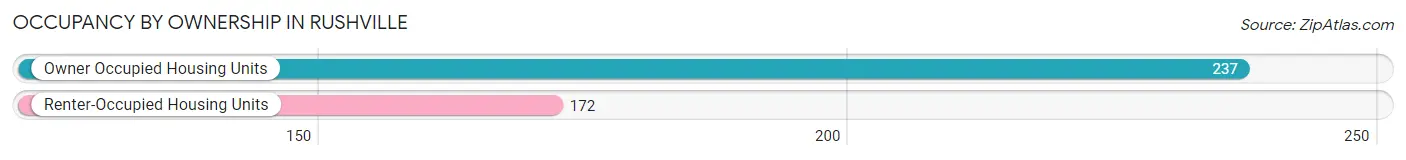
| Occupancy | # Housing Units | % Housing Units |
| Owner Occupied Housing Units | 237 | 58.0% |
| Renter-Occupied Housing Units | 172 | 42.0% |
| Total Occupied Housing Units | 409 | 100.0% |
Occupancy by Household Size in Rushville
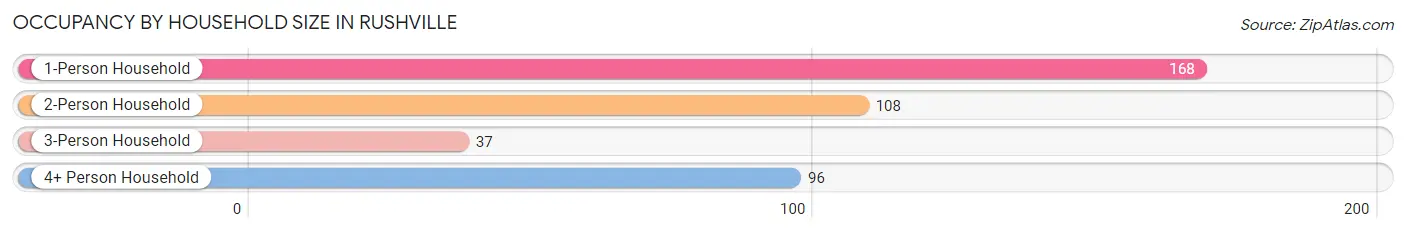
| Household Size | # Housing Units | % Housing Units |
| 1-Person Household | 168 | 41.1% |
| 2-Person Household | 108 | 26.4% |
| 3-Person Household | 37 | 9.0% |
| 4+ Person Household | 96 | 23.5% |
| Total Housing Units | 409 | 100.0% |
Occupancy by Ownership by Household Size in Rushville
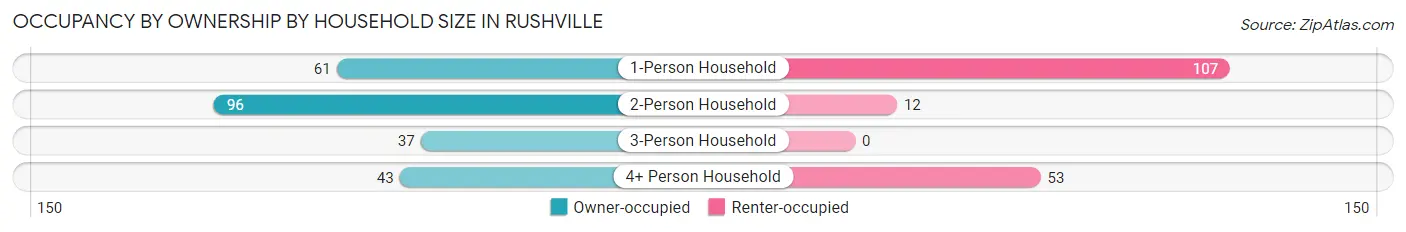
| Household Size | Owner-occupied | Renter-occupied |
| 1-Person Household | 61 (36.3%) | 107 (63.7%) |
| 2-Person Household | 96 (88.9%) | 12 (11.1%) |
| 3-Person Household | 37 (100.0%) | 0 (0.0%) |
| 4+ Person Household | 43 (44.8%) | 53 (55.2%) |
| Total Housing Units | 237 (58.0%) | 172 (42.0%) |
Occupancy by Educational Attainment in Rushville
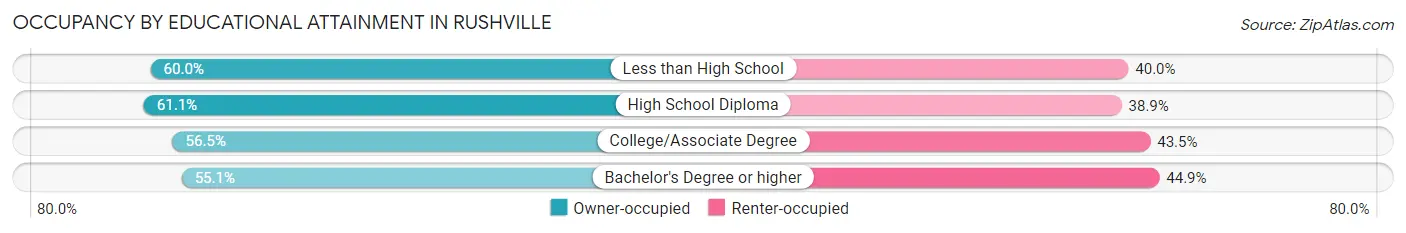
| Household Size | Owner-occupied | Renter-occupied |
| Less than High School | 27 (60.0%) | 18 (40.0%) |
| High School Diploma | 80 (61.1%) | 51 (38.9%) |
| College/Associate Degree | 65 (56.5%) | 50 (43.5%) |
| Bachelor's Degree or higher | 65 (55.1%) | 53 (44.9%) |
Occupancy by Age of Householder in Rushville
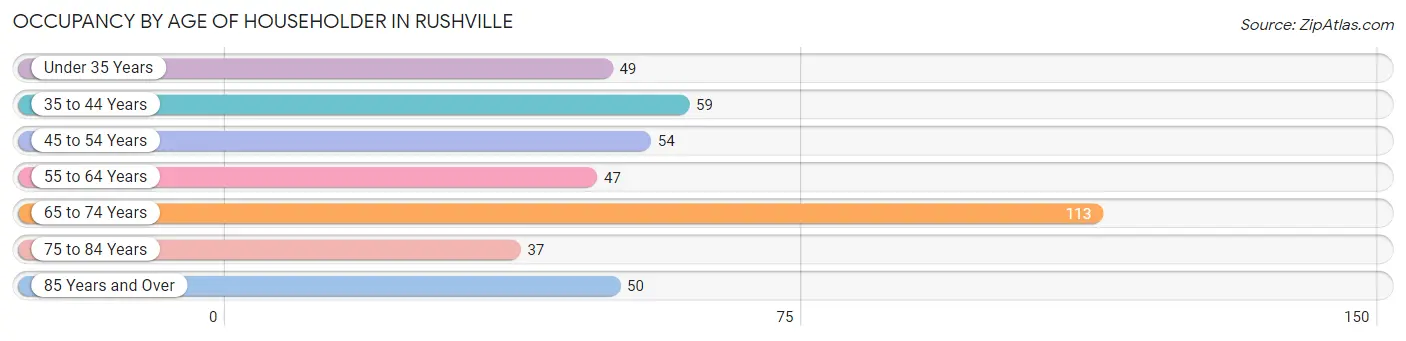
| Age Bracket | # Households | % Households |
| Under 35 Years | 49 | 12.0% |
| 35 to 44 Years | 59 | 14.4% |
| 45 to 54 Years | 54 | 13.2% |
| 55 to 64 Years | 47 | 11.5% |
| 65 to 74 Years | 113 | 27.6% |
| 75 to 84 Years | 37 | 9.0% |
| 85 Years and Over | 50 | 12.2% |
| Total | 409 | 100.0% |
Housing Finances in Rushville
Median Income by Occupancy in Rushville
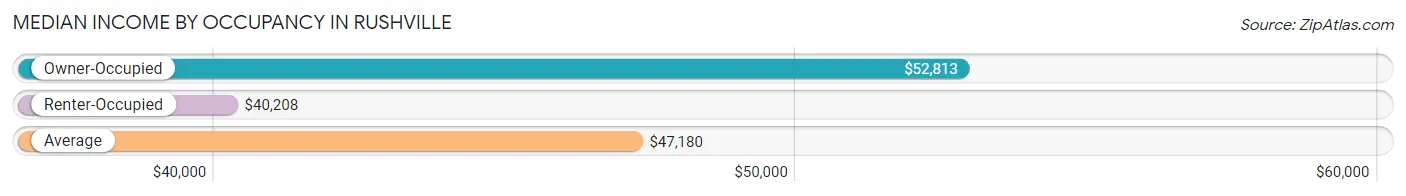
| Occupancy Type | # Households | Median Income |
| Owner-Occupied | 237 (58.0%) | $52,813 |
| Renter-Occupied | 172 (42.0%) | $40,208 |
| Average | 409 (100.0%) | $47,180 |
Occupancy by Householder Income Bracket in Rushville
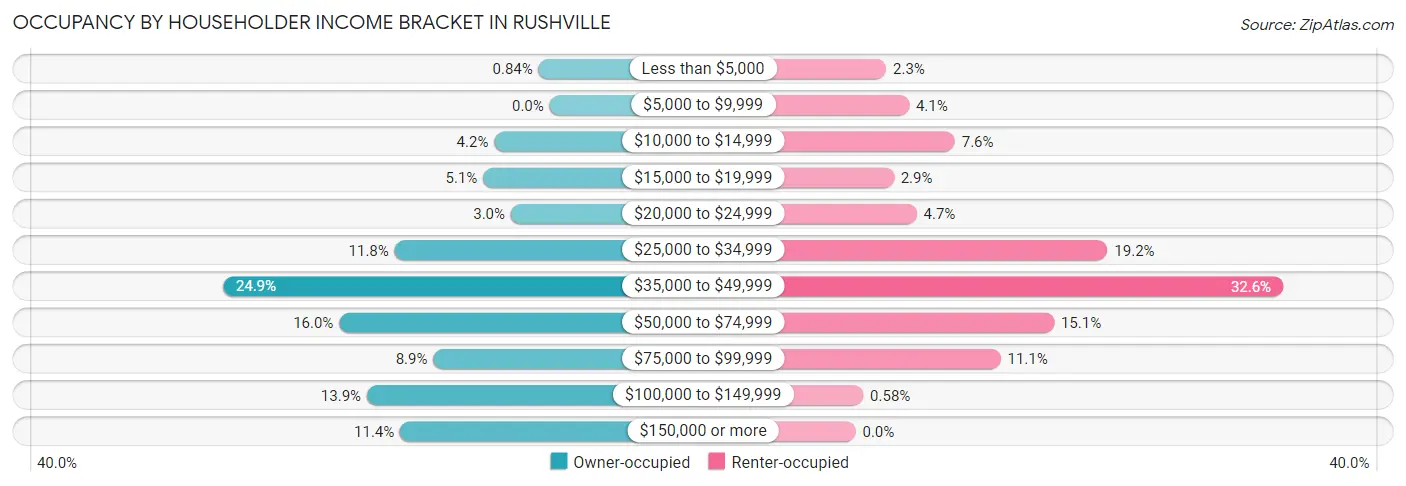
| Income Bracket | Owner-occupied | Renter-occupied |
| Less than $5,000 | 2 (0.8%) | 4 (2.3%) |
| $5,000 to $9,999 | 0 (0.0%) | 7 (4.1%) |
| $10,000 to $14,999 | 10 (4.2%) | 13 (7.6%) |
| $15,000 to $19,999 | 12 (5.1%) | 5 (2.9%) |
| $20,000 to $24,999 | 7 (2.9%) | 8 (4.6%) |
| $25,000 to $34,999 | 28 (11.8%) | 33 (19.2%) |
| $35,000 to $49,999 | 59 (24.9%) | 56 (32.6%) |
| $50,000 to $74,999 | 38 (16.0%) | 26 (15.1%) |
| $75,000 to $99,999 | 21 (8.9%) | 19 (11.1%) |
| $100,000 to $149,999 | 33 (13.9%) | 1 (0.6%) |
| $150,000 or more | 27 (11.4%) | 0 (0.0%) |
| Total | 237 (100.0%) | 172 (100.0%) |
Monthly Housing Cost Tiers in Rushville
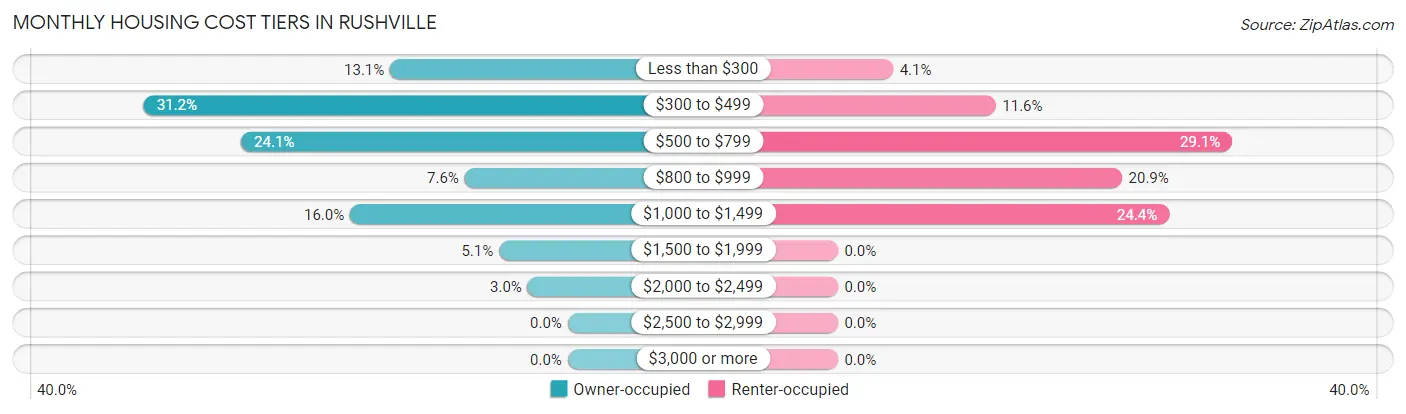
| Monthly Cost | Owner-occupied | Renter-occupied |
| Less than $300 | 31 (13.1%) | 7 (4.1%) |
| $300 to $499 | 74 (31.2%) | 20 (11.6%) |
| $500 to $799 | 57 (24.0%) | 50 (29.1%) |
| $800 to $999 | 18 (7.6%) | 36 (20.9%) |
| $1,000 to $1,499 | 38 (16.0%) | 42 (24.4%) |
| $1,500 to $1,999 | 12 (5.1%) | 0 (0.0%) |
| $2,000 to $2,499 | 7 (2.9%) | 0 (0.0%) |
| $2,500 to $2,999 | 0 (0.0%) | 0 (0.0%) |
| $3,000 or more | 0 (0.0%) | 0 (0.0%) |
| Total | 237 (100.0%) | 172 (100.0%) |
Physical Housing Characteristics in Rushville
Housing Structures in Rushville
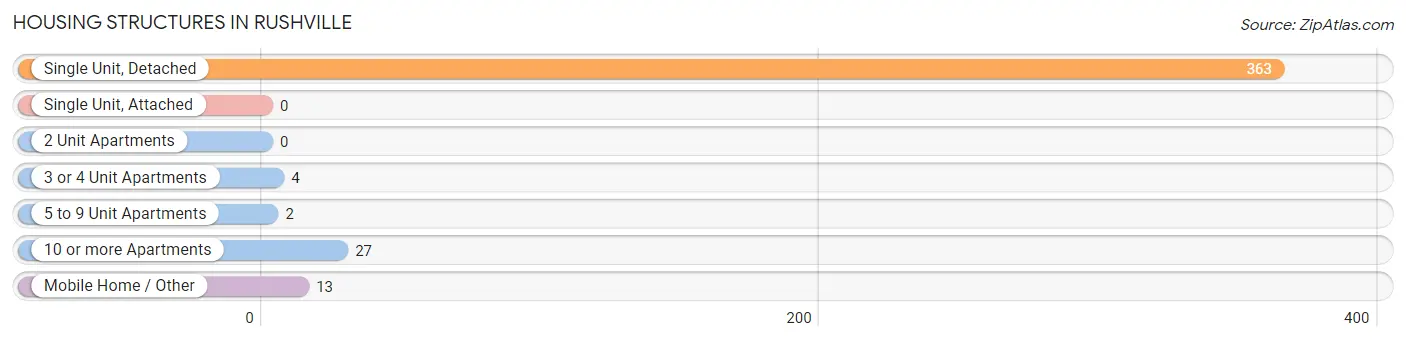
| Structure Type | # Housing Units | % Housing Units |
| Single Unit, Detached | 363 | 88.7% |
| Single Unit, Attached | 0 | 0.0% |
| 2 Unit Apartments | 0 | 0.0% |
| 3 or 4 Unit Apartments | 4 | 1.0% |
| 5 to 9 Unit Apartments | 2 | 0.5% |
| 10 or more Apartments | 27 | 6.6% |
| Mobile Home / Other | 13 | 3.2% |
| Total | 409 | 100.0% |
Housing Structures by Occupancy in Rushville
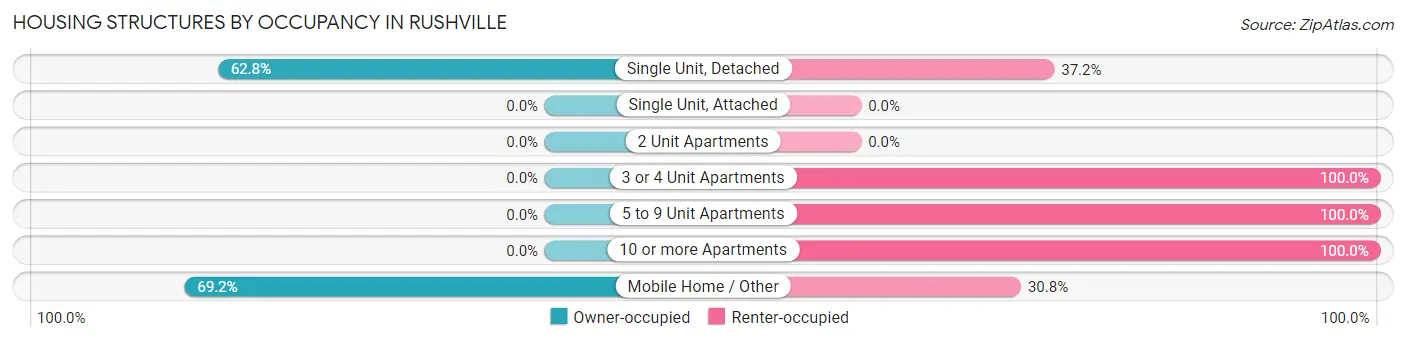
| Structure Type | Owner-occupied | Renter-occupied |
| Single Unit, Detached | 228 (62.8%) | 135 (37.2%) |
| Single Unit, Attached | 0 (0.0%) | 0 (0.0%) |
| 2 Unit Apartments | 0 (0.0%) | 0 (0.0%) |
| 3 or 4 Unit Apartments | 0 (0.0%) | 4 (100.0%) |
| 5 to 9 Unit Apartments | 0 (0.0%) | 2 (100.0%) |
| 10 or more Apartments | 0 (0.0%) | 27 (100.0%) |
| Mobile Home / Other | 9 (69.2%) | 4 (30.8%) |
| Total | 237 (58.0%) | 172 (42.0%) |
Housing Structures by Number of Rooms in Rushville
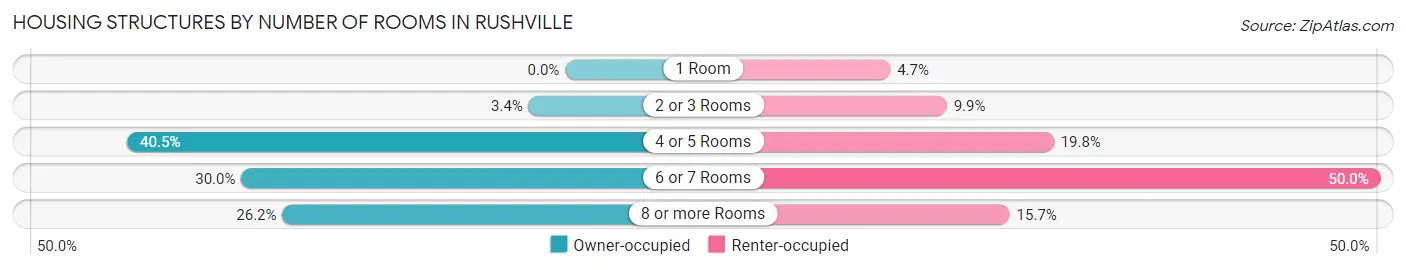
| Number of Rooms | Owner-occupied | Renter-occupied |
| 1 Room | 0 (0.0%) | 8 (4.6%) |
| 2 or 3 Rooms | 8 (3.4%) | 17 (9.9%) |
| 4 or 5 Rooms | 96 (40.5%) | 34 (19.8%) |
| 6 or 7 Rooms | 71 (30.0%) | 86 (50.0%) |
| 8 or more Rooms | 62 (26.2%) | 27 (15.7%) |
| Total | 237 (100.0%) | 172 (100.0%) |
Housing Structure by Heating Type in Rushville
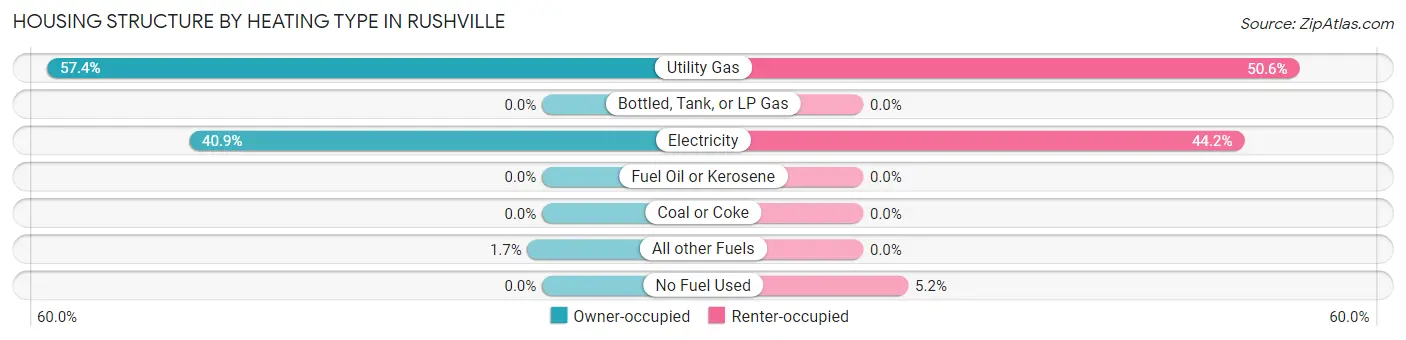
| Heating Type | Owner-occupied | Renter-occupied |
| Utility Gas | 136 (57.4%) | 87 (50.6%) |
| Bottled, Tank, or LP Gas | 0 (0.0%) | 0 (0.0%) |
| Electricity | 97 (40.9%) | 76 (44.2%) |
| Fuel Oil or Kerosene | 0 (0.0%) | 0 (0.0%) |
| Coal or Coke | 0 (0.0%) | 0 (0.0%) |
| All other Fuels | 4 (1.7%) | 0 (0.0%) |
| No Fuel Used | 0 (0.0%) | 9 (5.2%) |
| Total | 237 (100.0%) | 172 (100.0%) |
Household Vehicle Usage in Rushville
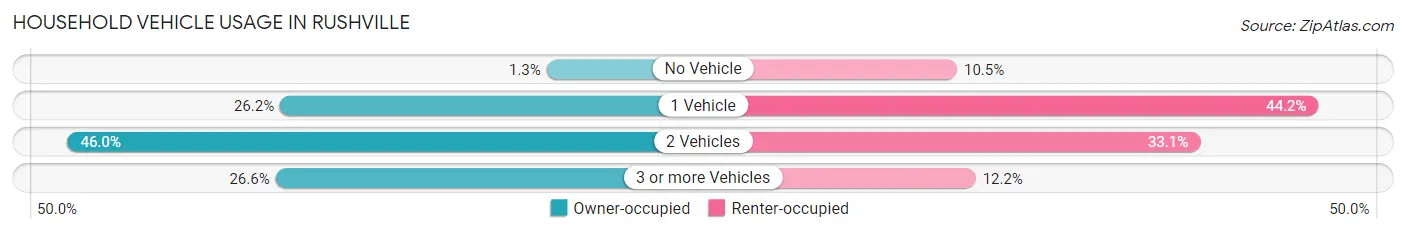
| Vehicles per Household | Owner-occupied | Renter-occupied |
| No Vehicle | 3 (1.3%) | 18 (10.5%) |
| 1 Vehicle | 62 (26.2%) | 76 (44.2%) |
| 2 Vehicles | 109 (46.0%) | 57 (33.1%) |
| 3 or more Vehicles | 63 (26.6%) | 21 (12.2%) |
| Total | 237 (100.0%) | 172 (100.0%) |
Real Estate & Mortgages in Rushville
Real Estate and Mortgage Overview in Rushville
| Characteristic | Without Mortgage | With Mortgage |
| Housing Units | 151 | 86 |
| Median Property Value | $66,900 | $151,700 |
| Median Household Income | $46,285 | $12 |
| Monthly Housing Costs | $426 | $0 |
| Real Estate Taxes | $783 | $3 |
Property Value by Mortgage Status in Rushville
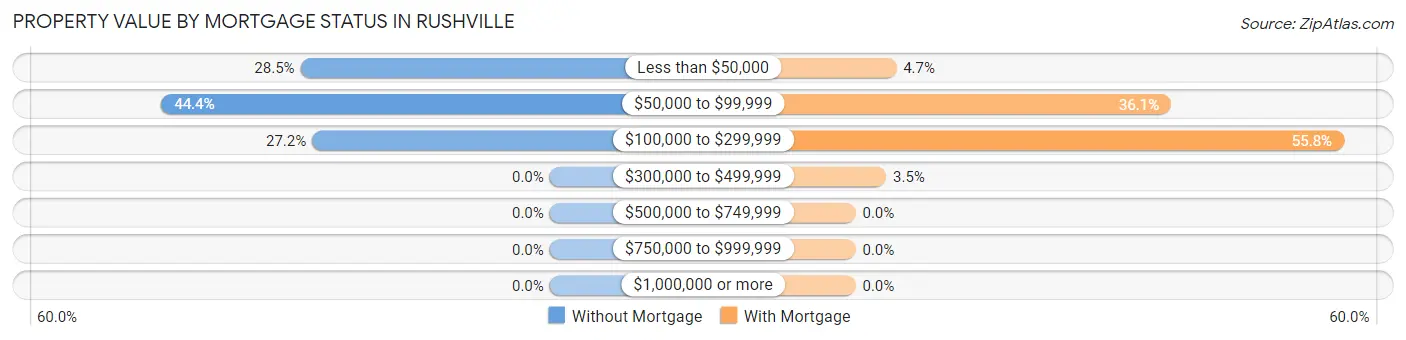
| Property Value | Without Mortgage | With Mortgage |
| Less than $50,000 | 43 (28.5%) | 4 (4.6%) |
| $50,000 to $99,999 | 67 (44.4%) | 31 (36.0%) |
| $100,000 to $299,999 | 41 (27.2%) | 48 (55.8%) |
| $300,000 to $499,999 | 0 (0.0%) | 3 (3.5%) |
| $500,000 to $749,999 | 0 (0.0%) | 0 (0.0%) |
| $750,000 to $999,999 | 0 (0.0%) | 0 (0.0%) |
| $1,000,000 or more | 0 (0.0%) | 0 (0.0%) |
| Total | 151 (100.0%) | 86 (100.0%) |
Household Income by Mortgage Status in Rushville
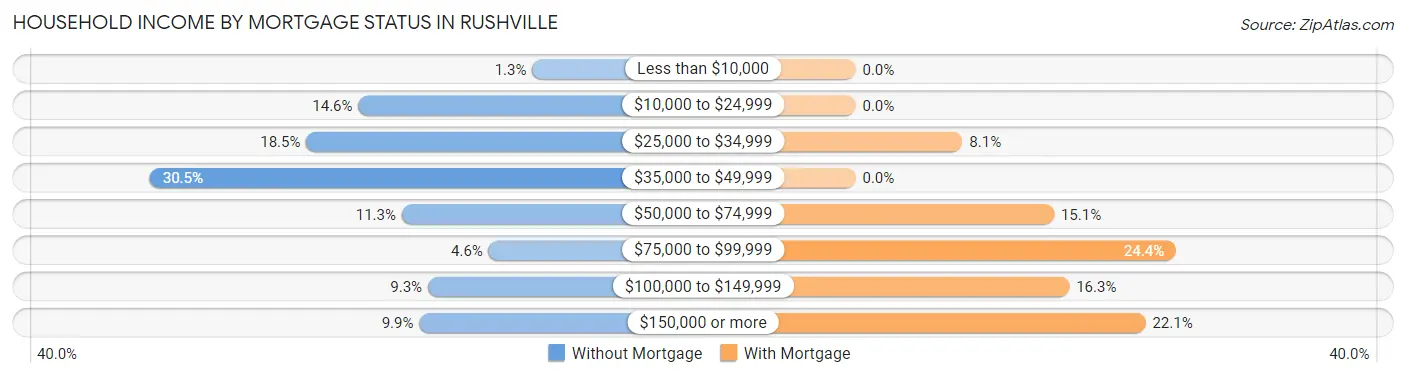
| Household Income | Without Mortgage | With Mortgage |
| Less than $10,000 | 2 (1.3%) | 0 (0.0%) |
| $10,000 to $24,999 | 22 (14.6%) | 0 (0.0%) |
| $25,000 to $34,999 | 28 (18.5%) | 7 (8.1%) |
| $35,000 to $49,999 | 46 (30.5%) | 0 (0.0%) |
| $50,000 to $74,999 | 17 (11.3%) | 13 (15.1%) |
| $75,000 to $99,999 | 7 (4.6%) | 21 (24.4%) |
| $100,000 to $149,999 | 14 (9.3%) | 14 (16.3%) |
| $150,000 or more | 15 (9.9%) | 19 (22.1%) |
| Total | 151 (100.0%) | 86 (100.0%) |
Property Value to Household Income Ratio in Rushville
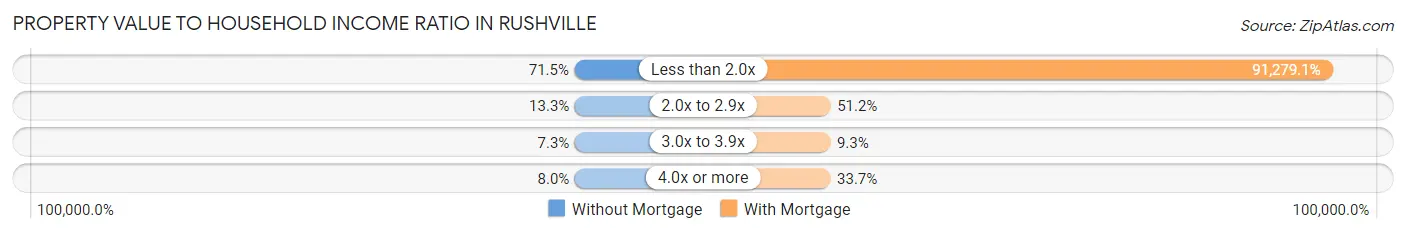
| Value-to-Income Ratio | Without Mortgage | With Mortgage |
| Less than 2.0x | 108 (71.5%) | 78,500 (91,279.1%) |
| 2.0x to 2.9x | 20 (13.3%) | 44 (51.2%) |
| 3.0x to 3.9x | 11 (7.3%) | 8 (9.3%) |
| 4.0x or more | 12 (8.0%) | 29 (33.7%) |
| Total | 151 (100.0%) | 86 (100.0%) |
Real Estate Taxes by Mortgage Status in Rushville
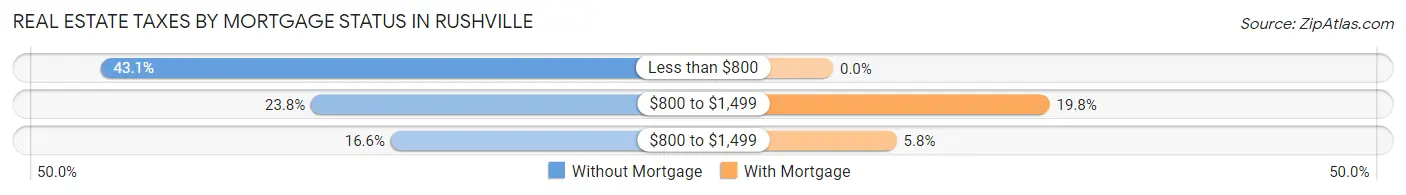
| Property Taxes | Without Mortgage | With Mortgage |
| Less than $800 | 65 (43.0%) | 0 (0.0%) |
| $800 to $1,499 | 36 (23.8%) | 17 (19.8%) |
| $800 to $1,499 | 25 (16.6%) | 5 (5.8%) |
| Total | 151 (100.0%) | 86 (100.0%) |
Health & Disability in Rushville
Health Insurance Coverage by Age in Rushville
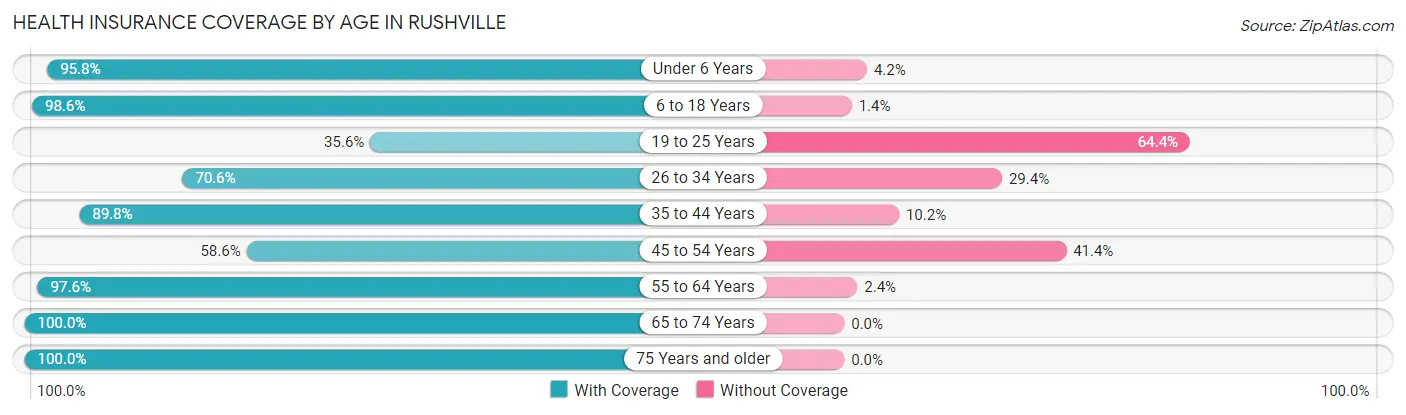
| Age Bracket | With Coverage | Without Coverage |
| Under 6 Years | 68 (95.8%) | 3 (4.2%) |
| 6 to 18 Years | 213 (98.6%) | 3 (1.4%) |
| 19 to 25 Years | 16 (35.6%) | 29 (64.4%) |
| 26 to 34 Years | 60 (70.6%) | 25 (29.4%) |
| 35 to 44 Years | 88 (89.8%) | 10 (10.2%) |
| 45 to 54 Years | 68 (58.6%) | 48 (41.4%) |
| 55 to 64 Years | 80 (97.6%) | 2 (2.4%) |
| 65 to 74 Years | 140 (100.0%) | 0 (0.0%) |
| 75 Years and older | 126 (100.0%) | 0 (0.0%) |
| Total | 859 (87.7%) | 120 (12.3%) |
Health Insurance Coverage by Citizenship Status in Rushville
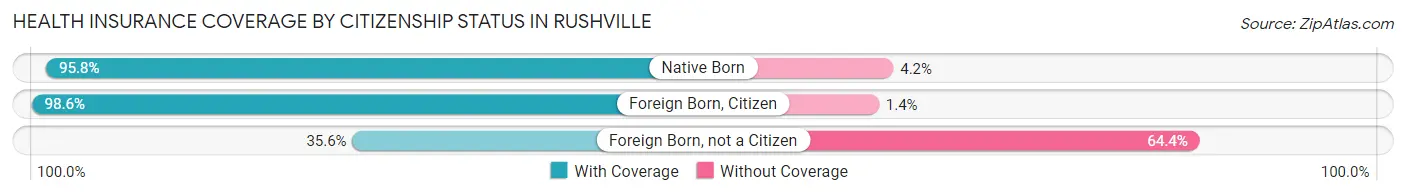
| Citizenship Status | With Coverage | Without Coverage |
| Native Born | 68 (95.8%) | 3 (4.2%) |
| Foreign Born, Citizen | 213 (98.6%) | 3 (1.4%) |
| Foreign Born, not a Citizen | 16 (35.6%) | 29 (64.4%) |
Health Insurance Coverage by Household Income in Rushville
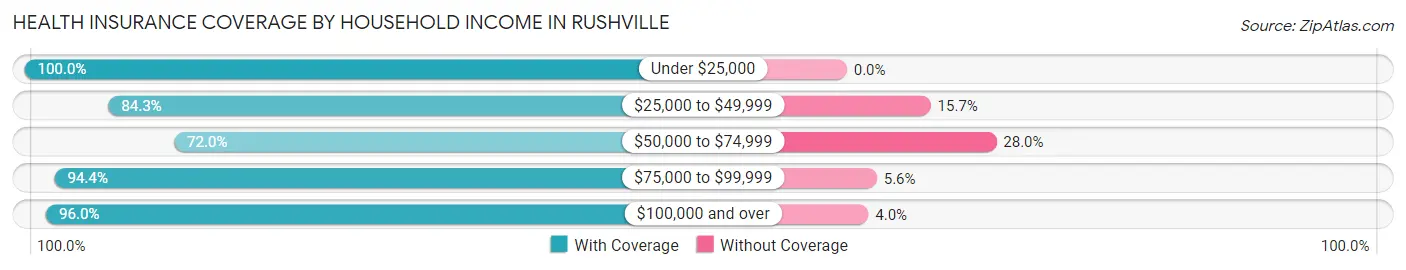
| Household Income | With Coverage | Without Coverage |
| Under $25,000 | 109 (100.0%) | 0 (0.0%) |
| $25,000 to $49,999 | 236 (84.3%) | 44 (15.7%) |
| $50,000 to $74,999 | 149 (72.0%) | 58 (28.0%) |
| $75,000 to $99,999 | 151 (94.4%) | 9 (5.6%) |
| $100,000 and over | 214 (96.0%) | 9 (4.0%) |
Public vs Private Health Insurance Coverage by Age in Rushville
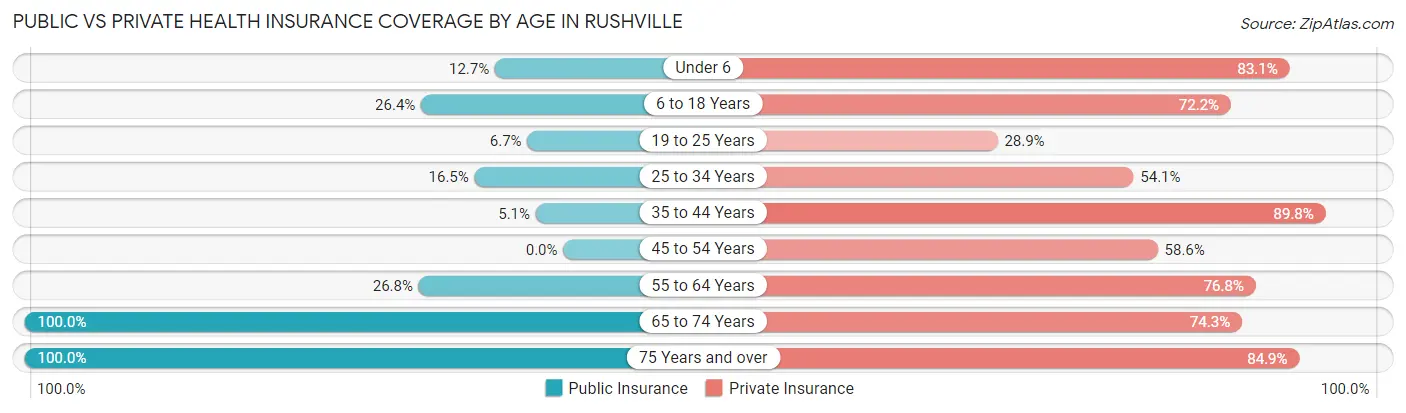
| Age Bracket | Public Insurance | Private Insurance |
| Under 6 | 9 (12.7%) | 59 (83.1%) |
| 6 to 18 Years | 57 (26.4%) | 156 (72.2%) |
| 19 to 25 Years | 3 (6.7%) | 13 (28.9%) |
| 25 to 34 Years | 14 (16.5%) | 46 (54.1%) |
| 35 to 44 Years | 5 (5.1%) | 88 (89.8%) |
| 45 to 54 Years | 0 (0.0%) | 68 (58.6%) |
| 55 to 64 Years | 22 (26.8%) | 63 (76.8%) |
| 65 to 74 Years | 140 (100.0%) | 104 (74.3%) |
| 75 Years and over | 126 (100.0%) | 107 (84.9%) |
| Total | 376 (38.4%) | 704 (71.9%) |
Disability Status by Sex by Age in Rushville
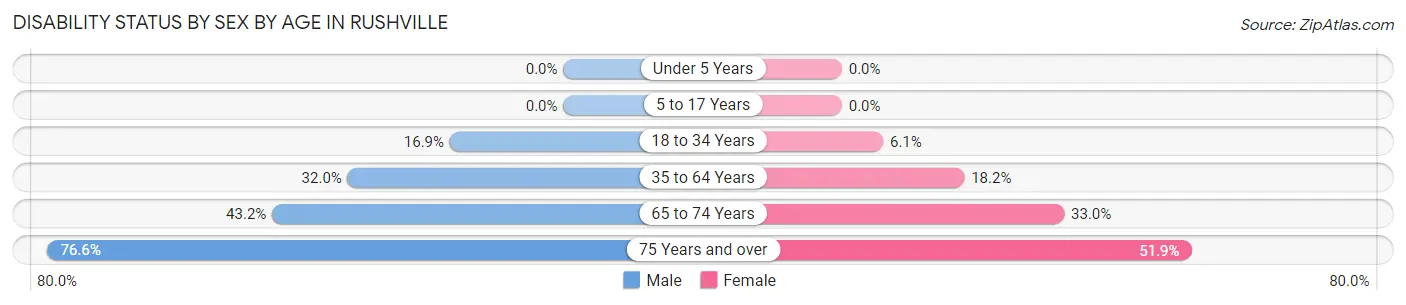
| Age Bracket | Male | Female |
| Under 5 Years | 0 (0.0%) | 0 (0.0%) |
| 5 to 17 Years | 0 (0.0%) | 0 (0.0%) |
| 18 to 34 Years | 15 (16.9%) | 3 (6.1%) |
| 35 to 64 Years | 49 (32.0%) | 26 (18.2%) |
| 65 to 74 Years | 16 (43.2%) | 34 (33.0%) |
| 75 Years and over | 36 (76.6%) | 41 (51.9%) |
Disability Class by Sex by Age in Rushville
Disability Class: Hearing Difficulty
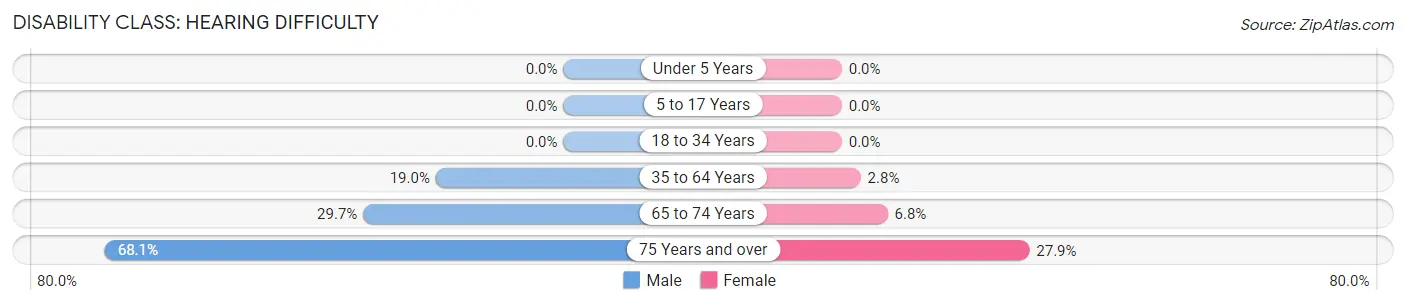
| Age Bracket | Male | Female |
| Under 5 Years | 0 (0.0%) | 0 (0.0%) |
| 5 to 17 Years | 0 (0.0%) | 0 (0.0%) |
| 18 to 34 Years | 0 (0.0%) | 0 (0.0%) |
| 35 to 64 Years | 29 (19.0%) | 4 (2.8%) |
| 65 to 74 Years | 11 (29.7%) | 7 (6.8%) |
| 75 Years and over | 32 (68.1%) | 22 (27.9%) |
Disability Class: Vision Difficulty
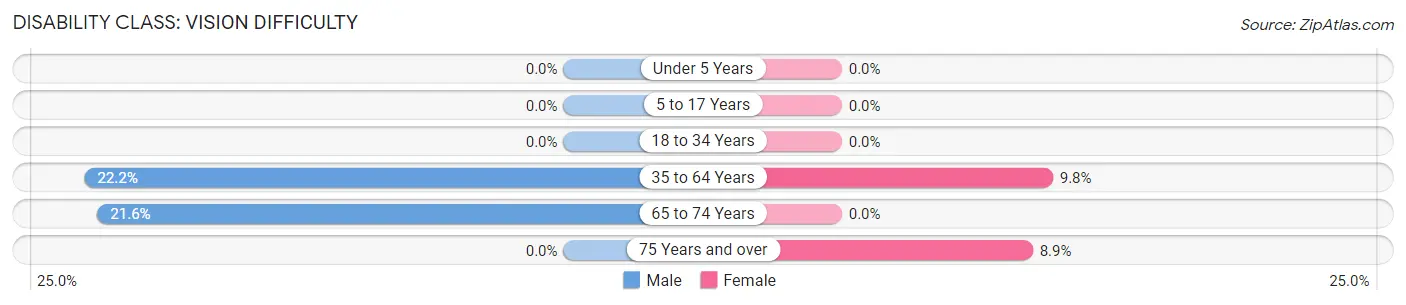
| Age Bracket | Male | Female |
| Under 5 Years | 0 (0.0%) | 0 (0.0%) |
| 5 to 17 Years | 0 (0.0%) | 0 (0.0%) |
| 18 to 34 Years | 0 (0.0%) | 0 (0.0%) |
| 35 to 64 Years | 34 (22.2%) | 14 (9.8%) |
| 65 to 74 Years | 8 (21.6%) | 0 (0.0%) |
| 75 Years and over | 0 (0.0%) | 7 (8.9%) |
Disability Class: Cognitive Difficulty
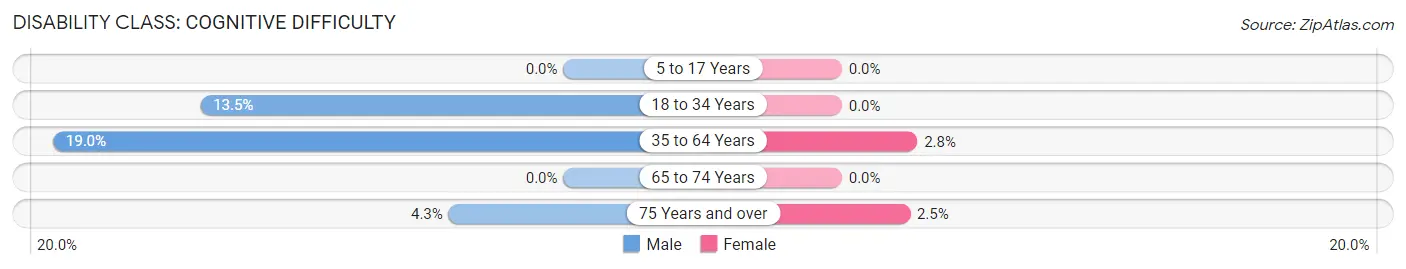
| Age Bracket | Male | Female |
| 5 to 17 Years | 0 (0.0%) | 0 (0.0%) |
| 18 to 34 Years | 12 (13.5%) | 0 (0.0%) |
| 35 to 64 Years | 29 (19.0%) | 4 (2.8%) |
| 65 to 74 Years | 0 (0.0%) | 0 (0.0%) |
| 75 Years and over | 2 (4.3%) | 2 (2.5%) |
Disability Class: Ambulatory Difficulty
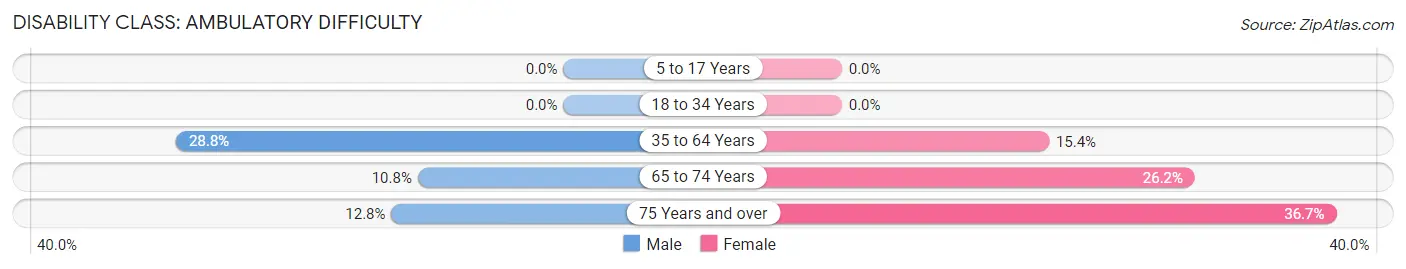
| Age Bracket | Male | Female |
| 5 to 17 Years | 0 (0.0%) | 0 (0.0%) |
| 18 to 34 Years | 0 (0.0%) | 0 (0.0%) |
| 35 to 64 Years | 44 (28.8%) | 22 (15.4%) |
| 65 to 74 Years | 4 (10.8%) | 27 (26.2%) |
| 75 Years and over | 6 (12.8%) | 29 (36.7%) |
Disability Class: Self-Care Difficulty
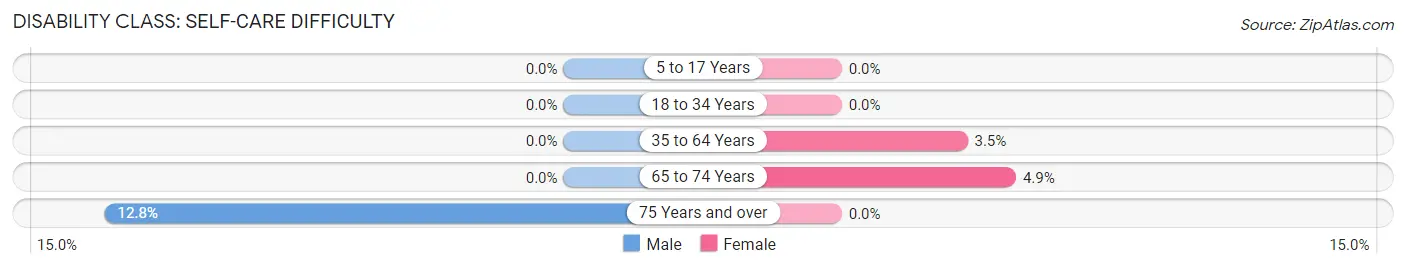
| Age Bracket | Male | Female |
| 5 to 17 Years | 0 (0.0%) | 0 (0.0%) |
| 18 to 34 Years | 0 (0.0%) | 0 (0.0%) |
| 35 to 64 Years | 0 (0.0%) | 5 (3.5%) |
| 65 to 74 Years | 0 (0.0%) | 5 (4.9%) |
| 75 Years and over | 6 (12.8%) | 0 (0.0%) |
Technology Access in Rushville
Computing Device Access in Rushville
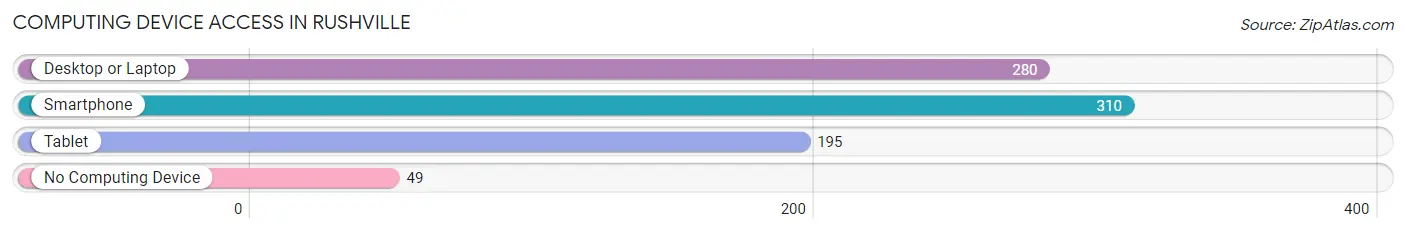
| Device Type | # Households | % Households |
| Desktop or Laptop | 280 | 68.5% |
| Smartphone | 310 | 75.8% |
| Tablet | 195 | 47.7% |
| No Computing Device | 49 | 12.0% |
| Total | 409 | 100.0% |
Internet Access in Rushville
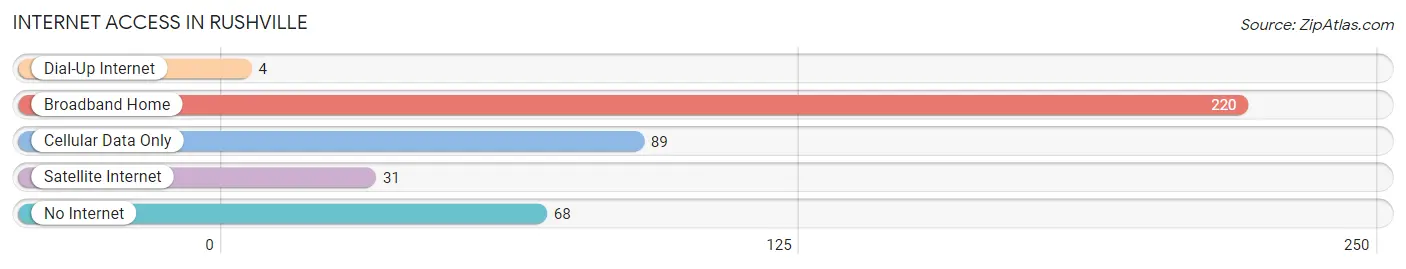
| Internet Type | # Households | % Households |
| Dial-Up Internet | 4 | 1.0% |
| Broadband Home | 220 | 53.8% |
| Cellular Data Only | 89 | 21.8% |
| Satellite Internet | 31 | 7.6% |
| No Internet | 68 | 16.6% |
| Total | 409 | 100.0% |
Rushville Summary
History
The small town of Rushville, Nebraska is located in the northwest corner of the state, in Sheridan County. It was founded in 1887 by the Union Pacific Railroad, and was named after the nearby Rush Creek. The town was originally a stop on the railroad, and the first settlers were mostly ranchers and farmers.
The town grew slowly, but steadily, and by the early 1900s, it had become a bustling community. The town was home to a variety of businesses, including a bank, a hotel, a general store, a blacksmith, and a livery stable. The town also had a school, a post office, and a newspaper.
In the 1920s, the town experienced a period of growth, as the railroad brought in new settlers and businesses. The town was home to a variety of businesses, including a movie theater, a bowling alley, a drug store, and a variety of other stores.
The Great Depression hit Rushville hard, and the town experienced a period of decline. Many of the businesses closed, and the population decreased. However, the town was able to survive, and by the 1950s, it had begun to experience a period of growth.
The town continued to grow throughout the 1960s and 1970s, and by the 1980s, it had become a thriving community. The town was home to a variety of businesses, including a grocery store, a hardware store, a bank, and a variety of other stores.
Geography
Rushville is located in the northwest corner of Nebraska, in Sheridan County. It is situated on the banks of Rush Creek, and is surrounded by rolling hills and prairies. The town is located about 25 miles from the South Dakota border, and about 50 miles from the Wyoming border.
The town is located at an elevation of 3,400 feet, and has a total area of 1.2 square miles. The climate is semi-arid, with hot summers and cold winters. The average annual temperature is around 50 degrees Fahrenheit, and the average annual precipitation is around 16 inches.
Economy
The economy of Rushville is largely based on agriculture. The town is home to a variety of farms, which produce a variety of crops, including corn, wheat, and soybeans. The town is also home to a variety of businesses, including a grocery store, a hardware store, a bank, and a variety of other stores.
The town is also home to a variety of manufacturing businesses, which produce a variety of products, including furniture, clothing, and electronics. The town is also home to a variety of service businesses, which provide a variety of services, including auto repair, plumbing, and landscaping.
Demographics
As of the 2010 census, the population of Rushville was 1,092. The racial makeup of the town was 97.3% White, 0.7% African American, 0.3% Native American, 0.2% Asian, 0.1% Pacific Islander, and 1.4% from other races. The median household income was $41,250, and the median family income was $48,750.
The town is home to a variety of religious denominations, including Catholic, Lutheran, Methodist, and Baptist. The town is also home to a variety of cultural organizations, including a library, a museum, and a theater.
Conclusion
Rushville, Nebraska is a small town located in the northwest corner of the state. It was founded in 1887 by the Union Pacific Railroad, and has since grown into a thriving community. The town is home to a variety of businesses, including a grocery store, a hardware store, a bank, and a variety of other stores. The town is also home to a variety of farms, which produce a variety of crops, including corn, wheat, and soybeans. The town is also home to a variety of manufacturing businesses, which produce a variety of products, including furniture, clothing, and electronics. The population of Rushville was 1,092 as of the 2010 census, and the median household income was $41,250. The town is home to a variety of religious denominations, including Catholic, Lutheran, Methodist, and Baptist. The town is also home to a variety of cultural organizations, including a library, a museum, and a theater.
Common Questions
What is Per Capita Income in Rushville?
Per Capita income in Rushville is $25,007.
What is the Median Family Income in Rushville?
Median Family Income in Rushville is $62,600.
What is the Median Household income in Rushville?
Median Household Income in Rushville is $47,180.
What is Income or Wage Gap in Rushville?
Income or Wage Gap in Rushville is 30.4%.
Women in Rushville earn 69.6 cents for every dollar earned by a man.
What is Inequality or Gini Index in Rushville?
Inequality or Gini Index in Rushville is 0.38.
What is the Total Population of Rushville?
Total Population of Rushville is 1,011.
What is the Total Male Population of Rushville?
Total Male Population of Rushville is 477.
What is the Total Female Population of Rushville?
Total Female Population of Rushville is 534.
What is the Ratio of Males per 100 Females in Rushville?
There are 89.33 Males per 100 Females in Rushville.
What is the Ratio of Females per 100 Males in Rushville?
There are 111.95 Females per 100 Males in Rushville.
What is the Median Population Age in Rushville?
Median Population Age in Rushville is 42.6 Years.
What is the Average Family Size in Rushville
Average Family Size in Rushville is 3.3 People.
What is the Average Household Size in Rushville
Average Household Size in Rushville is 2.4 People.
How Large is the Labor Force in Rushville?
There are 434 People in the Labor Forcein in Rushville.
What is the Percentage of People in the Labor Force in Rushville?
53.0% of People are in the Labor Force in Rushville.
What is the Unemployment Rate in Rushville?
Unemployment Rate in Rushville is 6.2%.