Wayne, NE Map & Demographics
Wayne Map
Wayne Overview
$24,243
PER CAPITA INCOME
$76,121
AVG FAMILY INCOME
$51,399
AVG HOUSEHOLD INCOME
34.2%
WAGE / INCOME GAP [ % ]
65.8¢/ $1
WAGE / INCOME GAP [ $ ]
0.46
INEQUALITY / GINI INDEX
5,973
TOTAL POPULATION
2,967
MALE POPULATION
3,006
FEMALE POPULATION
98.70
MALES / 100 FEMALES
101.31
FEMALES / 100 MALES
23.1
MEDIAN AGE
2.7
AVG FAMILY SIZE
2.2
AVG HOUSEHOLD SIZE
3,561
LABOR FORCE [ PEOPLE ]
69.1%
PERCENT IN LABOR FORCE
4.4%
UNEMPLOYMENT RATE
Wayne Zip Codes
Wayne Area Codes
Income in Wayne
Income Overview in Wayne
Per Capita Income in Wayne is $24,243, while median incomes of families and households are $76,121 and $51,399 respectively.
| Characteristic | Number | Measure |
| Per Capita Income | 5,973 | $24,243 |
| Median Family Income | 1,078 | $76,121 |
| Mean Family Income | 1,078 | $87,693 |
| Median Household Income | 2,160 | $51,399 |
| Mean Household Income | 2,160 | $66,197 |
| Income Deficit | 1,078 | $0 |
| Wage / Income Gap (%) | 5,973 | 34.18% |
| Wage / Income Gap ($) | 5,973 | 65.82¢ per $1 |
| Gini / Inequality Index | 5,973 | 0.46 |
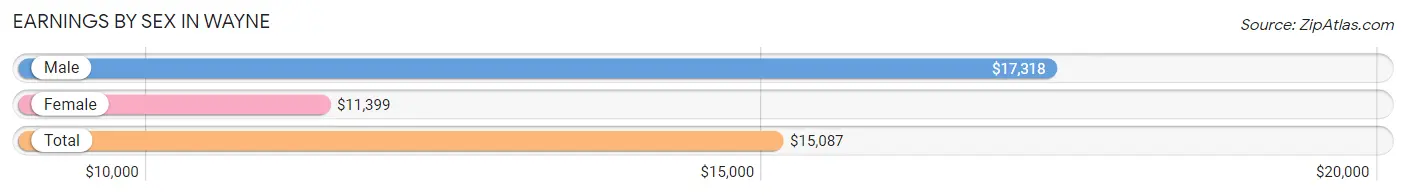
Earnings by Sex in Wayne
Average Earnings in Wayne are $15,087, $17,318 for men and $11,399 for women, a difference of 34.2%.
| Sex | Number | Average Earnings |
| Male | 2,099 (52.0%) | $17,318 |
| Female | 1,936 (48.0%) | $11,399 |
| Total | 4,035 (100.0%) | $15,087 |
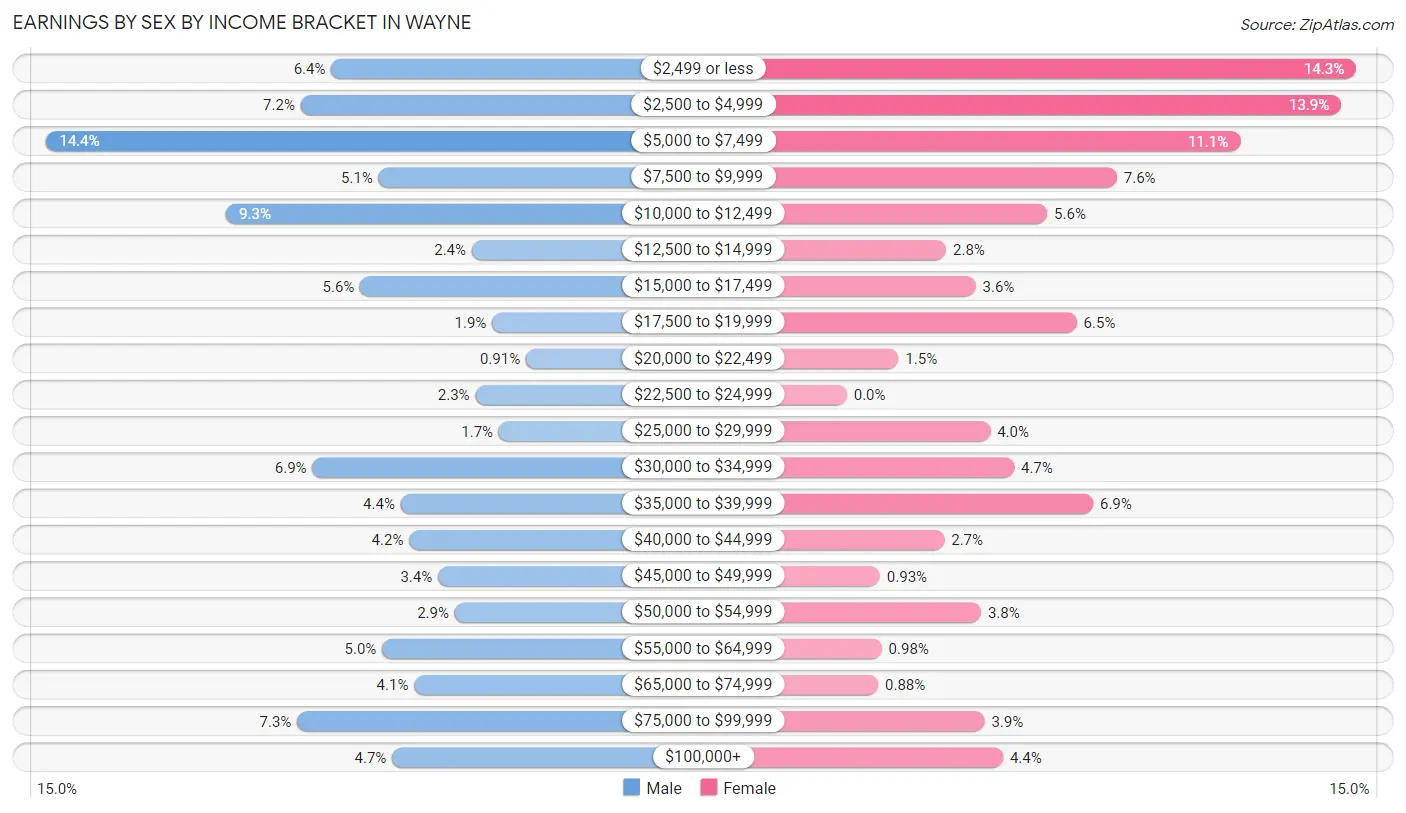
Earnings by Sex by Income Bracket in Wayne
The most common earnings brackets in Wayne are $5,000 to $7,499 for men (302 | 14.4%) and $2,499 or less for women (277 | 14.3%).
| Income | Male | Female |
| $2,499 or less | 134 (6.4%) | 277 (14.3%) |
| $2,500 to $4,999 | 152 (7.2%) | 269 (13.9%) |
| $5,000 to $7,499 | 302 (14.4%) | 214 (11.1%) |
| $7,500 to $9,999 | 106 (5.1%) | 147 (7.6%) |
| $10,000 to $12,499 | 196 (9.3%) | 109 (5.6%) |
| $12,500 to $14,999 | 51 (2.4%) | 54 (2.8%) |
| $15,000 to $17,499 | 117 (5.6%) | 70 (3.6%) |
| $17,500 to $19,999 | 39 (1.9%) | 125 (6.5%) |
| $20,000 to $22,499 | 19 (0.9%) | 28 (1.5%) |
| $22,500 to $24,999 | 49 (2.3%) | 0 (0.0%) |
| $25,000 to $29,999 | 35 (1.7%) | 78 (4.0%) |
| $30,000 to $34,999 | 145 (6.9%) | 91 (4.7%) |
| $35,000 to $39,999 | 93 (4.4%) | 134 (6.9%) |
| $40,000 to $44,999 | 88 (4.2%) | 53 (2.7%) |
| $45,000 to $49,999 | 71 (3.4%) | 18 (0.9%) |
| $50,000 to $54,999 | 61 (2.9%) | 73 (3.8%) |
| $55,000 to $64,999 | 104 (5.0%) | 19 (1.0%) |
| $65,000 to $74,999 | 85 (4.1%) | 17 (0.9%) |
| $75,000 to $99,999 | 154 (7.3%) | 75 (3.9%) |
| $100,000+ | 98 (4.7%) | 85 (4.4%) |
| Total | 2,099 (100.0%) | 1,936 (100.0%) |
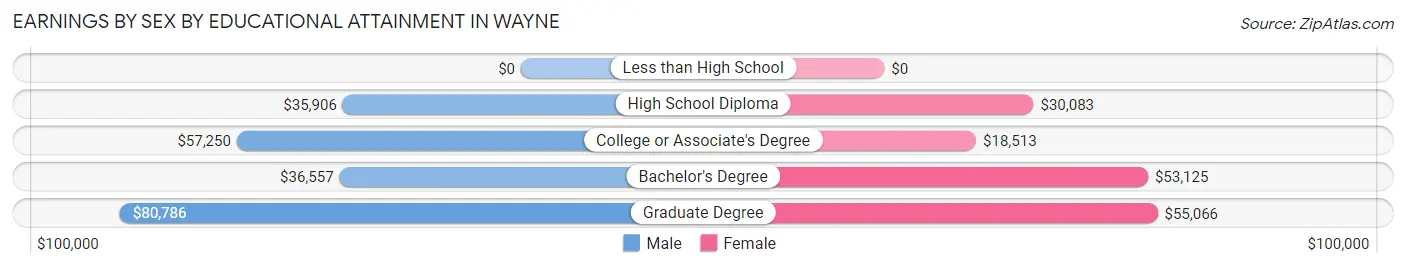
Earnings by Sex by Educational Attainment in Wayne
Average earnings in Wayne are $47,027 for men and $35,265 for women, a difference of 25.0%. Men with an educational attainment of graduate degree enjoy the highest average annual earnings of $80,786, while those with high school diploma education earn the least with $35,906. Women with an educational attainment of graduate degree earn the most with the average annual earnings of $55,066, while those with college or associate's degree education have the smallest earnings of $18,513.
| Educational Attainment | Male Income | Female Income |
| Less than High School | - | - |
| High School Diploma | $35,906 | $30,083 |
| College or Associate's Degree | $57,250 | $18,513 |
| Bachelor's Degree | $36,557 | $53,125 |
| Graduate Degree | $80,786 | $55,066 |
| Total | $47,027 | $35,265 |
Family Income in Wayne
Family Income Brackets in Wayne
According to the Wayne family income data, there are 205 families falling into the $100,000 to $149,999 income range, which is the most common income bracket and makes up 19.0% of all families.
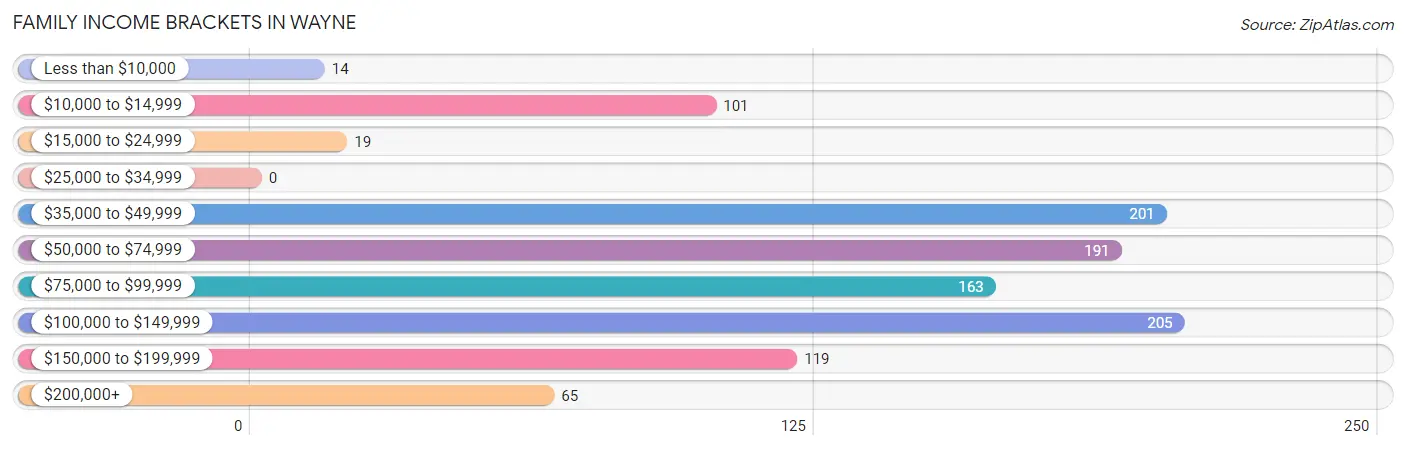
| Income Bracket | # Families | % Families |
| Less than $10,000 | 14 | 1.3% |
| $10,000 to $14,999 | 101 | 9.4% |
| $15,000 to $24,999 | 19 | 1.8% |
| $25,000 to $34,999 | 0 | 0.0% |
| $35,000 to $49,999 | 201 | 18.6% |
| $50,000 to $74,999 | 191 | 17.7% |
| $75,000 to $99,999 | 163 | 15.1% |
| $100,000 to $149,999 | 205 | 19.0% |
| $150,000 to $199,999 | 119 | 11.0% |
| $200,000+ | 65 | 6.0% |
Family Income by Famaliy Size in Wayne
4-person families (87 | 8.1%) account for the highest median family income in Wayne with $155,368 per family, while 4-person families (87 | 8.1%) have the highest median income of $38,842 per family member.
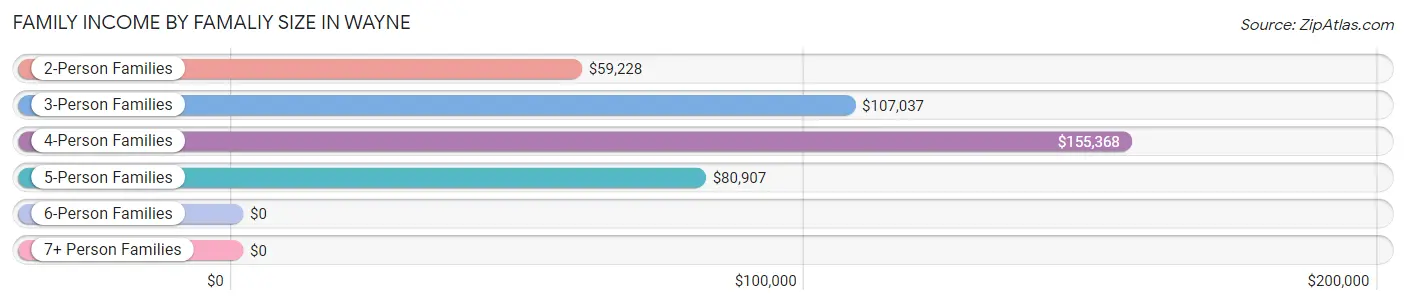
| Income Bracket | # Families | Median Income |
| 2-Person Families | 684 (63.4%) | $59,228 |
| 3-Person Families | 142 (13.2%) | $107,037 |
| 4-Person Families | 87 (8.1%) | $155,368 |
| 5-Person Families | 79 (7.3%) | $80,907 |
| 6-Person Families | 76 (7.0%) | $0 |
| 7+ Person Families | 10 (0.9%) | $0 |
| Total | 1,078 (100.0%) | $76,121 |
Family Income by Number of Earners in Wayne
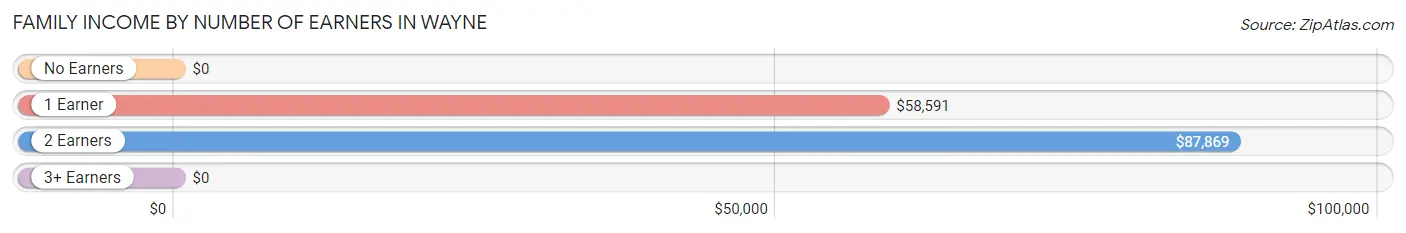
| Number of Earners | # Families | Median Income |
| No Earners | 143 (13.3%) | $0 |
| 1 Earner | 241 (22.4%) | $58,591 |
| 2 Earners | 667 (61.9%) | $87,869 |
| 3+ Earners | 27 (2.5%) | $0 |
| Total | 1,078 (100.0%) | $76,121 |
Household Income in Wayne
Household Income Brackets in Wayne
With 393 households falling in the category, the $50,000 to $74,999 income range is the most frequent in Wayne, accounting for 18.2% of all households. In contrast, only 41 households (1.9%) fall into the $25,000 to $34,999 income bracket, making it the least populous group.
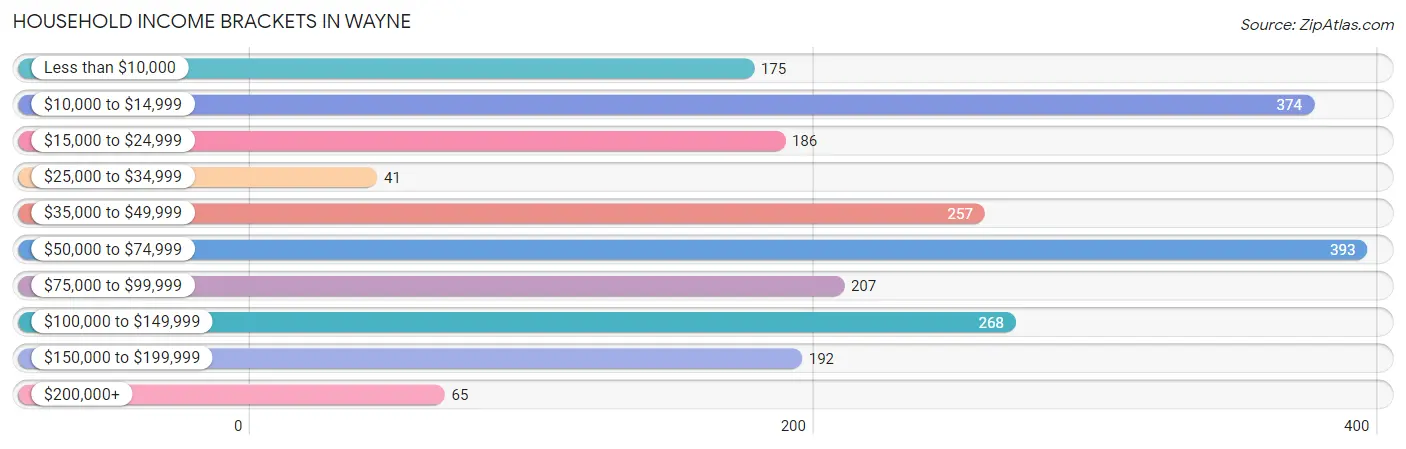
| Income Bracket | # Households | % Households |
| Less than $10,000 | 175 | 8.1% |
| $10,000 to $14,999 | 374 | 17.3% |
| $15,000 to $24,999 | 186 | 8.6% |
| $25,000 to $34,999 | 41 | 1.9% |
| $35,000 to $49,999 | 257 | 11.9% |
| $50,000 to $74,999 | 393 | 18.2% |
| $75,000 to $99,999 | 207 | 9.6% |
| $100,000 to $149,999 | 268 | 12.4% |
| $150,000 to $199,999 | 192 | 8.9% |
| $200,000+ | 65 | 3.0% |
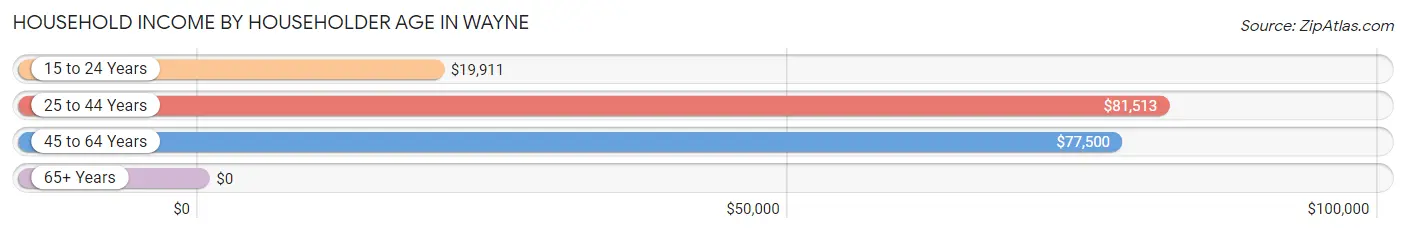
Household Income by Householder Age in Wayne
The median household income in Wayne is $51,399, with the highest median household income of $81,513 found in the 25 to 44 years age bracket for the primary householder. A total of 511 households (23.7%) fall into this category. Meanwhile, the 65+ years age bracket for the primary householder has the lowest median household income of $0, with 598 households (27.7%) in this group.
| Income Bracket | # Households | Median Income |
| 15 to 24 Years | 387 (17.9%) | $19,911 |
| 25 to 44 Years | 511 (23.7%) | $81,513 |
| 45 to 64 Years | 664 (30.7%) | $77,500 |
| 65+ Years | 598 (27.7%) | $0 |
| Total | 2,160 (100.0%) | $51,399 |
Poverty in Wayne
Income Below Poverty by Sex and Age in Wayne
With 21.0% poverty level for males and 30.7% for females among the residents of Wayne, 18 to 24 year old males and 16 and 17 year old females are the most vulnerable to poverty, with 210 males (42.7%) and 70 females (100.0%) in their respective age groups living below the poverty level.
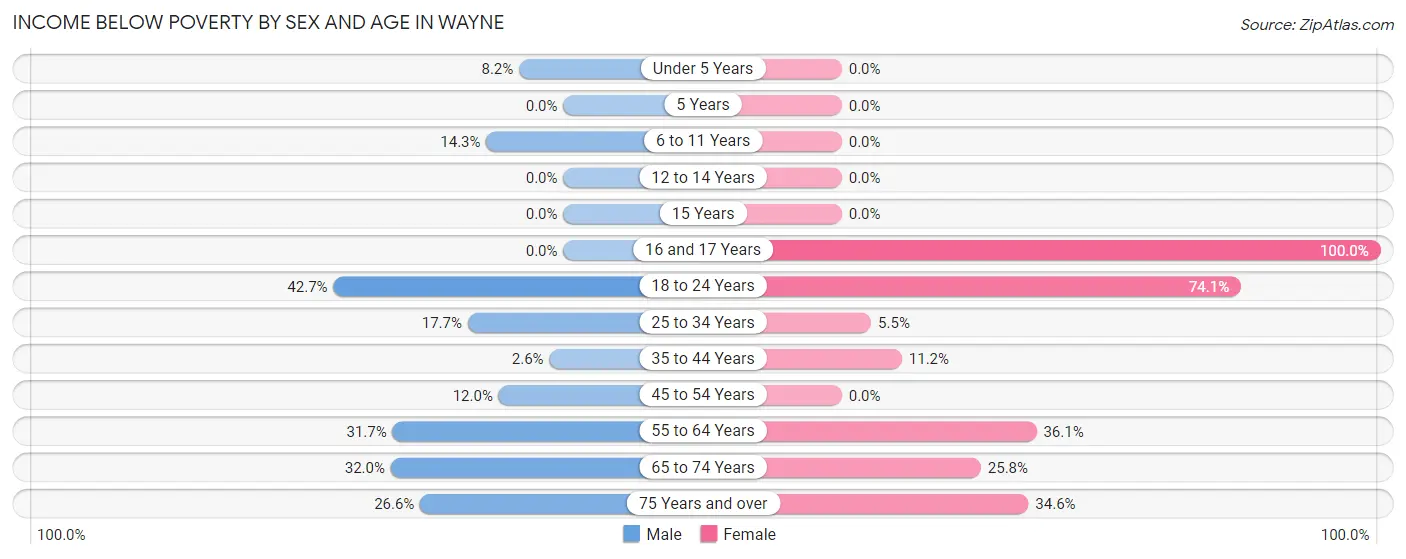
| Age Bracket | Male | Female |
| Under 5 Years | 11 (8.2%) | 0 (0.0%) |
| 5 Years | 0 (0.0%) | 0 (0.0%) |
| 6 to 11 Years | 15 (14.3%) | 0 (0.0%) |
| 12 to 14 Years | 0 (0.0%) | 0 (0.0%) |
| 15 Years | 0 (0.0%) | 0 (0.0%) |
| 16 and 17 Years | 0 (0.0%) | 70 (100.0%) |
| 18 to 24 Years | 210 (42.7%) | 326 (74.1%) |
| 25 to 34 Years | 55 (17.7%) | 9 (5.4%) |
| 35 to 44 Years | 6 (2.6%) | 36 (11.2%) |
| 45 to 54 Years | 35 (12.0%) | 0 (0.0%) |
| 55 to 64 Years | 78 (31.7%) | 103 (36.1%) |
| 65 to 74 Years | 49 (32.0%) | 48 (25.8%) |
| 75 Years and over | 38 (26.6%) | 97 (34.6%) |
| Total | 497 (21.0%) | 689 (30.7%) |
Income Above Poverty by Sex and Age in Wayne
According to the poverty statistics in Wayne, males aged 12 to 14 years and females aged under 5 years are the age groups that are most secure financially, with 100.0% of males and 100.0% of females in these age groups living above the poverty line.
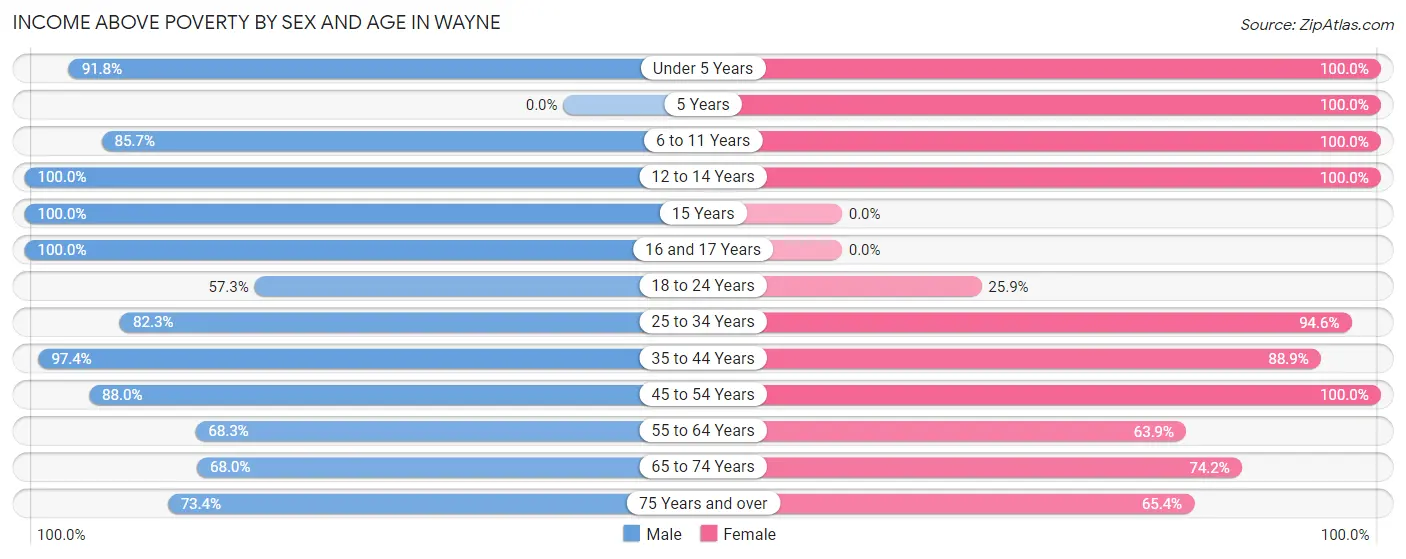
| Age Bracket | Male | Female |
| Under 5 Years | 123 (91.8%) | 110 (100.0%) |
| 5 Years | 0 (0.0%) | 12 (100.0%) |
| 6 to 11 Years | 90 (85.7%) | 84 (100.0%) |
| 12 to 14 Years | 180 (100.0%) | 96 (100.0%) |
| 15 Years | 23 (100.0%) | 0 (0.0%) |
| 16 and 17 Years | 52 (100.0%) | 0 (0.0%) |
| 18 to 24 Years | 282 (57.3%) | 114 (25.9%) |
| 25 to 34 Years | 255 (82.3%) | 156 (94.6%) |
| 35 to 44 Years | 227 (97.4%) | 287 (88.8%) |
| 45 to 54 Years | 257 (88.0%) | 192 (100.0%) |
| 55 to 64 Years | 168 (68.3%) | 182 (63.9%) |
| 65 to 74 Years | 104 (68.0%) | 138 (74.2%) |
| 75 Years and over | 105 (73.4%) | 183 (65.4%) |
| Total | 1,866 (79.0%) | 1,554 (69.3%) |
Income Below Poverty Among Married-Couple Families in Wayne
The poverty statistics for married-couple families in Wayne show that 11.6% or 101 of the total 872 families live below the poverty line. Families with no children have the highest poverty rate of 19.5%, comprising of 101 families. On the other hand, families with 1 or 2 children have the lowest poverty rate of 0.0%, which includes 0 families.
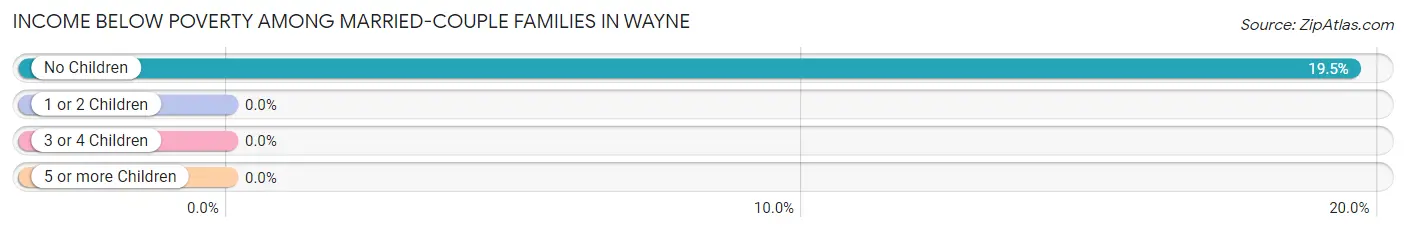
| Children | Above Poverty | Below Poverty |
| No Children | 416 (80.5%) | 101 (19.5%) |
| 1 or 2 Children | 204 (100.0%) | 0 (0.0%) |
| 3 or 4 Children | 141 (100.0%) | 0 (0.0%) |
| 5 or more Children | 10 (100.0%) | 0 (0.0%) |
| Total | 771 (88.4%) | 101 (11.6%) |
Income Below Poverty Among Single-Parent Households in Wayne
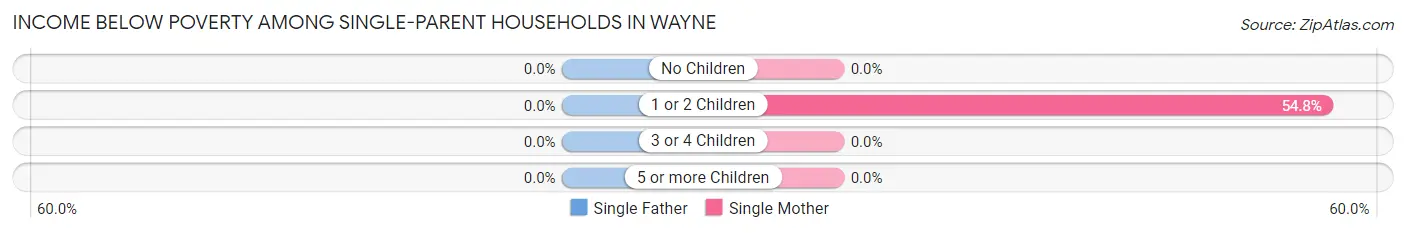
| Children | Single Father | Single Mother |
| No Children | 0 (0.0%) | 0 (0.0%) |
| 1 or 2 Children | 0 (0.0%) | 23 (54.8%) |
| 3 or 4 Children | 0 (0.0%) | 0 (0.0%) |
| 5 or more Children | 0 (0.0%) | 0 (0.0%) |
| Total | 0 (0.0%) | 23 (19.0%) |
Income Below Poverty Among Married-Couple vs Single-Parent Households in Wayne
The poverty data for Wayne shows that 101 of the married-couple family households (11.6%) and 23 of the single-parent households (11.2%) are living below the poverty level. Within the married-couple family households, those with no children have the highest poverty rate, with 101 households (19.5%) falling below the poverty line. Among the single-parent households, those with 1 or 2 children have the highest poverty rate, with 23 household (20.5%) living below poverty.
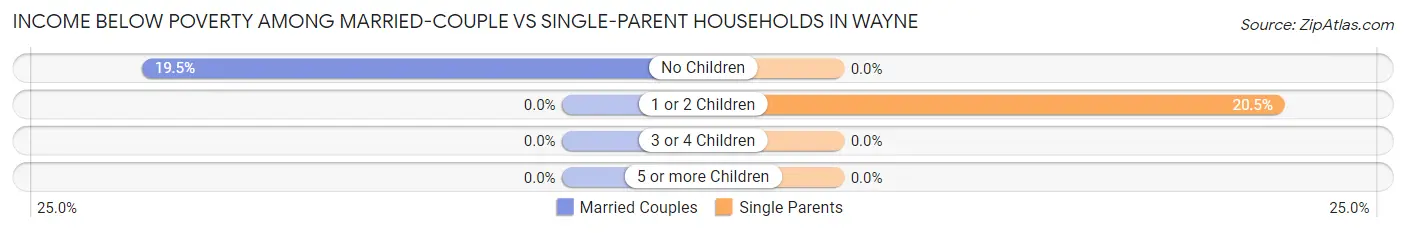
| Children | Married-Couple Families | Single-Parent Households |
| No Children | 101 (19.5%) | 0 (0.0%) |
| 1 or 2 Children | 0 (0.0%) | 23 (20.5%) |
| 3 or 4 Children | 0 (0.0%) | 0 (0.0%) |
| 5 or more Children | 0 (0.0%) | 0 (0.0%) |
| Total | 101 (11.6%) | 23 (11.2%) |
Race in Wayne
The most populous races in Wayne are White / Caucasian (5,380 | 90.1%), Hispanic or Latino (582 | 9.7%), and Two or more Races (270 | 4.5%).
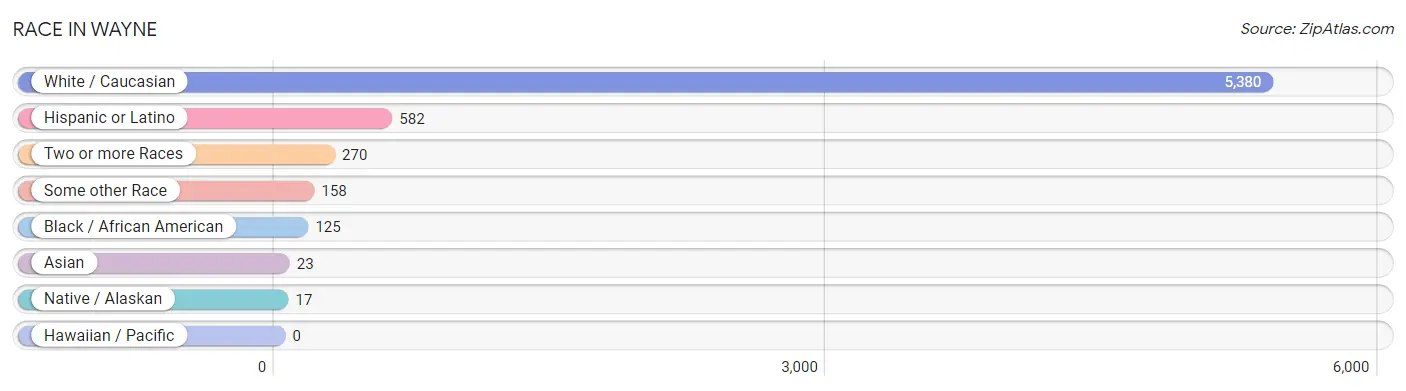
| Race | # Population | % Population |
| Asian | 23 | 0.4% |
| Black / African American | 125 | 2.1% |
| Hawaiian / Pacific | 0 | 0.0% |
| Hispanic or Latino | 582 | 9.7% |
| Native / Alaskan | 17 | 0.3% |
| White / Caucasian | 5,380 | 90.1% |
| Two or more Races | 270 | 4.5% |
| Some other Race | 158 | 2.6% |
| Total | 5,973 | 100.0% |
Ancestry in Wayne
The most populous ancestries reported in Wayne are German (2,365 | 39.6%), Irish (1,058 | 17.7%), English (384 | 6.4%), Mexican (361 | 6.0%), and Czech (330 | 5.5%), together accounting for 75.3% of all Wayne residents.
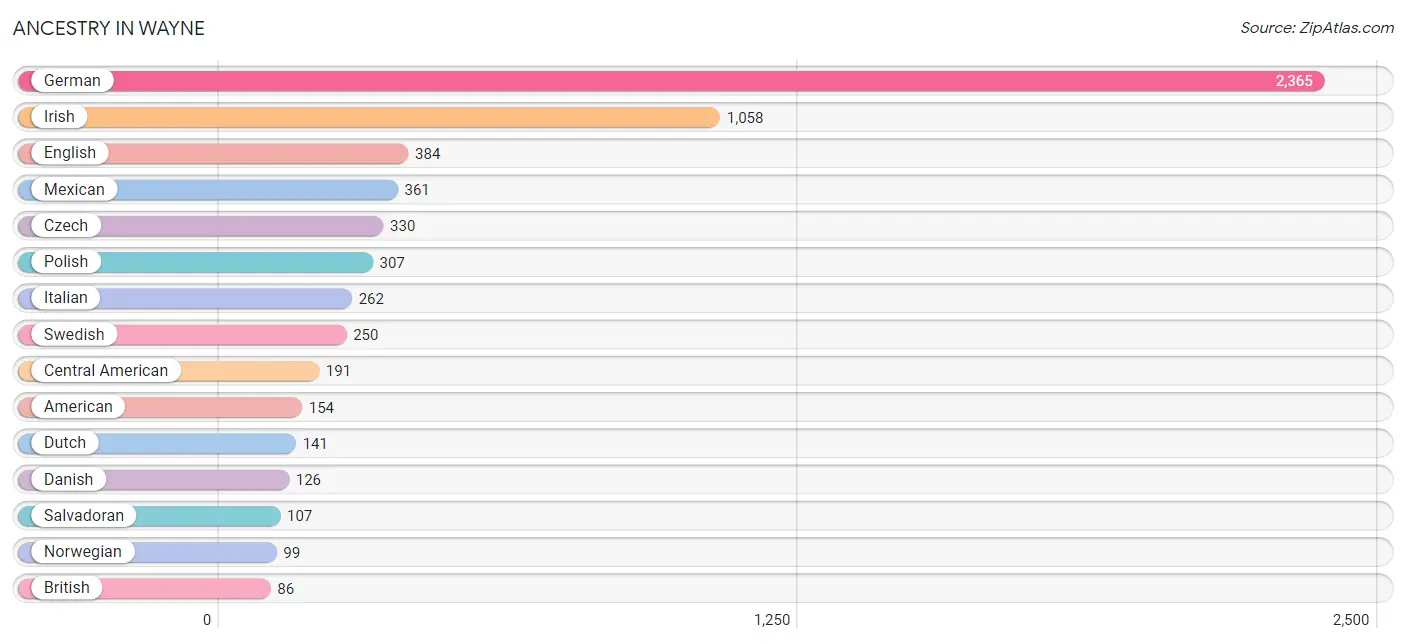
| Ancestry | # Population | % Population |
| American | 154 | 2.6% |
| Austrian | 6 | 0.1% |
| Bhutanese | 8 | 0.1% |
| Brazilian | 8 | 0.1% |
| British | 86 | 1.4% |
| Burmese | 8 | 0.1% |
| Canadian | 62 | 1.0% |
| Celtic | 23 | 0.4% |
| Central American | 191 | 3.2% |
| Cherokee | 38 | 0.6% |
| Cuban | 6 | 0.1% |
| Czech | 330 | 5.5% |
| Czechoslovakian | 6 | 0.1% |
| Danish | 126 | 2.1% |
| Dominican | 4 | 0.1% |
| Dutch | 141 | 2.4% |
| Dutch West Indian | 5 | 0.1% |
| English | 384 | 6.4% |
| European | 46 | 0.8% |
| French | 84 | 1.4% |
| German | 2,365 | 39.6% |
| Greek | 20 | 0.3% |
| Guatemalan | 19 | 0.3% |
| Honduran | 65 | 1.1% |
| Indian (Asian) | 4 | 0.1% |
| Iranian | 21 | 0.4% |
| Irish | 1,058 | 17.7% |
| Italian | 262 | 4.4% |
| Korean | 11 | 0.2% |
| Luxembourger | 6 | 0.1% |
| Mexican | 361 | 6.0% |
| Norwegian | 99 | 1.7% |
| Polish | 307 | 5.1% |
| Puerto Rican | 20 | 0.3% |
| Russian | 35 | 0.6% |
| Salvadoran | 107 | 1.8% |
| Scandinavian | 13 | 0.2% |
| Scotch-Irish | 5 | 0.1% |
| Scottish | 41 | 0.7% |
| Slavic | 8 | 0.1% |
| Slovak | 9 | 0.2% |
| Swedish | 250 | 4.2% |
| Turkish | 29 | 0.5% |
| West Indian | 7 | 0.1% | View All 44 Rows |
Immigrants in Wayne
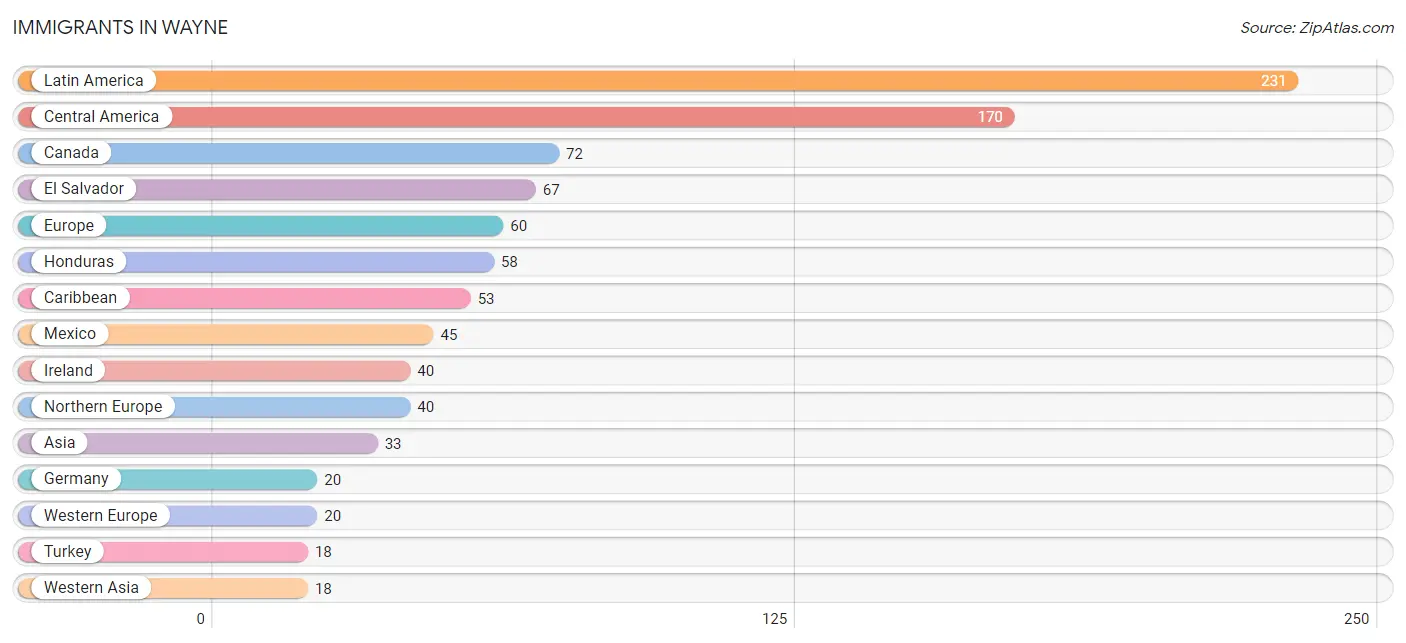
The most numerous immigrant groups reported in Wayne came from Latin America (231 | 3.9%), Central America (170 | 2.9%), Canada (72 | 1.2%), El Salvador (67 | 1.1%), and Europe (60 | 1.0%), together accounting for 10.0% of all Wayne residents.
| Immigration Origin | # Population | % Population |
| Asia | 33 | 0.5% |
| Brazil | 8 | 0.1% |
| Canada | 72 | 1.2% |
| Caribbean | 53 | 0.9% |
| Central America | 170 | 2.9% |
| China | 4 | 0.1% |
| Eastern Asia | 4 | 0.1% |
| El Salvador | 67 | 1.1% |
| Europe | 60 | 1.0% |
| Germany | 20 | 0.3% |
| Honduras | 58 | 1.0% |
| Ireland | 40 | 0.7% |
| Latin America | 231 | 3.9% |
| Mexico | 45 | 0.7% |
| Northern Europe | 40 | 0.7% |
| Philippines | 11 | 0.2% |
| South America | 8 | 0.1% |
| South Eastern Asia | 11 | 0.2% |
| Turkey | 18 | 0.3% |
| West Indies | 7 | 0.1% |
| Western Asia | 18 | 0.3% |
| Western Europe | 20 | 0.3% | View All 22 Rows |
Sex and Age in Wayne
Sex and Age in Wayne
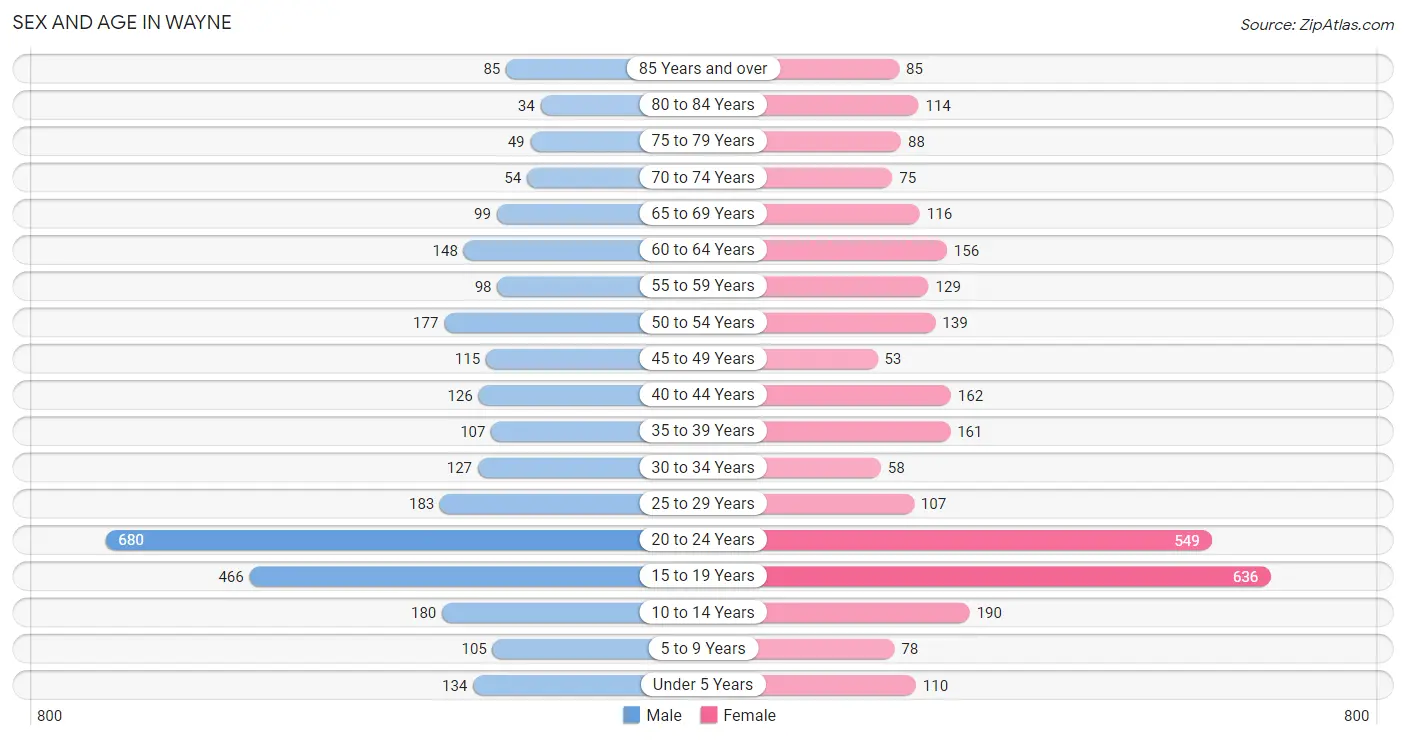
The most populous age groups in Wayne are 20 to 24 Years (680 | 22.9%) for men and 15 to 19 Years (636 | 21.2%) for women.
| Age Bracket | Male | Female |
| Under 5 Years | 134 (4.5%) | 110 (3.7%) |
| 5 to 9 Years | 105 (3.5%) | 78 (2.6%) |
| 10 to 14 Years | 180 (6.1%) | 190 (6.3%) |
| 15 to 19 Years | 466 (15.7%) | 636 (21.2%) |
| 20 to 24 Years | 680 (22.9%) | 549 (18.3%) |
| 25 to 29 Years | 183 (6.2%) | 107 (3.6%) |
| 30 to 34 Years | 127 (4.3%) | 58 (1.9%) |
| 35 to 39 Years | 107 (3.6%) | 161 (5.4%) |
| 40 to 44 Years | 126 (4.3%) | 162 (5.4%) |
| 45 to 49 Years | 115 (3.9%) | 53 (1.8%) |
| 50 to 54 Years | 177 (6.0%) | 139 (4.6%) |
| 55 to 59 Years | 98 (3.3%) | 129 (4.3%) |
| 60 to 64 Years | 148 (5.0%) | 156 (5.2%) |
| 65 to 69 Years | 99 (3.3%) | 116 (3.9%) |
| 70 to 74 Years | 54 (1.8%) | 75 (2.5%) |
| 75 to 79 Years | 49 (1.7%) | 88 (2.9%) |
| 80 to 84 Years | 34 (1.1%) | 114 (3.8%) |
| 85 Years and over | 85 (2.9%) | 85 (2.8%) |
| Total | 2,967 (100.0%) | 3,006 (100.0%) |
Families and Households in Wayne
Median Family Size in Wayne
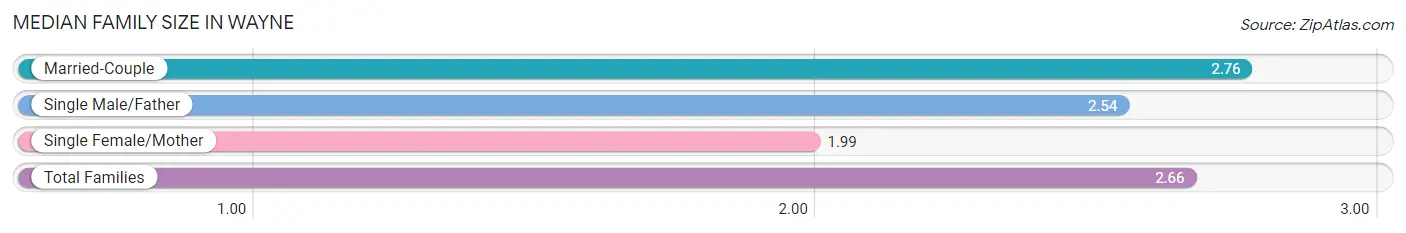
The median family size in Wayne is 2.66 persons per family, with married-couple families (872 | 80.9%) accounting for the largest median family size of 2.76 persons per family. On the other hand, single female/mother families (121 | 11.2%) represent the smallest median family size with 1.99 persons per family.
| Family Type | # Families | Family Size |
| Married-Couple | 872 (80.9%) | 2.76 |
| Single Male/Father | 85 (7.9%) | 2.54 |
| Single Female/Mother | 121 (11.2%) | 1.99 |
| Total Families | 1,078 (100.0%) | 2.66 |
Median Household Size in Wayne
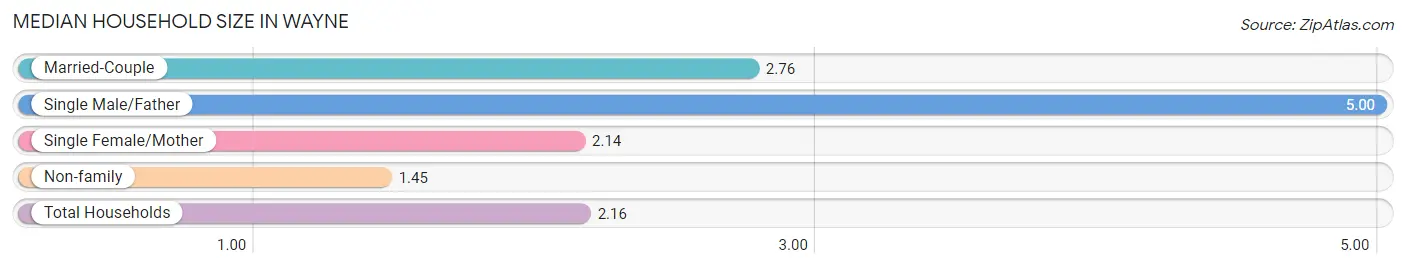
The median household size in Wayne is 2.16 persons per household, with single male/father households (85 | 3.9%) accounting for the largest median household size of 5 persons per household. non-family households (1,082 | 50.1%) represent the smallest median household size with 1.45 persons per household.
| Household Type | # Households | Household Size |
| Married-Couple | 872 (40.4%) | 2.76 |
| Single Male/Father | 85 (3.9%) | 5.00 |
| Single Female/Mother | 121 (5.6%) | 2.14 |
| Non-family | 1,082 (50.1%) | 1.45 |
| Total Households | 2,160 (100.0%) | 2.16 |
Household Size by Marriage Status in Wayne
Out of a total of 2,160 households in Wayne, 1,078 (49.9%) are family households, while 1,082 (50.1%) are nonfamily households. The most numerous type of family households are 2-person households, comprising 588, and the most common type of nonfamily households are 1-person households, comprising 760.
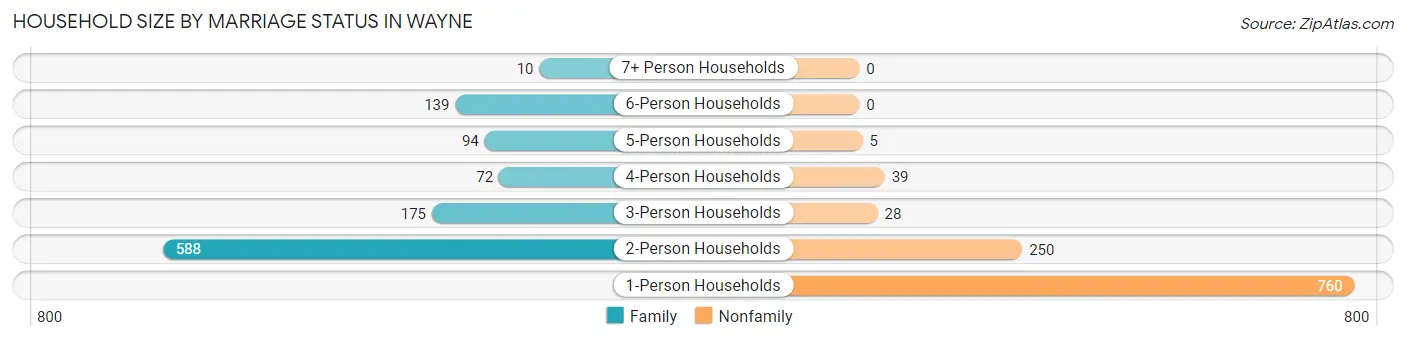
| Household Size | Family Households | Nonfamily Households |
| 1-Person Households | - | 760 (35.2%) |
| 2-Person Households | 588 (27.2%) | 250 (11.6%) |
| 3-Person Households | 175 (8.1%) | 28 (1.3%) |
| 4-Person Households | 72 (3.3%) | 39 (1.8%) |
| 5-Person Households | 94 (4.3%) | 5 (0.2%) |
| 6-Person Households | 139 (6.4%) | 0 (0.0%) |
| 7+ Person Households | 10 (0.5%) | 0 (0.0%) |
| Total | 1,078 (49.9%) | 1,082 (50.1%) |
Female Fertility in Wayne
Fertility by Age in Wayne
Average fertility rate in Wayne is 24.0 births per 1,000 women. Women in the age bracket of 20 to 34 years have the highest fertility rate with 41.0 births per 1,000 women. Women in the age bracket of 20 to 34 years acount for 70.7% of all women with births.
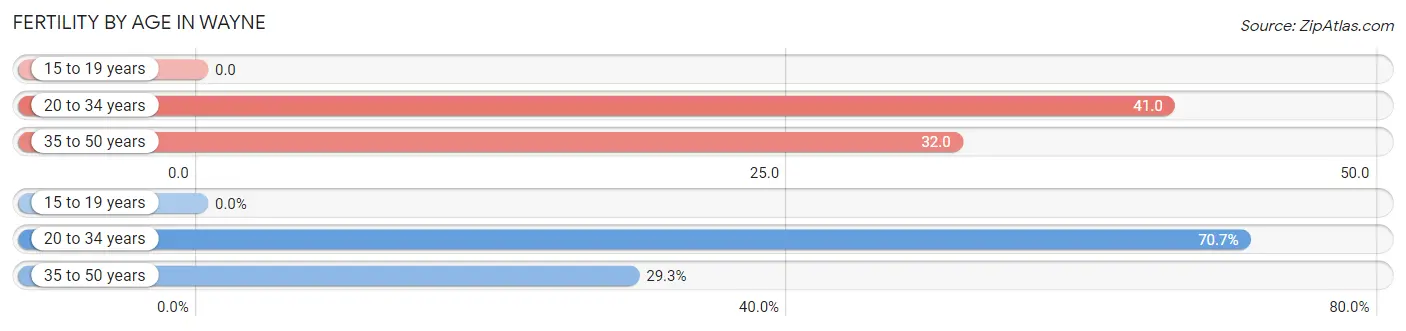
| Age Bracket | Women with Births | Births / 1,000 Women |
| 15 to 19 years | 0 (0.0%) | 0.0 |
| 20 to 34 years | 29 (70.7%) | 41.0 |
| 35 to 50 years | 12 (29.3%) | 32.0 |
| Total | 41 (100.0%) | 24.0 |
Fertility by Age by Marriage Status in Wayne
29.3% of women with births (41) in Wayne are married. The highest percentage of unmarried women with births falls into 20 to 34 years age bracket with 100.0% of them unmarried at the time of birth, while the lowest percentage of unmarried women with births belong to 35 to 50 years age bracket with 0.0% of them unmarried.
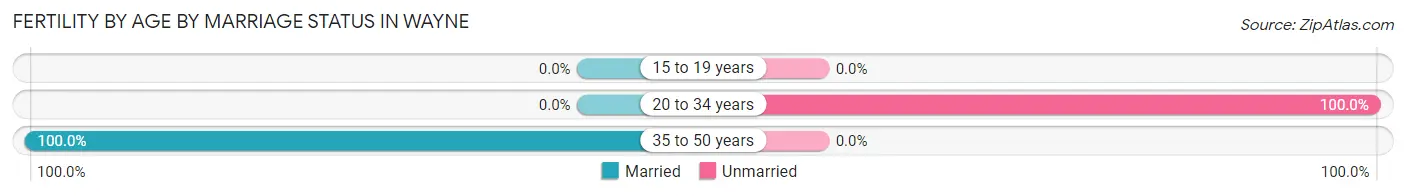
| Age Bracket | Married | Unmarried |
| 15 to 19 years | 0 (0.0%) | 0 (0.0%) |
| 20 to 34 years | 0 (0.0%) | 29 (100.0%) |
| 35 to 50 years | 12 (100.0%) | 0 (0.0%) |
| Total | 12 (29.3%) | 29 (70.7%) |
Fertility by Education in Wayne
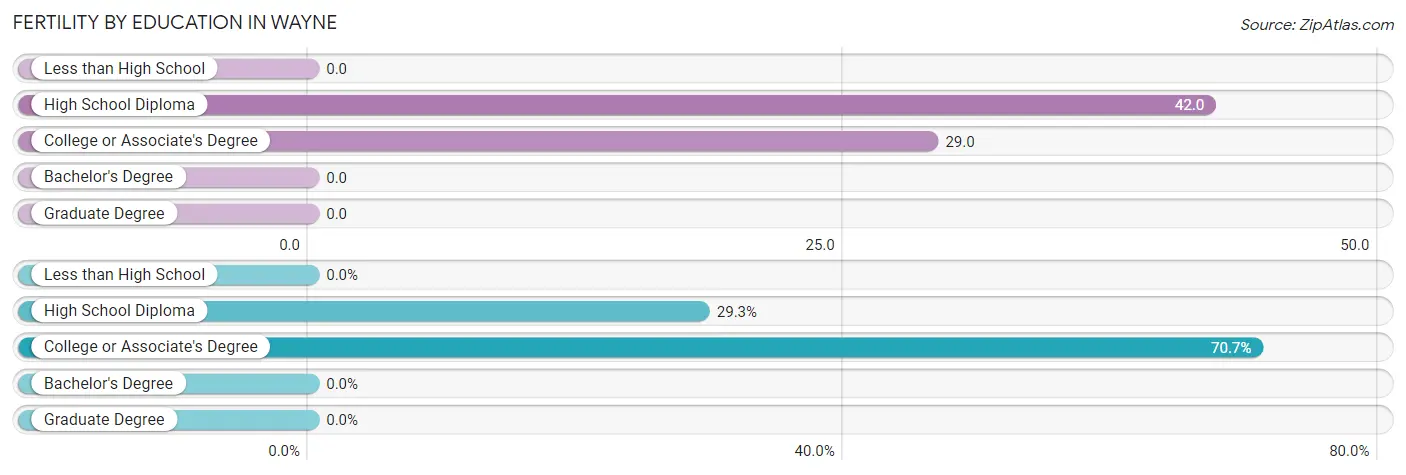
| Educational Attainment | Women with Births | Births / 1,000 Women |
| Less than High School | 0 (0.0%) | 0.0 |
| High School Diploma | 12 (29.3%) | 42.0 |
| College or Associate's Degree | 29 (70.7%) | 29.0 |
| Bachelor's Degree | 0 (0.0%) | 0.0 |
| Graduate Degree | 0 (0.0%) | 0.0 |
| Total | 41 (100.0%) | 24.0 |
Fertility by Education by Marriage Status in Wayne
70.7% of women with births in Wayne are unmarried. Women with the educational attainment of high school diploma are most likely to be married with 100.0% of them married at childbirth, while women with the educational attainment of college or associate's degree are least likely to be married with 100.0% of them unmarried at childbirth.
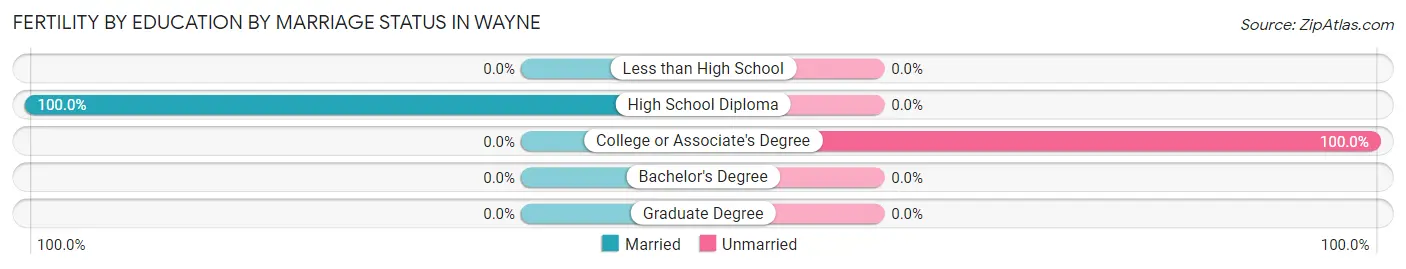
| Educational Attainment | Married | Unmarried |
| Less than High School | 0 (0.0%) | 0 (0.0%) |
| High School Diploma | 12 (100.0%) | 0 (0.0%) |
| College or Associate's Degree | 0 (0.0%) | 29 (100.0%) |
| Bachelor's Degree | 0 (0.0%) | 0 (0.0%) |
| Graduate Degree | 0 (0.0%) | 0 (0.0%) |
| Total | 12 (29.3%) | 29 (70.7%) |
Employment Characteristics in Wayne
Employment by Class of Employer in Wayne
Among the 3,156 employed individuals in Wayne, private company employees (1,978 | 62.7%), not-for-profit organizations (418 | 13.2%), and state government employees (413 | 13.1%) make up the most common classes of employment.
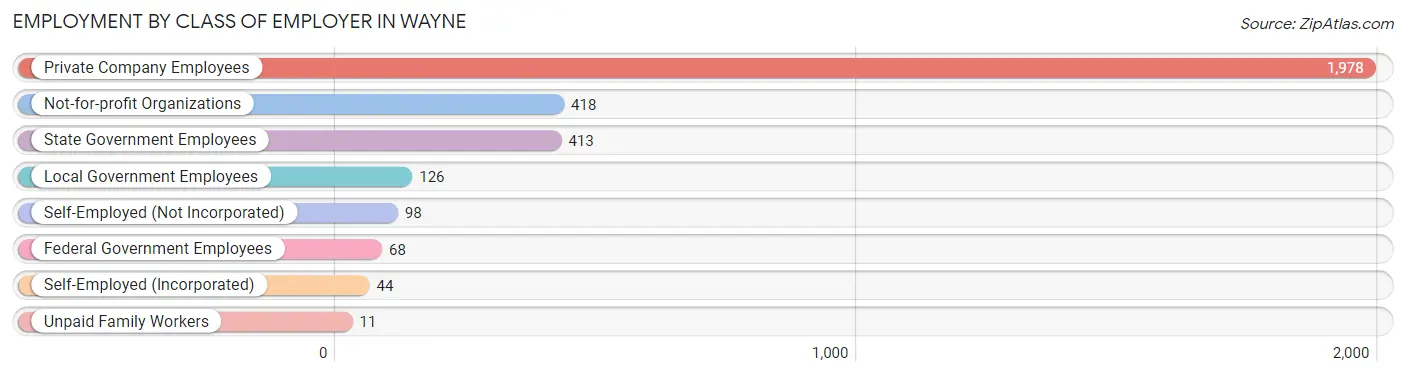
| Employer Class | # Employees | % Employees |
| Private Company Employees | 1,978 | 62.7% |
| Self-Employed (Incorporated) | 44 | 1.4% |
| Self-Employed (Not Incorporated) | 98 | 3.1% |
| Not-for-profit Organizations | 418 | 13.2% |
| Local Government Employees | 126 | 4.0% |
| State Government Employees | 413 | 13.1% |
| Federal Government Employees | 68 | 2.1% |
| Unpaid Family Workers | 11 | 0.4% |
| Total | 3,156 | 100.0% |
Employment Status by Age in Wayne
According to the labor force statistics for Wayne, out of the total population over 16 years of age (5,153), 69.1% or 3,561 individuals are in the labor force, with 4.4% or 157 of them unemployed. The age group with the highest labor force participation rate is 25 to 29 years, with 100.0% or 290 individuals in the labor force. Within the labor force, the 16 to 19 years age range has the highest percentage of unemployed individuals, with 16.0% or 116 of them being unemployed.
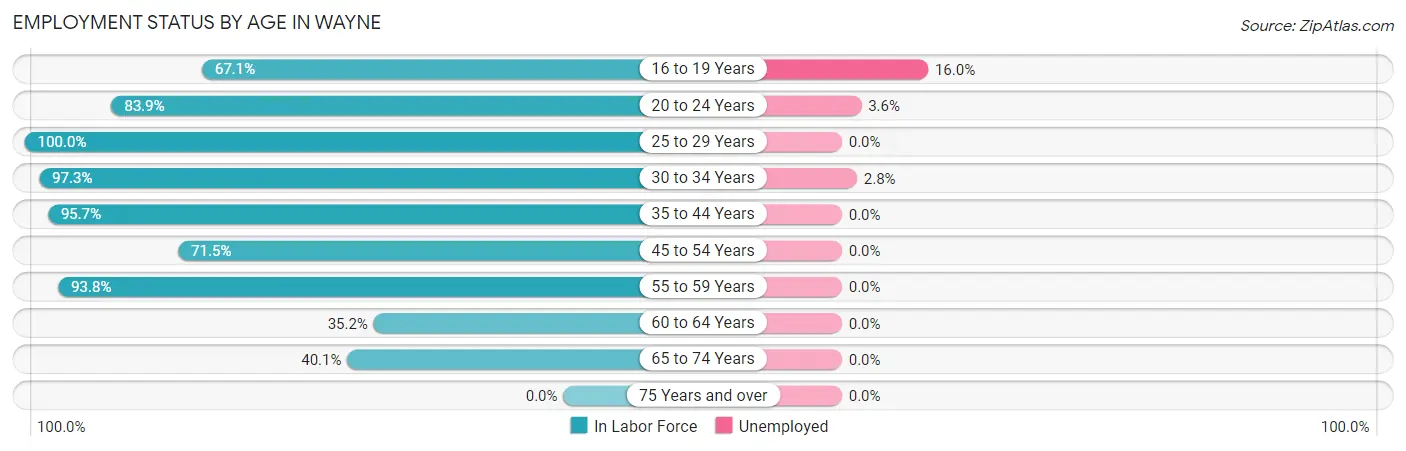
| Age Bracket | In Labor Force | Unemployed |
| 16 to 19 Years | 724 (67.1%) | 116 (16.0%) |
| 20 to 24 Years | 1,031 (83.9%) | 37 (3.6%) |
| 25 to 29 Years | 290 (100.0%) | 0 (0.0%) |
| 30 to 34 Years | 180 (97.3%) | 5 (2.8%) |
| 35 to 44 Years | 532 (95.7%) | 0 (0.0%) |
| 45 to 54 Years | 346 (71.5%) | 0 (0.0%) |
| 55 to 59 Years | 213 (93.8%) | 0 (0.0%) |
| 60 to 64 Years | 107 (35.2%) | 0 (0.0%) |
| 65 to 74 Years | 138 (40.1%) | 0 (0.0%) |
| 75 Years and over | 0 (0.0%) | 0 (0.0%) |
| Total | 3,561 (69.1%) | 157 (4.4%) |
Employment Status by Educational Attainment in Wayne
According to labor force statistics for Wayne, 81.5% of individuals (1,667) out of the total population between 25 and 64 years of age (2,046) are in the labor force, with 0.3% or 5 of them being unemployed. The group with the highest labor force participation rate are those with the educational attainment of bachelor's degree or higher, with 95.3% or 756 individuals in the labor force. Within the labor force, individuals with bachelor's degree or higher education have the highest percentage of unemployment, with 0.7% or 5 of them being unemployed.
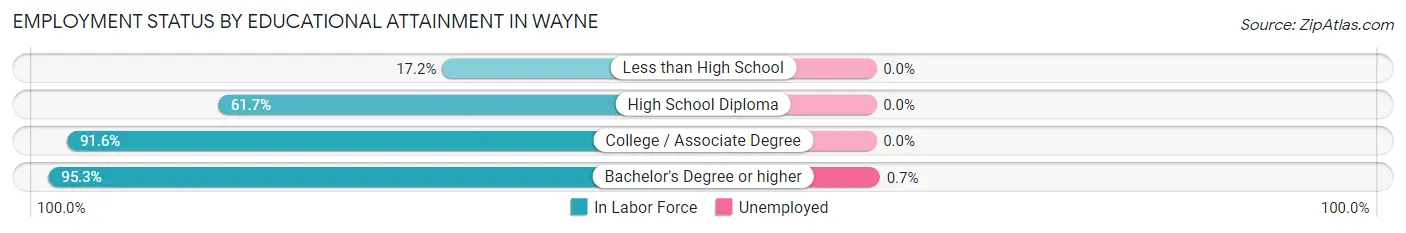
| Educational Attainment | In Labor Force | Unemployed |
| Less than High School | 22 (17.2%) | 0 (0.0%) |
| High School Diploma | 290 (61.7%) | 0 (0.0%) |
| College / Associate Degree | 600 (91.6%) | 0 (0.0%) |
| Bachelor's Degree or higher | 756 (95.3%) | 6 (0.7%) |
| Total | 1,667 (81.5%) | 6 (0.3%) |
Employment Occupations by Sex in Wayne
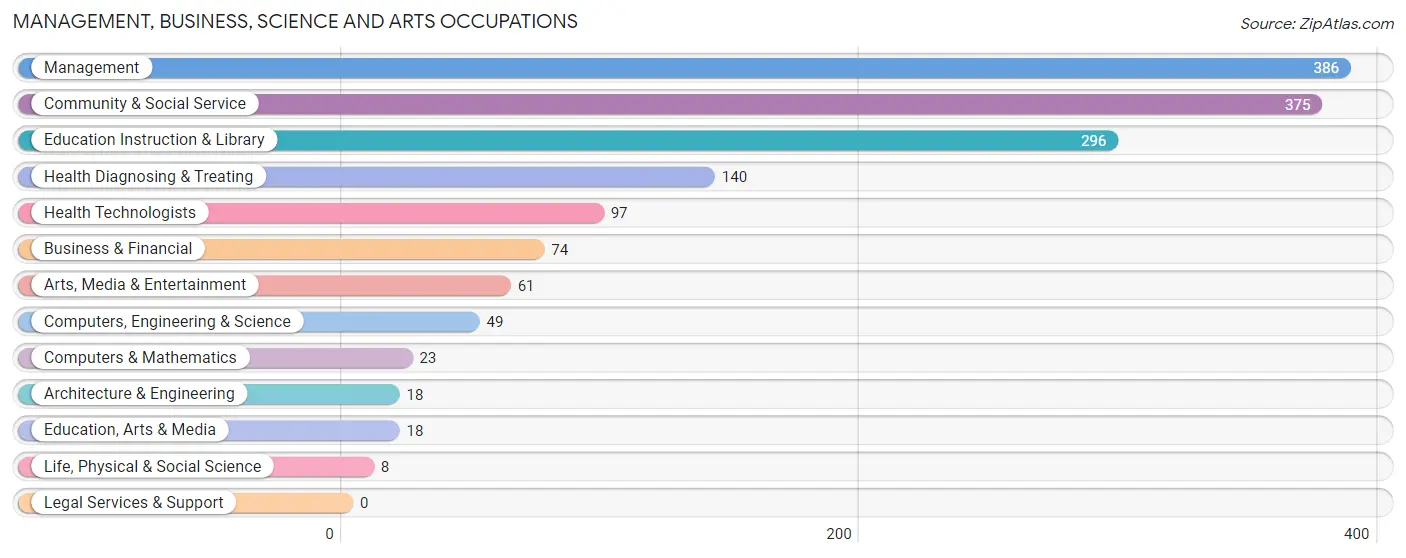
Management, Business, Science and Arts Occupations
The most common Management, Business, Science and Arts occupations in Wayne are Management (386 | 11.3%), Community & Social Service (375 | 11.0%), Education Instruction & Library (296 | 8.7%), Health Diagnosing & Treating (140 | 4.1%), and Health Technologists (97 | 2.9%).
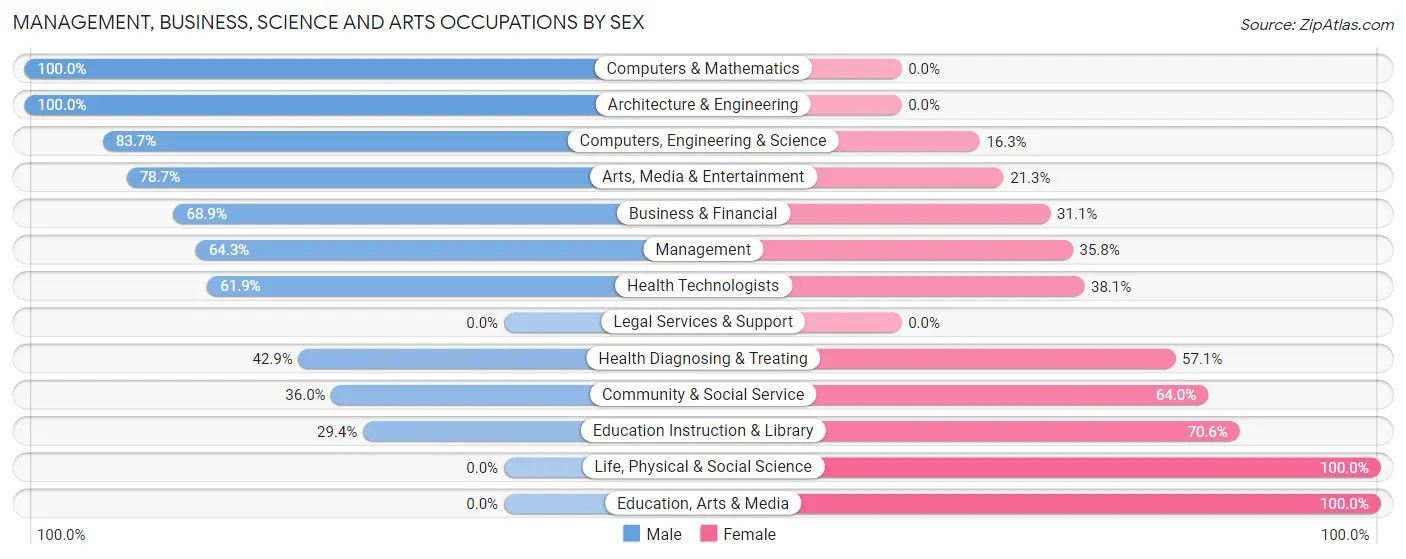
Management, Business, Science and Arts Occupations by Sex
Within the Management, Business, Science and Arts occupations in Wayne, the most male-oriented occupations are Computers & Mathematics (100.0%), Architecture & Engineering (100.0%), and Computers, Engineering & Science (83.7%), while the most female-oriented occupations are Life, Physical & Social Science (100.0%), Education, Arts & Media (100.0%), and Education Instruction & Library (70.6%).
| Occupation | Male | Female |
| Management | 248 (64.2%) | 138 (35.7%) |
| Business & Financial | 51 (68.9%) | 23 (31.1%) |
| Computers, Engineering & Science | 41 (83.7%) | 8 (16.3%) |
| Computers & Mathematics | 23 (100.0%) | 0 (0.0%) |
| Architecture & Engineering | 18 (100.0%) | 0 (0.0%) |
| Life, Physical & Social Science | 0 (0.0%) | 8 (100.0%) |
| Community & Social Service | 135 (36.0%) | 240 (64.0%) |
| Education, Arts & Media | 0 (0.0%) | 18 (100.0%) |
| Legal Services & Support | 0 (0.0%) | 0 (0.0%) |
| Education Instruction & Library | 87 (29.4%) | 209 (70.6%) |
| Arts, Media & Entertainment | 48 (78.7%) | 13 (21.3%) |
| Health Diagnosing & Treating | 60 (42.9%) | 80 (57.1%) |
| Health Technologists | 60 (61.9%) | 37 (38.1%) |
| Total (Category) | 535 (52.2%) | 489 (47.7%) |
| Total (Overall) | 1,793 (52.7%) | 1,610 (47.3%) |
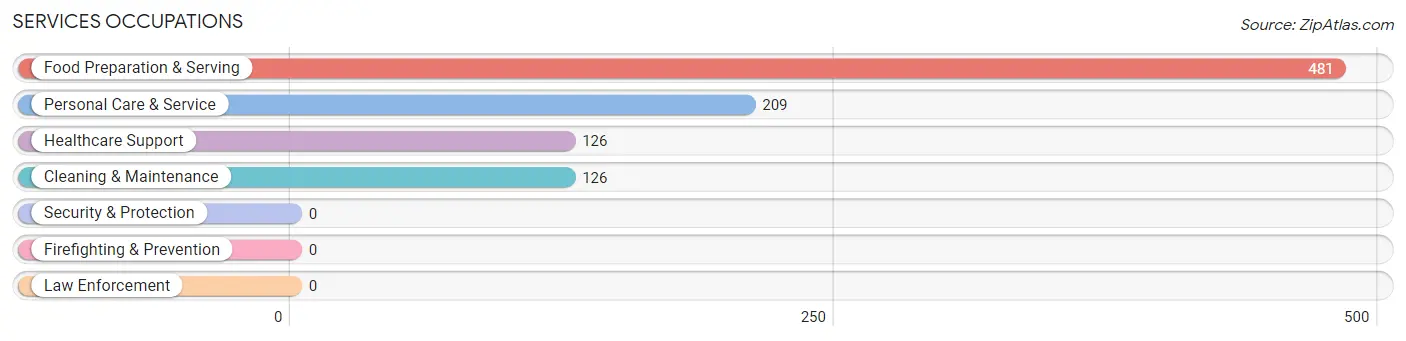
Services Occupations
The most common Services occupations in Wayne are Food Preparation & Serving (481 | 14.1%), Personal Care & Service (209 | 6.1%), Healthcare Support (126 | 3.7%), and Cleaning & Maintenance (126 | 3.7%).
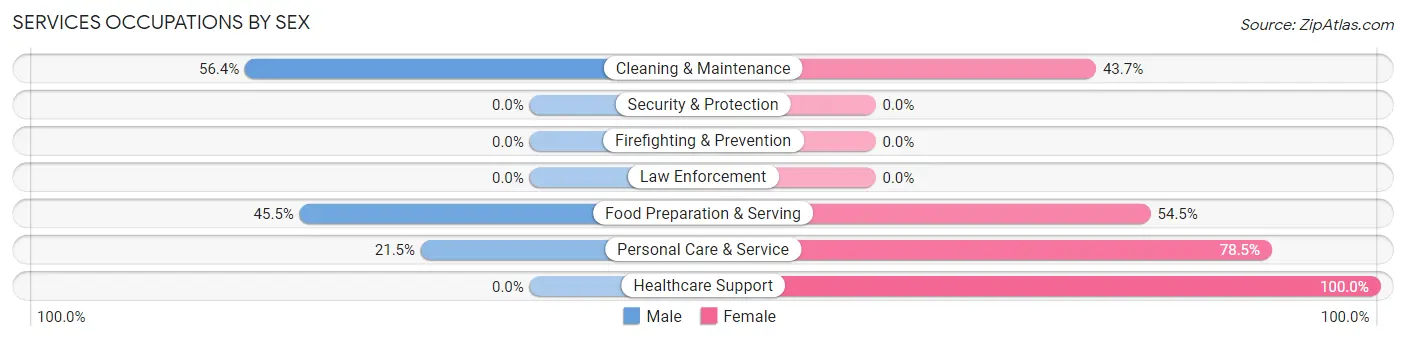
Services Occupations by Sex
Within the Services occupations in Wayne, the most male-oriented occupations are Cleaning & Maintenance (56.4%), Food Preparation & Serving (45.5%), and Personal Care & Service (21.5%), while the most female-oriented occupations are Healthcare Support (100.0%), Personal Care & Service (78.5%), and Food Preparation & Serving (54.5%).
| Occupation | Male | Female |
| Healthcare Support | 0 (0.0%) | 126 (100.0%) |
| Security & Protection | 0 (0.0%) | 0 (0.0%) |
| Firefighting & Prevention | 0 (0.0%) | 0 (0.0%) |
| Law Enforcement | 0 (0.0%) | 0 (0.0%) |
| Food Preparation & Serving | 219 (45.5%) | 262 (54.5%) |
| Cleaning & Maintenance | 71 (56.4%) | 55 (43.6%) |
| Personal Care & Service | 45 (21.5%) | 164 (78.5%) |
| Total (Category) | 335 (35.6%) | 607 (64.4%) |
| Total (Overall) | 1,793 (52.7%) | 1,610 (47.3%) |
Sales and Office Occupations
The most common Sales and Office occupations in Wayne are Sales & Related (501 | 14.7%), and Office & Administration (339 | 10.0%).

Sales and Office Occupations by Sex
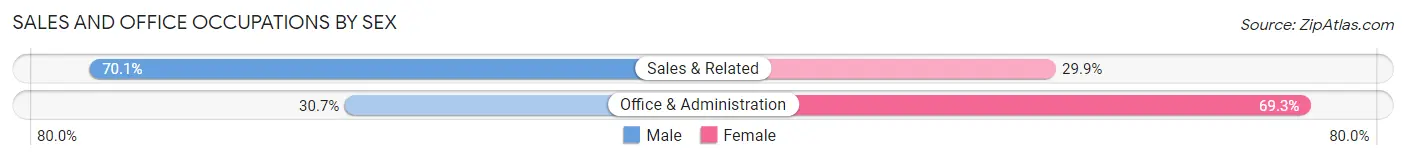
| Occupation | Male | Female |
| Sales & Related | 351 (70.1%) | 150 (29.9%) |
| Office & Administration | 104 (30.7%) | 235 (69.3%) |
| Total (Category) | 455 (54.2%) | 385 (45.8%) |
| Total (Overall) | 1,793 (52.7%) | 1,610 (47.3%) |
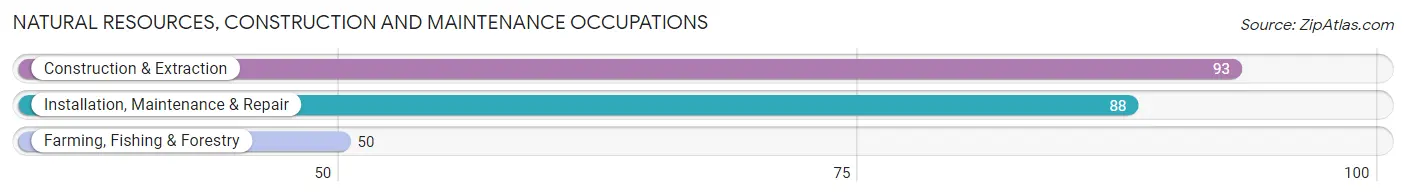
Natural Resources, Construction and Maintenance Occupations
The most common Natural Resources, Construction and Maintenance occupations in Wayne are Construction & Extraction (93 | 2.7%), Installation, Maintenance & Repair (88 | 2.6%), and Farming, Fishing & Forestry (50 | 1.5%).
Natural Resources, Construction and Maintenance Occupations by Sex
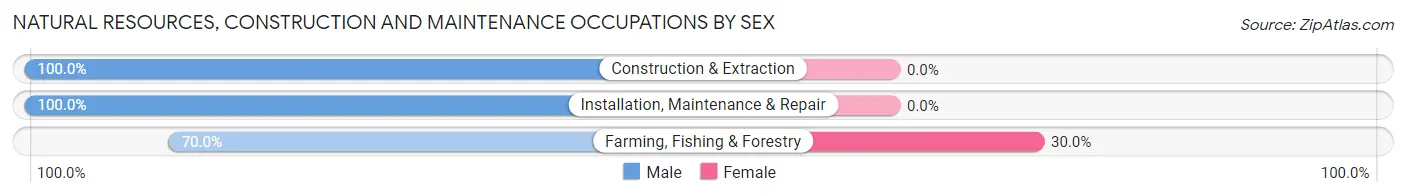
| Occupation | Male | Female |
| Farming, Fishing & Forestry | 35 (70.0%) | 15 (30.0%) |
| Construction & Extraction | 93 (100.0%) | 0 (0.0%) |
| Installation, Maintenance & Repair | 88 (100.0%) | 0 (0.0%) |
| Total (Category) | 216 (93.5%) | 15 (6.5%) |
| Total (Overall) | 1,793 (52.7%) | 1,610 (47.3%) |
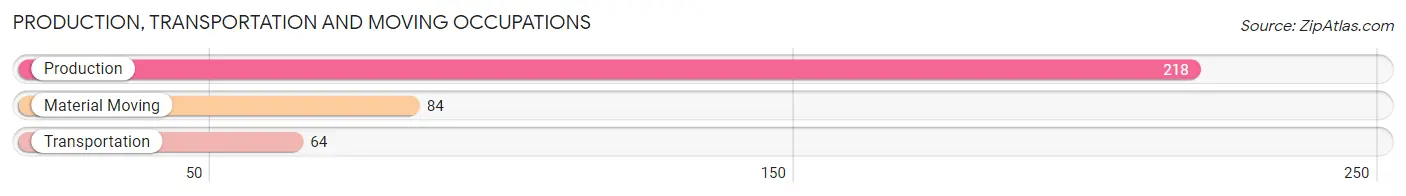
Production, Transportation and Moving Occupations
The most common Production, Transportation and Moving occupations in Wayne are Production (218 | 6.4%), Material Moving (84 | 2.5%), and Transportation (64 | 1.9%).
Production, Transportation and Moving Occupations by Sex
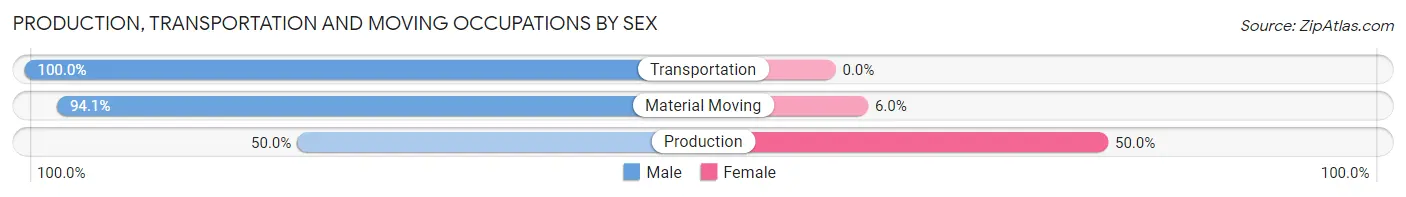
| Occupation | Male | Female |
| Production | 109 (50.0%) | 109 (50.0%) |
| Transportation | 64 (100.0%) | 0 (0.0%) |
| Material Moving | 79 (94.1%) | 5 (5.9%) |
| Total (Category) | 252 (68.9%) | 114 (31.1%) |
| Total (Overall) | 1,793 (52.7%) | 1,610 (47.3%) |
Employment Industries by Sex in Wayne
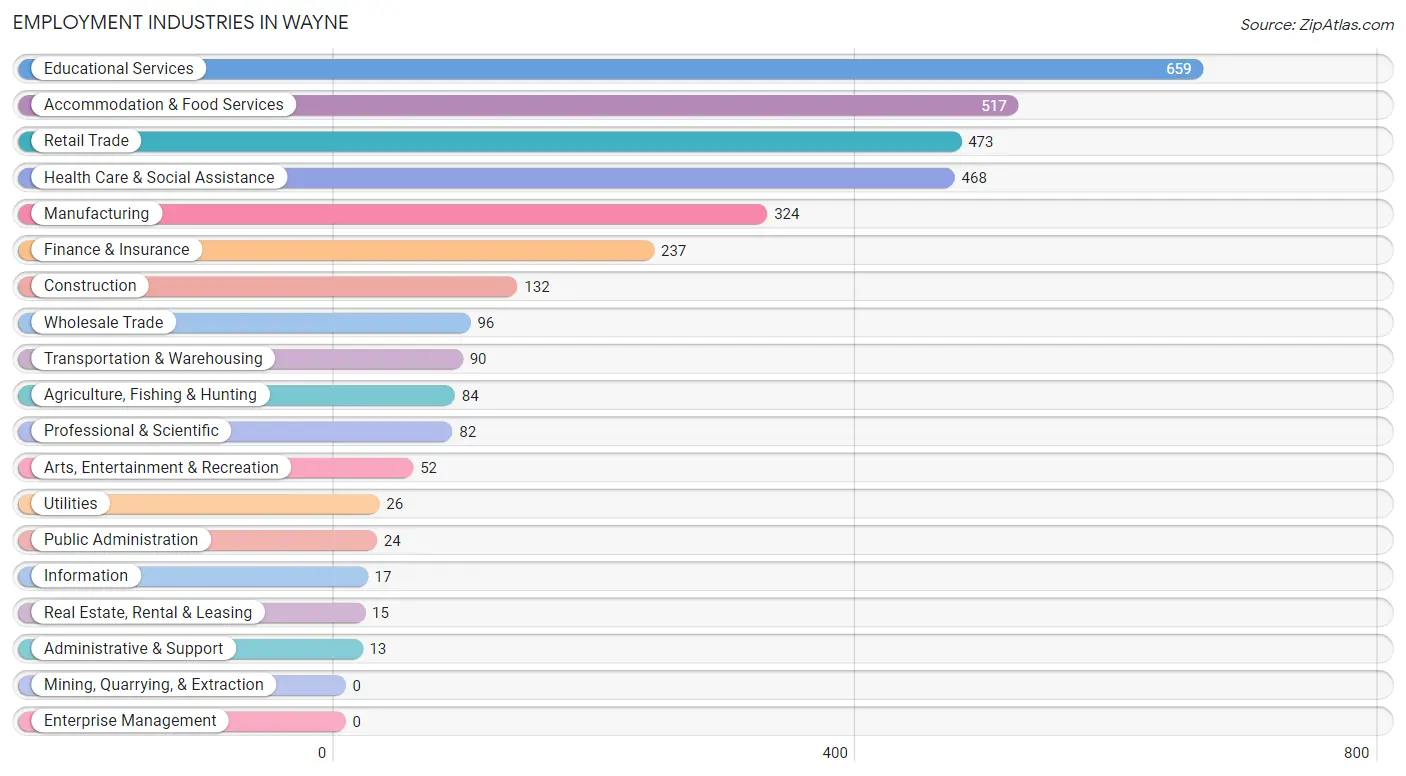
Employment Industries in Wayne
The major employment industries in Wayne include Educational Services (659 | 19.4%), Accommodation & Food Services (517 | 15.2%), Retail Trade (473 | 13.9%), Health Care & Social Assistance (468 | 13.8%), and Manufacturing (324 | 9.5%).
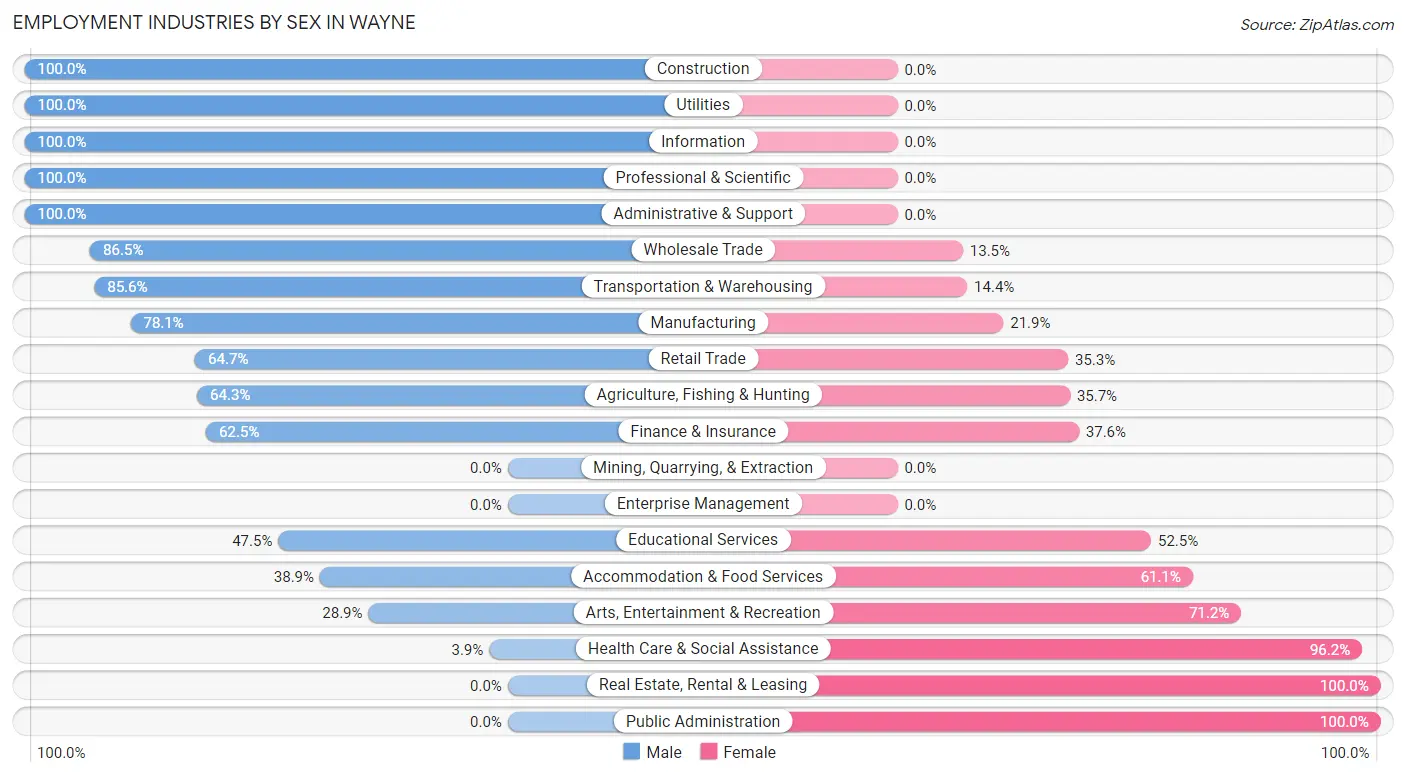
Employment Industries by Sex in Wayne
The Wayne industries that see more men than women are Construction (100.0%), Utilities (100.0%), and Information (100.0%), whereas the industries that tend to have a higher number of women are Real Estate, Rental & Leasing (100.0%), Public Administration (100.0%), and Health Care & Social Assistance (96.2%).
| Industry | Male | Female |
| Agriculture, Fishing & Hunting | 54 (64.3%) | 30 (35.7%) |
| Mining, Quarrying, & Extraction | 0 (0.0%) | 0 (0.0%) |
| Construction | 132 (100.0%) | 0 (0.0%) |
| Manufacturing | 253 (78.1%) | 71 (21.9%) |
| Wholesale Trade | 83 (86.5%) | 13 (13.5%) |
| Retail Trade | 306 (64.7%) | 167 (35.3%) |
| Transportation & Warehousing | 77 (85.6%) | 13 (14.4%) |
| Utilities | 26 (100.0%) | 0 (0.0%) |
| Information | 17 (100.0%) | 0 (0.0%) |
| Finance & Insurance | 148 (62.5%) | 89 (37.6%) |
| Real Estate, Rental & Leasing | 0 (0.0%) | 15 (100.0%) |
| Professional & Scientific | 82 (100.0%) | 0 (0.0%) |
| Enterprise Management | 0 (0.0%) | 0 (0.0%) |
| Administrative & Support | 13 (100.0%) | 0 (0.0%) |
| Educational Services | 313 (47.5%) | 346 (52.5%) |
| Health Care & Social Assistance | 18 (3.8%) | 450 (96.2%) |
| Arts, Entertainment & Recreation | 15 (28.8%) | 37 (71.2%) |
| Accommodation & Food Services | 201 (38.9%) | 316 (61.1%) |
| Public Administration | 0 (0.0%) | 24 (100.0%) |
| Total | 1,793 (52.7%) | 1,610 (47.3%) |
Education in Wayne
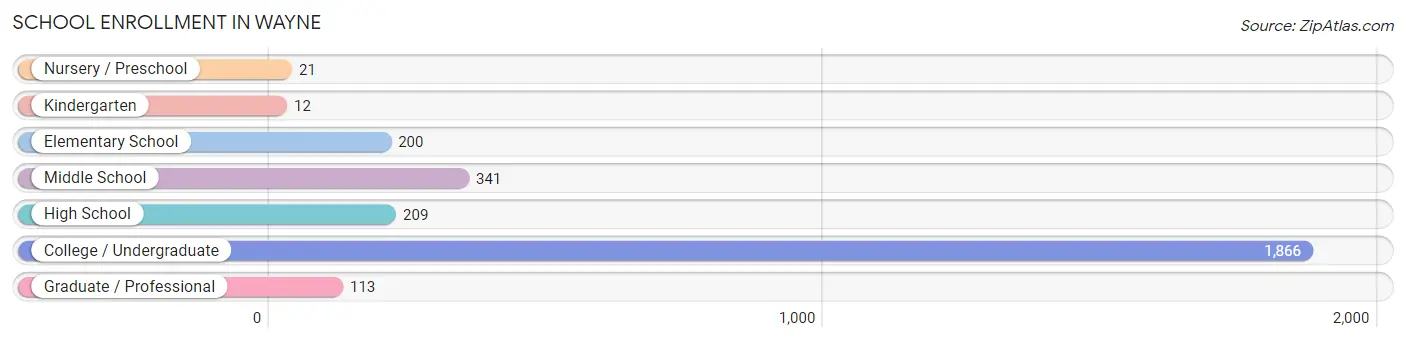
School Enrollment in Wayne
The most common levels of schooling among the 2,762 students in Wayne are college / undergraduate (1,866 | 67.6%), middle school (341 | 12.3%), and high school (209 | 7.6%).
| School Level | # Students | % Students |
| Nursery / Preschool | 21 | 0.8% |
| Kindergarten | 12 | 0.4% |
| Elementary School | 200 | 7.2% |
| Middle School | 341 | 12.3% |
| High School | 209 | 7.6% |
| College / Undergraduate | 1,866 | 67.6% |
| Graduate / Professional | 113 | 4.1% |
| Total | 2,762 | 100.0% |
School Enrollment by Age by Funding Source in Wayne
Out of a total of 2,762 students who are enrolled in schools in Wayne, 36 (1.3%) attend a private institution, while the remaining 2,726 (98.7%) are enrolled in public schools. The age group of 3 to 4 year olds has the highest likelihood of being enrolled in private schools, with 21 (100.0% in the age bracket) enrolled. Conversely, the age group of 10 to 14 year olds has the lowest likelihood of being enrolled in a private school, with 370 (100.0% in the age bracket) attending a public institution.
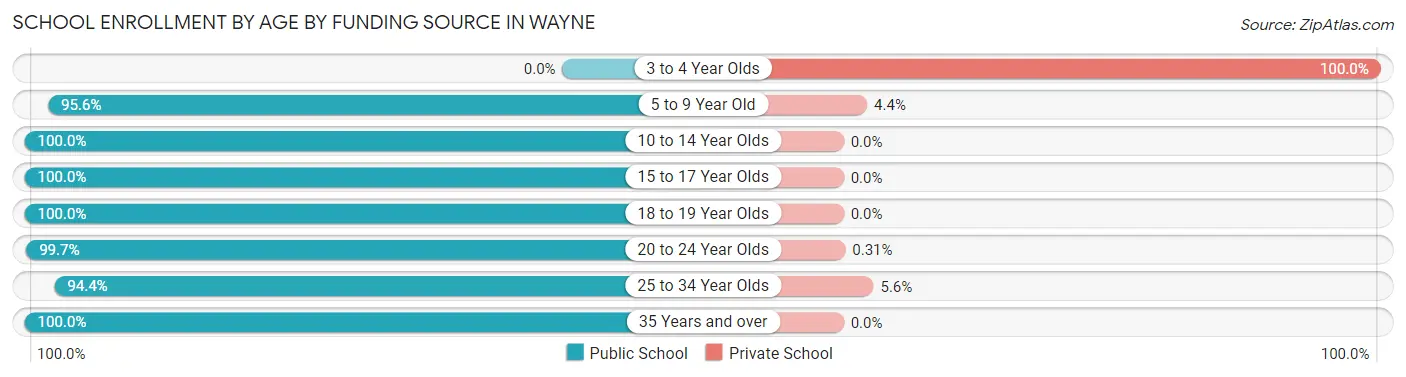
| Age Bracket | Public School | Private School |
| 3 to 4 Year Olds | 0 (0.0%) | 21 (100.0%) |
| 5 to 9 Year Old | 175 (95.6%) | 8 (4.4%) |
| 10 to 14 Year Olds | 370 (100.0%) | 0 (0.0%) |
| 15 to 17 Year Olds | 145 (100.0%) | 0 (0.0%) |
| 18 to 19 Year Olds | 957 (100.0%) | 0 (0.0%) |
| 20 to 24 Year Olds | 954 (99.7%) | 3 (0.3%) |
| 25 to 34 Year Olds | 85 (94.4%) | 5 (5.6%) |
| 35 Years and over | 39 (100.0%) | 0 (0.0%) |
| Total | 2,726 (98.7%) | 36 (1.3%) |
Educational Attainment by Field of Study in Wayne
Education (344 | 33.0%), science & technology (167 | 16.0%), business (123 | 11.8%), arts & humanities (100 | 9.6%), and liberal arts & history (72 | 6.9%) are the most common fields of study among 1,044 individuals in Wayne who have obtained a bachelor's degree or higher.
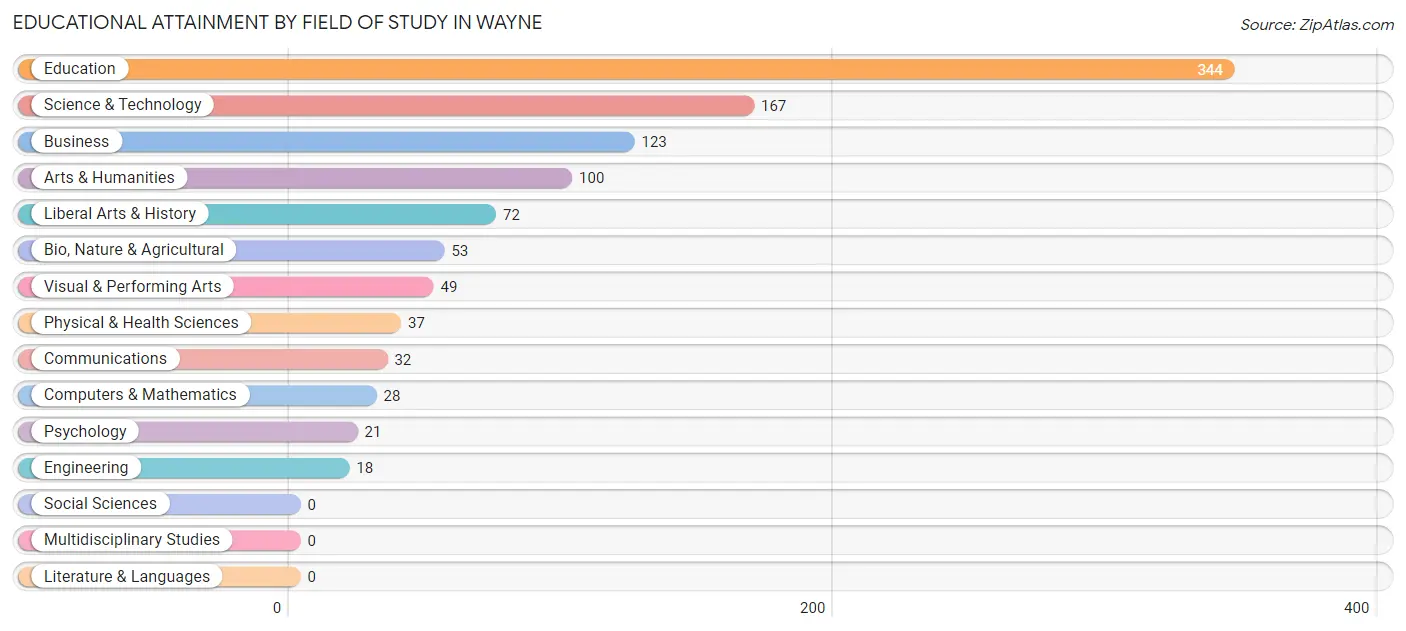
| Field of Study | # Graduates | % Graduates |
| Computers & Mathematics | 28 | 2.7% |
| Bio, Nature & Agricultural | 53 | 5.1% |
| Physical & Health Sciences | 37 | 3.5% |
| Psychology | 21 | 2.0% |
| Social Sciences | 0 | 0.0% |
| Engineering | 18 | 1.7% |
| Multidisciplinary Studies | 0 | 0.0% |
| Science & Technology | 167 | 16.0% |
| Business | 123 | 11.8% |
| Education | 344 | 33.0% |
| Literature & Languages | 0 | 0.0% |
| Liberal Arts & History | 72 | 6.9% |
| Visual & Performing Arts | 49 | 4.7% |
| Communications | 32 | 3.1% |
| Arts & Humanities | 100 | 9.6% |
| Total | 1,044 | 100.0% |
Transportation & Commute in Wayne
Vehicle Availability by Sex in Wayne
The most prevalent vehicle ownership categories in Wayne are males with 2 vehicles (646, accounting for 45.3%) and females with 2 vehicles (422, making up 54.9%).
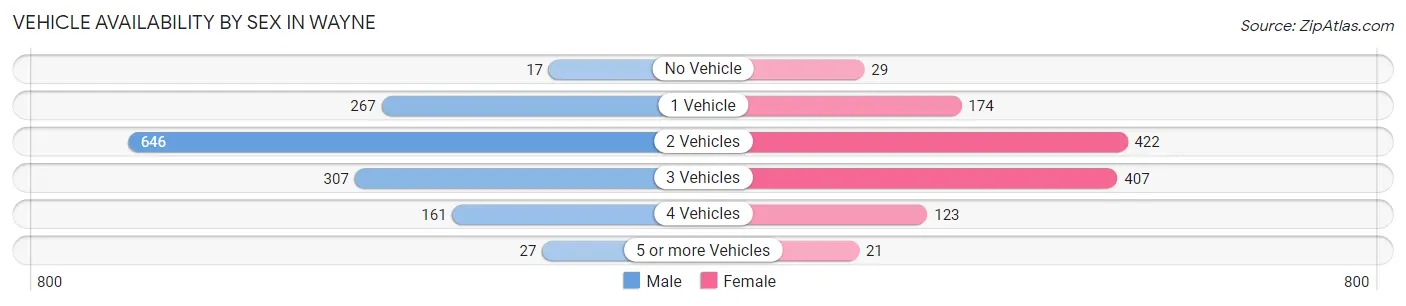
| Vehicles Available | Male | Female |
| No Vehicle | 17 (1.2%) | 29 (2.5%) |
| 1 Vehicle | 267 (18.7%) | 174 (14.8%) |
| 2 Vehicles | 646 (45.3%) | 422 (35.9%) |
| 3 Vehicles | 307 (21.5%) | 407 (34.6%) |
| 4 Vehicles | 161 (11.3%) | 123 (10.5%) |
| 5 or more Vehicles | 27 (1.9%) | 21 (1.8%) |
| Total | 1,425 (100.0%) | 1,176 (100.0%) |
Commute Time in Wayne
The most frequently occuring commute durations in Wayne are 5 to 9 minutes (1,248 commuters, 44.2%), less than 5 minutes (439 commuters, 15.5%), and 15 to 19 minutes (365 commuters, 12.9%).
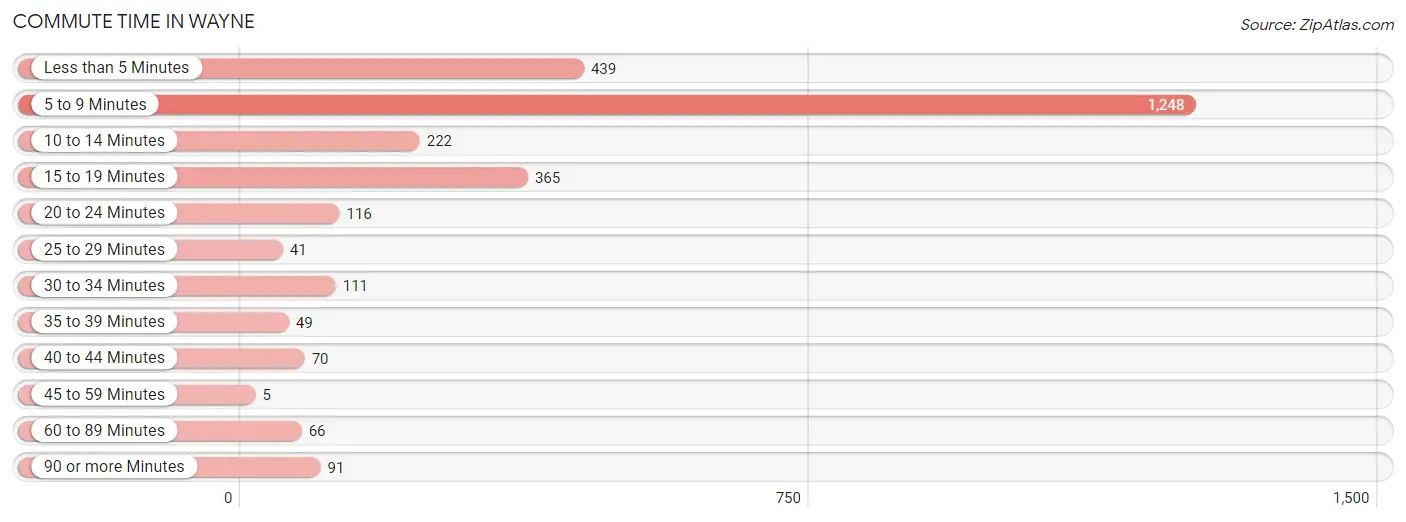
| Commute Time | # Commuters | % Commuters |
| Less than 5 Minutes | 439 | 15.5% |
| 5 to 9 Minutes | 1,248 | 44.2% |
| 10 to 14 Minutes | 222 | 7.9% |
| 15 to 19 Minutes | 365 | 12.9% |
| 20 to 24 Minutes | 116 | 4.1% |
| 25 to 29 Minutes | 41 | 1.5% |
| 30 to 34 Minutes | 111 | 3.9% |
| 35 to 39 Minutes | 49 | 1.7% |
| 40 to 44 Minutes | 70 | 2.5% |
| 45 to 59 Minutes | 5 | 0.2% |
| 60 to 89 Minutes | 66 | 2.3% |
| 90 or more Minutes | 91 | 3.2% |
Commute Time by Sex in Wayne
The most common commute times in Wayne are 5 to 9 minutes (563 commuters, 38.4%) for males and 5 to 9 minutes (685 commuters, 50.5%) for females.
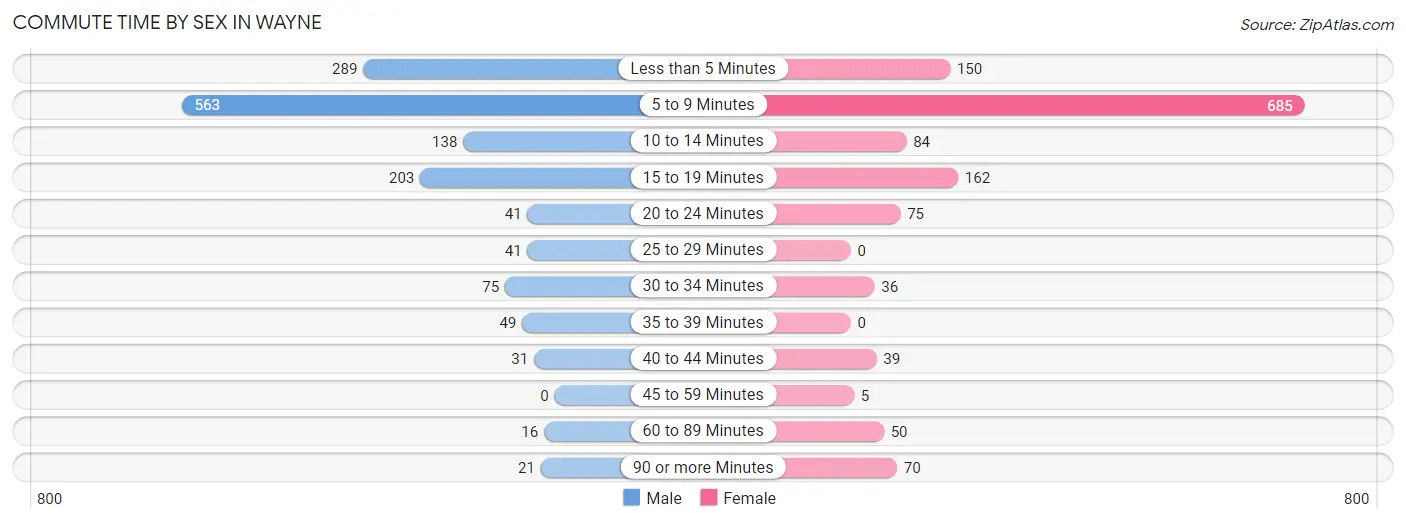
| Commute Time | Male | Female |
| Less than 5 Minutes | 289 (19.7%) | 150 (11.1%) |
| 5 to 9 Minutes | 563 (38.4%) | 685 (50.5%) |
| 10 to 14 Minutes | 138 (9.4%) | 84 (6.2%) |
| 15 to 19 Minutes | 203 (13.8%) | 162 (11.9%) |
| 20 to 24 Minutes | 41 (2.8%) | 75 (5.5%) |
| 25 to 29 Minutes | 41 (2.8%) | 0 (0.0%) |
| 30 to 34 Minutes | 75 (5.1%) | 36 (2.6%) |
| 35 to 39 Minutes | 49 (3.3%) | 0 (0.0%) |
| 40 to 44 Minutes | 31 (2.1%) | 39 (2.9%) |
| 45 to 59 Minutes | 0 (0.0%) | 5 (0.4%) |
| 60 to 89 Minutes | 16 (1.1%) | 50 (3.7%) |
| 90 or more Minutes | 21 (1.4%) | 70 (5.2%) |
Time of Departure to Work by Sex in Wayne
The most frequent times of departure to work in Wayne are 7:30 AM to 7:59 AM (338, 23.0%) for males and 7:30 AM to 7:59 AM (299, 22.1%) for females.
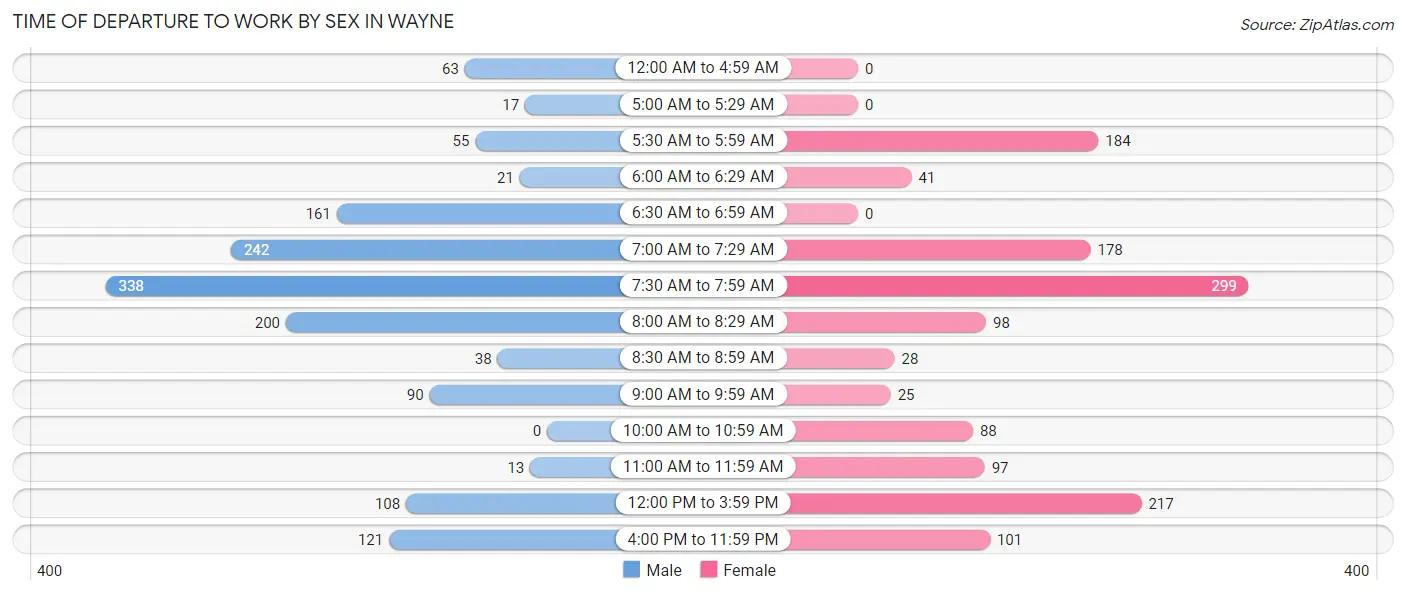
| Time of Departure | Male | Female |
| 12:00 AM to 4:59 AM | 63 (4.3%) | 0 (0.0%) |
| 5:00 AM to 5:29 AM | 17 (1.2%) | 0 (0.0%) |
| 5:30 AM to 5:59 AM | 55 (3.7%) | 184 (13.6%) |
| 6:00 AM to 6:29 AM | 21 (1.4%) | 41 (3.0%) |
| 6:30 AM to 6:59 AM | 161 (11.0%) | 0 (0.0%) |
| 7:00 AM to 7:29 AM | 242 (16.5%) | 178 (13.1%) |
| 7:30 AM to 7:59 AM | 338 (23.0%) | 299 (22.1%) |
| 8:00 AM to 8:29 AM | 200 (13.6%) | 98 (7.2%) |
| 8:30 AM to 8:59 AM | 38 (2.6%) | 28 (2.1%) |
| 9:00 AM to 9:59 AM | 90 (6.1%) | 25 (1.8%) |
| 10:00 AM to 10:59 AM | 0 (0.0%) | 88 (6.5%) |
| 11:00 AM to 11:59 AM | 13 (0.9%) | 97 (7.1%) |
| 12:00 PM to 3:59 PM | 108 (7.4%) | 217 (16.0%) |
| 4:00 PM to 11:59 PM | 121 (8.3%) | 101 (7.4%) |
| Total | 1,467 (100.0%) | 1,356 (100.0%) |
Housing Occupancy in Wayne
Occupancy by Ownership in Wayne
Of the total 2,160 dwellings in Wayne, owner-occupied units account for 1,271 (58.8%), while renter-occupied units make up 889 (41.2%).
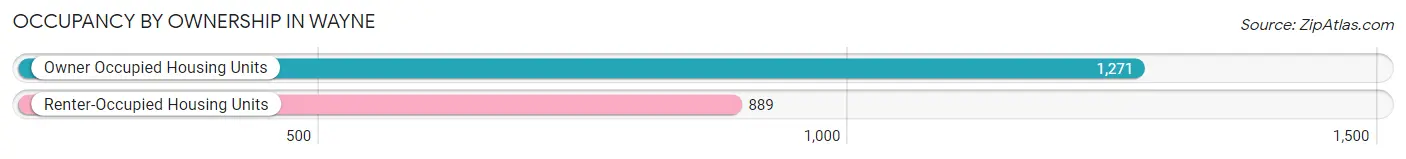
| Occupancy | # Housing Units | % Housing Units |
| Owner Occupied Housing Units | 1,271 | 58.8% |
| Renter-Occupied Housing Units | 889 | 41.2% |
| Total Occupied Housing Units | 2,160 | 100.0% |
Occupancy by Household Size in Wayne
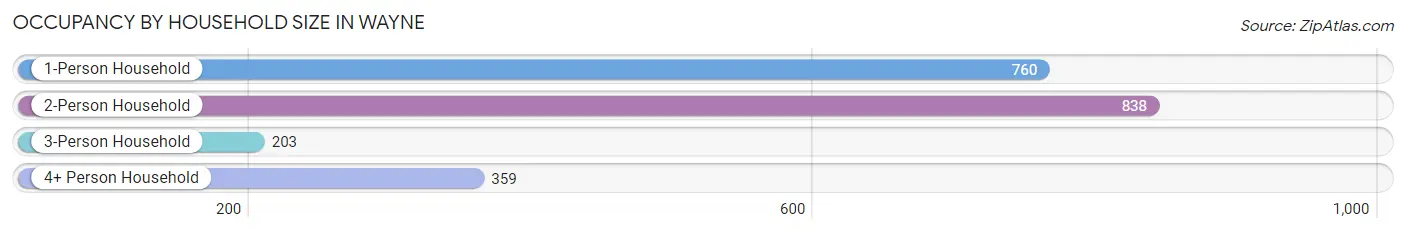
| Household Size | # Housing Units | % Housing Units |
| 1-Person Household | 760 | 35.2% |
| 2-Person Household | 838 | 38.8% |
| 3-Person Household | 203 | 9.4% |
| 4+ Person Household | 359 | 16.6% |
| Total Housing Units | 2,160 | 100.0% |
Occupancy by Ownership by Household Size in Wayne
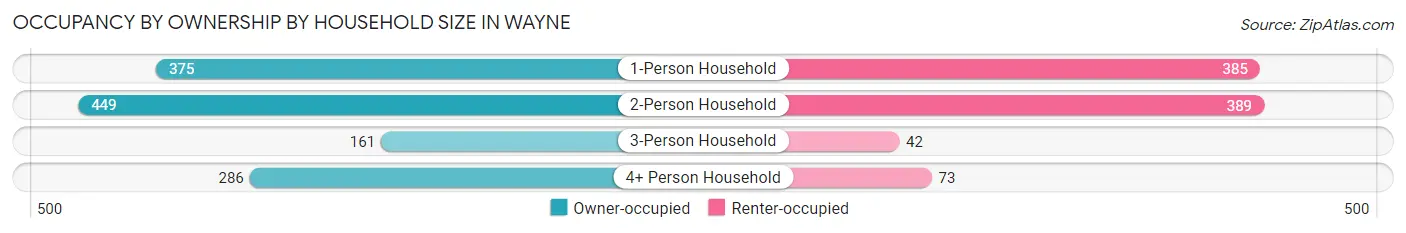
| Household Size | Owner-occupied | Renter-occupied |
| 1-Person Household | 375 (49.3%) | 385 (50.7%) |
| 2-Person Household | 449 (53.6%) | 389 (46.4%) |
| 3-Person Household | 161 (79.3%) | 42 (20.7%) |
| 4+ Person Household | 286 (79.7%) | 73 (20.3%) |
| Total Housing Units | 1,271 (58.8%) | 889 (41.2%) |
Occupancy by Educational Attainment in Wayne
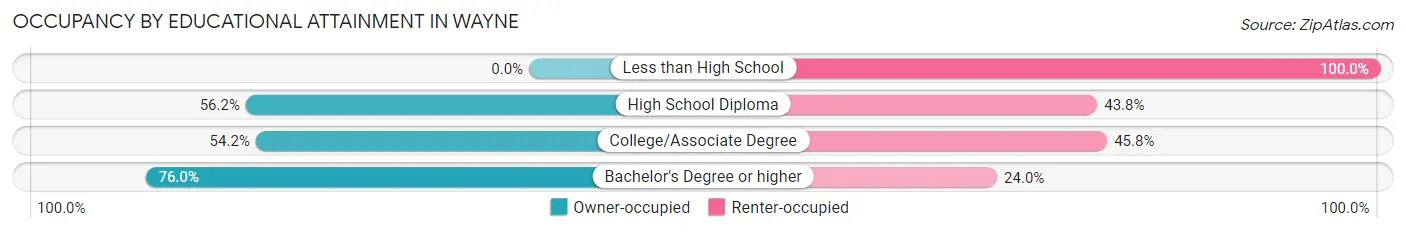
| Household Size | Owner-occupied | Renter-occupied |
| Less than High School | 0 (0.0%) | 100 (100.0%) |
| High School Diploma | 260 (56.2%) | 203 (43.8%) |
| College/Associate Degree | 504 (54.2%) | 426 (45.8%) |
| Bachelor's Degree or higher | 507 (76.0%) | 160 (24.0%) |
Occupancy by Age of Householder in Wayne
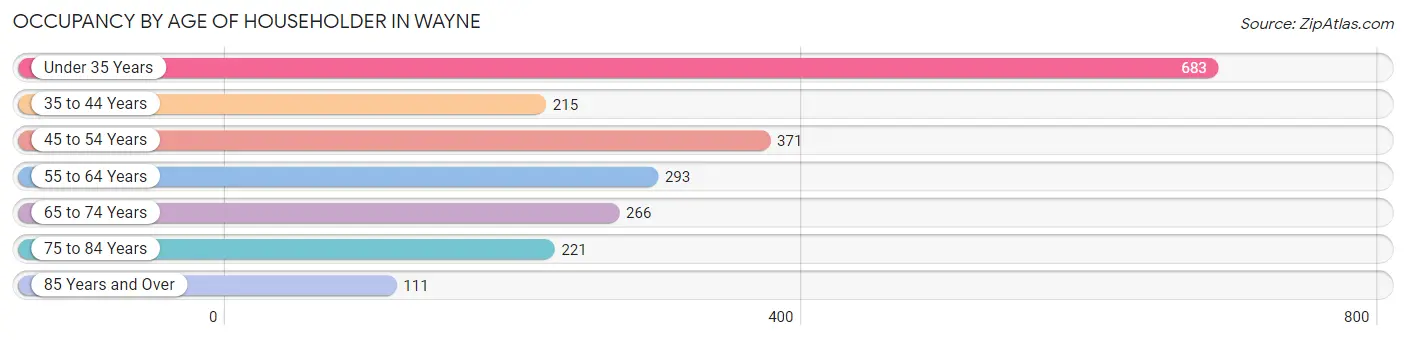
| Age Bracket | # Households | % Households |
| Under 35 Years | 683 | 31.6% |
| 35 to 44 Years | 215 | 10.0% |
| 45 to 54 Years | 371 | 17.2% |
| 55 to 64 Years | 293 | 13.6% |
| 65 to 74 Years | 266 | 12.3% |
| 75 to 84 Years | 221 | 10.2% |
| 85 Years and Over | 111 | 5.1% |
| Total | 2,160 | 100.0% |
Housing Finances in Wayne
Median Income by Occupancy in Wayne
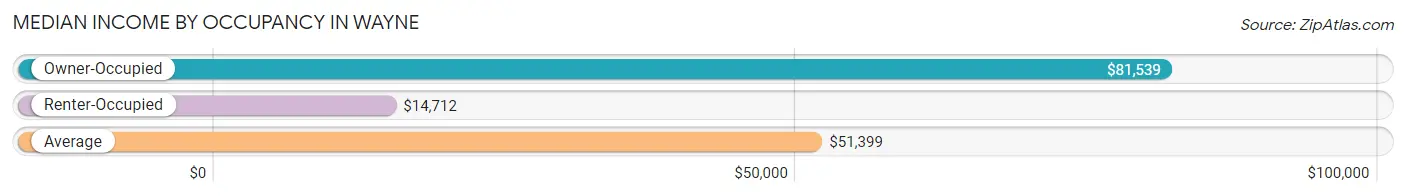
| Occupancy Type | # Households | Median Income |
| Owner-Occupied | 1,271 (58.8%) | $81,539 |
| Renter-Occupied | 889 (41.2%) | $14,712 |
| Average | 2,160 (100.0%) | $51,399 |
Occupancy by Householder Income Bracket in Wayne
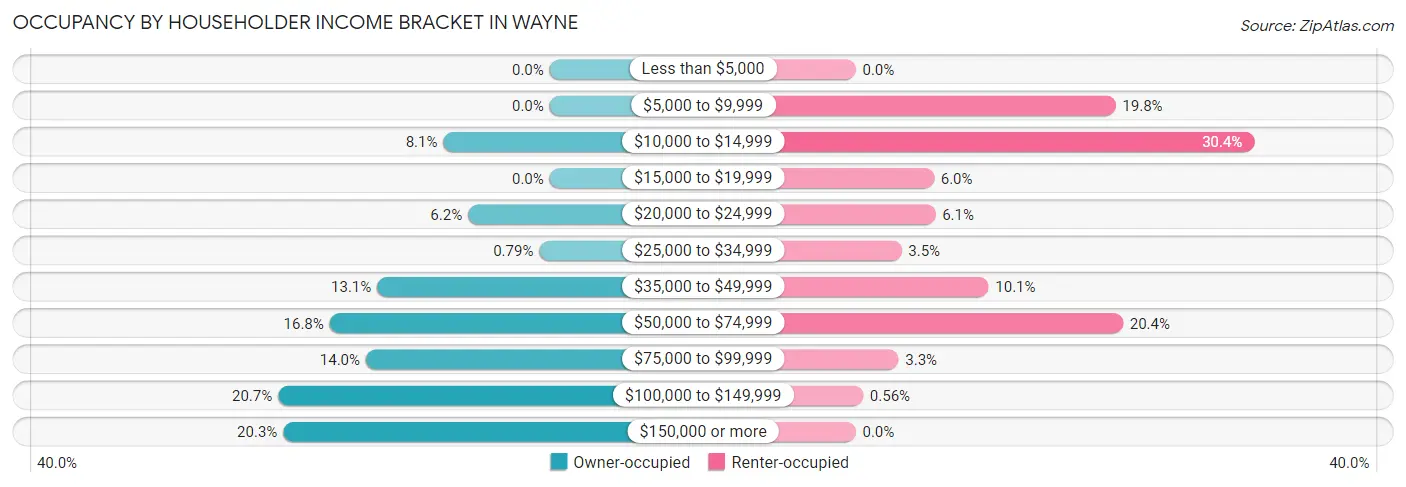
| Income Bracket | Owner-occupied | Renter-occupied |
| Less than $5,000 | 0 (0.0%) | 0 (0.0%) |
| $5,000 to $9,999 | 0 (0.0%) | 176 (19.8%) |
| $10,000 to $14,999 | 103 (8.1%) | 270 (30.4%) |
| $15,000 to $19,999 | 0 (0.0%) | 53 (6.0%) |
| $20,000 to $24,999 | 79 (6.2%) | 54 (6.1%) |
| $25,000 to $34,999 | 10 (0.8%) | 31 (3.5%) |
| $35,000 to $49,999 | 167 (13.1%) | 90 (10.1%) |
| $50,000 to $74,999 | 213 (16.8%) | 181 (20.4%) |
| $75,000 to $99,999 | 178 (14.0%) | 29 (3.3%) |
| $100,000 to $149,999 | 263 (20.7%) | 5 (0.6%) |
| $150,000 or more | 258 (20.3%) | 0 (0.0%) |
| Total | 1,271 (100.0%) | 889 (100.0%) |
Monthly Housing Cost Tiers in Wayne
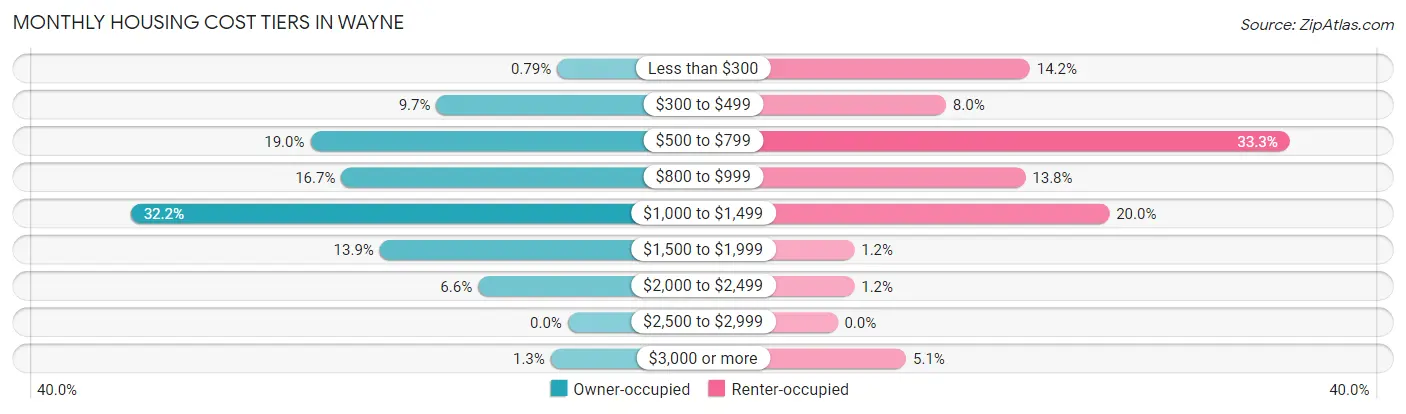
| Monthly Cost | Owner-occupied | Renter-occupied |
| Less than $300 | 10 (0.8%) | 126 (14.2%) |
| $300 to $499 | 123 (9.7%) | 71 (8.0%) |
| $500 to $799 | 241 (19.0%) | 296 (33.3%) |
| $800 to $999 | 212 (16.7%) | 123 (13.8%) |
| $1,000 to $1,499 | 409 (32.2%) | 178 (20.0%) |
| $1,500 to $1,999 | 176 (13.9%) | 11 (1.2%) |
| $2,000 to $2,499 | 84 (6.6%) | 11 (1.2%) |
| $2,500 to $2,999 | 0 (0.0%) | 0 (0.0%) |
| $3,000 or more | 16 (1.3%) | 45 (5.1%) |
| Total | 1,271 (100.0%) | 889 (100.0%) |
Physical Housing Characteristics in Wayne
Housing Structures in Wayne
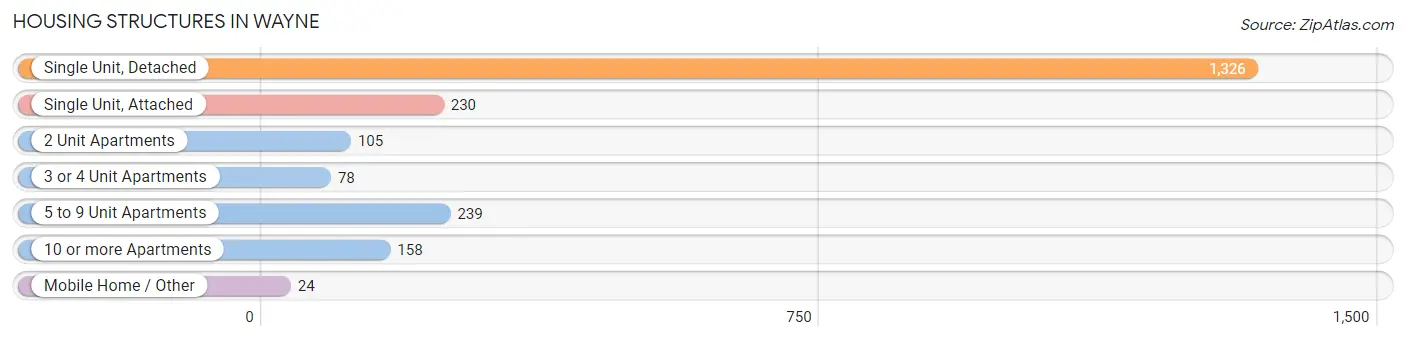
| Structure Type | # Housing Units | % Housing Units |
| Single Unit, Detached | 1,326 | 61.4% |
| Single Unit, Attached | 230 | 10.6% |
| 2 Unit Apartments | 105 | 4.9% |
| 3 or 4 Unit Apartments | 78 | 3.6% |
| 5 to 9 Unit Apartments | 239 | 11.1% |
| 10 or more Apartments | 158 | 7.3% |
| Mobile Home / Other | 24 | 1.1% |
| Total | 2,160 | 100.0% |
Housing Structures by Occupancy in Wayne
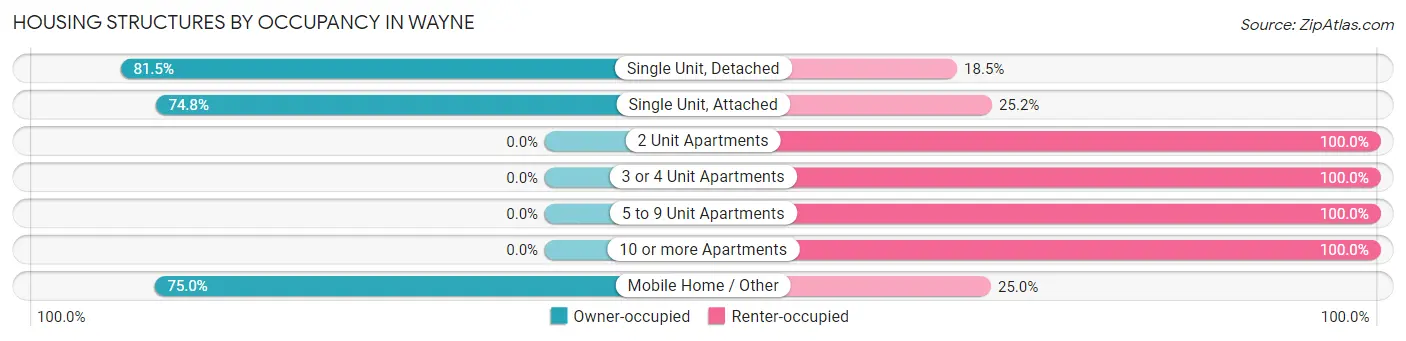
| Structure Type | Owner-occupied | Renter-occupied |
| Single Unit, Detached | 1,081 (81.5%) | 245 (18.5%) |
| Single Unit, Attached | 172 (74.8%) | 58 (25.2%) |
| 2 Unit Apartments | 0 (0.0%) | 105 (100.0%) |
| 3 or 4 Unit Apartments | 0 (0.0%) | 78 (100.0%) |
| 5 to 9 Unit Apartments | 0 (0.0%) | 239 (100.0%) |
| 10 or more Apartments | 0 (0.0%) | 158 (100.0%) |
| Mobile Home / Other | 18 (75.0%) | 6 (25.0%) |
| Total | 1,271 (58.8%) | 889 (41.2%) |
Housing Structures by Number of Rooms in Wayne
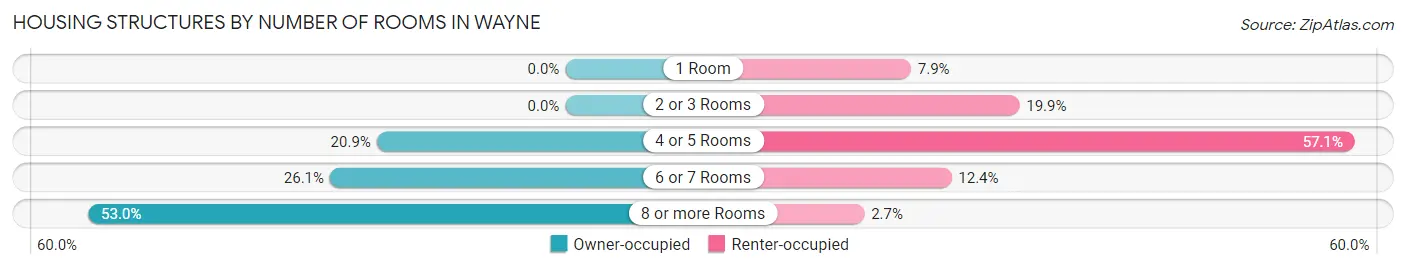
| Number of Rooms | Owner-occupied | Renter-occupied |
| 1 Room | 0 (0.0%) | 70 (7.9%) |
| 2 or 3 Rooms | 0 (0.0%) | 177 (19.9%) |
| 4 or 5 Rooms | 266 (20.9%) | 508 (57.1%) |
| 6 or 7 Rooms | 332 (26.1%) | 110 (12.4%) |
| 8 or more Rooms | 673 (52.9%) | 24 (2.7%) |
| Total | 1,271 (100.0%) | 889 (100.0%) |
Housing Structure by Heating Type in Wayne
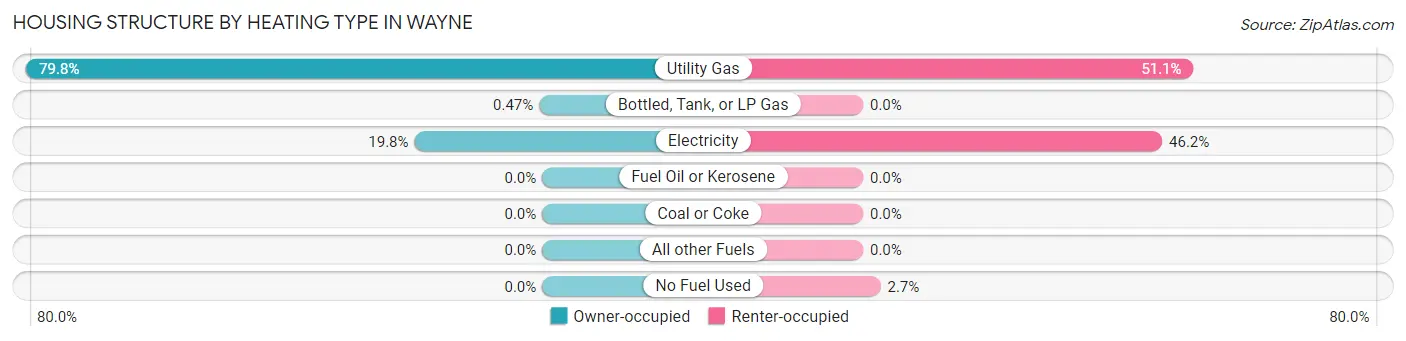
| Heating Type | Owner-occupied | Renter-occupied |
| Utility Gas | 1,014 (79.8%) | 454 (51.1%) |
| Bottled, Tank, or LP Gas | 6 (0.5%) | 0 (0.0%) |
| Electricity | 251 (19.8%) | 411 (46.2%) |
| Fuel Oil or Kerosene | 0 (0.0%) | 0 (0.0%) |
| Coal or Coke | 0 (0.0%) | 0 (0.0%) |
| All other Fuels | 0 (0.0%) | 0 (0.0%) |
| No Fuel Used | 0 (0.0%) | 24 (2.7%) |
| Total | 1,271 (100.0%) | 889 (100.0%) |
Household Vehicle Usage in Wayne
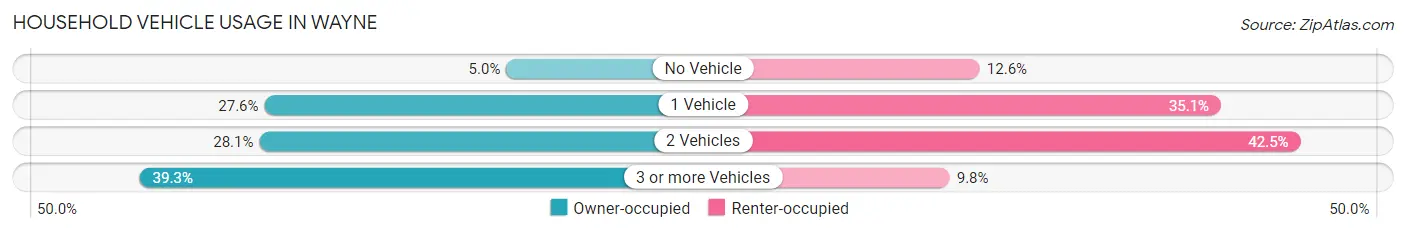
| Vehicles per Household | Owner-occupied | Renter-occupied |
| No Vehicle | 64 (5.0%) | 112 (12.6%) |
| 1 Vehicle | 351 (27.6%) | 312 (35.1%) |
| 2 Vehicles | 357 (28.1%) | 378 (42.5%) |
| 3 or more Vehicles | 499 (39.3%) | 87 (9.8%) |
| Total | 1,271 (100.0%) | 889 (100.0%) |
Real Estate & Mortgages in Wayne
Real Estate and Mortgage Overview in Wayne
| Characteristic | Without Mortgage | With Mortgage |
| Housing Units | 434 | 837 |
| Median Property Value | $183,100 | $165,100 |
| Median Household Income | $61,250 | $207 |
| Monthly Housing Costs | $580 | $16 |
| Real Estate Taxes | $2,357 | $0 |
Property Value by Mortgage Status in Wayne
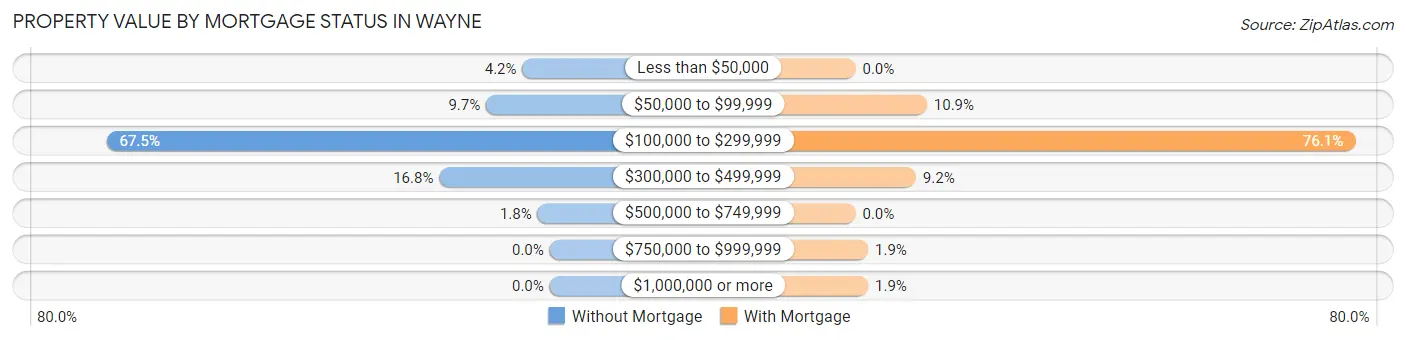
| Property Value | Without Mortgage | With Mortgage |
| Less than $50,000 | 18 (4.2%) | 0 (0.0%) |
| $50,000 to $99,999 | 42 (9.7%) | 91 (10.9%) |
| $100,000 to $299,999 | 293 (67.5%) | 637 (76.1%) |
| $300,000 to $499,999 | 73 (16.8%) | 77 (9.2%) |
| $500,000 to $749,999 | 8 (1.8%) | 0 (0.0%) |
| $750,000 to $999,999 | 0 (0.0%) | 16 (1.9%) |
| $1,000,000 or more | 0 (0.0%) | 16 (1.9%) |
| Total | 434 (100.0%) | 837 (100.0%) |
Household Income by Mortgage Status in Wayne
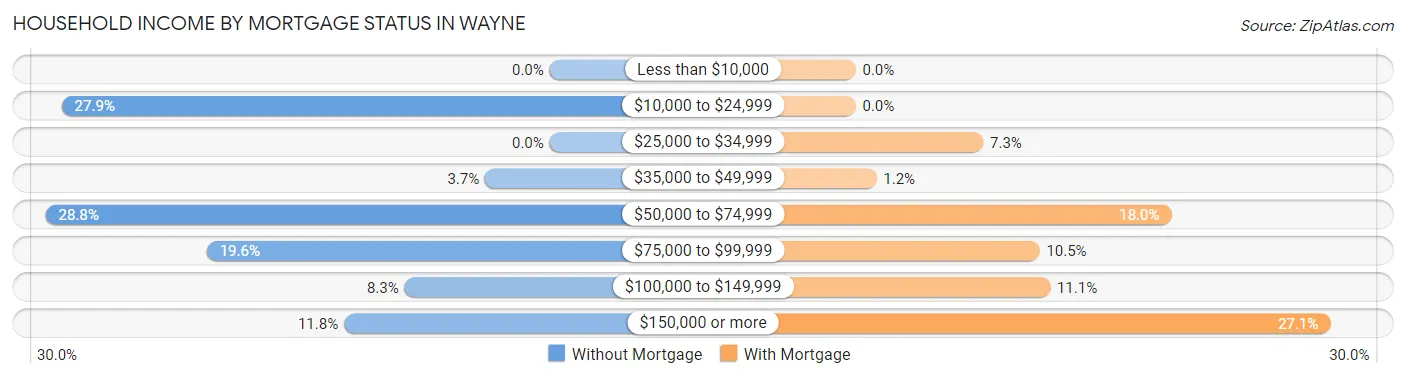
| Household Income | Without Mortgage | With Mortgage |
| Less than $10,000 | 0 (0.0%) | 0 (0.0%) |
| $10,000 to $24,999 | 121 (27.9%) | 0 (0.0%) |
| $25,000 to $34,999 | 0 (0.0%) | 61 (7.3%) |
| $35,000 to $49,999 | 16 (3.7%) | 10 (1.2%) |
| $50,000 to $74,999 | 125 (28.8%) | 151 (18.0%) |
| $75,000 to $99,999 | 85 (19.6%) | 88 (10.5%) |
| $100,000 to $149,999 | 36 (8.3%) | 93 (11.1%) |
| $150,000 or more | 51 (11.7%) | 227 (27.1%) |
| Total | 434 (100.0%) | 837 (100.0%) |
Property Value to Household Income Ratio in Wayne
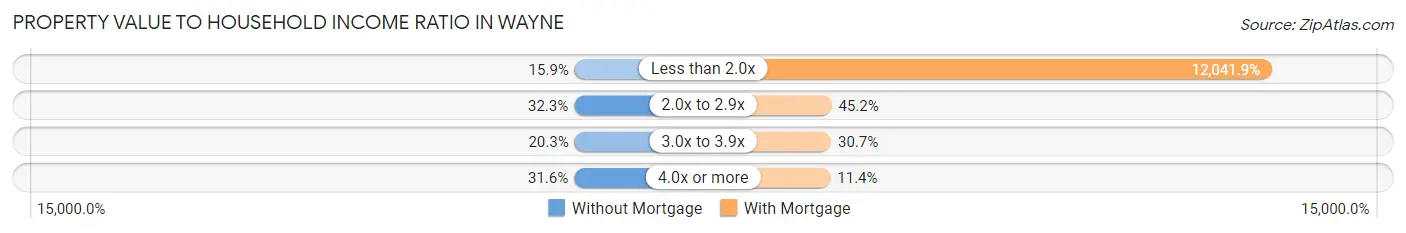
| Value-to-Income Ratio | Without Mortgage | With Mortgage |
| Less than 2.0x | 69 (15.9%) | 100,791 (12,041.9%) |
| 2.0x to 2.9x | 140 (32.3%) | 378 (45.2%) |
| 3.0x to 3.9x | 88 (20.3%) | 257 (30.7%) |
| 4.0x or more | 137 (31.6%) | 95 (11.4%) |
| Total | 434 (100.0%) | 837 (100.0%) |
Real Estate Taxes by Mortgage Status in Wayne
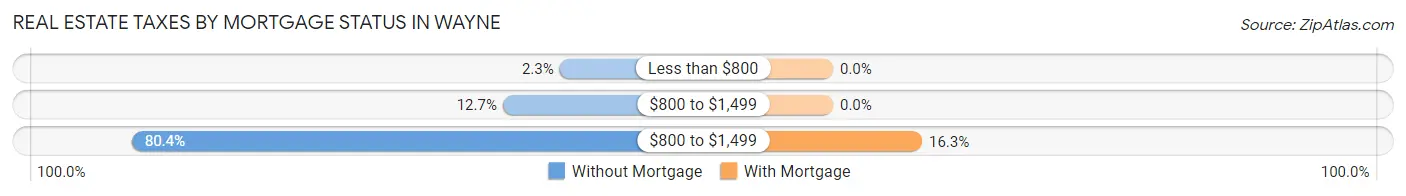
| Property Taxes | Without Mortgage | With Mortgage |
| Less than $800 | 10 (2.3%) | 0 (0.0%) |
| $800 to $1,499 | 55 (12.7%) | 0 (0.0%) |
| $800 to $1,499 | 349 (80.4%) | 136 (16.3%) |
| Total | 434 (100.0%) | 837 (100.0%) |
Health & Disability in Wayne
Health Insurance Coverage by Age in Wayne
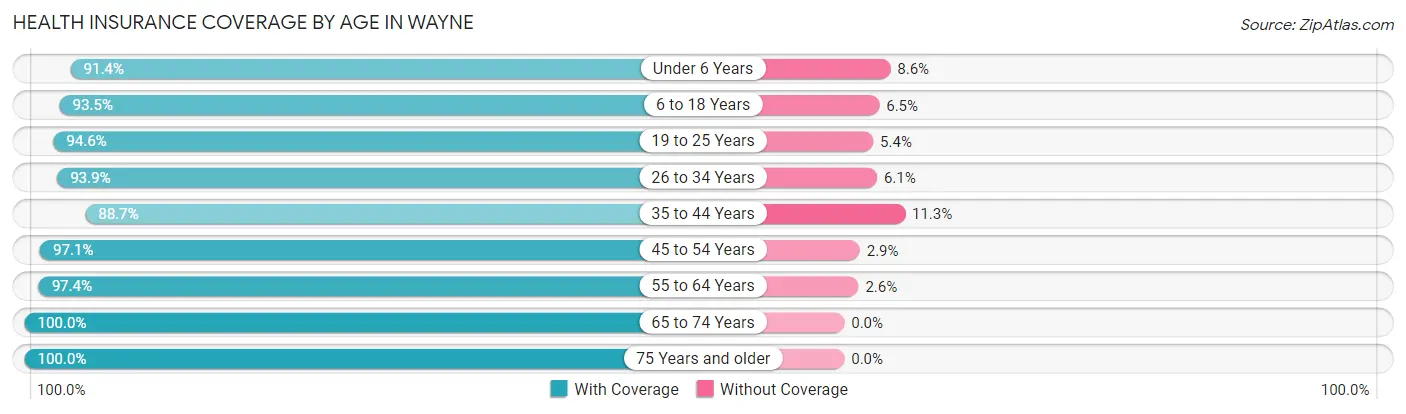
| Age Bracket | With Coverage | Without Coverage |
| Under 6 Years | 234 (91.4%) | 22 (8.6%) |
| 6 to 18 Years | 988 (93.5%) | 69 (6.5%) |
| 19 to 25 Years | 1,794 (94.6%) | 102 (5.4%) |
| 26 to 34 Years | 370 (93.9%) | 24 (6.1%) |
| 35 to 44 Years | 493 (88.7%) | 63 (11.3%) |
| 45 to 54 Years | 470 (97.1%) | 14 (2.9%) |
| 55 to 64 Years | 517 (97.4%) | 14 (2.6%) |
| 65 to 74 Years | 339 (100.0%) | 0 (0.0%) |
| 75 Years and older | 423 (100.0%) | 0 (0.0%) |
| Total | 5,628 (94.8%) | 308 (5.2%) |
Health Insurance Coverage by Citizenship Status in Wayne
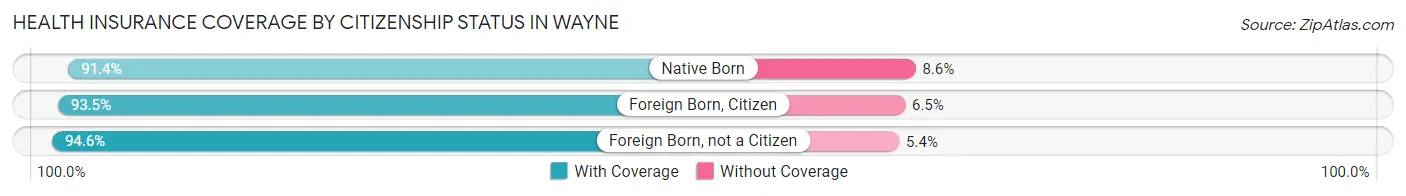
| Citizenship Status | With Coverage | Without Coverage |
| Native Born | 234 (91.4%) | 22 (8.6%) |
| Foreign Born, Citizen | 988 (93.5%) | 69 (6.5%) |
| Foreign Born, not a Citizen | 1,794 (94.6%) | 102 (5.4%) |
Health Insurance Coverage by Household Income in Wayne
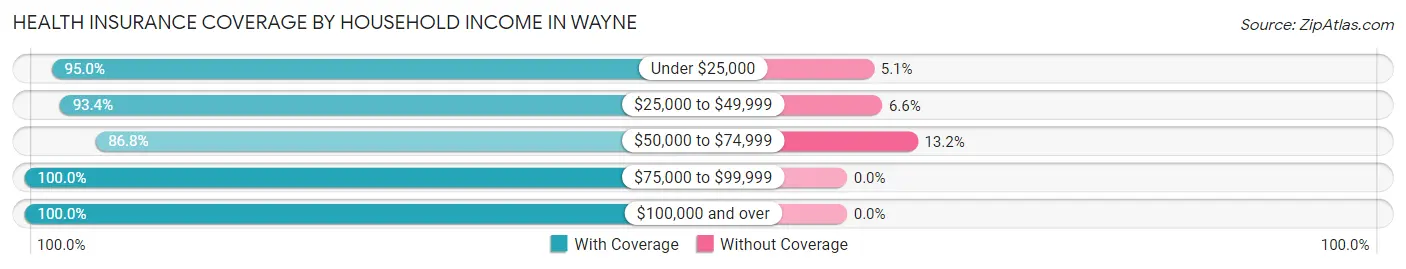
| Household Income | With Coverage | Without Coverage |
| Under $25,000 | 997 (95.0%) | 53 (5.1%) |
| $25,000 to $49,999 | 765 (93.4%) | 54 (6.6%) |
| $50,000 to $74,999 | 662 (86.8%) | 101 (13.2%) |
| $75,000 to $99,999 | 528 (100.0%) | 0 (0.0%) |
| $100,000 and over | 1,502 (100.0%) | 0 (0.0%) |
Public vs Private Health Insurance Coverage by Age in Wayne
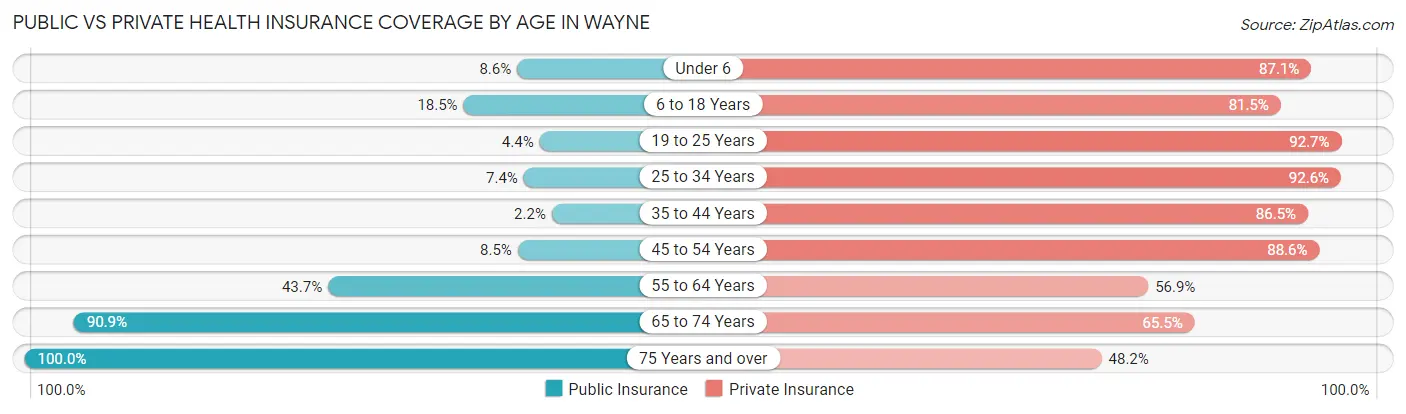
| Age Bracket | Public Insurance | Private Insurance |
| Under 6 | 22 (8.6%) | 223 (87.1%) |
| 6 to 18 Years | 196 (18.5%) | 861 (81.5%) |
| 19 to 25 Years | 84 (4.4%) | 1,758 (92.7%) |
| 25 to 34 Years | 29 (7.4%) | 365 (92.6%) |
| 35 to 44 Years | 12 (2.2%) | 481 (86.5%) |
| 45 to 54 Years | 41 (8.5%) | 429 (88.6%) |
| 55 to 64 Years | 232 (43.7%) | 302 (56.9%) |
| 65 to 74 Years | 308 (90.9%) | 222 (65.5%) |
| 75 Years and over | 423 (100.0%) | 204 (48.2%) |
| Total | 1,347 (22.7%) | 4,845 (81.6%) |
Disability Status by Sex by Age in Wayne
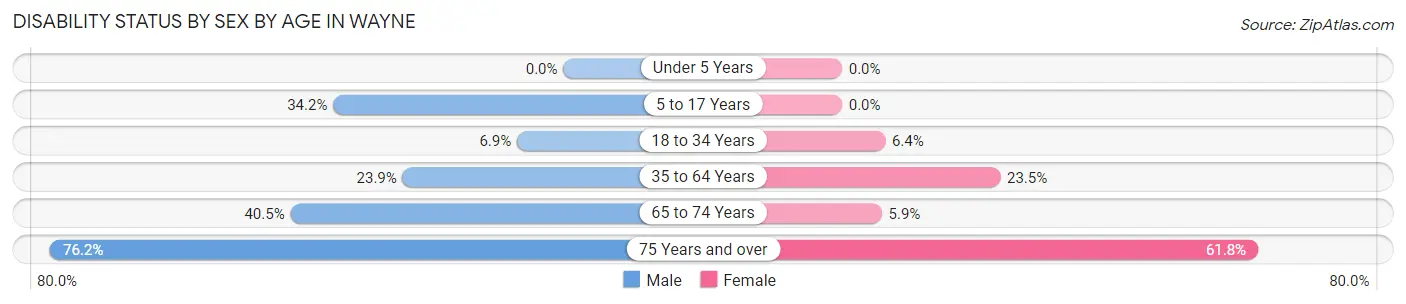
| Age Bracket | Male | Female |
| Under 5 Years | 0 (0.0%) | 0 (0.0%) |
| 5 to 17 Years | 123 (34.2%) | 0 (0.0%) |
| 18 to 34 Years | 95 (6.9%) | 82 (6.4%) |
| 35 to 64 Years | 184 (23.9%) | 188 (23.5%) |
| 65 to 74 Years | 62 (40.5%) | 11 (5.9%) |
| 75 Years and over | 109 (76.2%) | 173 (61.8%) |
Disability Class by Sex by Age in Wayne
Disability Class: Hearing Difficulty
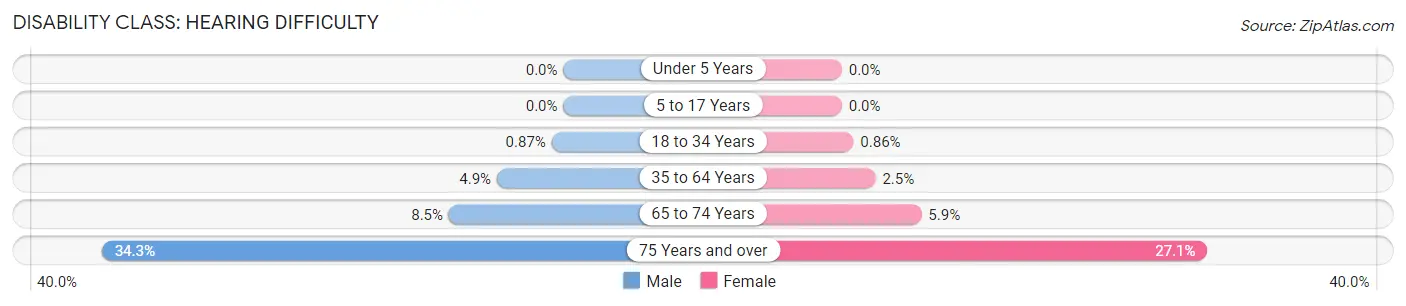
| Age Bracket | Male | Female |
| Under 5 Years | 0 (0.0%) | 0 (0.0%) |
| 5 to 17 Years | 0 (0.0%) | 0 (0.0%) |
| 18 to 34 Years | 12 (0.9%) | 11 (0.9%) |
| 35 to 64 Years | 38 (4.9%) | 20 (2.5%) |
| 65 to 74 Years | 13 (8.5%) | 11 (5.9%) |
| 75 Years and over | 49 (34.3%) | 76 (27.1%) |
Disability Class: Vision Difficulty
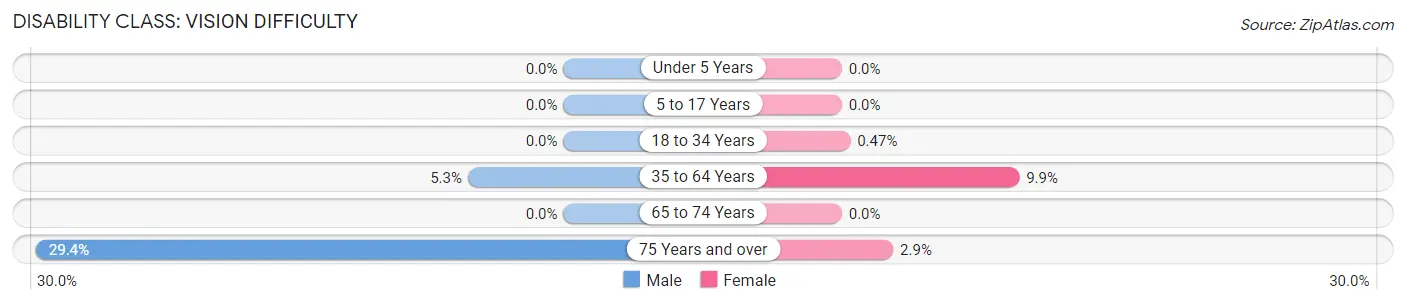
| Age Bracket | Male | Female |
| Under 5 Years | 0 (0.0%) | 0 (0.0%) |
| 5 to 17 Years | 0 (0.0%) | 0 (0.0%) |
| 18 to 34 Years | 0 (0.0%) | 6 (0.5%) |
| 35 to 64 Years | 41 (5.3%) | 79 (9.9%) |
| 65 to 74 Years | 0 (0.0%) | 0 (0.0%) |
| 75 Years and over | 42 (29.4%) | 8 (2.9%) |
Disability Class: Cognitive Difficulty
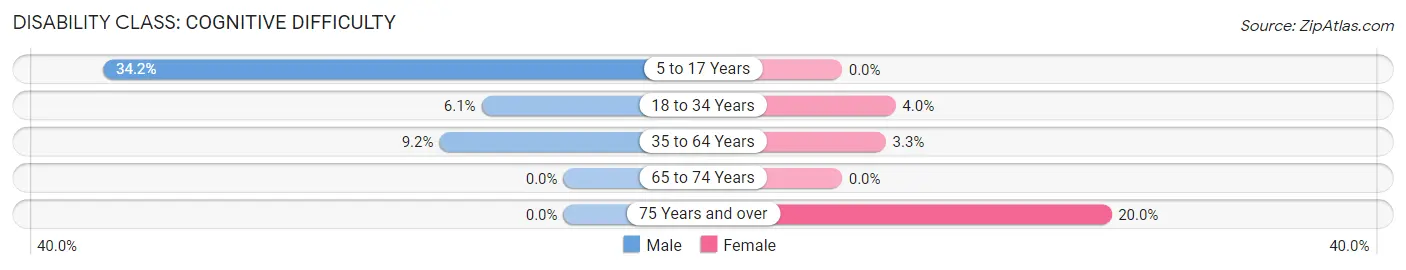
| Age Bracket | Male | Female |
| 5 to 17 Years | 123 (34.2%) | 0 (0.0%) |
| 18 to 34 Years | 84 (6.1%) | 51 (4.0%) |
| 35 to 64 Years | 71 (9.2%) | 26 (3.3%) |
| 65 to 74 Years | 0 (0.0%) | 0 (0.0%) |
| 75 Years and over | 0 (0.0%) | 56 (20.0%) |
Disability Class: Ambulatory Difficulty
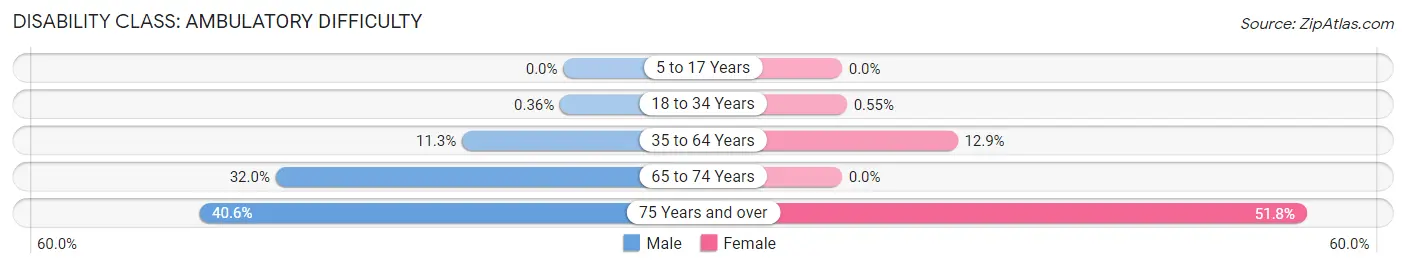
| Age Bracket | Male | Female |
| 5 to 17 Years | 0 (0.0%) | 0 (0.0%) |
| 18 to 34 Years | 5 (0.4%) | 7 (0.5%) |
| 35 to 64 Years | 87 (11.3%) | 103 (12.9%) |
| 65 to 74 Years | 49 (32.0%) | 0 (0.0%) |
| 75 Years and over | 58 (40.6%) | 145 (51.8%) |
Disability Class: Self-Care Difficulty
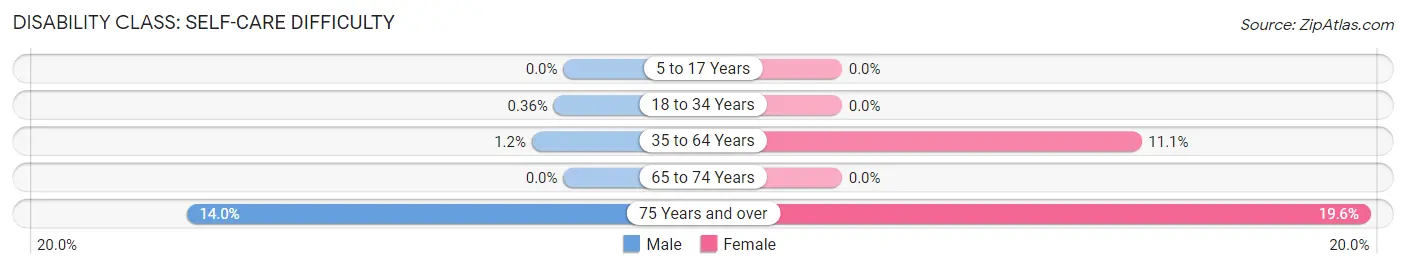
| Age Bracket | Male | Female |
| 5 to 17 Years | 0 (0.0%) | 0 (0.0%) |
| 18 to 34 Years | 5 (0.4%) | 0 (0.0%) |
| 35 to 64 Years | 9 (1.2%) | 89 (11.1%) |
| 65 to 74 Years | 0 (0.0%) | 0 (0.0%) |
| 75 Years and over | 20 (14.0%) | 55 (19.6%) |
Technology Access in Wayne
Computing Device Access in Wayne
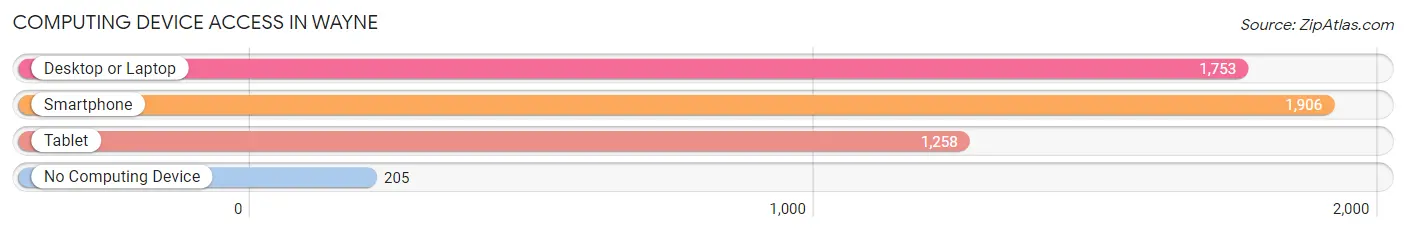
| Device Type | # Households | % Households |
| Desktop or Laptop | 1,753 | 81.2% |
| Smartphone | 1,906 | 88.2% |
| Tablet | 1,258 | 58.2% |
| No Computing Device | 205 | 9.5% |
| Total | 2,160 | 100.0% |
Internet Access in Wayne
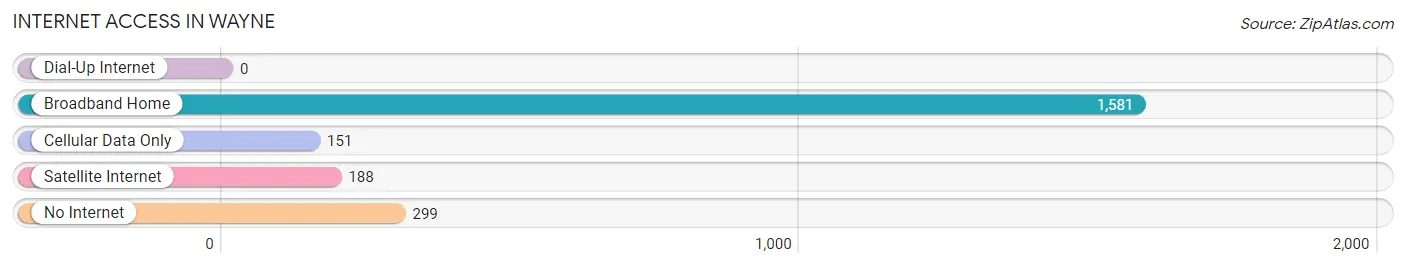
| Internet Type | # Households | % Households |
| Dial-Up Internet | 0 | 0.0% |
| Broadband Home | 1,581 | 73.2% |
| Cellular Data Only | 151 | 7.0% |
| Satellite Internet | 188 | 8.7% |
| No Internet | 299 | 13.8% |
| Total | 2,160 | 100.0% |
Wayne Summary
Wayne, Nebraska is a small city located in the northeast corner of the state, in Wayne County. It is situated on the banks of the Missouri River, and is the county seat of Wayne County. The city has a population of 5,660, according to the 2010 census.
History
Wayne was founded in 1881, when the Union Pacific Railroad was built through the area. The city was named after General Anthony Wayne, a Revolutionary War hero. The city was incorporated in 1883, and the first mayor was elected in 1884.
In the early years, Wayne was a bustling agricultural center, with a variety of crops grown in the area. The city was also home to a number of businesses, including a flour mill, a creamery, a brickyard, and a furniture factory.
In the early 1900s, the city began to experience a decline in population, as many of the businesses closed or moved away. However, the city was able to rebound in the mid-1900s, thanks to the construction of a new dam on the Missouri River. This allowed for the development of a new industrial park, which brought in new businesses and jobs.
Geography
Wayne is located in the northeast corner of Nebraska, in Wayne County. It is situated on the banks of the Missouri River, and is the county seat of Wayne County. The city has a total area of 2.3 square miles, all of which is land.
The city is located in the Central Plains region of the United States, and is characterized by flat terrain and rolling hills. The climate is humid continental, with hot summers and cold winters.
Economy
The economy of Wayne is largely based on agriculture and manufacturing. The city is home to a number of agricultural businesses, including grain elevators, feed mills, and livestock operations.
The city is also home to a number of manufacturing businesses, including a plastics plant, a metal fabrication plant, and a food processing plant. In addition, the city is home to a number of retail businesses, including grocery stores, restaurants, and clothing stores.
Demographics
According to the 2010 census, the population of Wayne was 5,660. The racial makeup of the city was 95.3% White, 0.7% African American, 0.3% Native American, 0.4% Asian, 0.1% Pacific Islander, 1.2% from other races, and 2.1% from two or more races. Hispanic or Latino of any race were 3.2% of the population.
The median household income in Wayne was $41,944, and the median family income was $50,917. The per capita income was $20,845. About 11.2% of families and 14.2% of the population were below the poverty line, including 19.2% of those under age 18 and 8.2% of those age 65 or over.
Common Questions
What is Per Capita Income in Wayne?
Per Capita income in Wayne is $24,243.
What is the Median Family Income in Wayne?
Median Family Income in Wayne is $76,121.
What is the Median Household income in Wayne?
Median Household Income in Wayne is $51,399.
What is Income or Wage Gap in Wayne?
Income or Wage Gap in Wayne is 34.2%.
Women in Wayne earn 65.8 cents for every dollar earned by a man.
What is Inequality or Gini Index in Wayne?
Inequality or Gini Index in Wayne is 0.46.
What is the Total Population of Wayne?
Total Population of Wayne is 5,973.
What is the Total Male Population of Wayne?
Total Male Population of Wayne is 2,967.
What is the Total Female Population of Wayne?
Total Female Population of Wayne is 3,006.
What is the Ratio of Males per 100 Females in Wayne?
There are 98.70 Males per 100 Females in Wayne.
What is the Ratio of Females per 100 Males in Wayne?
There are 101.31 Females per 100 Males in Wayne.
What is the Median Population Age in Wayne?
Median Population Age in Wayne is 23.1 Years.
What is the Average Family Size in Wayne
Average Family Size in Wayne is 2.7 People.
What is the Average Household Size in Wayne
Average Household Size in Wayne is 2.2 People.
How Large is the Labor Force in Wayne?
There are 3,561 People in the Labor Forcein in Wayne.
What is the Percentage of People in the Labor Force in Wayne?
69.1% of People are in the Labor Force in Wayne.
What is the Unemployment Rate in Wayne?
Unemployment Rate in Wayne is 4.4%.