Tarnov, NE Map & Demographics
Tarnov Map
Tarnov Overview
$28,653
PER CAPITA INCOME
$105,000
AVG FAMILY INCOME
$93,750
AVG HOUSEHOLD INCOME
62.7%
WAGE / INCOME GAP [ % ]
37.3¢/ $1
WAGE / INCOME GAP [ $ ]
0.19
INEQUALITY / GINI INDEX
15
TOTAL POPULATION
11
MALE POPULATION
4
FEMALE POPULATION
275.00
MALES / 100 FEMALES
36.36
FEMALES / 100 MALES
37.5
MEDIAN AGE
3.5
AVG FAMILY SIZE
3.0
AVG HOUSEHOLD SIZE
8
LABOR FORCE [ PEOPLE ]
80.0%
PERCENT IN LABOR FORCE
Tarnov Area Codes
Income in Tarnov
Income Overview in Tarnov
Per Capita Income in Tarnov is $28,653, while median incomes of families and households are $105,000 and $93,750 respectively.
| Characteristic | Number | Measure |
| Per Capita Income | 15 | $28,653 |
| Median Family Income | 4 | $105,000 |
| Mean Family Income | 4 | $96,575 |
| Median Household Income | 5 | $93,750 |
| Mean Household Income | 5 | $85,960 |
| Income Deficit | 4 | $0 |
| Wage / Income Gap (%) | 15 | 62.75% |
| Wage / Income Gap ($) | 15 | 37.25¢ per $1 |
| Gini / Inequality Index | 15 | 0.19 |
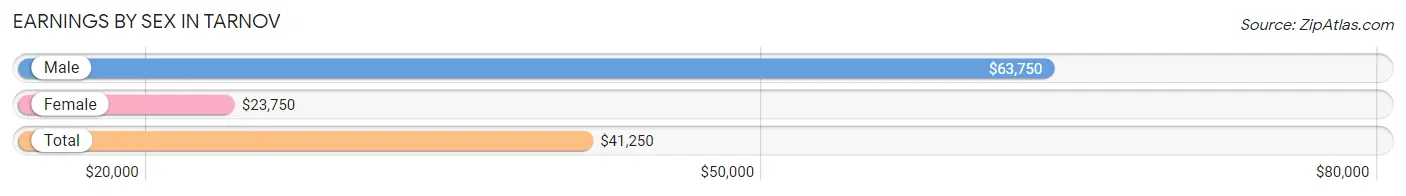
Earnings by Sex in Tarnov
Average Earnings in Tarnov are $41,250, $63,750 for men and $23,750 for women, a difference of 62.7%.
| Sex | Number | Average Earnings |
| Male | 5 (62.5%) | $63,750 |
| Female | 3 (37.5%) | $23,750 |
| Total | 8 (100.0%) | $41,250 |
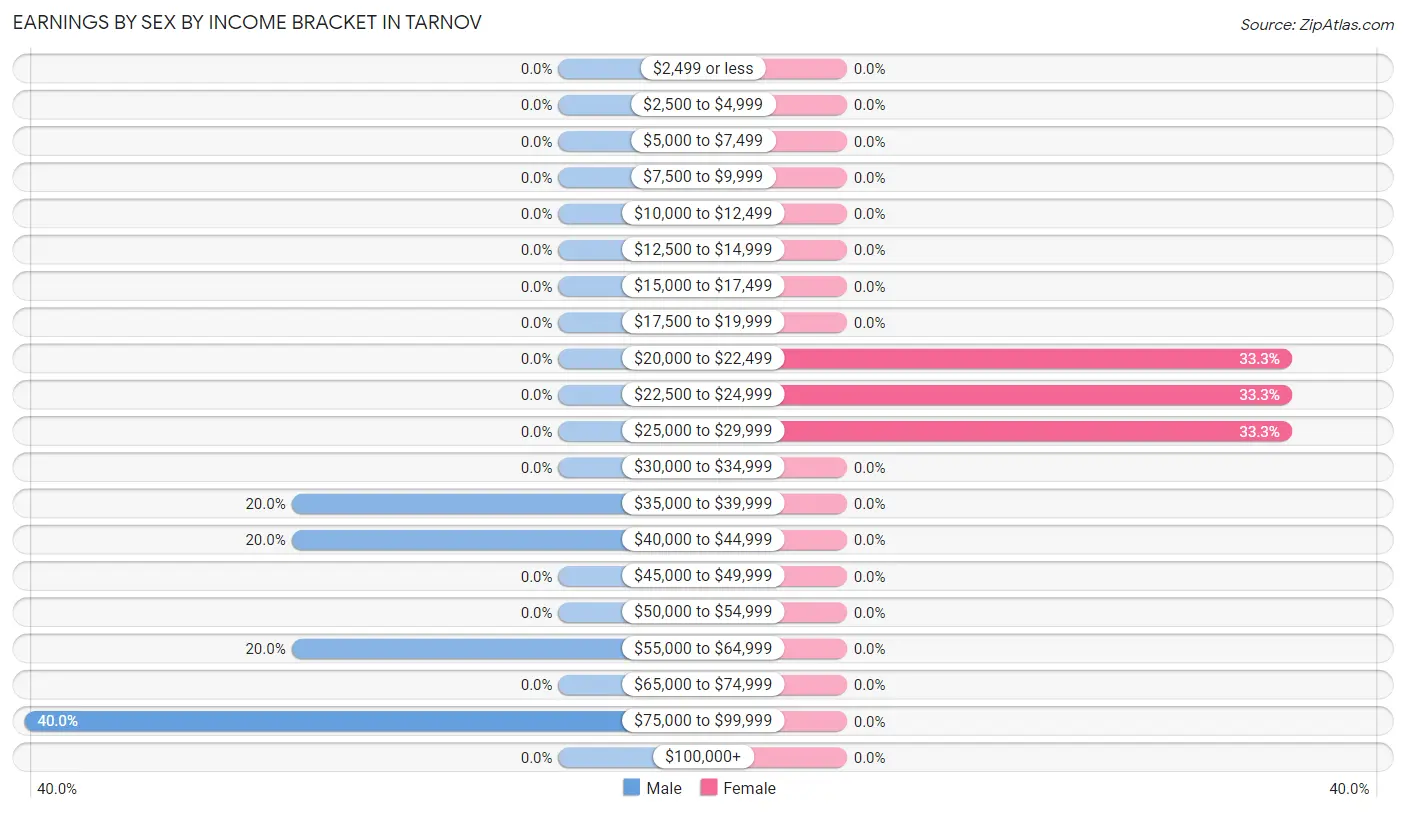
Earnings by Sex by Income Bracket in Tarnov
The most common earnings brackets in Tarnov are $75,000 to $99,999 for men (2 | 40.0%) and $20,000 to $22,499 for women (1 | 33.3%).
| Income | Male | Female |
| $2,499 or less | 0 (0.0%) | 0 (0.0%) |
| $2,500 to $4,999 | 0 (0.0%) | 0 (0.0%) |
| $5,000 to $7,499 | 0 (0.0%) | 0 (0.0%) |
| $7,500 to $9,999 | 0 (0.0%) | 0 (0.0%) |
| $10,000 to $12,499 | 0 (0.0%) | 0 (0.0%) |
| $12,500 to $14,999 | 0 (0.0%) | 0 (0.0%) |
| $15,000 to $17,499 | 0 (0.0%) | 0 (0.0%) |
| $17,500 to $19,999 | 0 (0.0%) | 0 (0.0%) |
| $20,000 to $22,499 | 0 (0.0%) | 1 (33.3%) |
| $22,500 to $24,999 | 0 (0.0%) | 1 (33.3%) |
| $25,000 to $29,999 | 0 (0.0%) | 1 (33.3%) |
| $30,000 to $34,999 | 0 (0.0%) | 0 (0.0%) |
| $35,000 to $39,999 | 1 (20.0%) | 0 (0.0%) |
| $40,000 to $44,999 | 1 (20.0%) | 0 (0.0%) |
| $45,000 to $49,999 | 0 (0.0%) | 0 (0.0%) |
| $50,000 to $54,999 | 0 (0.0%) | 0 (0.0%) |
| $55,000 to $64,999 | 1 (20.0%) | 0 (0.0%) |
| $65,000 to $74,999 | 0 (0.0%) | 0 (0.0%) |
| $75,000 to $99,999 | 2 (40.0%) | 0 (0.0%) |
| $100,000+ | 0 (0.0%) | 0 (0.0%) |
| Total | 5 (100.0%) | 3 (100.0%) |
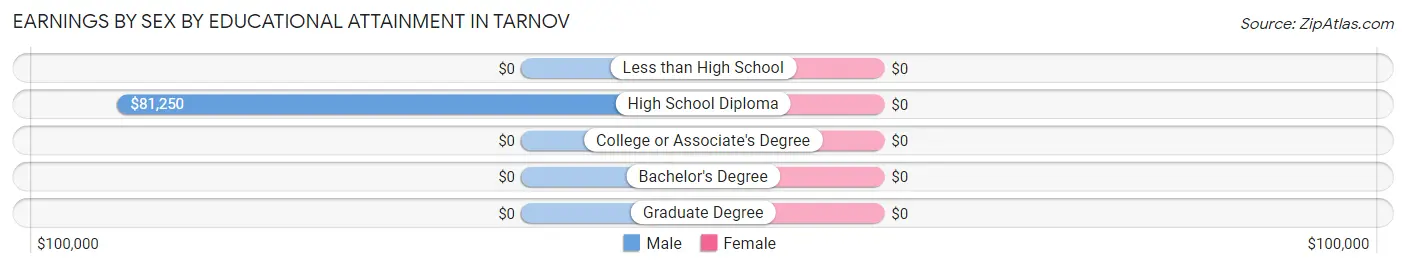
Earnings by Sex by Educational Attainment in Tarnov
| Educational Attainment | Male Income | Female Income |
| Less than High School | - | - |
| High School Diploma | $81,250 | $0 |
| College or Associate's Degree | - | - |
| Bachelor's Degree | - | - |
| Graduate Degree | - | - |
| Total | $63,750 | $23,750 |
Family Income in Tarnov
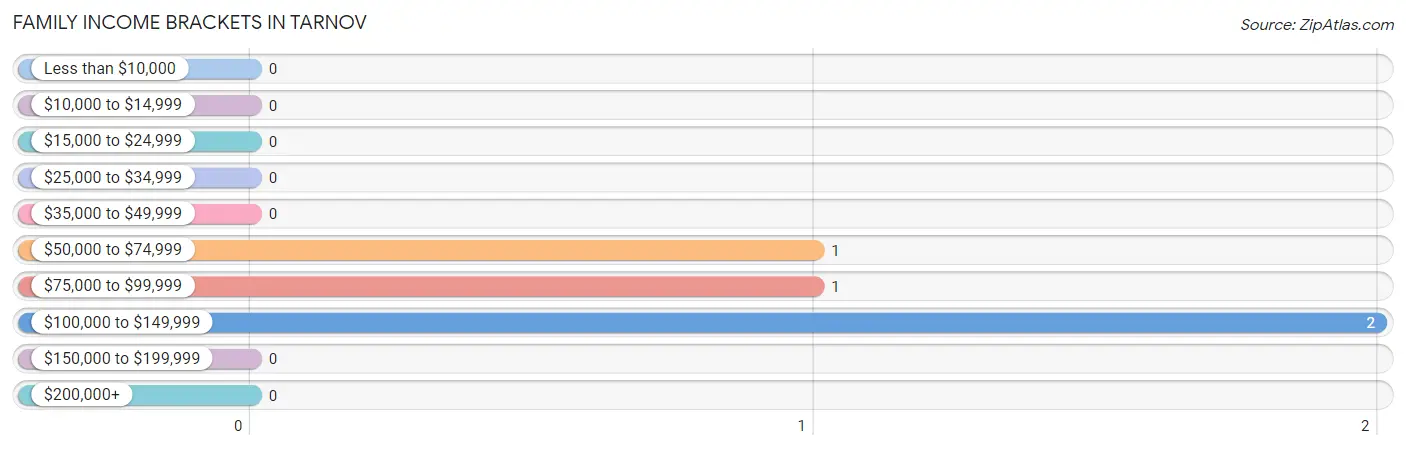
Family Income Brackets in Tarnov
According to the Tarnov family income data, there are 2 families falling into the $100,000 to $149,999 income range, which is the most common income bracket and makes up 50.0% of all families.
| Income Bracket | # Families | % Families |
| Less than $10,000 | 0 | 0.0% |
| $10,000 to $14,999 | 0 | 0.0% |
| $15,000 to $24,999 | 0 | 0.0% |
| $25,000 to $34,999 | 0 | 0.0% |
| $35,000 to $49,999 | 0 | 0.0% |
| $50,000 to $74,999 | 1 | 25.0% |
| $75,000 to $99,999 | 1 | 25.0% |
| $100,000 to $149,999 | 2 | 50.0% |
| $150,000 to $199,999 | 0 | 0.0% |
| $200,000+ | 0 | 0.0% |
Family Income by Famaliy Size in Tarnov
| Income Bracket | # Families | Median Income |
| 2-Person Families | 2 (50.0%) | $0 |
| 3-Person Families | 1 (25.0%) | $0 |
| 4-Person Families | 1 (25.0%) | $0 |
| 5-Person Families | 0 (0.0%) | $0 |
| 6-Person Families | 0 (0.0%) | $0 |
| 7+ Person Families | 0 (0.0%) | $0 |
| Total | 4 (100.0%) | $105,000 |
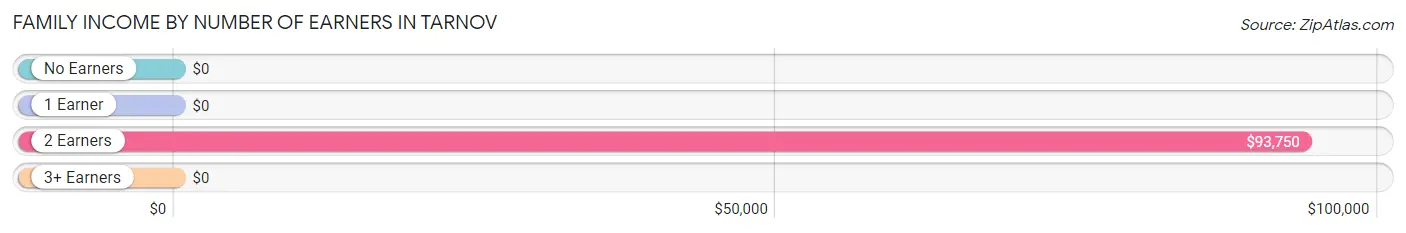
Family Income by Number of Earners in Tarnov
| Number of Earners | # Families | Median Income |
| No Earners | 0 (0.0%) | $0 |
| 1 Earner | 1 (25.0%) | $0 |
| 2 Earners | 3 (75.0%) | $93,750 |
| 3+ Earners | 0 (0.0%) | $0 |
| Total | 4 (100.0%) | $105,000 |
Household Income in Tarnov
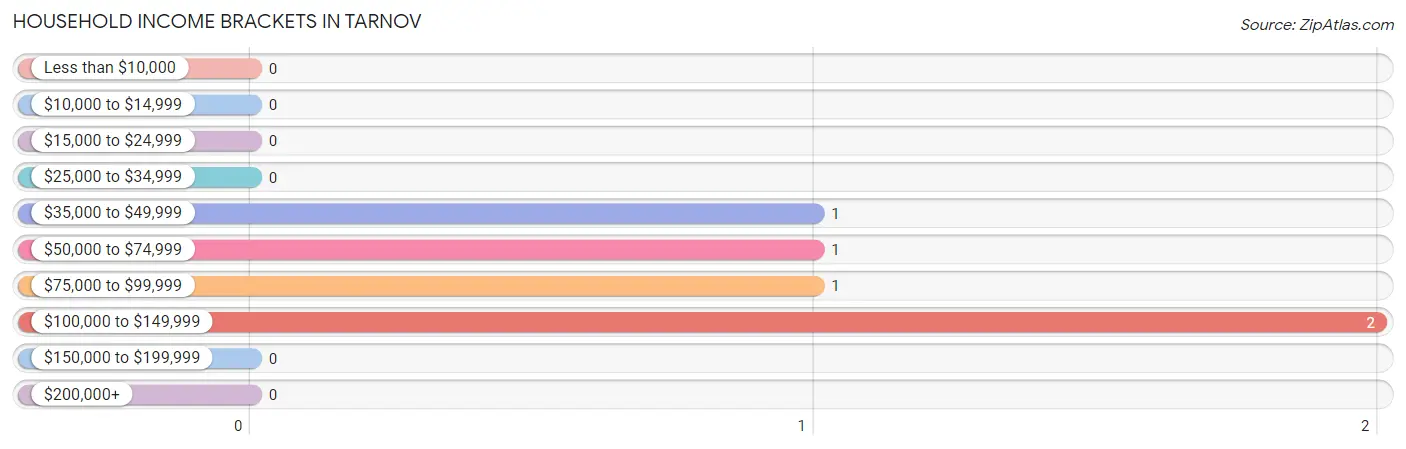
Household Income Brackets in Tarnov
With 2 households falling in the category, the $100,000 to $149,999 income range is the most frequent in Tarnov, accounting for 40.0% of all households.
| Income Bracket | # Households | % Households |
| Less than $10,000 | 0 | 0.0% |
| $10,000 to $14,999 | 0 | 0.0% |
| $15,000 to $24,999 | 0 | 0.0% |
| $25,000 to $34,999 | 0 | 0.0% |
| $35,000 to $49,999 | 1 | 20.0% |
| $50,000 to $74,999 | 1 | 20.0% |
| $75,000 to $99,999 | 1 | 20.0% |
| $100,000 to $149,999 | 2 | 40.0% |
| $150,000 to $199,999 | 0 | 0.0% |
| $200,000+ | 0 | 0.0% |
Household Income by Householder Age in Tarnov
The median household income in Tarnov is $93,750, with the highest median household income of $93,750 found in the 45 to 64 years age bracket for the primary householder. A total of 3 households (60.0%) fall into this category.
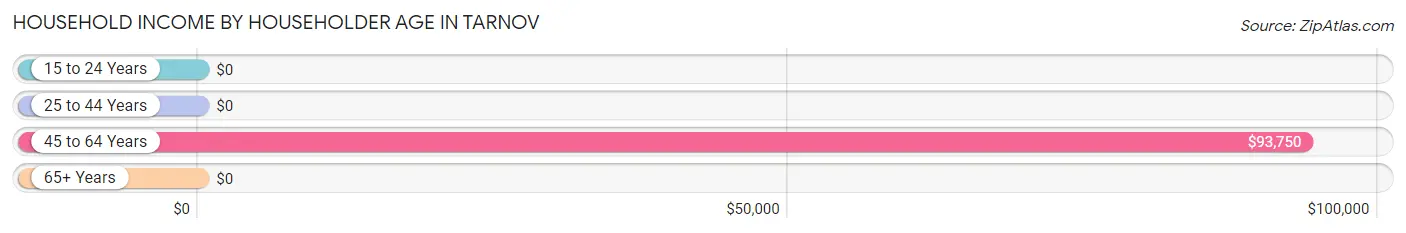
| Income Bracket | # Households | Median Income |
| 15 to 24 Years | 0 (0.0%) | $0 |
| 25 to 44 Years | 1 (20.0%) | $0 |
| 45 to 64 Years | 3 (60.0%) | $93,750 |
| 65+ Years | 1 (20.0%) | $0 |
| Total | 5 (100.0%) | $93,750 |
Poverty in Tarnov
Income Below Poverty by Sex and Age in Tarnov
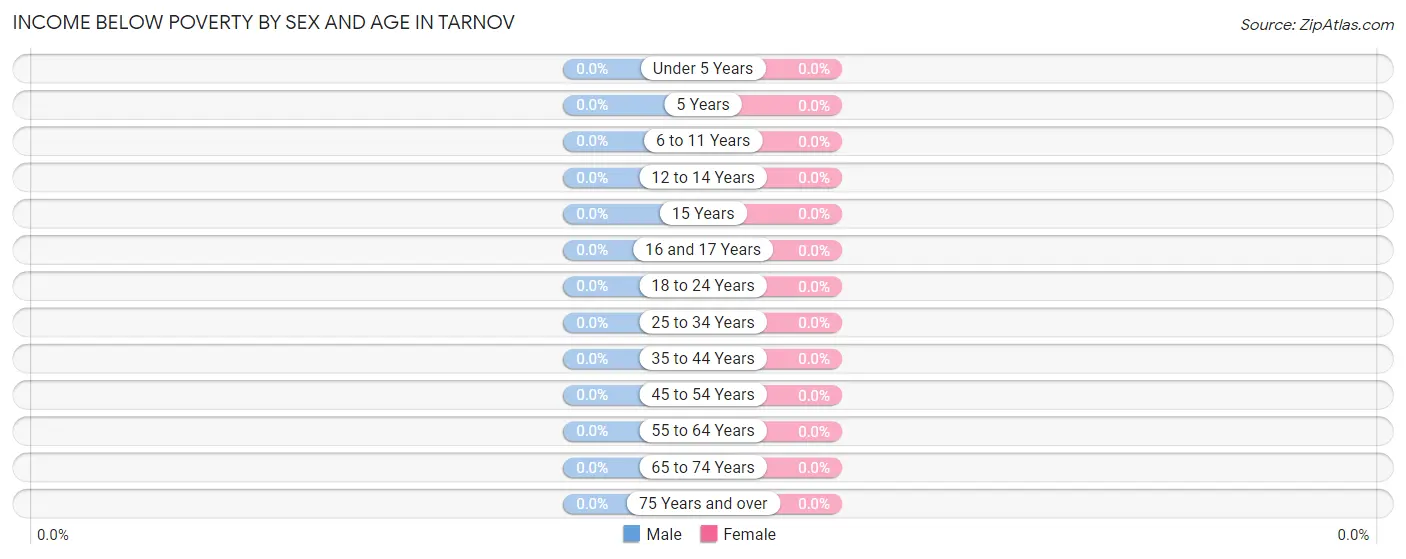
| Age Bracket | Male | Female |
| Under 5 Years | 0 (0.0%) | 0 (0.0%) |
| 5 Years | 0 (0.0%) | 0 (0.0%) |
| 6 to 11 Years | 0 (0.0%) | 0 (0.0%) |
| 12 to 14 Years | 0 (0.0%) | 0 (0.0%) |
| 15 Years | 0 (0.0%) | 0 (0.0%) |
| 16 and 17 Years | 0 (0.0%) | 0 (0.0%) |
| 18 to 24 Years | 0 (0.0%) | 0 (0.0%) |
| 25 to 34 Years | 0 (0.0%) | 0 (0.0%) |
| 35 to 44 Years | 0 (0.0%) | 0 (0.0%) |
| 45 to 54 Years | 0 (0.0%) | 0 (0.0%) |
| 55 to 64 Years | 0 (0.0%) | 0 (0.0%) |
| 65 to 74 Years | 0 (0.0%) | 0 (0.0%) |
| 75 Years and over | 0 (0.0%) | 0 (0.0%) |
| Total | 0 (0.0%) | 0 (0.0%) |
Income Above Poverty by Sex and Age in Tarnov
According to the poverty statistics in Tarnov, males aged under 5 years and females aged 25 to 34 years are the age groups that are most secure financially, with 100.0% of males and 100.0% of females in these age groups living above the poverty line.
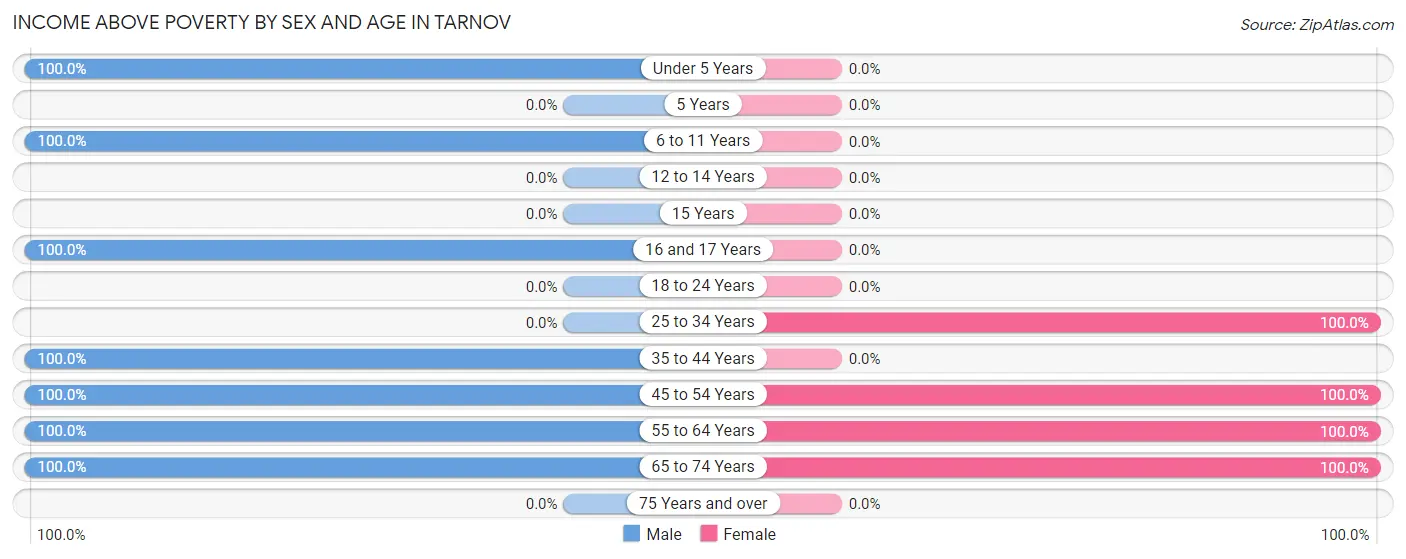
| Age Bracket | Male | Female |
| Under 5 Years | 1 (100.0%) | 0 (0.0%) |
| 5 Years | 0 (0.0%) | 0 (0.0%) |
| 6 to 11 Years | 4 (100.0%) | 0 (0.0%) |
| 12 to 14 Years | 0 (0.0%) | 0 (0.0%) |
| 15 Years | 0 (0.0%) | 0 (0.0%) |
| 16 and 17 Years | 1 (100.0%) | 0 (0.0%) |
| 18 to 24 Years | 0 (0.0%) | 0 (0.0%) |
| 25 to 34 Years | 0 (0.0%) | 1 (100.0%) |
| 35 to 44 Years | 1 (100.0%) | 0 (0.0%) |
| 45 to 54 Years | 1 (100.0%) | 1 (100.0%) |
| 55 to 64 Years | 2 (100.0%) | 1 (100.0%) |
| 65 to 74 Years | 1 (100.0%) | 1 (100.0%) |
| 75 Years and over | 0 (0.0%) | 0 (0.0%) |
| Total | 11 (100.0%) | 4 (100.0%) |
Income Below Poverty Among Married-Couple Families in Tarnov
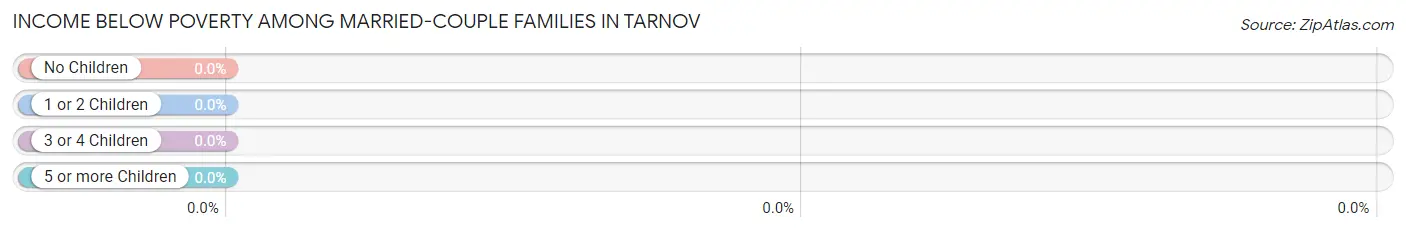
| Children | Above Poverty | Below Poverty |
| No Children | 2 (100.0%) | 0 (0.0%) |
| 1 or 2 Children | 2 (100.0%) | 0 (0.0%) |
| 3 or 4 Children | 0 (0.0%) | 0 (0.0%) |
| 5 or more Children | 0 (0.0%) | 0 (0.0%) |
| Total | 4 (100.0%) | 0 (0.0%) |
Income Below Poverty Among Single-Parent Households in Tarnov
| Children | Single Father | Single Mother |
| No Children | 0 (0.0%) | 0 (0.0%) |
| 1 or 2 Children | 0 (0.0%) | 0 (0.0%) |
| 3 or 4 Children | 0 (0.0%) | 0 (0.0%) |
| 5 or more Children | 0 (0.0%) | 0 (0.0%) |
| Total | 0 (0.0%) | 0 (0.0%) |
Income Below Poverty Among Married-Couple vs Single-Parent Households in Tarnov
| Children | Married-Couple Families | Single-Parent Households |
| No Children | 0 (0.0%) | 0 (0.0%) |
| 1 or 2 Children | 0 (0.0%) | 0 (0.0%) |
| 3 or 4 Children | 0 (0.0%) | 0 (0.0%) |
| 5 or more Children | 0 (0.0%) | 0 (0.0%) |
| Total | 0 (0.0%) | 0 (0.0%) |
Race in Tarnov
The most populous races in Tarnov are White / Caucasian (11 | 73.3%), and Two or more Races (4 | 26.7%).
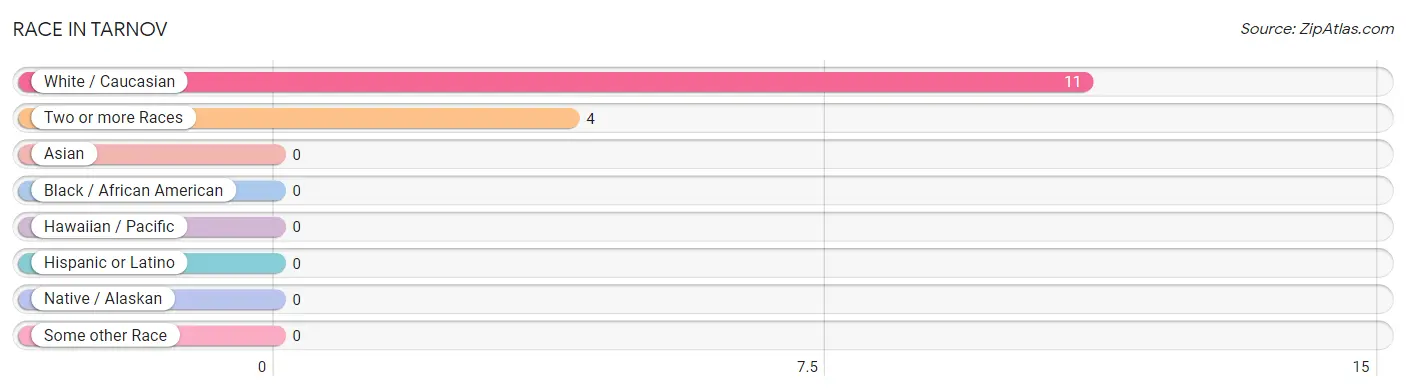
| Race | # Population | % Population |
| Asian | 0 | 0.0% |
| Black / African American | 0 | 0.0% |
| Hawaiian / Pacific | 0 | 0.0% |
| Hispanic or Latino | 0 | 0.0% |
| Native / Alaskan | 0 | 0.0% |
| White / Caucasian | 11 | 73.3% |
| Two or more Races | 4 | 26.7% |
| Some other Race | 0 | 0.0% |
| Total | 15 | 100.0% |
Ancestry in Tarnov
The most populous ancestries reported in Tarnov are German (15 | 100.0%), Burmese (4 | 26.7%), Polish (3 | 20.0%), Irish (2 | 13.3%), and Czech (1 | 6.7%), together accounting for 166.7% of all Tarnov residents.
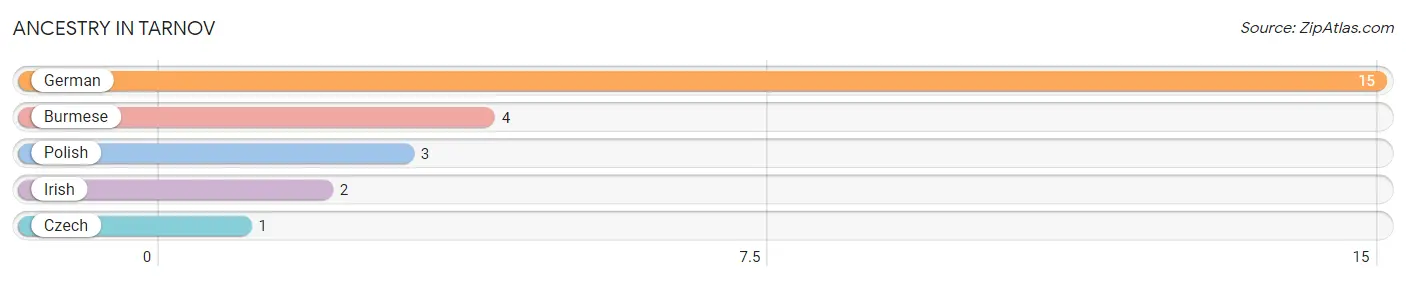
| Ancestry | # Population | % Population |
| Burmese | 4 | 26.7% |
| Czech | 1 | 6.7% |
| German | 15 | 100.0% |
| Irish | 2 | 13.3% |
| Polish | 3 | 20.0% | View All 5 Rows |
Immigrants in Tarnov

| Immigration Origin | # Population | % Population | View All 0 Rows |
Sex and Age in Tarnov
Sex and Age in Tarnov
The most populous age groups in Tarnov are 10 to 14 Years (4 | 36.4%) for men and 30 to 34 Years (1 | 25.0%) for women.
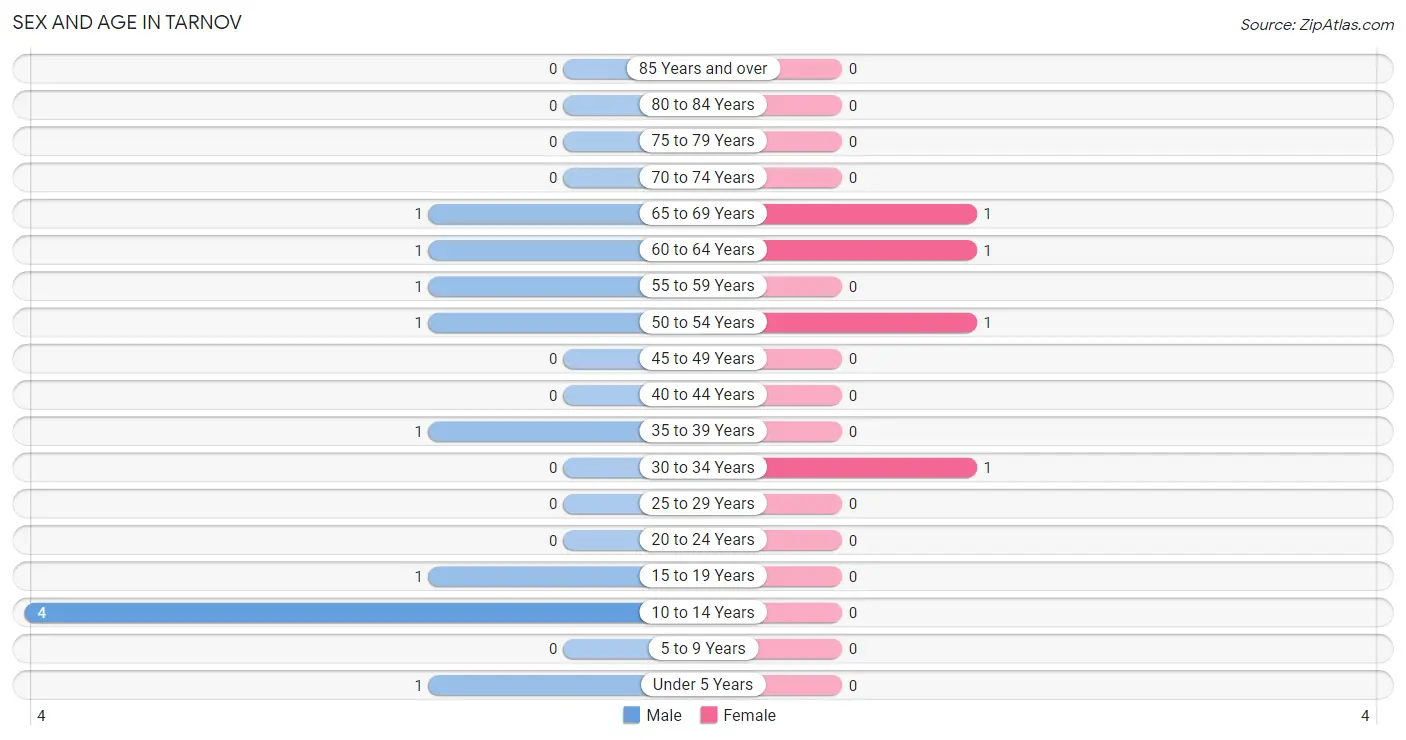
| Age Bracket | Male | Female |
| Under 5 Years | 1 (9.1%) | 0 (0.0%) |
| 5 to 9 Years | 0 (0.0%) | 0 (0.0%) |
| 10 to 14 Years | 4 (36.4%) | 0 (0.0%) |
| 15 to 19 Years | 1 (9.1%) | 0 (0.0%) |
| 20 to 24 Years | 0 (0.0%) | 0 (0.0%) |
| 25 to 29 Years | 0 (0.0%) | 0 (0.0%) |
| 30 to 34 Years | 0 (0.0%) | 1 (25.0%) |
| 35 to 39 Years | 1 (9.1%) | 0 (0.0%) |
| 40 to 44 Years | 0 (0.0%) | 0 (0.0%) |
| 45 to 49 Years | 0 (0.0%) | 0 (0.0%) |
| 50 to 54 Years | 1 (9.1%) | 1 (25.0%) |
| 55 to 59 Years | 1 (9.1%) | 0 (0.0%) |
| 60 to 64 Years | 1 (9.1%) | 1 (25.0%) |
| 65 to 69 Years | 1 (9.1%) | 1 (25.0%) |
| 70 to 74 Years | 0 (0.0%) | 0 (0.0%) |
| 75 to 79 Years | 0 (0.0%) | 0 (0.0%) |
| 80 to 84 Years | 0 (0.0%) | 0 (0.0%) |
| 85 Years and over | 0 (0.0%) | 0 (0.0%) |
| Total | 11 (100.0%) | 4 (100.0%) |
Families and Households in Tarnov
Median Family Size in Tarnov
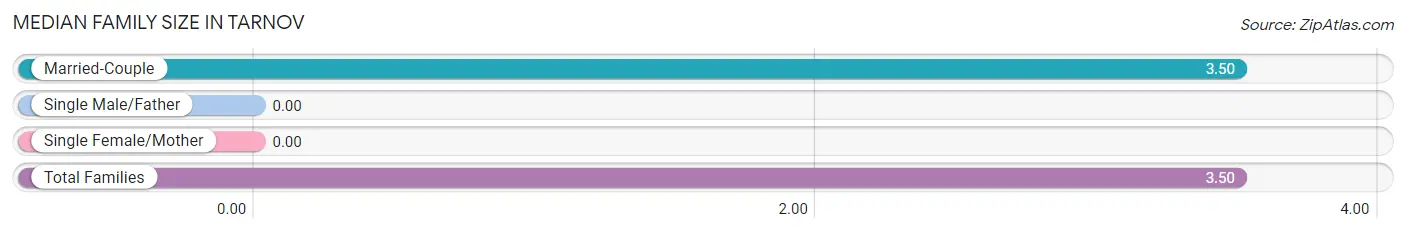
| Family Type | # Families | Family Size |
| Married-Couple | 4 (100.0%) | 3.50 |
| Single Male/Father | 0 (0.0%) | - |
| Single Female/Mother | 0 (0.0%) | - |
| Total Families | 4 (100.0%) | 3.50 |
Median Household Size in Tarnov
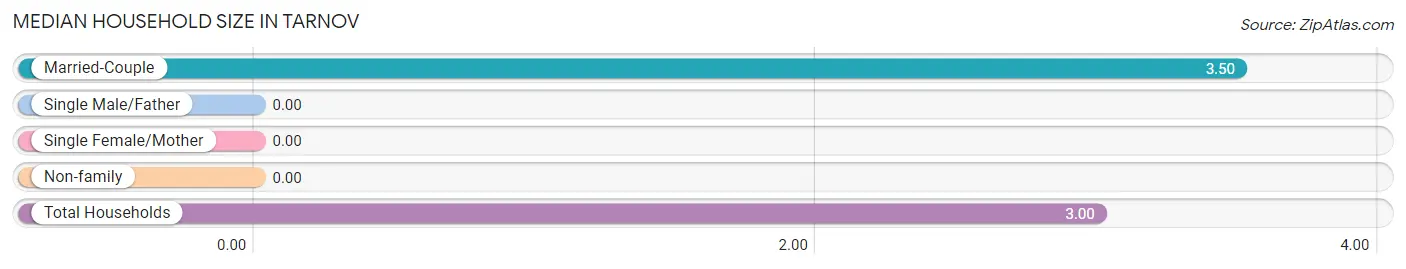
| Household Type | # Households | Household Size |
| Married-Couple | 4 (80.0%) | 3.50 |
| Single Male/Father | 0 (0.0%) | - |
| Single Female/Mother | 0 (0.0%) | - |
| Non-family | 1 (20.0%) | - |
| Total Households | 5 (100.0%) | 3.00 |
Household Size by Marriage Status in Tarnov
Out of a total of 5 households in Tarnov, 4 (80.0%) are family households, while 1 (20.0%) are nonfamily households. The most numerous type of family households are 2-person households, comprising 2, and the most common type of nonfamily households are 1-person households, comprising 1.
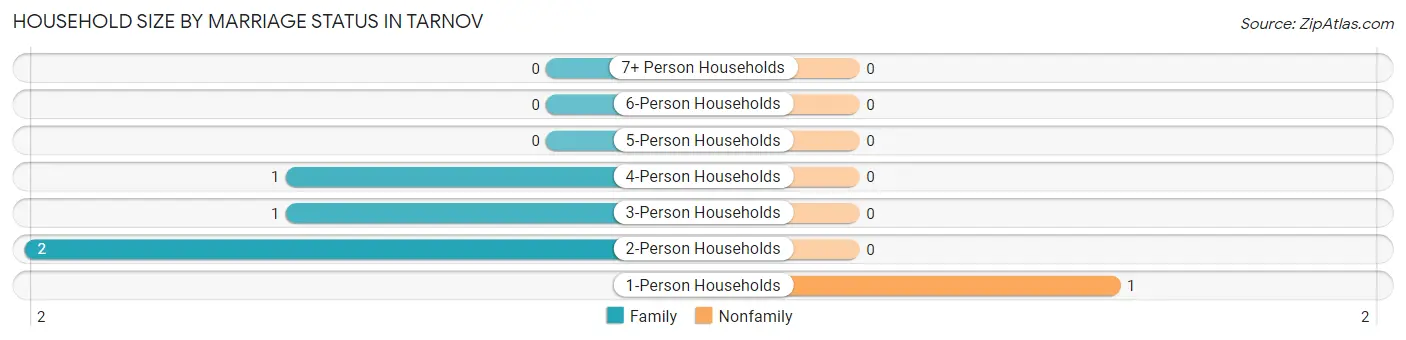
| Household Size | Family Households | Nonfamily Households |
| 1-Person Households | - | 1 (20.0%) |
| 2-Person Households | 2 (40.0%) | 0 (0.0%) |
| 3-Person Households | 1 (20.0%) | 0 (0.0%) |
| 4-Person Households | 1 (20.0%) | 0 (0.0%) |
| 5-Person Households | 0 (0.0%) | 0 (0.0%) |
| 6-Person Households | 0 (0.0%) | 0 (0.0%) |
| 7+ Person Households | 0 (0.0%) | 0 (0.0%) |
| Total | 4 (80.0%) | 1 (20.0%) |
Female Fertility in Tarnov
Fertility by Age in Tarnov
| Age Bracket | Women with Births | Births / 1,000 Women |
| 15 to 19 years | 0 (0.0%) | 0.0 |
| 20 to 34 years | 0 (0.0%) | 0.0 |
| 35 to 50 years | 0 (0.0%) | 0.0 |
| Total | 0 (0.0%) | 0.0 |
Fertility by Age by Marriage Status in Tarnov
| Age Bracket | Married | Unmarried |
| 15 to 19 years | 0 (0.0%) | 0 (0.0%) |
| 20 to 34 years | 0 (0.0%) | 0 (0.0%) |
| 35 to 50 years | 0 (0.0%) | 0 (0.0%) |
| Total | 0 (0.0%) | 0 (0.0%) |
Fertility by Education in Tarnov
| Educational Attainment | Women with Births | Births / 1,000 Women |
| Less than High School | 0 (0.0%) | 0.0 |
| High School Diploma | 0 (0.0%) | 0.0 |
| College or Associate's Degree | 0 (0.0%) | 0.0 |
| Bachelor's Degree | 0 (0.0%) | 0.0 |
| Graduate Degree | 0 (0.0%) | 0.0 |
| Total | 0 (0.0%) | 0.0 |
Fertility by Education by Marriage Status in Tarnov
| Educational Attainment | Married | Unmarried |
| Less than High School | 0 (0.0%) | 0 (0.0%) |
| High School Diploma | 0 (0.0%) | 0 (0.0%) |
| College or Associate's Degree | 0 (0.0%) | 0 (0.0%) |
| Bachelor's Degree | 0 (0.0%) | 0 (0.0%) |
| Graduate Degree | 0 (0.0%) | 0 (0.0%) |
| Total | 0 (0.0%) | 0 (0.0%) |
Employment Characteristics in Tarnov
Employment by Class of Employer in Tarnov
Among the 8 employed individuals in Tarnov, private company employees (5 | 62.5%), self-employed (not incorporated) (1 | 12.5%), and local government employees (1 | 12.5%) make up the most common classes of employment.
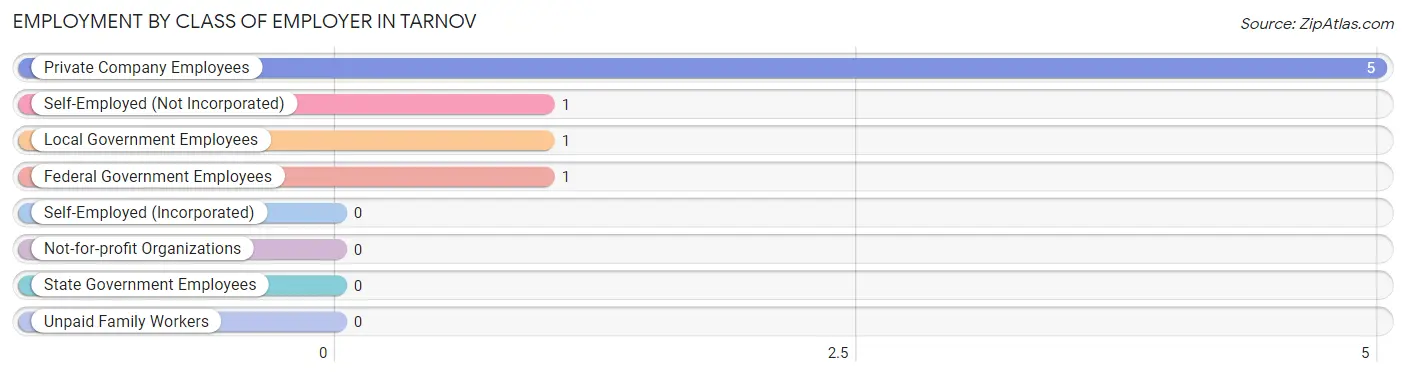
| Employer Class | # Employees | % Employees |
| Private Company Employees | 5 | 62.5% |
| Self-Employed (Incorporated) | 0 | 0.0% |
| Self-Employed (Not Incorporated) | 1 | 12.5% |
| Not-for-profit Organizations | 0 | 0.0% |
| Local Government Employees | 1 | 12.5% |
| State Government Employees | 0 | 0.0% |
| Federal Government Employees | 1 | 12.5% |
| Unpaid Family Workers | 0 | 0.0% |
| Total | 8 | 100.0% |
Employment Status by Age in Tarnov
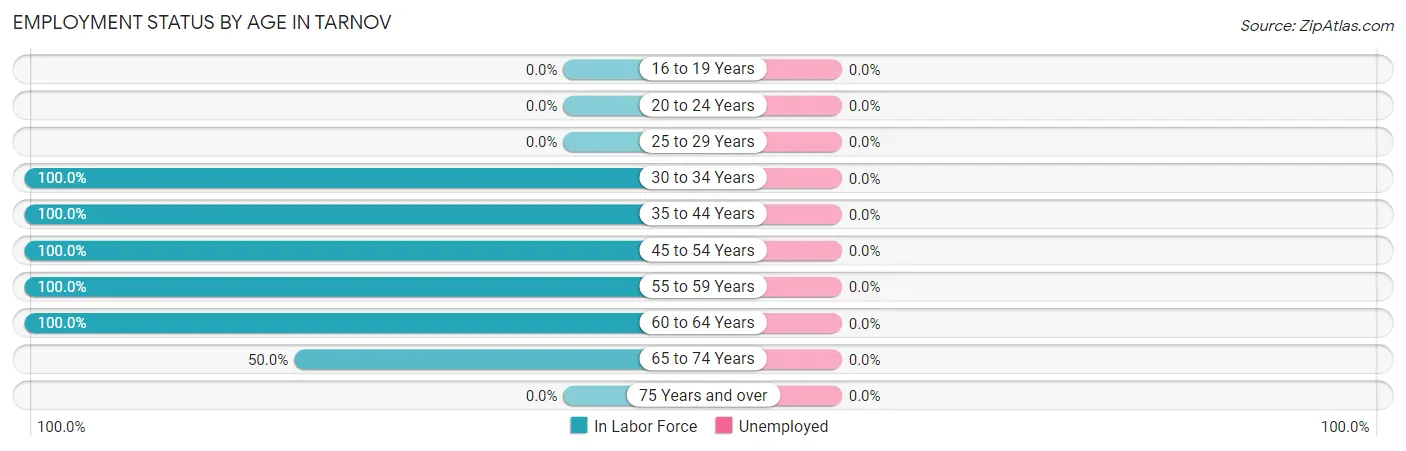
| Age Bracket | In Labor Force | Unemployed |
| 16 to 19 Years | 0 (0.0%) | 0 (0.0%) |
| 20 to 24 Years | 0 (0.0%) | 0 (0.0%) |
| 25 to 29 Years | 0 (0.0%) | 0 (0.0%) |
| 30 to 34 Years | 1 (100.0%) | 0 (0.0%) |
| 35 to 44 Years | 1 (100.0%) | 0 (0.0%) |
| 45 to 54 Years | 2 (100.0%) | 0 (0.0%) |
| 55 to 59 Years | 1 (100.0%) | 0 (0.0%) |
| 60 to 64 Years | 2 (100.0%) | 0 (0.0%) |
| 65 to 74 Years | 1 (50.0%) | 0 (0.0%) |
| 75 Years and over | 0 (0.0%) | 0 (0.0%) |
| Total | 8 (80.0%) | 0 (0.0%) |
Employment Status by Educational Attainment in Tarnov
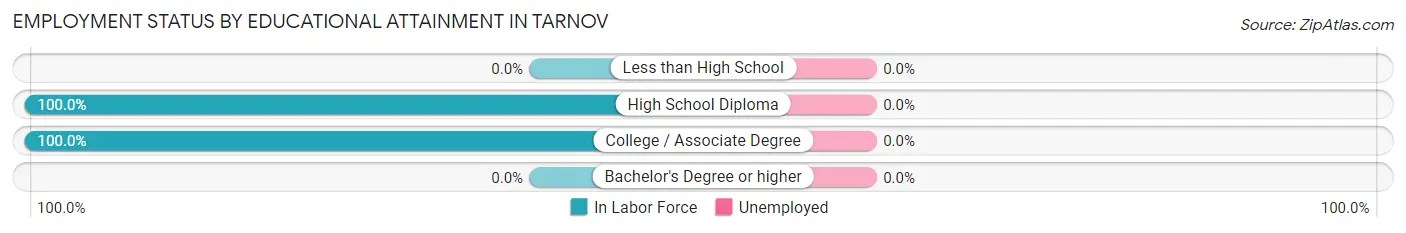
| Educational Attainment | In Labor Force | Unemployed |
| Less than High School | 0 (0.0%) | 0 (0.0%) |
| High School Diploma | 4 (100.0%) | 0 (0.0%) |
| College / Associate Degree | 3 (100.0%) | 0 (0.0%) |
| Bachelor's Degree or higher | 0 (0.0%) | 0 (0.0%) |
| Total | 7 (100.0%) | 0 (0.0%) |
Employment Occupations by Sex in Tarnov
Management, Business, Science and Arts Occupations
The most common Management, Business, Science and Arts occupations in Tarnov are , and Management (1 | 12.5%).
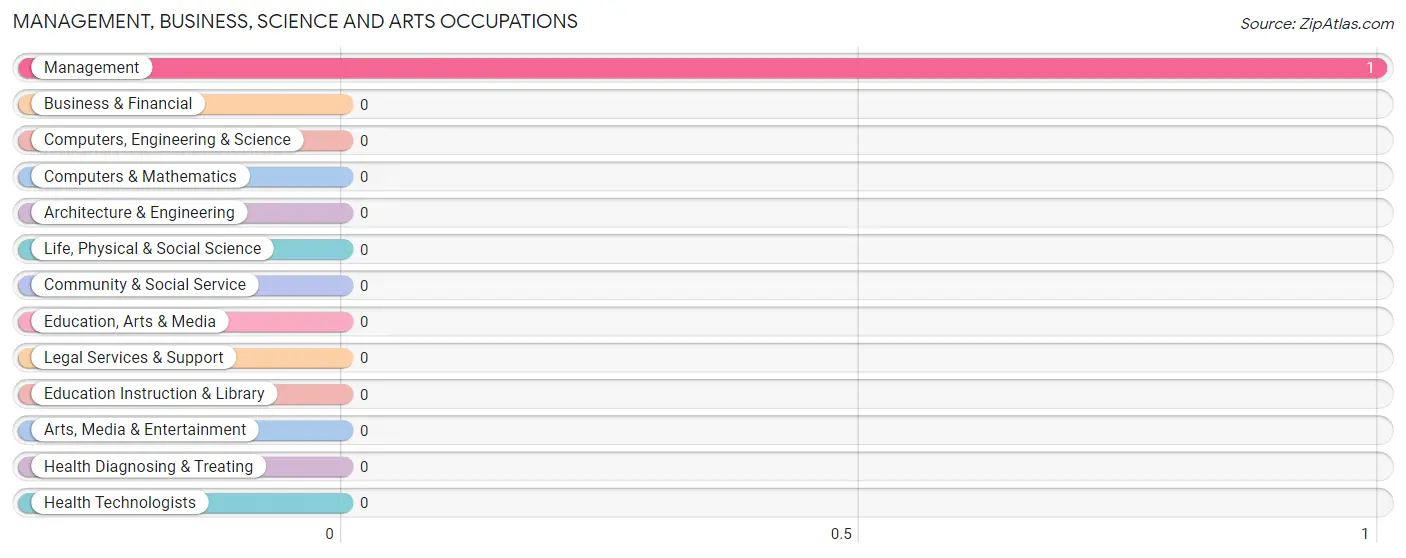
Management, Business, Science and Arts Occupations by Sex
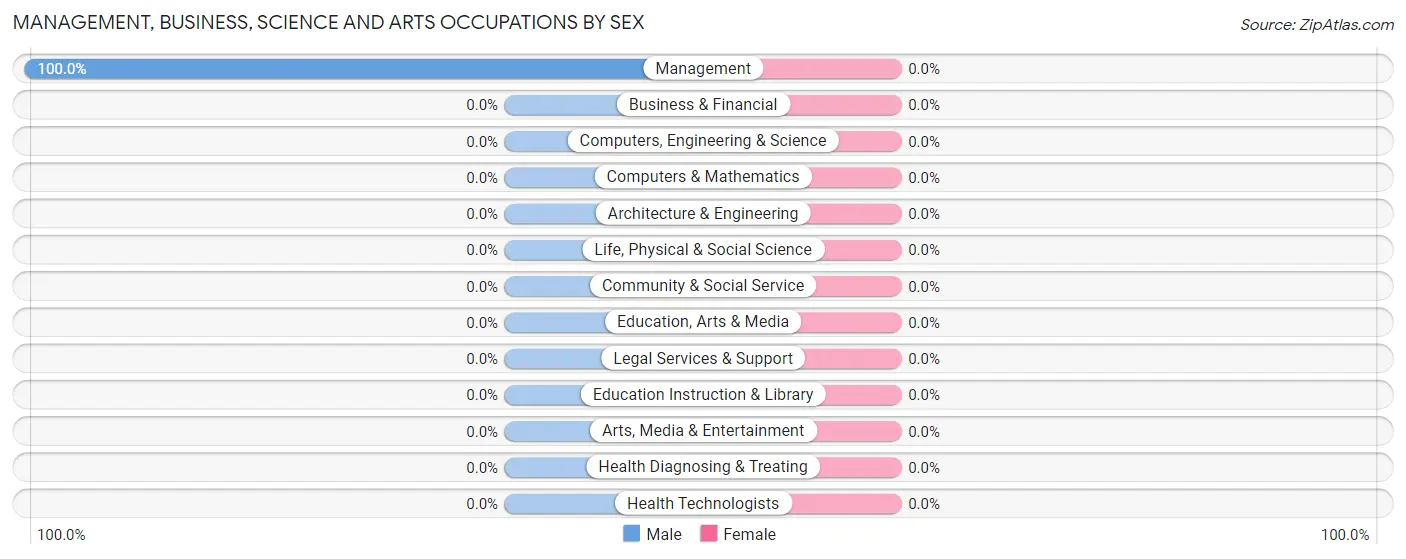
| Occupation | Male | Female |
| Management | 1 (100.0%) | 0 (0.0%) |
| Business & Financial | 0 (0.0%) | 0 (0.0%) |
| Computers, Engineering & Science | 0 (0.0%) | 0 (0.0%) |
| Computers & Mathematics | 0 (0.0%) | 0 (0.0%) |
| Architecture & Engineering | 0 (0.0%) | 0 (0.0%) |
| Life, Physical & Social Science | 0 (0.0%) | 0 (0.0%) |
| Community & Social Service | 0 (0.0%) | 0 (0.0%) |
| Education, Arts & Media | 0 (0.0%) | 0 (0.0%) |
| Legal Services & Support | 0 (0.0%) | 0 (0.0%) |
| Education Instruction & Library | 0 (0.0%) | 0 (0.0%) |
| Arts, Media & Entertainment | 0 (0.0%) | 0 (0.0%) |
| Health Diagnosing & Treating | 0 (0.0%) | 0 (0.0%) |
| Health Technologists | 0 (0.0%) | 0 (0.0%) |
| Total (Category) | 1 (100.0%) | 0 (0.0%) |
| Total (Overall) | 5 (62.5%) | 3 (37.5%) |
Services Occupations
The most common Services occupations in Tarnov are , and Food Preparation & Serving (1 | 12.5%).
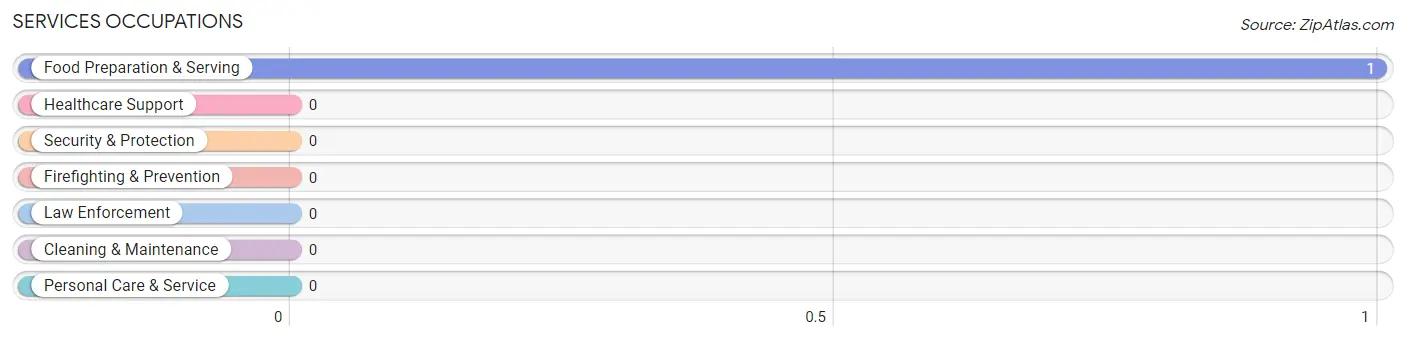
Services Occupations by Sex
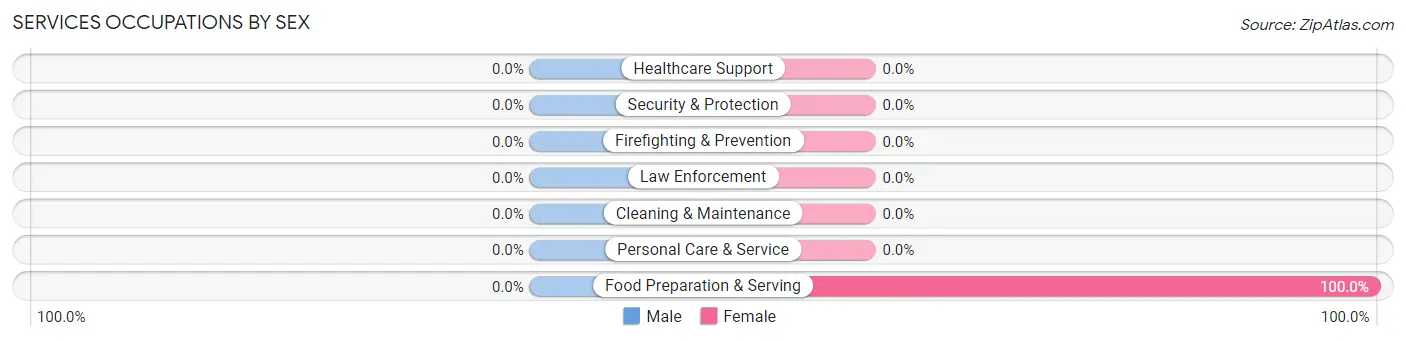
| Occupation | Male | Female |
| Healthcare Support | 0 (0.0%) | 0 (0.0%) |
| Security & Protection | 0 (0.0%) | 0 (0.0%) |
| Firefighting & Prevention | 0 (0.0%) | 0 (0.0%) |
| Law Enforcement | 0 (0.0%) | 0 (0.0%) |
| Food Preparation & Serving | 0 (0.0%) | 1 (100.0%) |
| Cleaning & Maintenance | 0 (0.0%) | 0 (0.0%) |
| Personal Care & Service | 0 (0.0%) | 0 (0.0%) |
| Total (Category) | 0 (0.0%) | 1 (100.0%) |
| Total (Overall) | 5 (62.5%) | 3 (37.5%) |
Sales and Office Occupations
Sales and Office Occupations by Sex
| Occupation | Male | Female |
| Sales & Related | 0 (0.0%) | 0 (0.0%) |
| Office & Administration | 0 (0.0%) | 0 (0.0%) |
| Total (Category) | 0 (0.0%) | 0 (0.0%) |
| Total (Overall) | 5 (62.5%) | 3 (37.5%) |
Natural Resources, Construction and Maintenance Occupations
The most common Natural Resources, Construction and Maintenance occupations in Tarnov are Installation, Maintenance & Repair (2 | 25.0%), and Construction & Extraction (1 | 12.5%).
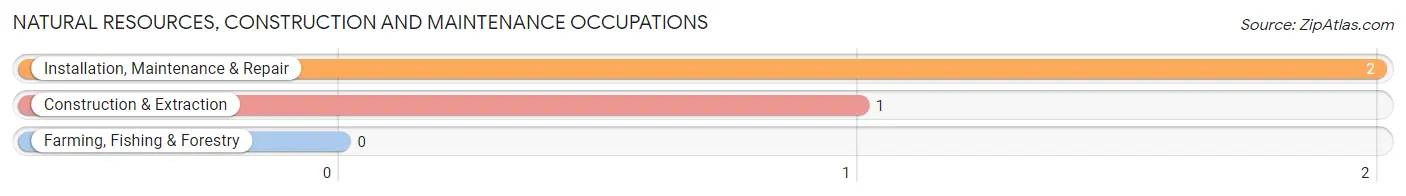
Natural Resources, Construction and Maintenance Occupations by Sex
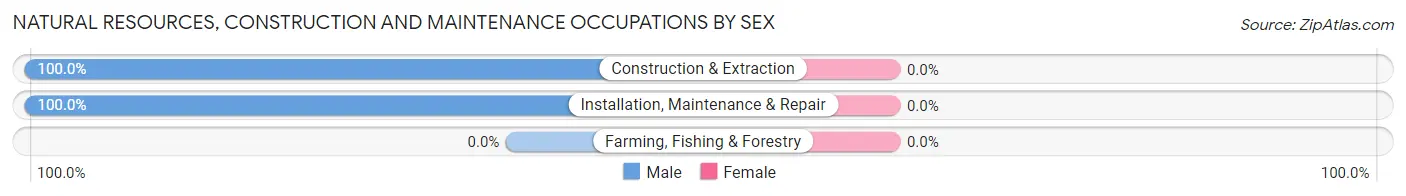
| Occupation | Male | Female |
| Farming, Fishing & Forestry | 0 (0.0%) | 0 (0.0%) |
| Construction & Extraction | 1 (100.0%) | 0 (0.0%) |
| Installation, Maintenance & Repair | 2 (100.0%) | 0 (0.0%) |
| Total (Category) | 3 (100.0%) | 0 (0.0%) |
| Total (Overall) | 5 (62.5%) | 3 (37.5%) |
Production, Transportation and Moving Occupations
The most common Production, Transportation and Moving occupations in Tarnov are Material Moving (2 | 25.0%), and Production (1 | 12.5%).
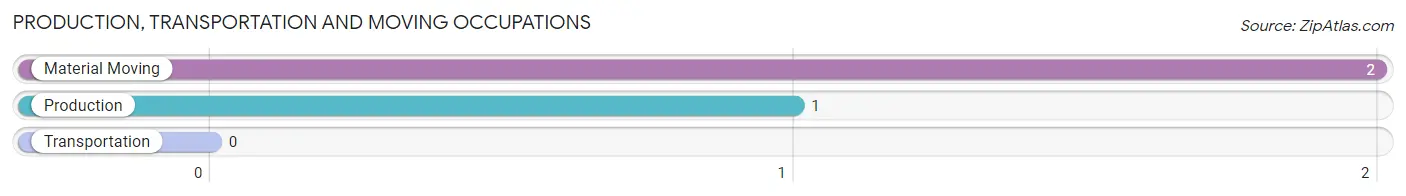
Production, Transportation and Moving Occupations by Sex
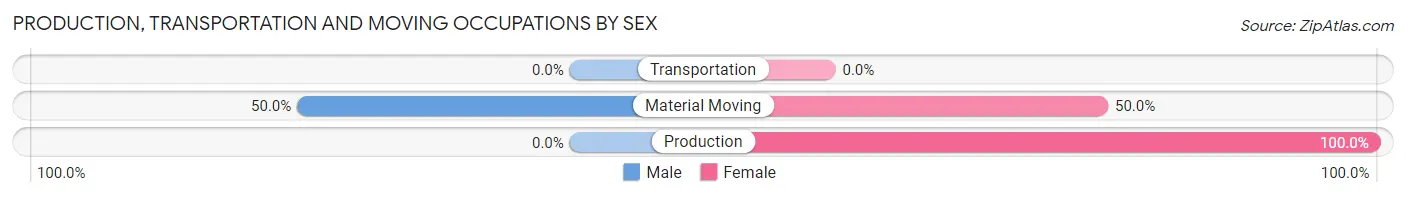
| Occupation | Male | Female |
| Production | 0 (0.0%) | 1 (100.0%) |
| Transportation | 0 (0.0%) | 0 (0.0%) |
| Material Moving | 1 (50.0%) | 1 (50.0%) |
| Total (Category) | 1 (33.3%) | 2 (66.7%) |
| Total (Overall) | 5 (62.5%) | 3 (37.5%) |
Employment Industries by Sex in Tarnov
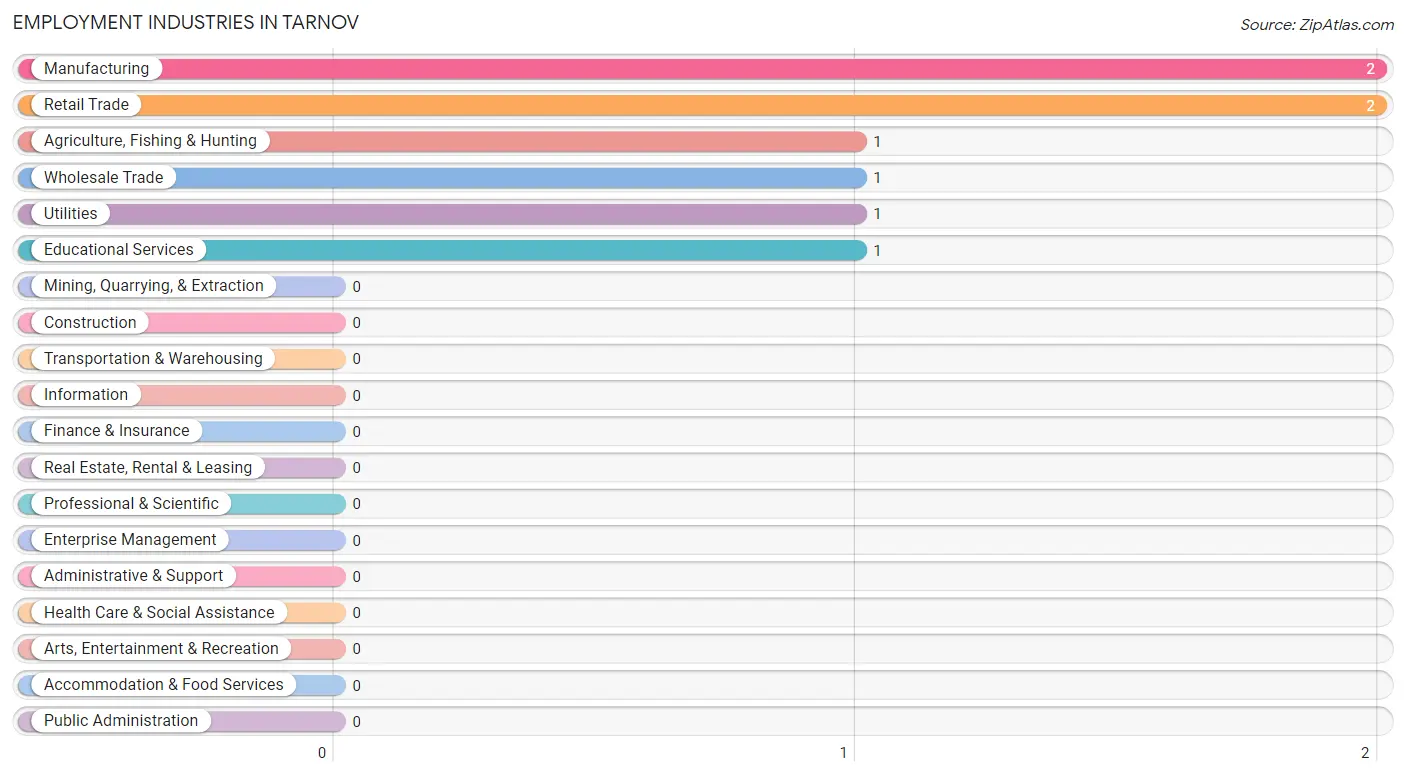
Employment Industries in Tarnov
The major employment industries in Tarnov include Manufacturing (2 | 25.0%), Retail Trade (2 | 25.0%), Agriculture, Fishing & Hunting (1 | 12.5%), Wholesale Trade (1 | 12.5%), and Utilities (1 | 12.5%).
Employment Industries by Sex in Tarnov
The Tarnov industries that see more men than women are Agriculture, Fishing & Hunting (100.0%), Manufacturing (100.0%), and Wholesale Trade (100.0%), whereas the industries that tend to have a higher number of women are Retail Trade (100.0%), and Educational Services (100.0%).
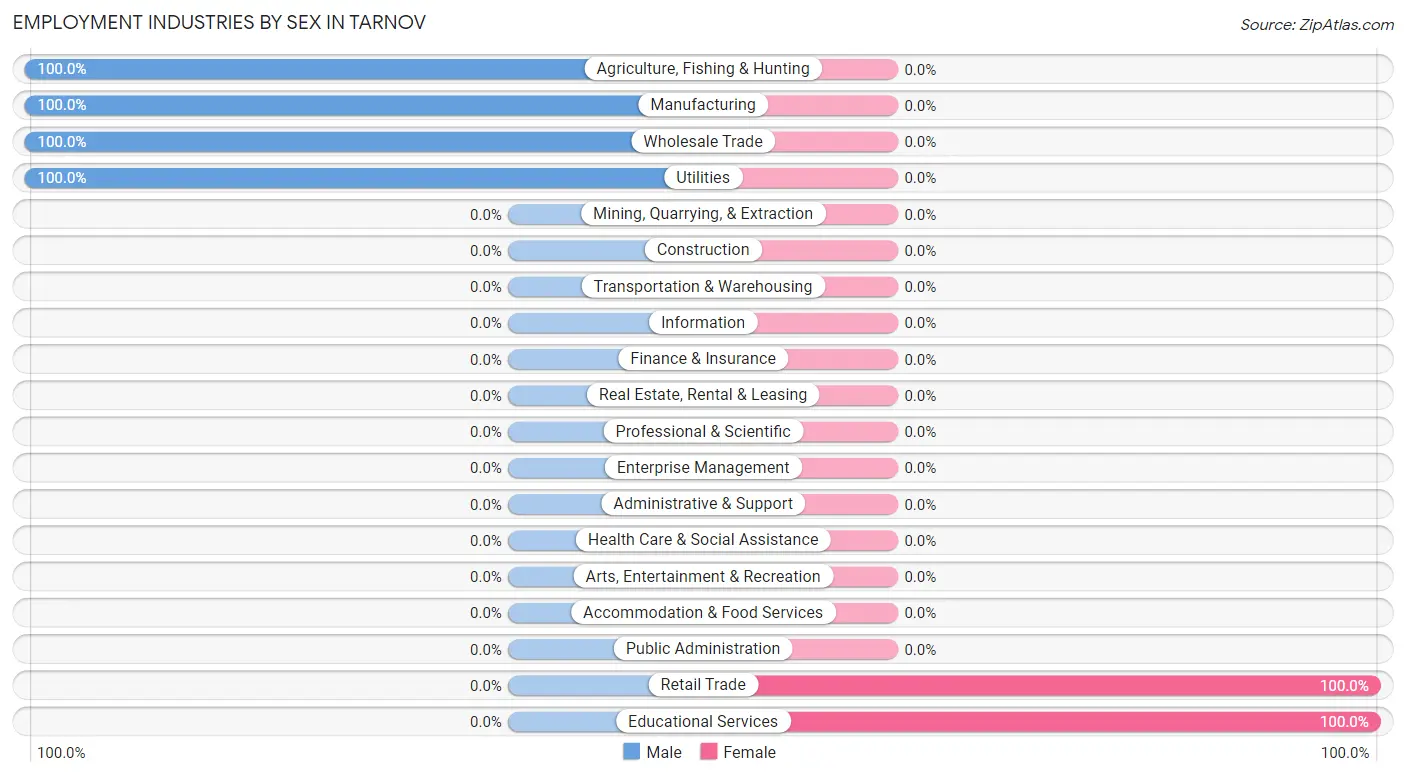
| Industry | Male | Female |
| Agriculture, Fishing & Hunting | 1 (100.0%) | 0 (0.0%) |
| Mining, Quarrying, & Extraction | 0 (0.0%) | 0 (0.0%) |
| Construction | 0 (0.0%) | 0 (0.0%) |
| Manufacturing | 2 (100.0%) | 0 (0.0%) |
| Wholesale Trade | 1 (100.0%) | 0 (0.0%) |
| Retail Trade | 0 (0.0%) | 2 (100.0%) |
| Transportation & Warehousing | 0 (0.0%) | 0 (0.0%) |
| Utilities | 1 (100.0%) | 0 (0.0%) |
| Information | 0 (0.0%) | 0 (0.0%) |
| Finance & Insurance | 0 (0.0%) | 0 (0.0%) |
| Real Estate, Rental & Leasing | 0 (0.0%) | 0 (0.0%) |
| Professional & Scientific | 0 (0.0%) | 0 (0.0%) |
| Enterprise Management | 0 (0.0%) | 0 (0.0%) |
| Administrative & Support | 0 (0.0%) | 0 (0.0%) |
| Educational Services | 0 (0.0%) | 1 (100.0%) |
| Health Care & Social Assistance | 0 (0.0%) | 0 (0.0%) |
| Arts, Entertainment & Recreation | 0 (0.0%) | 0 (0.0%) |
| Accommodation & Food Services | 0 (0.0%) | 0 (0.0%) |
| Public Administration | 0 (0.0%) | 0 (0.0%) |
| Total | 5 (62.5%) | 3 (37.5%) |
Education in Tarnov
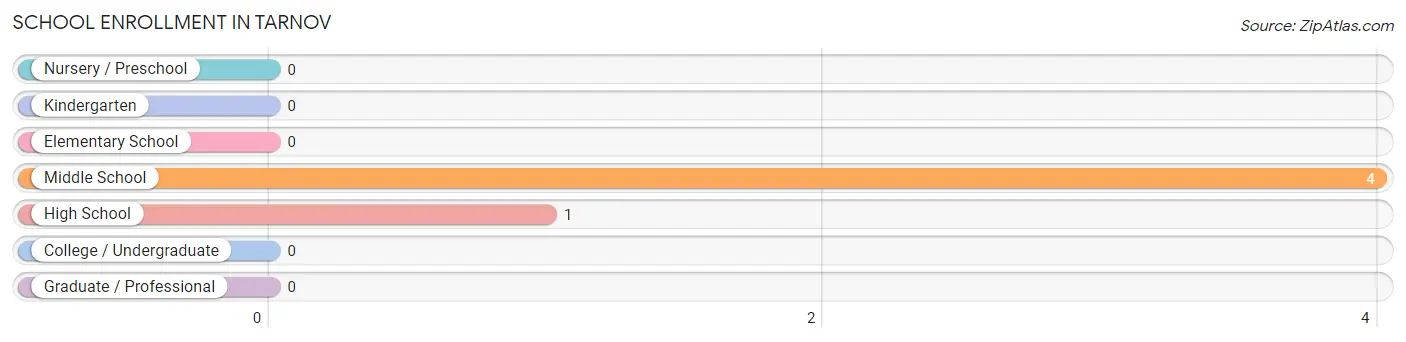
School Enrollment in Tarnov
The most common levels of schooling among the 5 students in Tarnov are middle school (4 | 80.0%), and high school (1 | 20.0%).
| School Level | # Students | % Students |
| Nursery / Preschool | 0 | 0.0% |
| Kindergarten | 0 | 0.0% |
| Elementary School | 0 | 0.0% |
| Middle School | 4 | 80.0% |
| High School | 1 | 20.0% |
| College / Undergraduate | 0 | 0.0% |
| Graduate / Professional | 0 | 0.0% |
| Total | 5 | 100.0% |
School Enrollment by Age by Funding Source in Tarnov
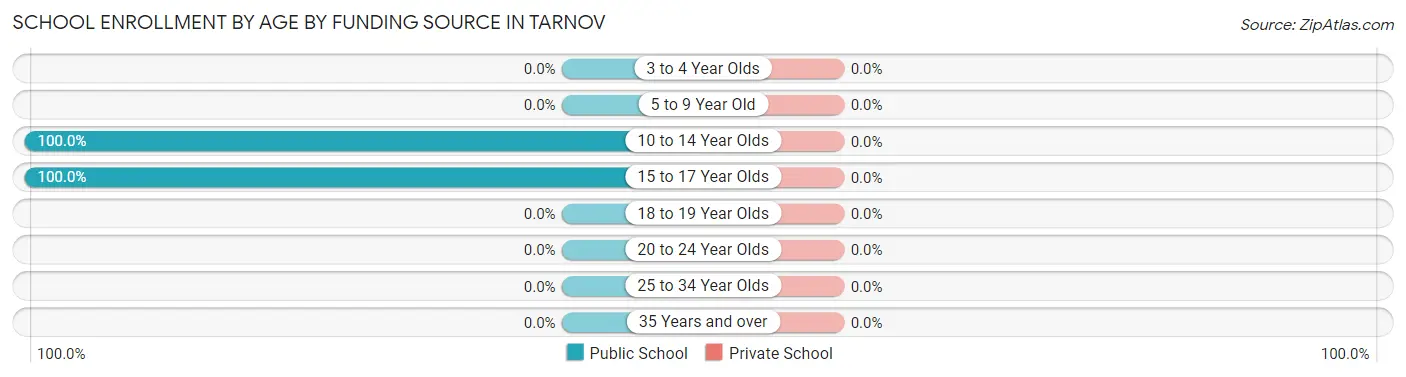
| Age Bracket | Public School | Private School |
| 3 to 4 Year Olds | 0 (0.0%) | 0 (0.0%) |
| 5 to 9 Year Old | 0 (0.0%) | 0 (0.0%) |
| 10 to 14 Year Olds | 4 (100.0%) | 0 (0.0%) |
| 15 to 17 Year Olds | 1 (100.0%) | 0 (0.0%) |
| 18 to 19 Year Olds | 0 (0.0%) | 0 (0.0%) |
| 20 to 24 Year Olds | 0 (0.0%) | 0 (0.0%) |
| 25 to 34 Year Olds | 0 (0.0%) | 0 (0.0%) |
| 35 Years and over | 0 (0.0%) | 0 (0.0%) |
| Total | 5 (100.0%) | 0 (0.0%) |
Educational Attainment by Field of Study in Tarnov
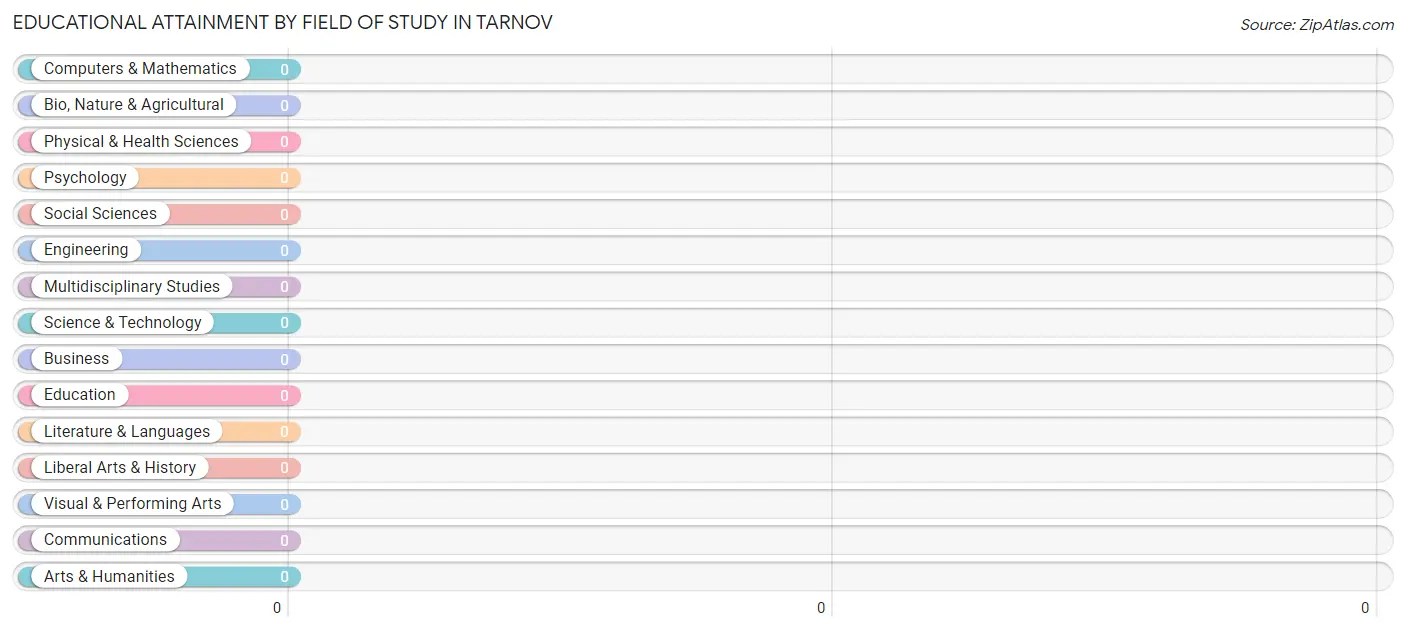
| Field of Study | # Graduates | % Graduates |
| Computers & Mathematics | 0 | 0.0% |
| Bio, Nature & Agricultural | 0 | 0.0% |
| Physical & Health Sciences | 0 | 0.0% |
| Psychology | 0 | 0.0% |
| Social Sciences | 0 | 0.0% |
| Engineering | 0 | 0.0% |
| Multidisciplinary Studies | 0 | 0.0% |
| Science & Technology | 0 | 0.0% |
| Business | 0 | 0.0% |
| Education | 0 | 0.0% |
| Literature & Languages | 0 | 0.0% |
| Liberal Arts & History | 0 | 0.0% |
| Visual & Performing Arts | 0 | 0.0% |
| Communications | 0 | 0.0% |
| Arts & Humanities | 0 | 0.0% |
| Total | 0 | 0.0% |
Transportation & Commute in Tarnov
Vehicle Availability by Sex in Tarnov
The most prevalent vehicle ownership categories in Tarnov are males with 2 vehicles (2, accounting for 40.0%) and females with 2 vehicles (1, making up 66.7%).
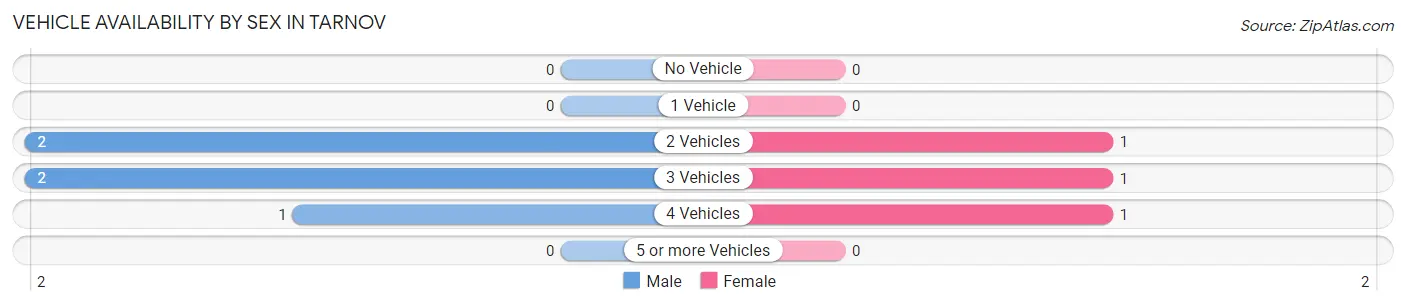
| Vehicles Available | Male | Female |
| No Vehicle | 0 (0.0%) | 0 (0.0%) |
| 1 Vehicle | 0 (0.0%) | 0 (0.0%) |
| 2 Vehicles | 2 (40.0%) | 1 (33.3%) |
| 3 Vehicles | 2 (40.0%) | 1 (33.3%) |
| 4 Vehicles | 1 (20.0%) | 1 (33.3%) |
| 5 or more Vehicles | 0 (0.0%) | 0 (0.0%) |
| Total | 5 (100.0%) | 3 (100.0%) |
Commute Time in Tarnov
The most frequently occuring commute durations in Tarnov are 10 to 14 minutes (2 commuters, 25.0%), 30 to 34 minutes (2 commuters, 25.0%), and 5 to 9 minutes (1 commuters, 12.5%).
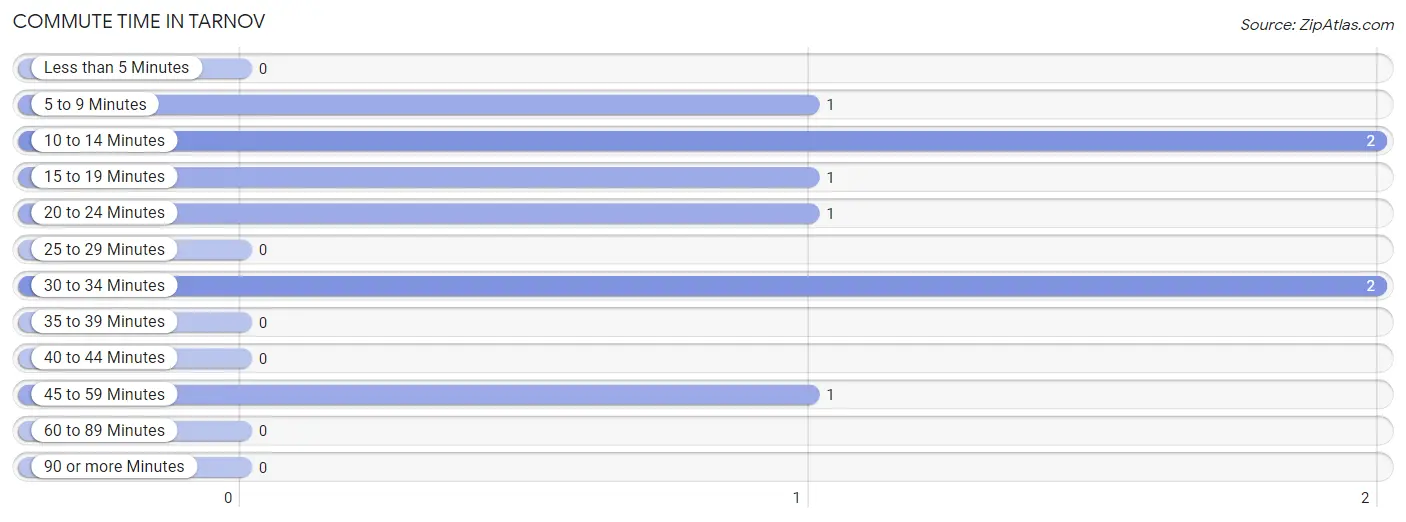
| Commute Time | # Commuters | % Commuters |
| Less than 5 Minutes | 0 | 0.0% |
| 5 to 9 Minutes | 1 | 12.5% |
| 10 to 14 Minutes | 2 | 25.0% |
| 15 to 19 Minutes | 1 | 12.5% |
| 20 to 24 Minutes | 1 | 12.5% |
| 25 to 29 Minutes | 0 | 0.0% |
| 30 to 34 Minutes | 2 | 25.0% |
| 35 to 39 Minutes | 0 | 0.0% |
| 40 to 44 Minutes | 0 | 0.0% |
| 45 to 59 Minutes | 1 | 12.5% |
| 60 to 89 Minutes | 0 | 0.0% |
| 90 or more Minutes | 0 | 0.0% |
Commute Time by Sex in Tarnov
The most common commute times in Tarnov are 5 to 9 minutes (1 commuters, 20.0%) for males and 10 to 14 minutes (1 commuters, 33.3%) for females.
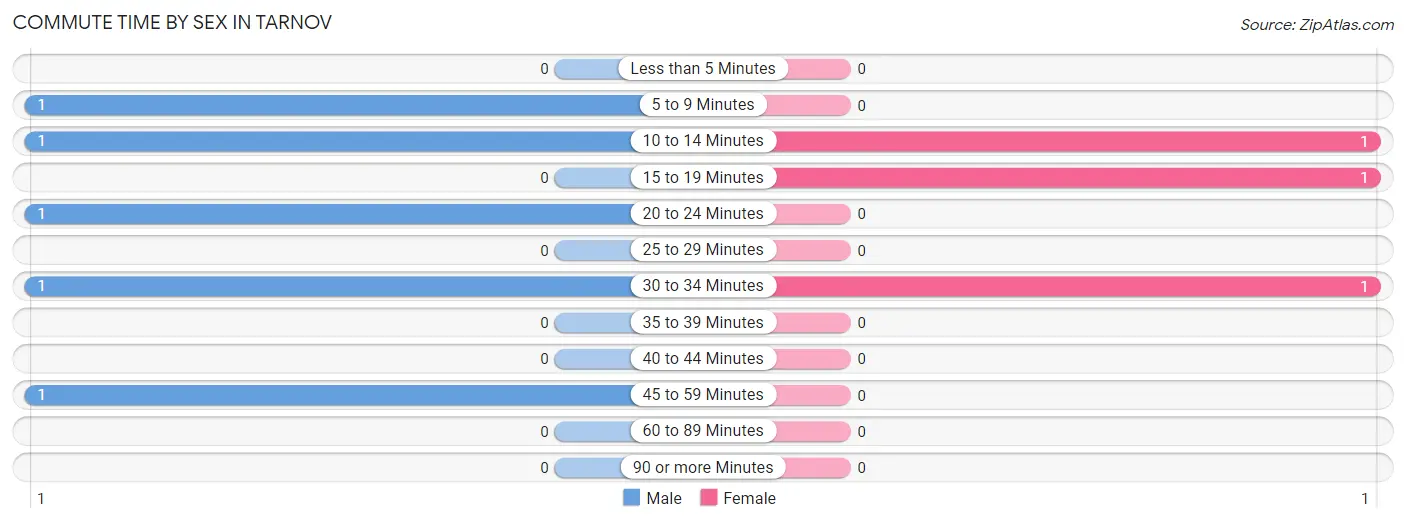
| Commute Time | Male | Female |
| Less than 5 Minutes | 0 (0.0%) | 0 (0.0%) |
| 5 to 9 Minutes | 1 (20.0%) | 0 (0.0%) |
| 10 to 14 Minutes | 1 (20.0%) | 1 (33.3%) |
| 15 to 19 Minutes | 0 (0.0%) | 1 (33.3%) |
| 20 to 24 Minutes | 1 (20.0%) | 0 (0.0%) |
| 25 to 29 Minutes | 0 (0.0%) | 0 (0.0%) |
| 30 to 34 Minutes | 1 (20.0%) | 1 (33.3%) |
| 35 to 39 Minutes | 0 (0.0%) | 0 (0.0%) |
| 40 to 44 Minutes | 0 (0.0%) | 0 (0.0%) |
| 45 to 59 Minutes | 1 (20.0%) | 0 (0.0%) |
| 60 to 89 Minutes | 0 (0.0%) | 0 (0.0%) |
| 90 or more Minutes | 0 (0.0%) | 0 (0.0%) |
Time of Departure to Work by Sex in Tarnov
The most frequent times of departure to work in Tarnov are 6:30 AM to 6:59 AM (2, 40.0%) for males and 6:30 AM to 6:59 AM (1, 33.3%) for females.
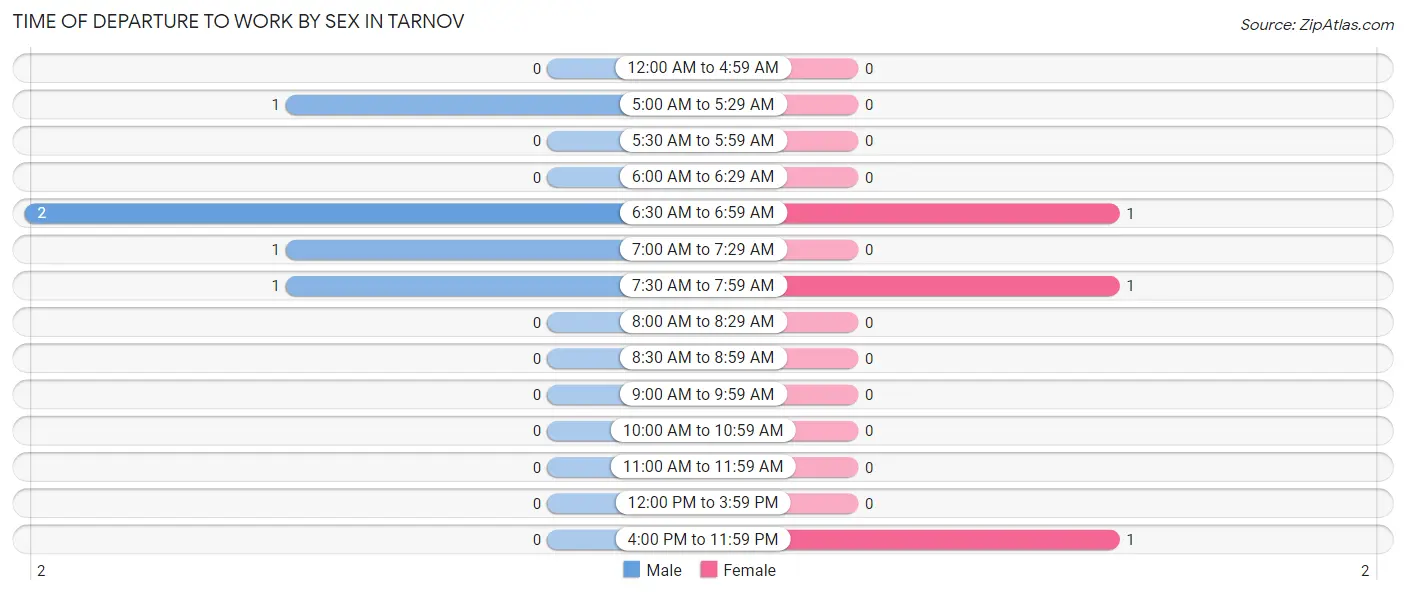
| Time of Departure | Male | Female |
| 12:00 AM to 4:59 AM | 0 (0.0%) | 0 (0.0%) |
| 5:00 AM to 5:29 AM | 1 (20.0%) | 0 (0.0%) |
| 5:30 AM to 5:59 AM | 0 (0.0%) | 0 (0.0%) |
| 6:00 AM to 6:29 AM | 0 (0.0%) | 0 (0.0%) |
| 6:30 AM to 6:59 AM | 2 (40.0%) | 1 (33.3%) |
| 7:00 AM to 7:29 AM | 1 (20.0%) | 0 (0.0%) |
| 7:30 AM to 7:59 AM | 1 (20.0%) | 1 (33.3%) |
| 8:00 AM to 8:29 AM | 0 (0.0%) | 0 (0.0%) |
| 8:30 AM to 8:59 AM | 0 (0.0%) | 0 (0.0%) |
| 9:00 AM to 9:59 AM | 0 (0.0%) | 0 (0.0%) |
| 10:00 AM to 10:59 AM | 0 (0.0%) | 0 (0.0%) |
| 11:00 AM to 11:59 AM | 0 (0.0%) | 0 (0.0%) |
| 12:00 PM to 3:59 PM | 0 (0.0%) | 0 (0.0%) |
| 4:00 PM to 11:59 PM | 0 (0.0%) | 1 (33.3%) |
| Total | 5 (100.0%) | 3 (100.0%) |
Housing Occupancy in Tarnov
Occupancy by Ownership in Tarnov
Of the total 5 dwellings in Tarnov, owner-occupied units account for 4 (80.0%), while renter-occupied units make up 1 (20.0%).
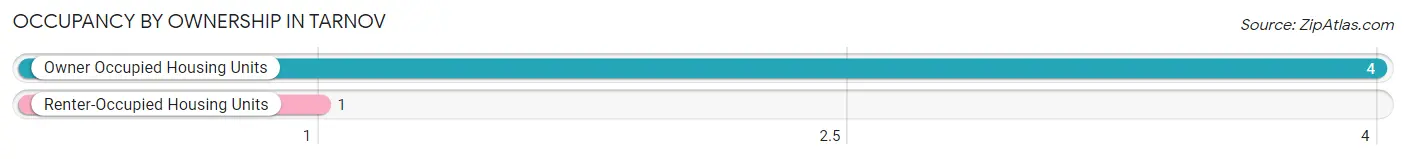
| Occupancy | # Housing Units | % Housing Units |
| Owner Occupied Housing Units | 4 | 80.0% |
| Renter-Occupied Housing Units | 1 | 20.0% |
| Total Occupied Housing Units | 5 | 100.0% |
Occupancy by Household Size in Tarnov
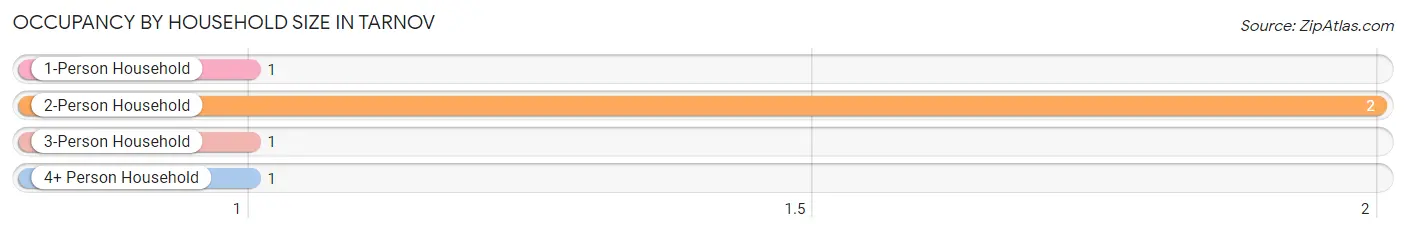
| Household Size | # Housing Units | % Housing Units |
| 1-Person Household | 1 | 20.0% |
| 2-Person Household | 2 | 40.0% |
| 3-Person Household | 1 | 20.0% |
| 4+ Person Household | 1 | 20.0% |
| Total Housing Units | 5 | 100.0% |
Occupancy by Ownership by Household Size in Tarnov
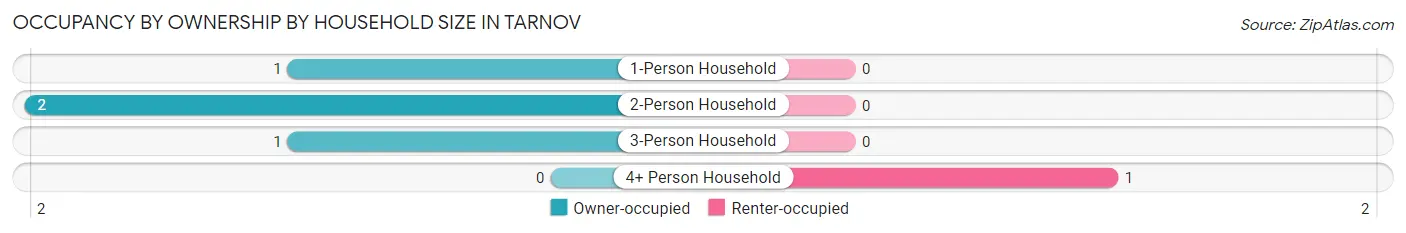
| Household Size | Owner-occupied | Renter-occupied |
| 1-Person Household | 1 (100.0%) | 0 (0.0%) |
| 2-Person Household | 2 (100.0%) | 0 (0.0%) |
| 3-Person Household | 1 (100.0%) | 0 (0.0%) |
| 4+ Person Household | 0 (0.0%) | 1 (100.0%) |
| Total Housing Units | 4 (80.0%) | 1 (20.0%) |
Occupancy by Educational Attainment in Tarnov
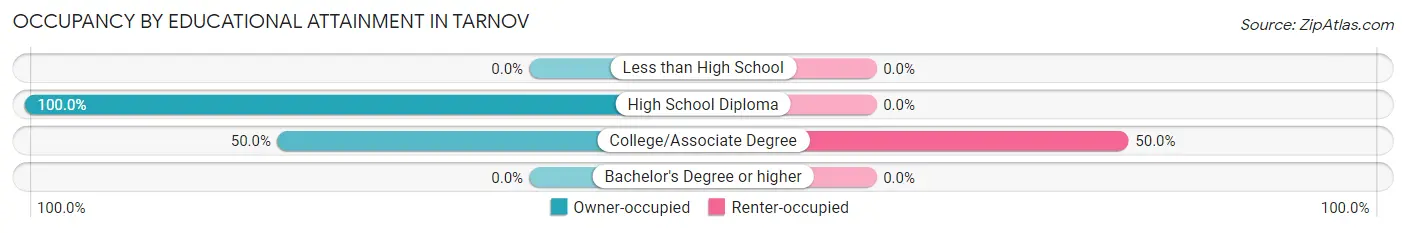
| Household Size | Owner-occupied | Renter-occupied |
| Less than High School | 0 (0.0%) | 0 (0.0%) |
| High School Diploma | 3 (100.0%) | 0 (0.0%) |
| College/Associate Degree | 1 (50.0%) | 1 (50.0%) |
| Bachelor's Degree or higher | 0 (0.0%) | 0 (0.0%) |
Occupancy by Age of Householder in Tarnov
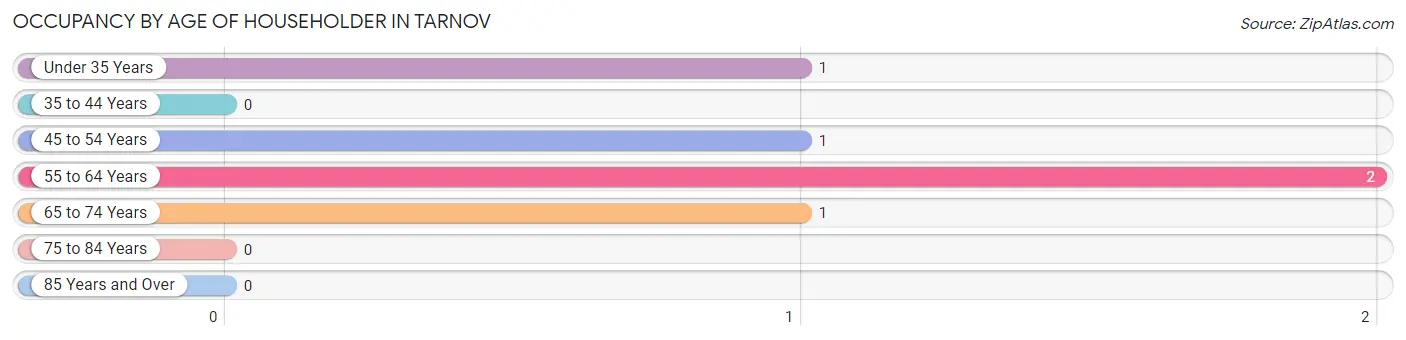
| Age Bracket | # Households | % Households |
| Under 35 Years | 1 | 20.0% |
| 35 to 44 Years | 0 | 0.0% |
| 45 to 54 Years | 1 | 20.0% |
| 55 to 64 Years | 2 | 40.0% |
| 65 to 74 Years | 1 | 20.0% |
| 75 to 84 Years | 0 | 0.0% |
| 85 Years and Over | 0 | 0.0% |
| Total | 5 | 100.0% |
Housing Finances in Tarnov
Median Income by Occupancy in Tarnov
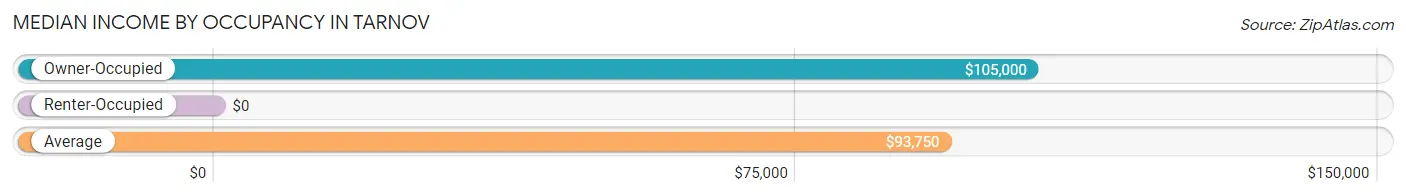
| Occupancy Type | # Households | Median Income |
| Owner-Occupied | 4 (80.0%) | $105,000 |
| Renter-Occupied | 1 (20.0%) | $0 |
| Average | 5 (100.0%) | $93,750 |
Occupancy by Householder Income Bracket in Tarnov
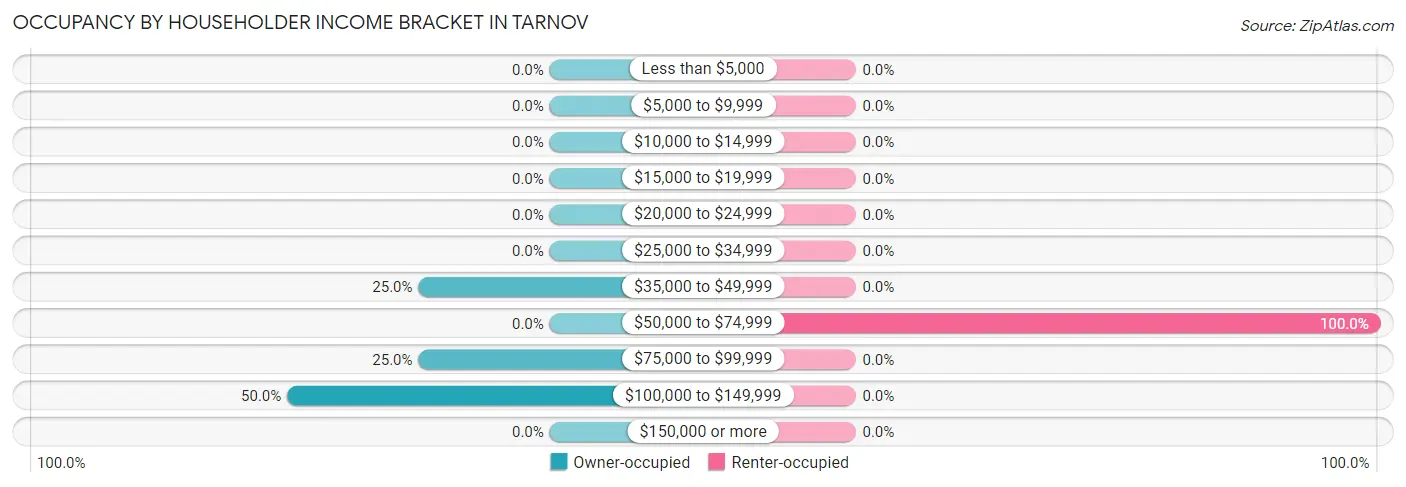
| Income Bracket | Owner-occupied | Renter-occupied |
| Less than $5,000 | 0 (0.0%) | 0 (0.0%) |
| $5,000 to $9,999 | 0 (0.0%) | 0 (0.0%) |
| $10,000 to $14,999 | 0 (0.0%) | 0 (0.0%) |
| $15,000 to $19,999 | 0 (0.0%) | 0 (0.0%) |
| $20,000 to $24,999 | 0 (0.0%) | 0 (0.0%) |
| $25,000 to $34,999 | 0 (0.0%) | 0 (0.0%) |
| $35,000 to $49,999 | 1 (25.0%) | 0 (0.0%) |
| $50,000 to $74,999 | 0 (0.0%) | 1 (100.0%) |
| $75,000 to $99,999 | 1 (25.0%) | 0 (0.0%) |
| $100,000 to $149,999 | 2 (50.0%) | 0 (0.0%) |
| $150,000 or more | 0 (0.0%) | 0 (0.0%) |
| Total | 4 (100.0%) | 1 (100.0%) |
Monthly Housing Cost Tiers in Tarnov
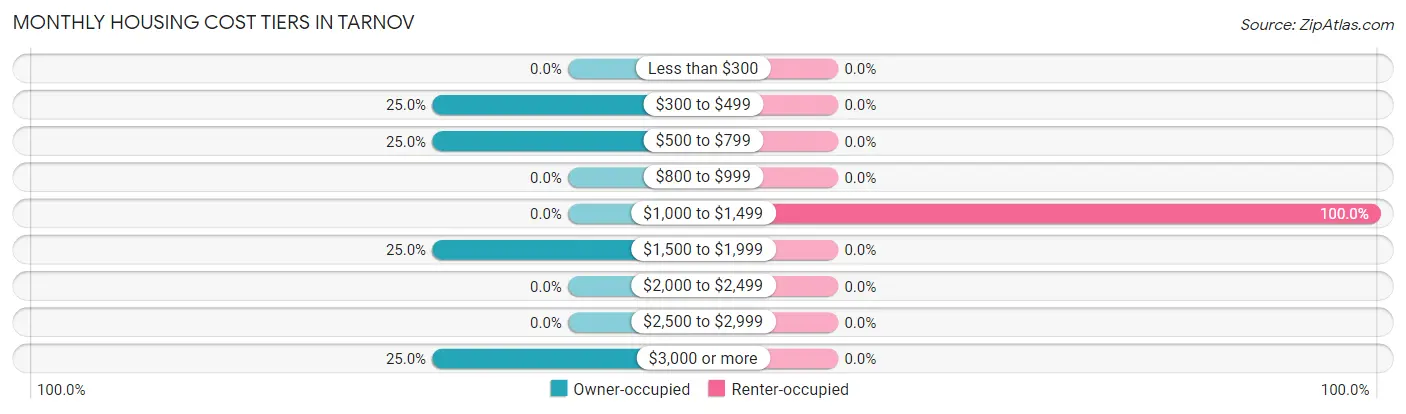
| Monthly Cost | Owner-occupied | Renter-occupied |
| Less than $300 | 0 (0.0%) | 0 (0.0%) |
| $300 to $499 | 1 (25.0%) | 0 (0.0%) |
| $500 to $799 | 1 (25.0%) | 0 (0.0%) |
| $800 to $999 | 0 (0.0%) | 0 (0.0%) |
| $1,000 to $1,499 | 0 (0.0%) | 1 (100.0%) |
| $1,500 to $1,999 | 1 (25.0%) | 0 (0.0%) |
| $2,000 to $2,499 | 0 (0.0%) | 0 (0.0%) |
| $2,500 to $2,999 | 0 (0.0%) | 0 (0.0%) |
| $3,000 or more | 1 (25.0%) | 0 (0.0%) |
| Total | 4 (100.0%) | 1 (100.0%) |
Physical Housing Characteristics in Tarnov
Housing Structures in Tarnov
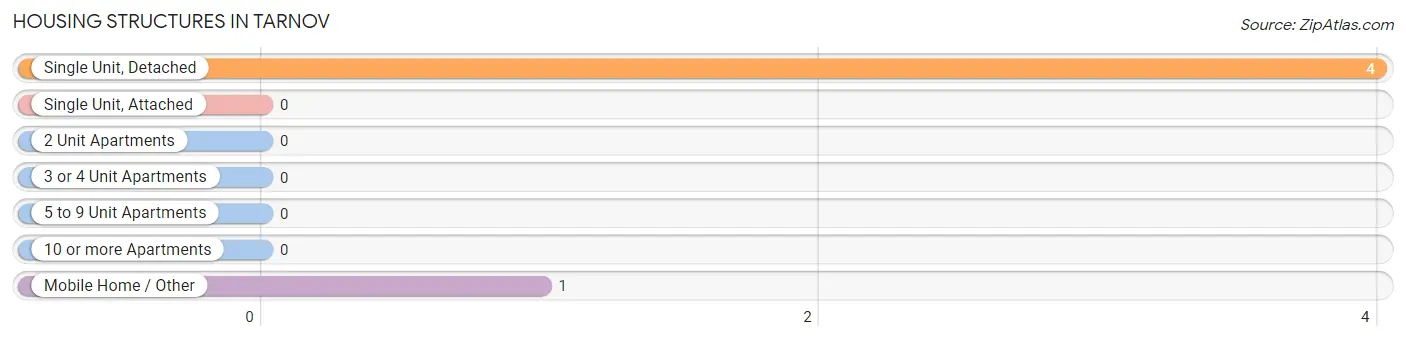
| Structure Type | # Housing Units | % Housing Units |
| Single Unit, Detached | 4 | 80.0% |
| Single Unit, Attached | 0 | 0.0% |
| 2 Unit Apartments | 0 | 0.0% |
| 3 or 4 Unit Apartments | 0 | 0.0% |
| 5 to 9 Unit Apartments | 0 | 0.0% |
| 10 or more Apartments | 0 | 0.0% |
| Mobile Home / Other | 1 | 20.0% |
| Total | 5 | 100.0% |
Housing Structures by Occupancy in Tarnov
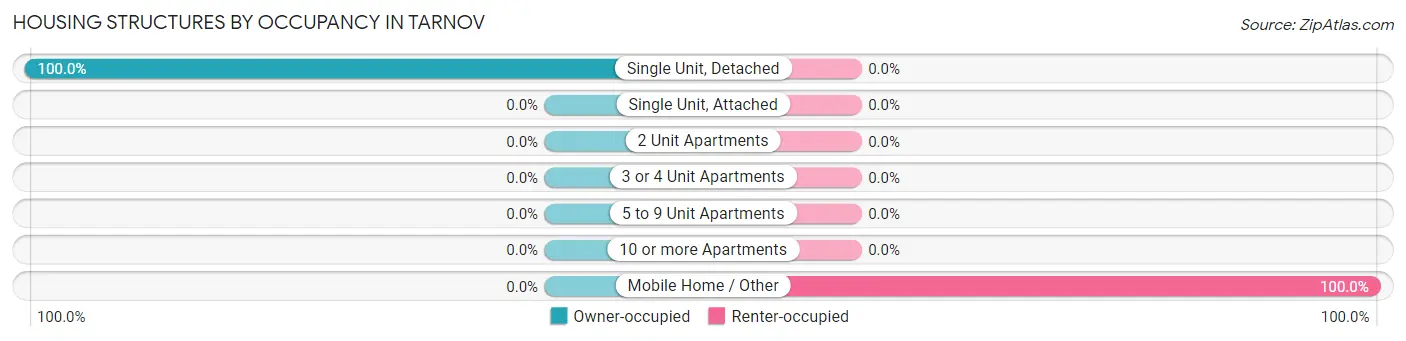
| Structure Type | Owner-occupied | Renter-occupied |
| Single Unit, Detached | 4 (100.0%) | 0 (0.0%) |
| Single Unit, Attached | 0 (0.0%) | 0 (0.0%) |
| 2 Unit Apartments | 0 (0.0%) | 0 (0.0%) |
| 3 or 4 Unit Apartments | 0 (0.0%) | 0 (0.0%) |
| 5 to 9 Unit Apartments | 0 (0.0%) | 0 (0.0%) |
| 10 or more Apartments | 0 (0.0%) | 0 (0.0%) |
| Mobile Home / Other | 0 (0.0%) | 1 (100.0%) |
| Total | 4 (80.0%) | 1 (20.0%) |
Housing Structures by Number of Rooms in Tarnov
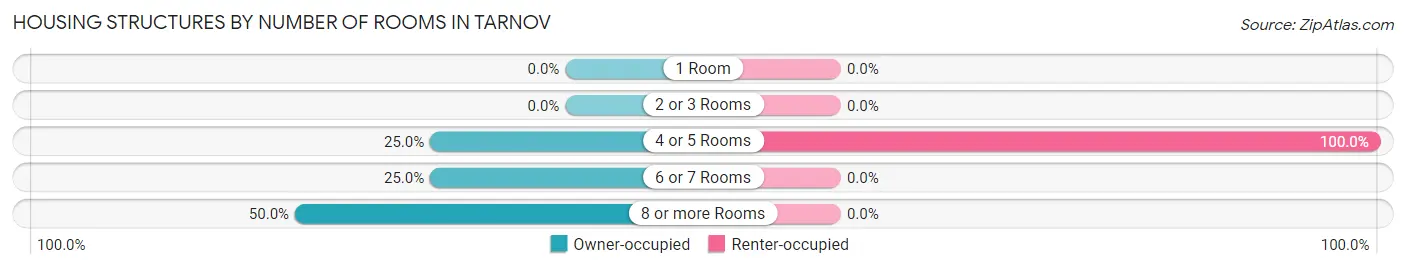
| Number of Rooms | Owner-occupied | Renter-occupied |
| 1 Room | 0 (0.0%) | 0 (0.0%) |
| 2 or 3 Rooms | 0 (0.0%) | 0 (0.0%) |
| 4 or 5 Rooms | 1 (25.0%) | 1 (100.0%) |
| 6 or 7 Rooms | 1 (25.0%) | 0 (0.0%) |
| 8 or more Rooms | 2 (50.0%) | 0 (0.0%) |
| Total | 4 (100.0%) | 1 (100.0%) |
Housing Structure by Heating Type in Tarnov
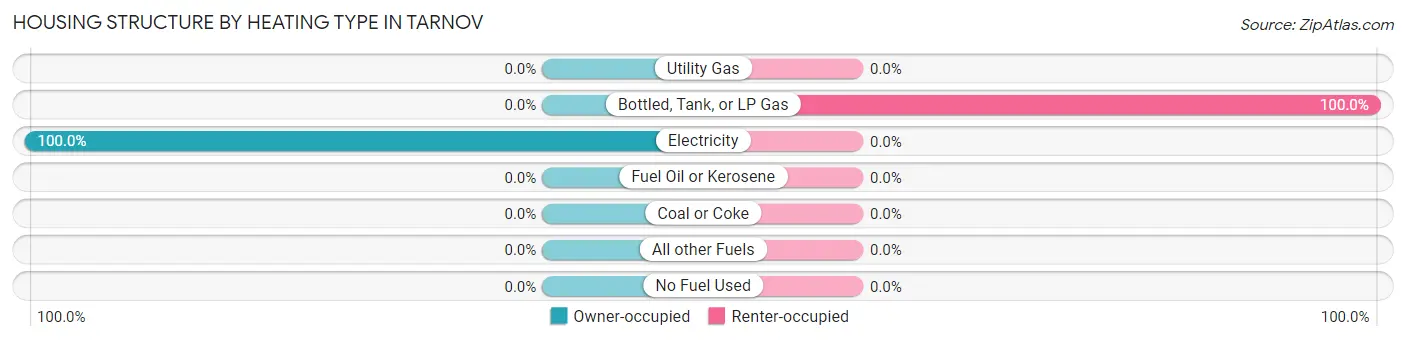
| Heating Type | Owner-occupied | Renter-occupied |
| Utility Gas | 0 (0.0%) | 0 (0.0%) |
| Bottled, Tank, or LP Gas | 0 (0.0%) | 1 (100.0%) |
| Electricity | 4 (100.0%) | 0 (0.0%) |
| Fuel Oil or Kerosene | 0 (0.0%) | 0 (0.0%) |
| Coal or Coke | 0 (0.0%) | 0 (0.0%) |
| All other Fuels | 0 (0.0%) | 0 (0.0%) |
| No Fuel Used | 0 (0.0%) | 0 (0.0%) |
| Total | 4 (100.0%) | 1 (100.0%) |
Household Vehicle Usage in Tarnov
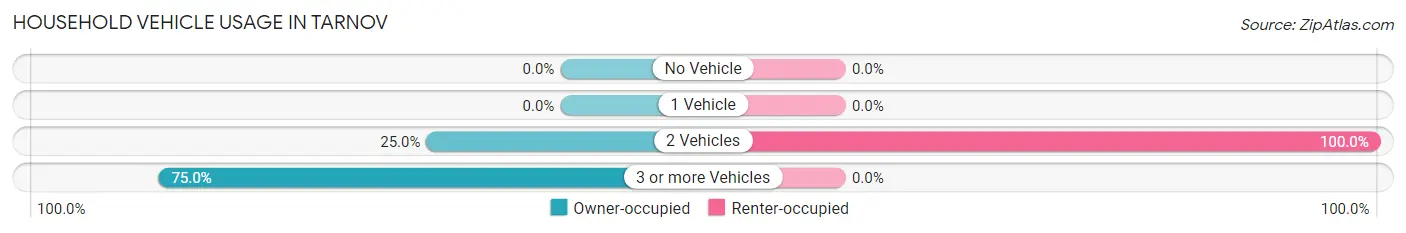
| Vehicles per Household | Owner-occupied | Renter-occupied |
| No Vehicle | 0 (0.0%) | 0 (0.0%) |
| 1 Vehicle | 0 (0.0%) | 0 (0.0%) |
| 2 Vehicles | 1 (25.0%) | 1 (100.0%) |
| 3 or more Vehicles | 3 (75.0%) | 0 (0.0%) |
| Total | 4 (100.0%) | 1 (100.0%) |
Real Estate & Mortgages in Tarnov
Real Estate and Mortgage Overview in Tarnov
| Characteristic | Without Mortgage | With Mortgage |
| Housing Units | 2 | 2 |
| Median Property Value | - | - |
| Median Household Income | - | - |
| Monthly Housing Costs | - | - |
| Real Estate Taxes | - | - |
Property Value by Mortgage Status in Tarnov
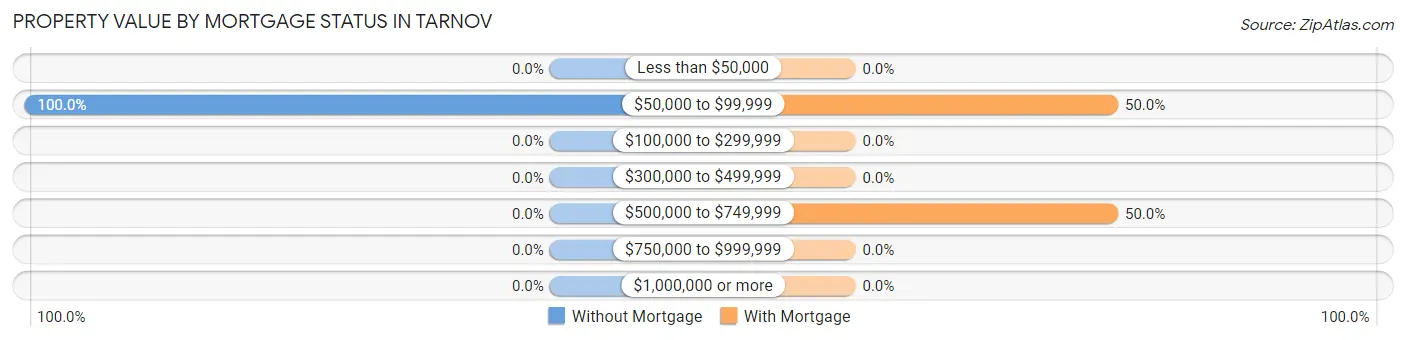
| Property Value | Without Mortgage | With Mortgage |
| Less than $50,000 | 0 (0.0%) | 0 (0.0%) |
| $50,000 to $99,999 | 2 (100.0%) | 1 (50.0%) |
| $100,000 to $299,999 | 0 (0.0%) | 0 (0.0%) |
| $300,000 to $499,999 | 0 (0.0%) | 0 (0.0%) |
| $500,000 to $749,999 | 0 (0.0%) | 1 (50.0%) |
| $750,000 to $999,999 | 0 (0.0%) | 0 (0.0%) |
| $1,000,000 or more | 0 (0.0%) | 0 (0.0%) |
| Total | 2 (100.0%) | 2 (100.0%) |
Household Income by Mortgage Status in Tarnov
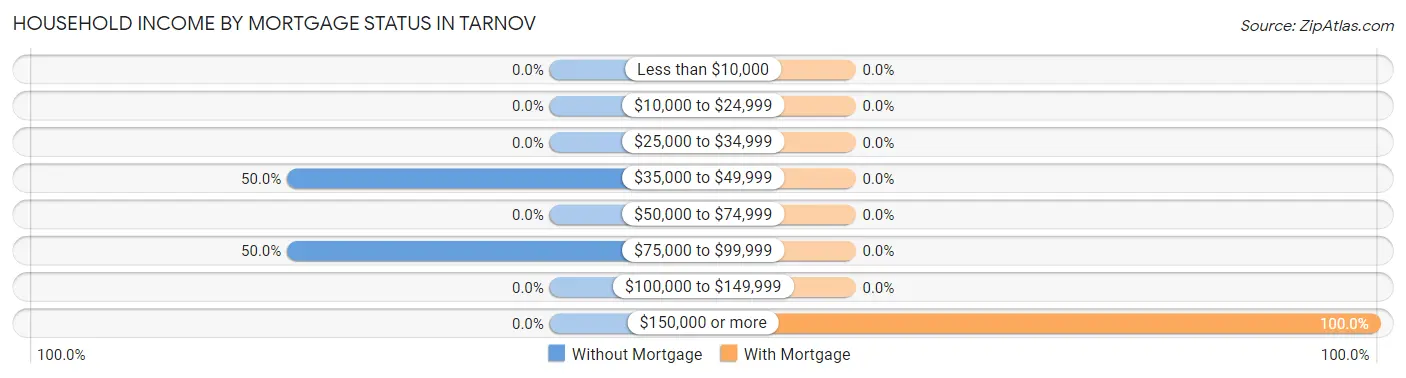
| Household Income | Without Mortgage | With Mortgage |
| Less than $10,000 | 0 (0.0%) | 0 (0.0%) |
| $10,000 to $24,999 | 0 (0.0%) | 0 (0.0%) |
| $25,000 to $34,999 | 0 (0.0%) | 0 (0.0%) |
| $35,000 to $49,999 | 1 (50.0%) | 0 (0.0%) |
| $50,000 to $74,999 | 0 (0.0%) | 0 (0.0%) |
| $75,000 to $99,999 | 1 (50.0%) | 0 (0.0%) |
| $100,000 to $149,999 | 0 (0.0%) | 0 (0.0%) |
| $150,000 or more | 0 (0.0%) | 2 (100.0%) |
| Total | 2 (100.0%) | 2 (100.0%) |
Property Value to Household Income Ratio in Tarnov
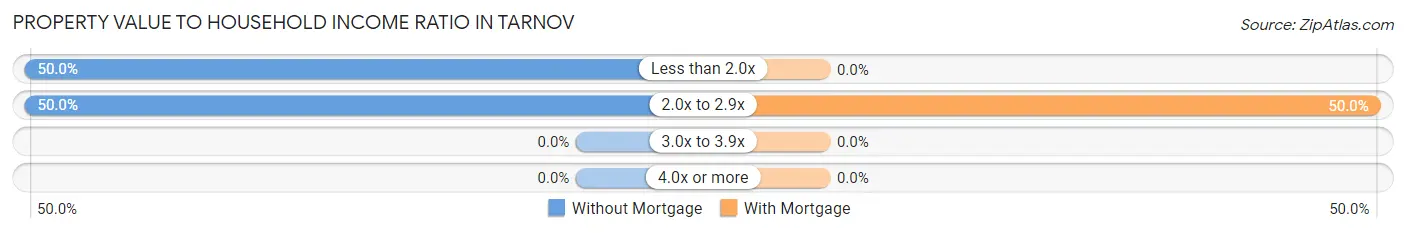
| Value-to-Income Ratio | Without Mortgage | With Mortgage |
| Less than 2.0x | 1 (50.0%) | 0 (0.0%) |
| 2.0x to 2.9x | 1 (50.0%) | 1 (50.0%) |
| 3.0x to 3.9x | 0 (0.0%) | 0 (0.0%) |
| 4.0x or more | 0 (0.0%) | 0 (0.0%) |
| Total | 2 (100.0%) | 2 (100.0%) |
Real Estate Taxes by Mortgage Status in Tarnov
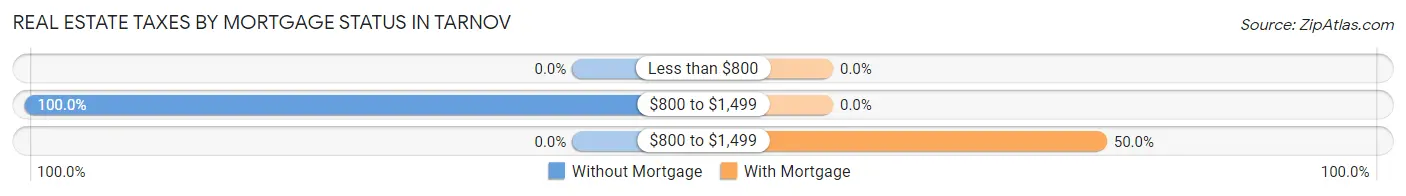
| Property Taxes | Without Mortgage | With Mortgage |
| Less than $800 | 0 (0.0%) | 0 (0.0%) |
| $800 to $1,499 | 2 (100.0%) | 0 (0.0%) |
| $800 to $1,499 | 0 (0.0%) | 1 (50.0%) |
| Total | 2 (100.0%) | 2 (100.0%) |
Health & Disability in Tarnov
Health Insurance Coverage by Age in Tarnov
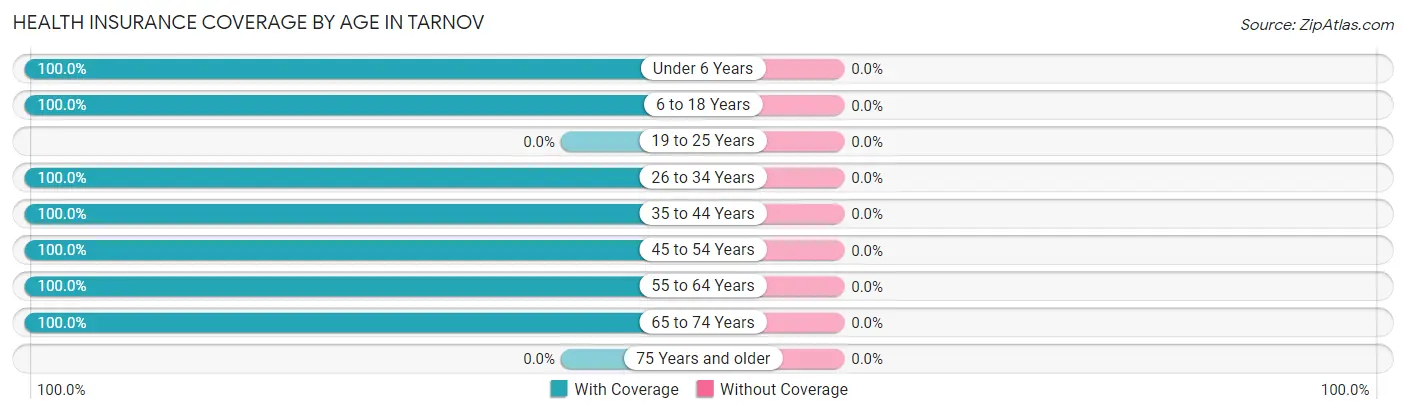
| Age Bracket | With Coverage | Without Coverage |
| Under 6 Years | 1 (100.0%) | 0 (0.0%) |
| 6 to 18 Years | 5 (100.0%) | 0 (0.0%) |
| 19 to 25 Years | 0 (0.0%) | 0 (0.0%) |
| 26 to 34 Years | 1 (100.0%) | 0 (0.0%) |
| 35 to 44 Years | 1 (100.0%) | 0 (0.0%) |
| 45 to 54 Years | 2 (100.0%) | 0 (0.0%) |
| 55 to 64 Years | 3 (100.0%) | 0 (0.0%) |
| 65 to 74 Years | 2 (100.0%) | 0 (0.0%) |
| 75 Years and older | 0 (0.0%) | 0 (0.0%) |
| Total | 15 (100.0%) | 0 (0.0%) |
Health Insurance Coverage by Citizenship Status in Tarnov
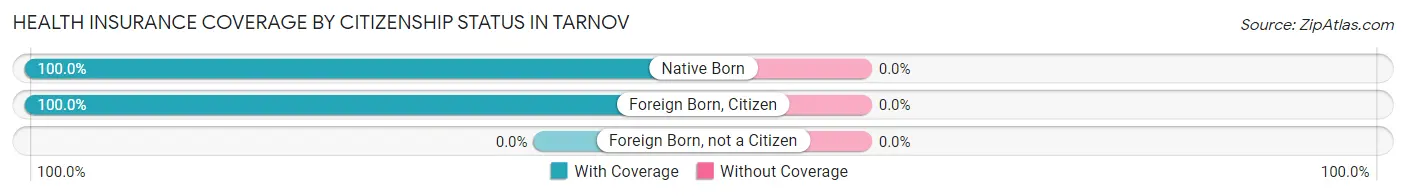
| Citizenship Status | With Coverage | Without Coverage |
| Native Born | 1 (100.0%) | 0 (0.0%) |
| Foreign Born, Citizen | 5 (100.0%) | 0 (0.0%) |
| Foreign Born, not a Citizen | 0 (0.0%) | 0 (0.0%) |
Health Insurance Coverage by Household Income in Tarnov
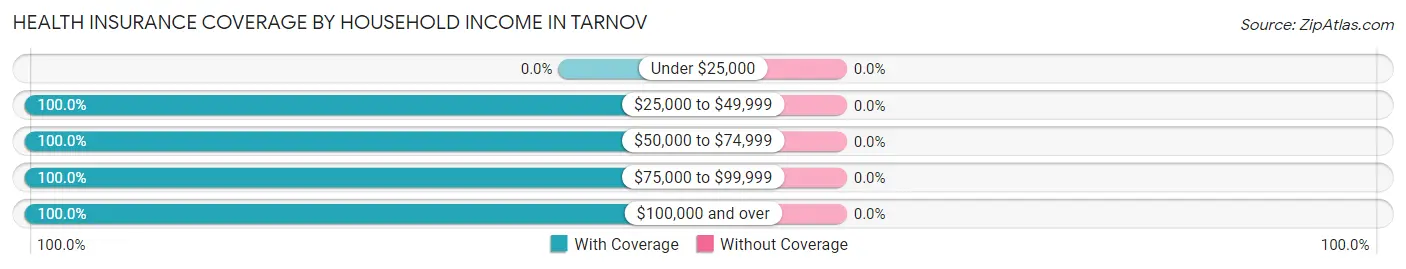
| Household Income | With Coverage | Without Coverage |
| Under $25,000 | 0 (0.0%) | 0 (0.0%) |
| $25,000 to $49,999 | 1 (100.0%) | 0 (0.0%) |
| $50,000 to $74,999 | 7 (100.0%) | 0 (0.0%) |
| $75,000 to $99,999 | 2 (100.0%) | 0 (0.0%) |
| $100,000 and over | 5 (100.0%) | 0 (0.0%) |
Public vs Private Health Insurance Coverage by Age in Tarnov
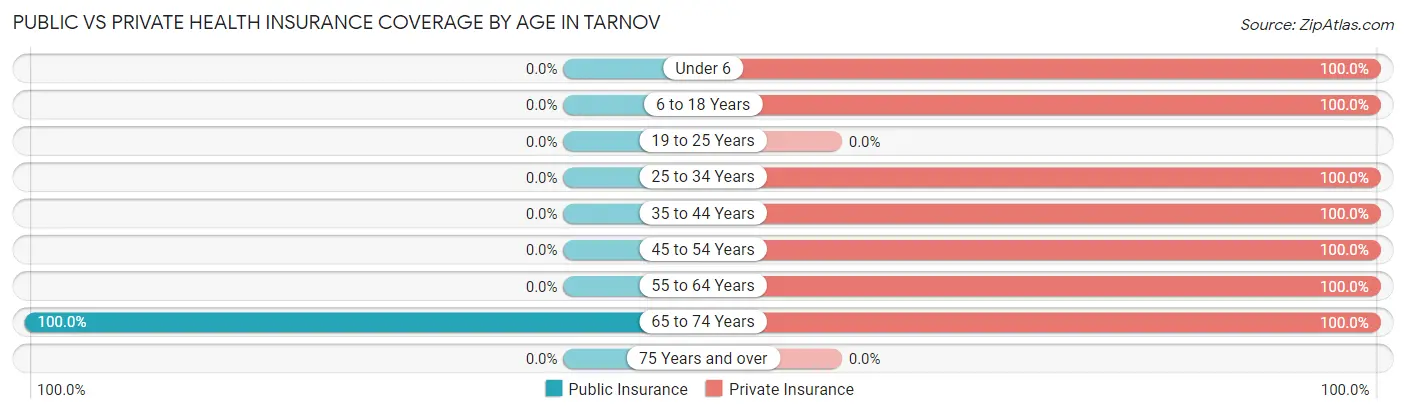
| Age Bracket | Public Insurance | Private Insurance |
| Under 6 | 0 (0.0%) | 1 (100.0%) |
| 6 to 18 Years | 0 (0.0%) | 5 (100.0%) |
| 19 to 25 Years | 0 (0.0%) | 0 (0.0%) |
| 25 to 34 Years | 0 (0.0%) | 1 (100.0%) |
| 35 to 44 Years | 0 (0.0%) | 1 (100.0%) |
| 45 to 54 Years | 0 (0.0%) | 2 (100.0%) |
| 55 to 64 Years | 0 (0.0%) | 3 (100.0%) |
| 65 to 74 Years | 2 (100.0%) | 2 (100.0%) |
| 75 Years and over | 0 (0.0%) | 0 (0.0%) |
| Total | 2 (13.3%) | 15 (100.0%) |
Disability Status by Sex by Age in Tarnov
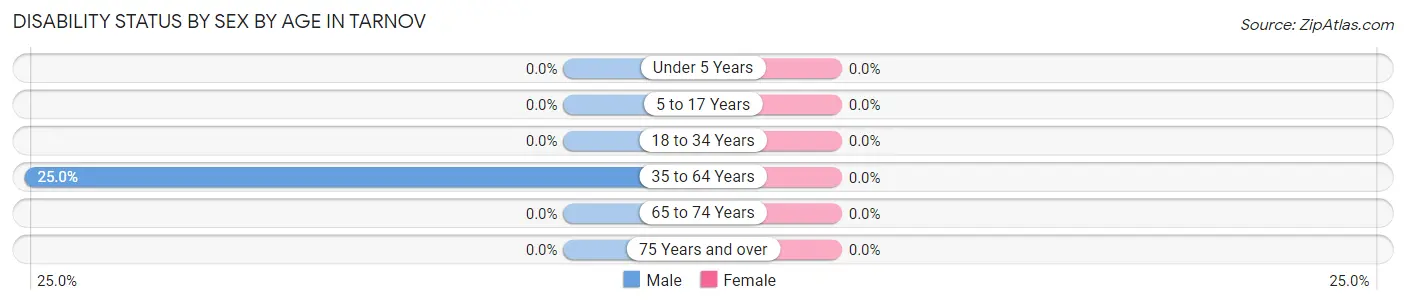
| Age Bracket | Male | Female |
| Under 5 Years | 0 (0.0%) | 0 (0.0%) |
| 5 to 17 Years | 0 (0.0%) | 0 (0.0%) |
| 18 to 34 Years | 0 (0.0%) | 0 (0.0%) |
| 35 to 64 Years | 1 (25.0%) | 0 (0.0%) |
| 65 to 74 Years | 0 (0.0%) | 0 (0.0%) |
| 75 Years and over | 0 (0.0%) | 0 (0.0%) |
Disability Class by Sex by Age in Tarnov
Disability Class: Hearing Difficulty
| Age Bracket | Male | Female |
| Under 5 Years | 0 (0.0%) | 0 (0.0%) |
| 5 to 17 Years | 0 (0.0%) | 0 (0.0%) |
| 18 to 34 Years | 0 (0.0%) | 0 (0.0%) |
| 35 to 64 Years | 0 (0.0%) | 0 (0.0%) |
| 65 to 74 Years | 0 (0.0%) | 0 (0.0%) |
| 75 Years and over | 0 (0.0%) | 0 (0.0%) |
Disability Class: Vision Difficulty
| Age Bracket | Male | Female |
| Under 5 Years | 0 (0.0%) | 0 (0.0%) |
| 5 to 17 Years | 0 (0.0%) | 0 (0.0%) |
| 18 to 34 Years | 0 (0.0%) | 0 (0.0%) |
| 35 to 64 Years | 0 (0.0%) | 0 (0.0%) |
| 65 to 74 Years | 0 (0.0%) | 0 (0.0%) |
| 75 Years and over | 0 (0.0%) | 0 (0.0%) |
Disability Class: Cognitive Difficulty
| Age Bracket | Male | Female |
| 5 to 17 Years | 0 (0.0%) | 0 (0.0%) |
| 18 to 34 Years | 0 (0.0%) | 0 (0.0%) |
| 35 to 64 Years | 1 (25.0%) | 0 (0.0%) |
| 65 to 74 Years | 0 (0.0%) | 0 (0.0%) |
| 75 Years and over | 0 (0.0%) | 0 (0.0%) |
Disability Class: Ambulatory Difficulty
| Age Bracket | Male | Female |
| 5 to 17 Years | 0 (0.0%) | 0 (0.0%) |
| 18 to 34 Years | 0 (0.0%) | 0 (0.0%) |
| 35 to 64 Years | 0 (0.0%) | 0 (0.0%) |
| 65 to 74 Years | 0 (0.0%) | 0 (0.0%) |
| 75 Years and over | 0 (0.0%) | 0 (0.0%) |
Disability Class: Self-Care Difficulty
| Age Bracket | Male | Female |
| 5 to 17 Years | 0 (0.0%) | 0 (0.0%) |
| 18 to 34 Years | 0 (0.0%) | 0 (0.0%) |
| 35 to 64 Years | 0 (0.0%) | 0 (0.0%) |
| 65 to 74 Years | 0 (0.0%) | 0 (0.0%) |
| 75 Years and over | 0 (0.0%) | 0 (0.0%) |
Technology Access in Tarnov
Computing Device Access in Tarnov
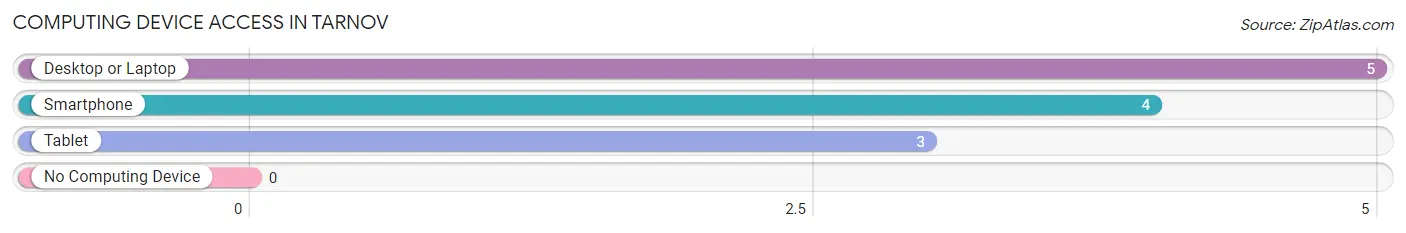
| Device Type | # Households | % Households |
| Desktop or Laptop | 5 | 100.0% |
| Smartphone | 4 | 80.0% |
| Tablet | 3 | 60.0% |
| No Computing Device | 0 | 0.0% |
| Total | 5 | 100.0% |
Internet Access in Tarnov
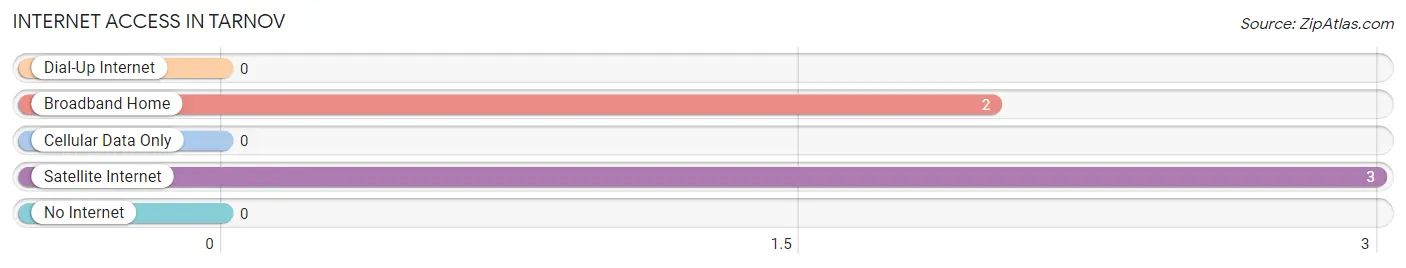
| Internet Type | # Households | % Households |
| Dial-Up Internet | 0 | 0.0% |
| Broadband Home | 2 | 40.0% |
| Cellular Data Only | 0 | 0.0% |
| Satellite Internet | 3 | 60.0% |
| No Internet | 0 | 0.0% |
| Total | 5 | 100.0% |
Tarnov Summary
Tarnov is a small village located in the eastern part of Nebraska, in the United States. It is situated in the Platte River Valley, about 25 miles northwest of Omaha. The village is part of the Columbus, Nebraska metropolitan area and has a population of approximately 500 people.
History
Tarnov was founded in 1871 by German immigrants who had come to the area to farm. The village was named after the town of Tarnow in Poland, which was the hometown of one of the original settlers. The village was incorporated in 1887 and has remained a small, rural community ever since.
Geography
Tarnov is located in the Platte River Valley, which is part of the Great Plains region of the United States. The village is situated on the banks of the Platte River, which is a major tributary of the Missouri River. The area is characterized by rolling hills and flat plains, with the village itself located on a small hill. The climate in the area is generally mild, with hot summers and cold winters.
Economy
Tarnov’s economy is largely based on agriculture. The village is surrounded by farmland, and many of the residents are involved in farming or related activities. The village also has a few small businesses, including a grocery store, a hardware store, and a few restaurants.
Demographics
As of the 2010 census, the population of Tarnov was 498 people. The racial makeup of the village was 97.2% White, 0.2% African American, 0.4% Native American, 0.2% Asian, 0.2% from other races, and 1.9% from two or more races. The median household income was $41,250, and the median family income was $50,000.
Conclusion
Tarnov is a small village located in the eastern part of Nebraska. It was founded in 1871 by German immigrants and has remained a small, rural community ever since. The village is situated in the Platte River Valley and is surrounded by farmland. The economy of Tarnov is largely based on agriculture, and the village has a population of approximately 500 people.
Common Questions
What is Per Capita Income in Tarnov?
Per Capita income in Tarnov is $28,653.
What is the Median Family Income in Tarnov?
Median Family Income in Tarnov is $105,000.
What is the Median Household income in Tarnov?
Median Household Income in Tarnov is $93,750.
What is Income or Wage Gap in Tarnov?
Income or Wage Gap in Tarnov is 62.7%.
Women in Tarnov earn 37.3 cents for every dollar earned by a man.
What is Inequality or Gini Index in Tarnov?
Inequality or Gini Index in Tarnov is 0.19.
What is the Total Population of Tarnov?
Total Population of Tarnov is 15.
What is the Total Male Population of Tarnov?
Total Male Population of Tarnov is 11.
What is the Total Female Population of Tarnov?
Total Female Population of Tarnov is 4.
What is the Ratio of Males per 100 Females in Tarnov?
There are 275.00 Males per 100 Females in Tarnov.
What is the Ratio of Females per 100 Males in Tarnov?
There are 36.36 Females per 100 Males in Tarnov.
What is the Median Population Age in Tarnov?
Median Population Age in Tarnov is 37.5 Years.
What is the Average Family Size in Tarnov
Average Family Size in Tarnov is 3.5 People.
What is the Average Household Size in Tarnov
Average Household Size in Tarnov is 3.0 People.
How Large is the Labor Force in Tarnov?
There are 8 People in the Labor Forcein in Tarnov.
What is the Percentage of People in the Labor Force in Tarnov?
80.0% of People are in the Labor Force in Tarnov.