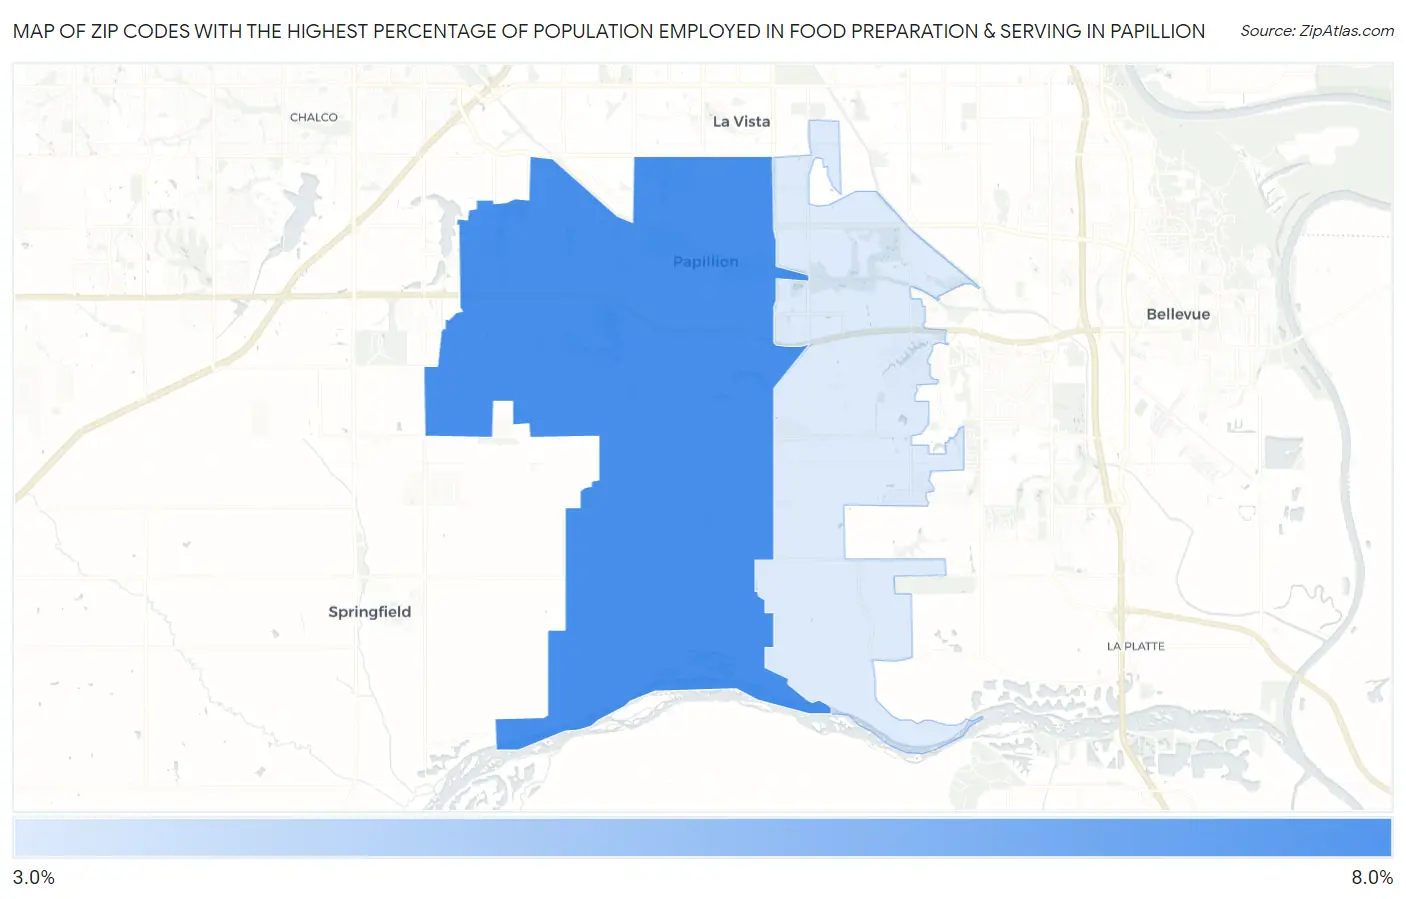
Zip Codes with the Highest Percentage of Population Employed in Food Preparation & Serving in Papillion, NE
RELATED REPORTS & OPTIONS
Food Preparation & Serving
Papillion
Compare Zip Codes
Map of Zip Codes with the Highest Percentage of Population Employed in Food Preparation & Serving in Papillion
3.9%
6.4%
Zip Codes with the Highest Percentage of Population Employed in Food Preparation & Serving in Papillion, NE
| Zip Code | % Employed | vs State | vs National | |
| 1. | 68046 | 6.4% | 5.1%(+1.29)#111 | 5.3%(+1.08)#8,227 |
| 2. | 68133 | 3.9% | 5.1%(-1.21)#238 | 5.3%(-1.42)#17,686 |
1
Common Questions
What are the Top Zip Codes with the Highest Percentage of Population Employed in Food Preparation & Serving in Papillion, NE?
Top Zip Codes with the Highest Percentage of Population Employed in Food Preparation & Serving in Papillion, NE are:
What zip code has the Highest Percentage of Population Employed in Food Preparation & Serving in Papillion, NE?
68046 has the Highest Percentage of Population Employed in Food Preparation & Serving in Papillion, NE with 6.4%.
What is the Percentage of Population Employed in Food Preparation & Serving in Papillion, NE?
Percentage of Population Employed in Food Preparation & Serving in Papillion is 7.2%.
What is the Percentage of Population Employed in Food Preparation & Serving in Nebraska?
Percentage of Population Employed in Food Preparation & Serving in Nebraska is 5.1%.
What is the Percentage of Population Employed in Food Preparation & Serving in the United States?
Percentage of Population Employed in Food Preparation & Serving in the United States is 5.3%.