Ravenna, NE Map & Demographics
Ravenna Map
Ravenna Overview
$32,045
PER CAPITA INCOME
$61,544
AVG FAMILY INCOME
$61,066
AVG HOUSEHOLD INCOME
17.4%
WAGE / INCOME GAP [ % ]
82.6¢/ $1
WAGE / INCOME GAP [ $ ]
0.39
INEQUALITY / GINI INDEX
1,408
TOTAL POPULATION
743
MALE POPULATION
665
FEMALE POPULATION
111.73
MALES / 100 FEMALES
89.50
FEMALES / 100 MALES
40.4
MEDIAN AGE
3.0
AVG FAMILY SIZE
2.3
AVG HOUSEHOLD SIZE
763
LABOR FORCE [ PEOPLE ]
64.5%
PERCENT IN LABOR FORCE
2.8%
UNEMPLOYMENT RATE
Ravenna Zip Codes
Ravenna Area Codes
Income in Ravenna
Income Overview in Ravenna
Per Capita Income in Ravenna is $32,045, while median incomes of families and households are $61,544 and $61,066 respectively.
| Characteristic | Number | Measure |
| Per Capita Income | 1,408 | $32,045 |
| Median Family Income | 328 | $61,544 |
| Mean Family Income | 328 | $78,362 |
| Median Household Income | 585 | $61,066 |
| Mean Household Income | 585 | $71,043 |
| Income Deficit | 328 | $0 |
| Wage / Income Gap (%) | 1,408 | 17.38% |
| Wage / Income Gap ($) | 1,408 | 82.62¢ per $1 |
| Gini / Inequality Index | 1,408 | 0.39 |
Earnings by Sex in Ravenna
Average Earnings in Ravenna are $36,480, $41,103 for men and $33,958 for women, a difference of 17.4%.
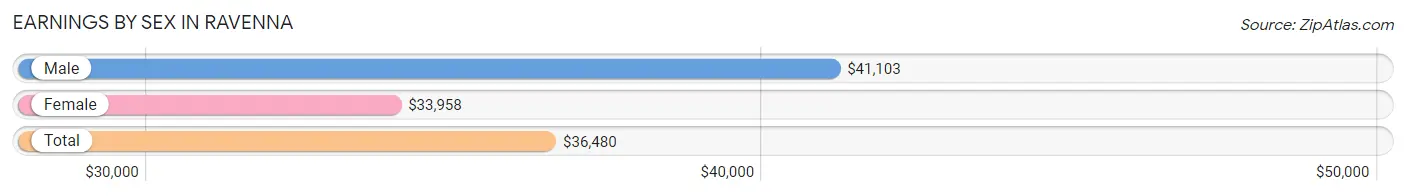
| Sex | Number | Average Earnings |
| Male | 429 (53.6%) | $41,103 |
| Female | 372 (46.4%) | $33,958 |
| Total | 801 (100.0%) | $36,480 |
Earnings by Sex by Income Bracket in Ravenna
The most common earnings brackets in Ravenna are $100,000+ for men (53 | 12.3%) and $30,000 to $34,999 for women (76 | 20.4%).
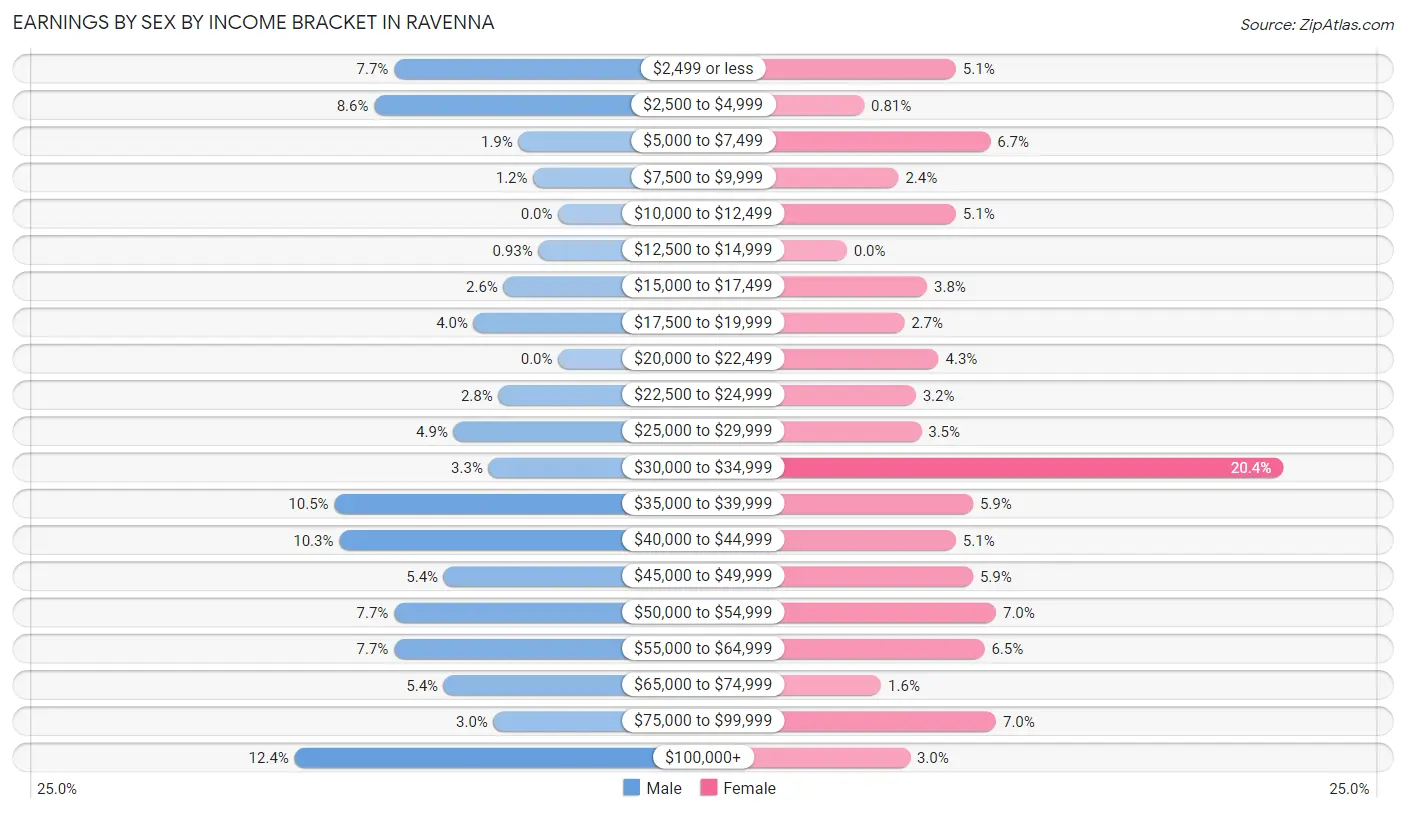
| Income | Male | Female |
| $2,499 or less | 33 (7.7%) | 19 (5.1%) |
| $2,500 to $4,999 | 37 (8.6%) | 3 (0.8%) |
| $5,000 to $7,499 | 8 (1.9%) | 25 (6.7%) |
| $7,500 to $9,999 | 5 (1.2%) | 9 (2.4%) |
| $10,000 to $12,499 | 0 (0.0%) | 19 (5.1%) |
| $12,500 to $14,999 | 4 (0.9%) | 0 (0.0%) |
| $15,000 to $17,499 | 11 (2.6%) | 14 (3.8%) |
| $17,500 to $19,999 | 17 (4.0%) | 10 (2.7%) |
| $20,000 to $22,499 | 0 (0.0%) | 16 (4.3%) |
| $22,500 to $24,999 | 12 (2.8%) | 12 (3.2%) |
| $25,000 to $29,999 | 21 (4.9%) | 13 (3.5%) |
| $30,000 to $34,999 | 14 (3.3%) | 76 (20.4%) |
| $35,000 to $39,999 | 45 (10.5%) | 22 (5.9%) |
| $40,000 to $44,999 | 44 (10.3%) | 19 (5.1%) |
| $45,000 to $49,999 | 23 (5.4%) | 22 (5.9%) |
| $50,000 to $54,999 | 33 (7.7%) | 26 (7.0%) |
| $55,000 to $64,999 | 33 (7.7%) | 24 (6.5%) |
| $65,000 to $74,999 | 23 (5.4%) | 6 (1.6%) |
| $75,000 to $99,999 | 13 (3.0%) | 26 (7.0%) |
| $100,000+ | 53 (12.3%) | 11 (3.0%) |
| Total | 429 (100.0%) | 372 (100.0%) |
Earnings by Sex by Educational Attainment in Ravenna
Average earnings in Ravenna are $44,352 for men and $34,583 for women, a difference of 22.0%. Men with an educational attainment of bachelor's degree enjoy the highest average annual earnings of $71,591, while those with less than high school education earn the least with $36,389. Women with an educational attainment of graduate degree earn the most with the average annual earnings of $53,375, while those with high school diploma education have the smallest earnings of $33,108.
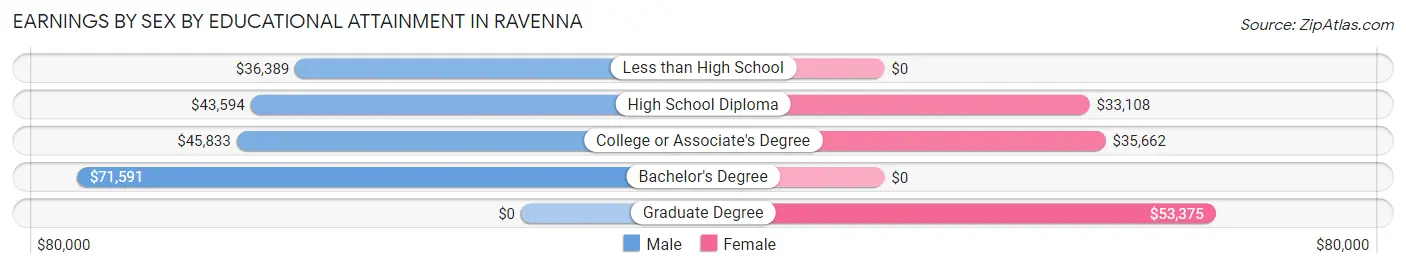
| Educational Attainment | Male Income | Female Income |
| Less than High School | $36,389 | $0 |
| High School Diploma | $43,594 | $33,108 |
| College or Associate's Degree | $45,833 | $35,662 |
| Bachelor's Degree | $71,591 | $0 |
| Graduate Degree | - | - |
| Total | $44,352 | $34,583 |
Family Income in Ravenna
Family Income Brackets in Ravenna
According to the Ravenna family income data, there are 83 families falling into the $50,000 to $74,999 income range, which is the most common income bracket and makes up 25.3% of all families. Conversely, the $10,000 to $14,999 income bracket is the least frequent group with only 6 families (1.8%) belonging to this category.
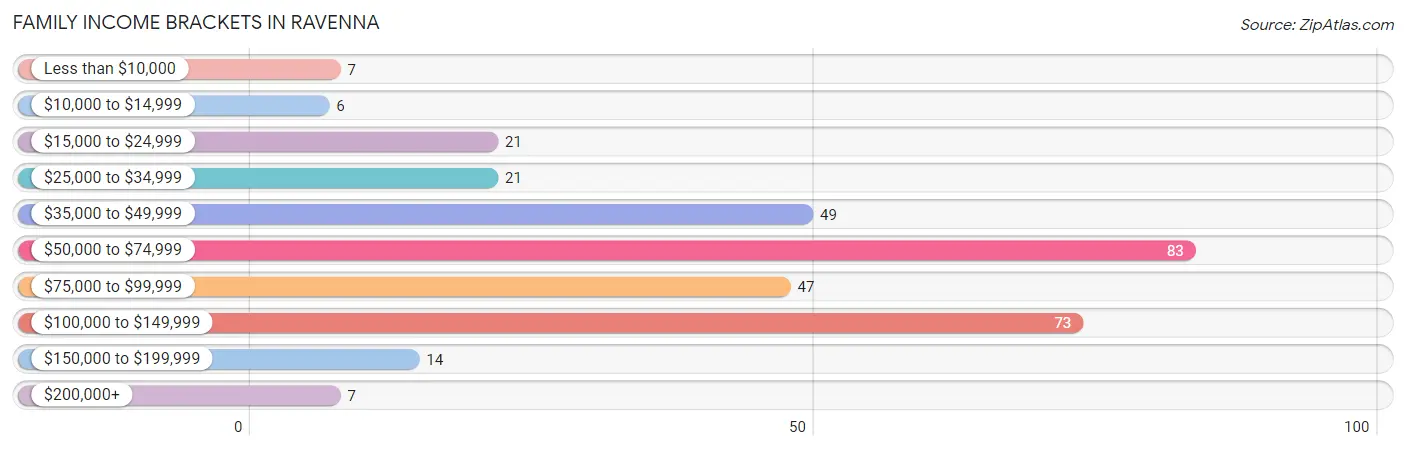
| Income Bracket | # Families | % Families |
| Less than $10,000 | 7 | 2.1% |
| $10,000 to $14,999 | 6 | 1.8% |
| $15,000 to $24,999 | 21 | 6.4% |
| $25,000 to $34,999 | 21 | 6.4% |
| $35,000 to $49,999 | 49 | 14.9% |
| $50,000 to $74,999 | 83 | 25.3% |
| $75,000 to $99,999 | 47 | 14.3% |
| $100,000 to $149,999 | 73 | 22.3% |
| $150,000 to $199,999 | 14 | 4.3% |
| $200,000+ | 7 | 2.1% |
Family Income by Famaliy Size in Ravenna
3-person families (69 | 21.0%) account for the highest median family income in Ravenna with $84,821 per family, while 3-person families (69 | 21.0%) have the highest median income of $28,274 per family member.
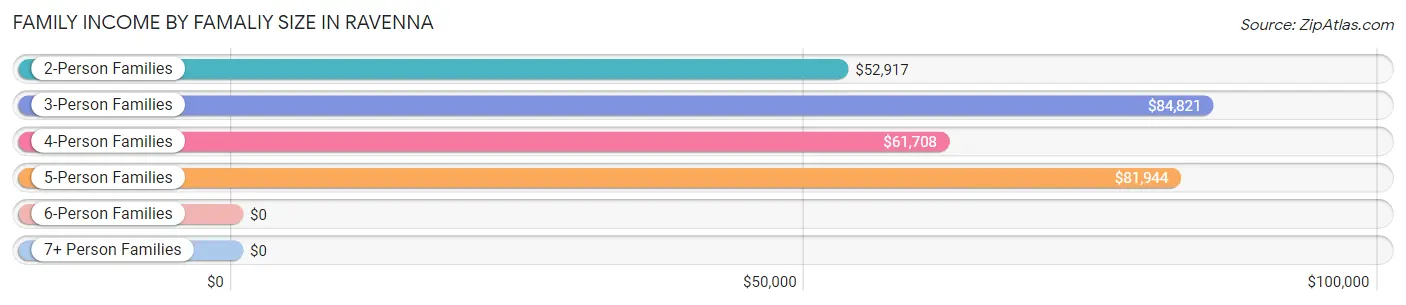
| Income Bracket | # Families | Median Income |
| 2-Person Families | 158 (48.2%) | $52,917 |
| 3-Person Families | 69 (21.0%) | $84,821 |
| 4-Person Families | 63 (19.2%) | $61,708 |
| 5-Person Families | 30 (9.1%) | $81,944 |
| 6-Person Families | 0 (0.0%) | $0 |
| 7+ Person Families | 8 (2.4%) | $0 |
| Total | 328 (100.0%) | $61,544 |
Family Income by Number of Earners in Ravenna
The median family income in Ravenna is $61,544, with families comprising 3+ earners (44) having the highest median family income of $133,000, while families with no earners (41) have the lowest median family income of $27,344, accounting for 13.4% and 12.5% of families, respectively.
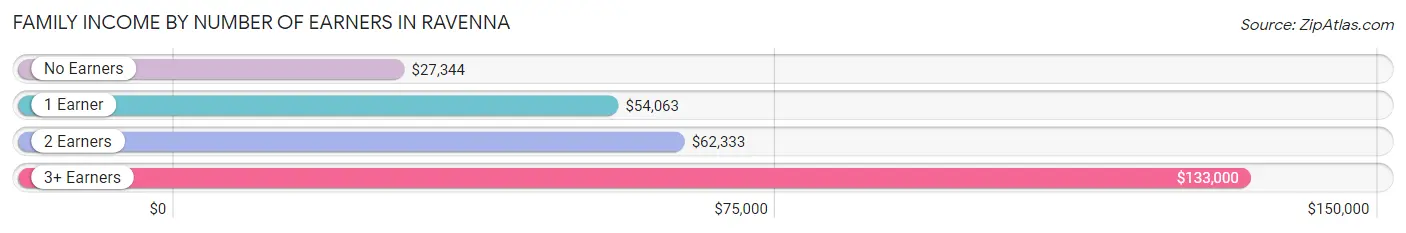
| Number of Earners | # Families | Median Income |
| No Earners | 41 (12.5%) | $27,344 |
| 1 Earner | 81 (24.7%) | $54,063 |
| 2 Earners | 162 (49.4%) | $62,333 |
| 3+ Earners | 44 (13.4%) | $133,000 |
| Total | 328 (100.0%) | $61,544 |
Household Income in Ravenna
Household Income Brackets in Ravenna
With 122 households falling in the category, the $75,000 to $99,999 income range is the most frequent in Ravenna, accounting for 20.8% of all households. In contrast, only 10 households (1.7%) fall into the $200,000+ income bracket, making it the least populous group.
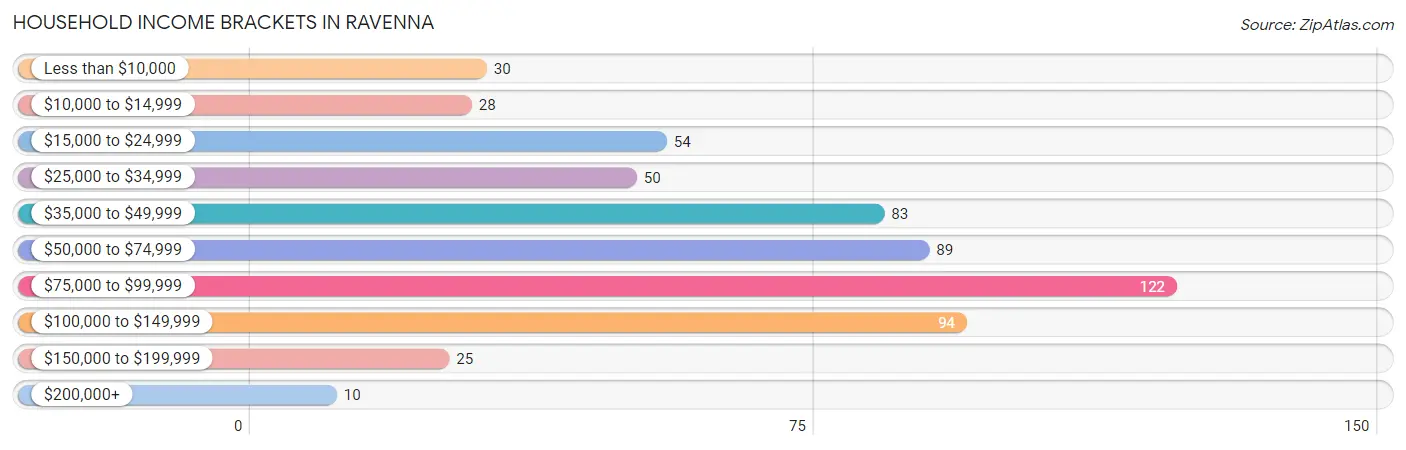
| Income Bracket | # Households | % Households |
| Less than $10,000 | 30 | 5.1% |
| $10,000 to $14,999 | 28 | 4.8% |
| $15,000 to $24,999 | 54 | 9.2% |
| $25,000 to $34,999 | 50 | 8.5% |
| $35,000 to $49,999 | 83 | 14.2% |
| $50,000 to $74,999 | 89 | 15.2% |
| $75,000 to $99,999 | 122 | 20.9% |
| $100,000 to $149,999 | 94 | 16.1% |
| $150,000 to $199,999 | 25 | 4.3% |
| $200,000+ | 10 | 1.7% |
Household Income by Householder Age in Ravenna
The median household income in Ravenna is $61,066, with the highest median household income of $95,294 found in the 15 to 24 years age bracket for the primary householder. A total of 30 households (5.1%) fall into this category. Meanwhile, the 65+ years age bracket for the primary householder has the lowest median household income of $34,000, with 172 households (29.4%) in this group.
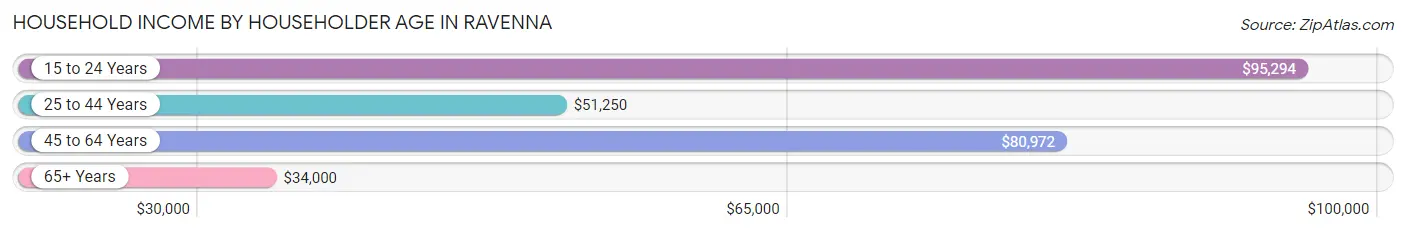
| Income Bracket | # Households | Median Income |
| 15 to 24 Years | 30 (5.1%) | $95,294 |
| 25 to 44 Years | 160 (27.4%) | $51,250 |
| 45 to 64 Years | 223 (38.1%) | $80,972 |
| 65+ Years | 172 (29.4%) | $34,000 |
| Total | 585 (100.0%) | $61,066 |
Poverty in Ravenna
Income Below Poverty by Sex and Age in Ravenna
With 11.0% poverty level for males and 18.9% for females among the residents of Ravenna, 18 to 24 year old males and 15 year old females are the most vulnerable to poverty, with 22 males (40.0%) and 4 females (57.1%) in their respective age groups living below the poverty level.
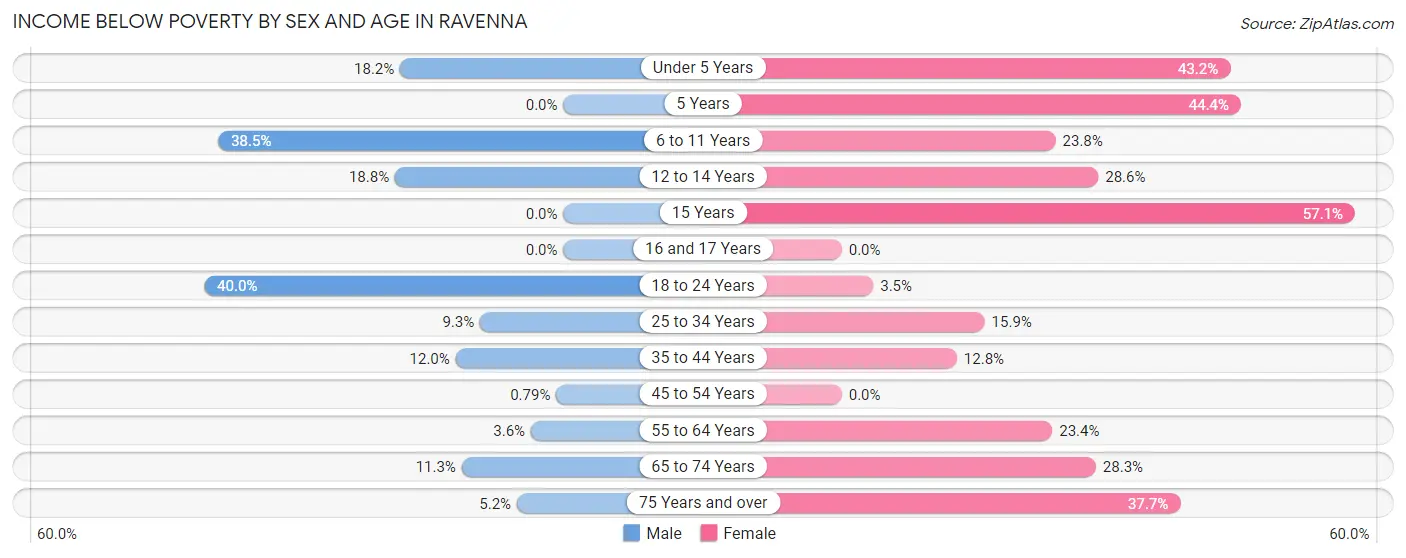
| Age Bracket | Male | Female |
| Under 5 Years | 4 (18.2%) | 16 (43.2%) |
| 5 Years | 0 (0.0%) | 4 (44.4%) |
| 6 to 11 Years | 15 (38.5%) | 10 (23.8%) |
| 12 to 14 Years | 6 (18.8%) | 6 (28.6%) |
| 15 Years | 0 (0.0%) | 4 (57.1%) |
| 16 and 17 Years | 0 (0.0%) | 0 (0.0%) |
| 18 to 24 Years | 22 (40.0%) | 2 (3.5%) |
| 25 to 34 Years | 9 (9.3%) | 14 (15.9%) |
| 35 to 44 Years | 9 (12.0%) | 10 (12.8%) |
| 45 to 54 Years | 1 (0.8%) | 0 (0.0%) |
| 55 to 64 Years | 3 (3.6%) | 15 (23.4%) |
| 65 to 74 Years | 6 (11.3%) | 15 (28.3%) |
| 75 Years and over | 3 (5.2%) | 26 (37.7%) |
| Total | 78 (11.0%) | 122 (18.9%) |
Income Above Poverty by Sex and Age in Ravenna
According to the poverty statistics in Ravenna, males aged 15 years and females aged 16 and 17 years are the age groups that are most secure financially, with 100.0% of males and 100.0% of females in these age groups living above the poverty line.
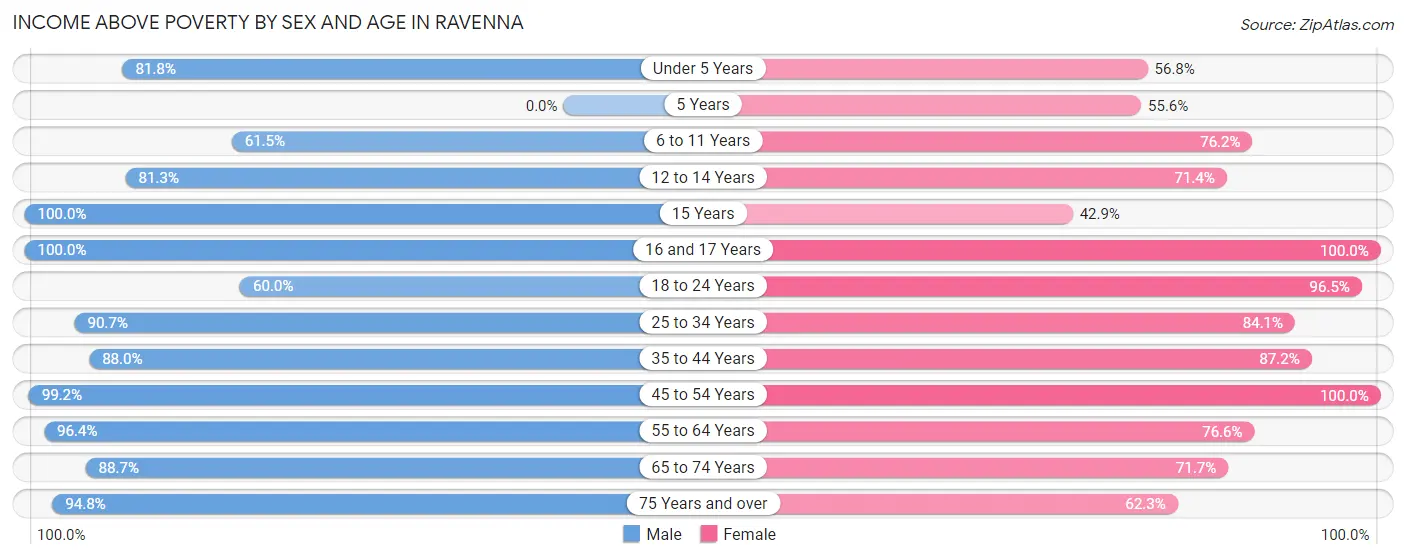
| Age Bracket | Male | Female |
| Under 5 Years | 18 (81.8%) | 21 (56.8%) |
| 5 Years | 0 (0.0%) | 5 (55.6%) |
| 6 to 11 Years | 24 (61.5%) | 32 (76.2%) |
| 12 to 14 Years | 26 (81.2%) | 15 (71.4%) |
| 15 Years | 4 (100.0%) | 3 (42.9%) |
| 16 and 17 Years | 62 (100.0%) | 6 (100.0%) |
| 18 to 24 Years | 33 (60.0%) | 55 (96.5%) |
| 25 to 34 Years | 88 (90.7%) | 74 (84.1%) |
| 35 to 44 Years | 66 (88.0%) | 68 (87.2%) |
| 45 to 54 Years | 126 (99.2%) | 116 (100.0%) |
| 55 to 64 Years | 80 (96.4%) | 49 (76.6%) |
| 65 to 74 Years | 47 (88.7%) | 38 (71.7%) |
| 75 Years and over | 55 (94.8%) | 43 (62.3%) |
| Total | 629 (89.0%) | 525 (81.1%) |
Income Below Poverty Among Married-Couple Families in Ravenna
The poverty statistics for married-couple families in Ravenna show that 5.4% or 14 of the total 261 families live below the poverty line. Families with 5 or more children have the highest poverty rate of 100.0%, comprising of 8 families. On the other hand, families with 1 or 2 children have the lowest poverty rate of 0.0%, which includes 0 families.
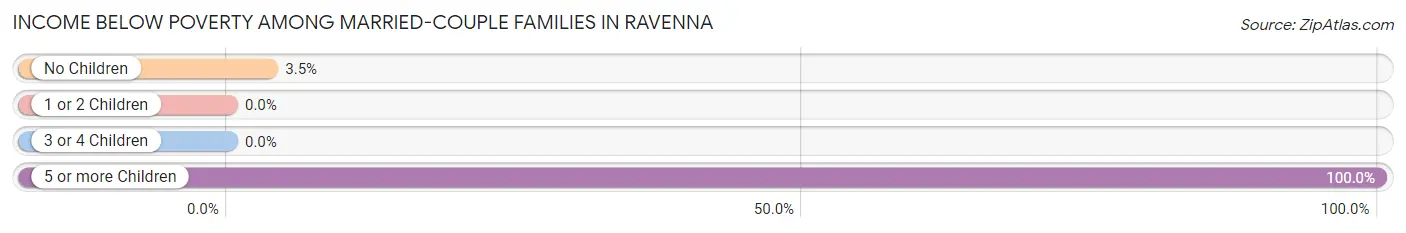
| Children | Above Poverty | Below Poverty |
| No Children | 165 (96.5%) | 6 (3.5%) |
| 1 or 2 Children | 59 (100.0%) | 0 (0.0%) |
| 3 or 4 Children | 23 (100.0%) | 0 (0.0%) |
| 5 or more Children | 0 (0.0%) | 8 (100.0%) |
| Total | 247 (94.6%) | 14 (5.4%) |
Income Below Poverty Among Single-Parent Households in Ravenna
According to the poverty data in Ravenna, 50.0% or 11 single-father households and 20.0% or 9 single-mother households are living below the poverty line. Among single-father households, those with no children have the highest poverty rate, with 10 households (58.8%) experiencing poverty. Likewise, among single-mother households, those with 3 or 4 children have the highest poverty rate, with 5 households (100.0%) falling below the poverty line.
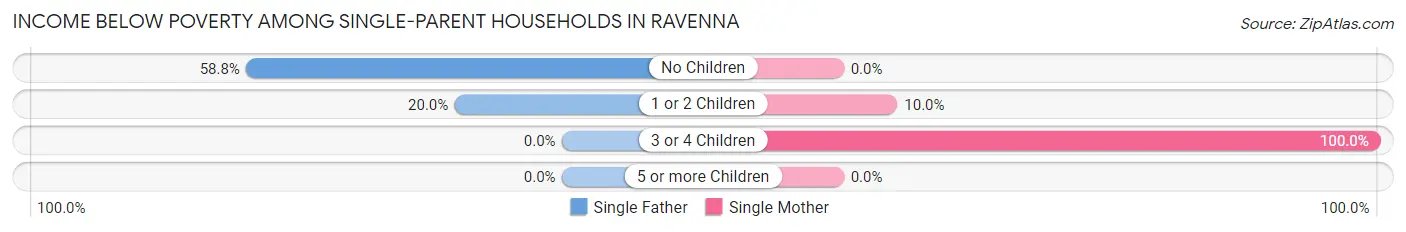
| Children | Single Father | Single Mother |
| No Children | 10 (58.8%) | 0 (0.0%) |
| 1 or 2 Children | 1 (20.0%) | 4 (10.0%) |
| 3 or 4 Children | 0 (0.0%) | 5 (100.0%) |
| 5 or more Children | 0 (0.0%) | 0 (0.0%) |
| Total | 11 (50.0%) | 9 (20.0%) |
Income Below Poverty Among Married-Couple vs Single-Parent Households in Ravenna
The poverty data for Ravenna shows that 14 of the married-couple family households (5.4%) and 20 of the single-parent households (29.8%) are living below the poverty level. Within the married-couple family households, those with 5 or more children have the highest poverty rate, with 8 households (100.0%) falling below the poverty line. Among the single-parent households, those with 3 or 4 children have the highest poverty rate, with 5 household (100.0%) living below poverty.
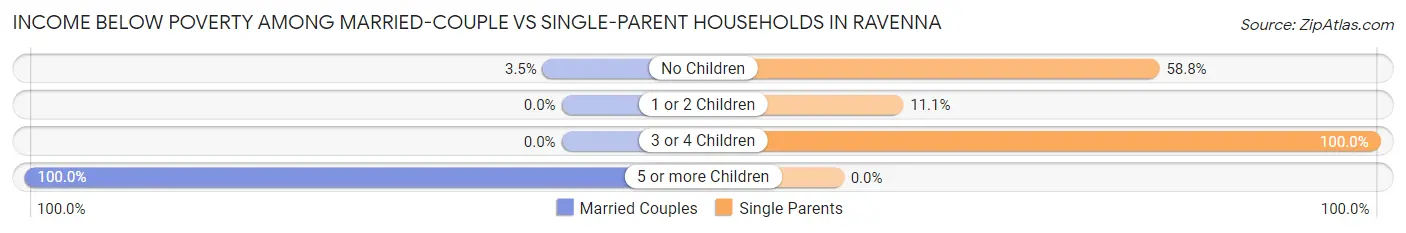
| Children | Married-Couple Families | Single-Parent Households |
| No Children | 6 (3.5%) | 10 (58.8%) |
| 1 or 2 Children | 0 (0.0%) | 5 (11.1%) |
| 3 or 4 Children | 0 (0.0%) | 5 (100.0%) |
| 5 or more Children | 8 (100.0%) | 0 (0.0%) |
| Total | 14 (5.4%) | 20 (29.8%) |
Race in Ravenna
The most populous races in Ravenna are White / Caucasian (1,318 | 93.6%), Hispanic or Latino (57 | 4.1%), and Two or more Races (54 | 3.8%).
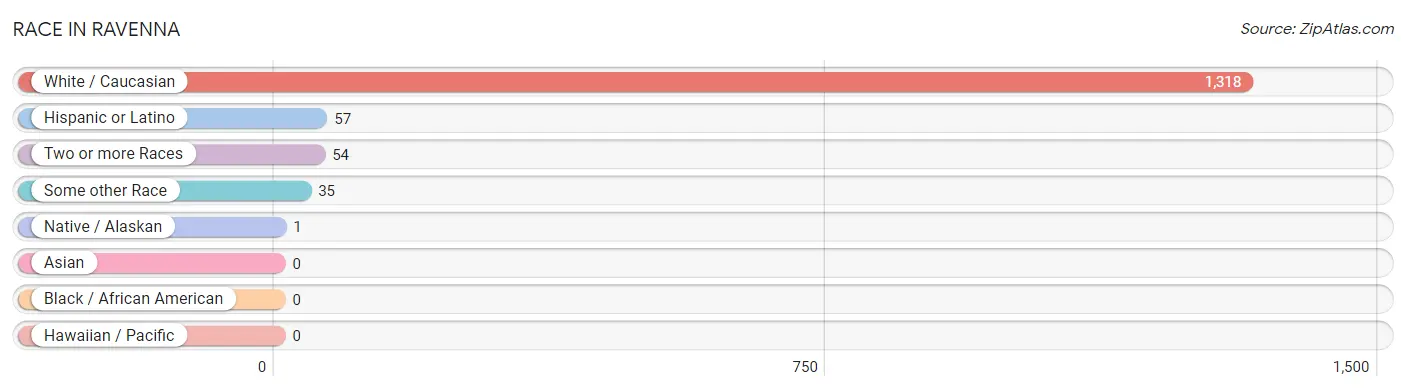
| Race | # Population | % Population |
| Asian | 0 | 0.0% |
| Black / African American | 0 | 0.0% |
| Hawaiian / Pacific | 0 | 0.0% |
| Hispanic or Latino | 57 | 4.1% |
| Native / Alaskan | 1 | 0.1% |
| White / Caucasian | 1,318 | 93.6% |
| Two or more Races | 54 | 3.8% |
| Some other Race | 35 | 2.5% |
| Total | 1,408 | 100.0% |
Ancestry in Ravenna
The most populous ancestries reported in Ravenna are German (632 | 44.9%), Irish (223 | 15.8%), English (126 | 8.9%), Polish (114 | 8.1%), and Norwegian (59 | 4.2%), together accounting for 82.0% of all Ravenna residents.
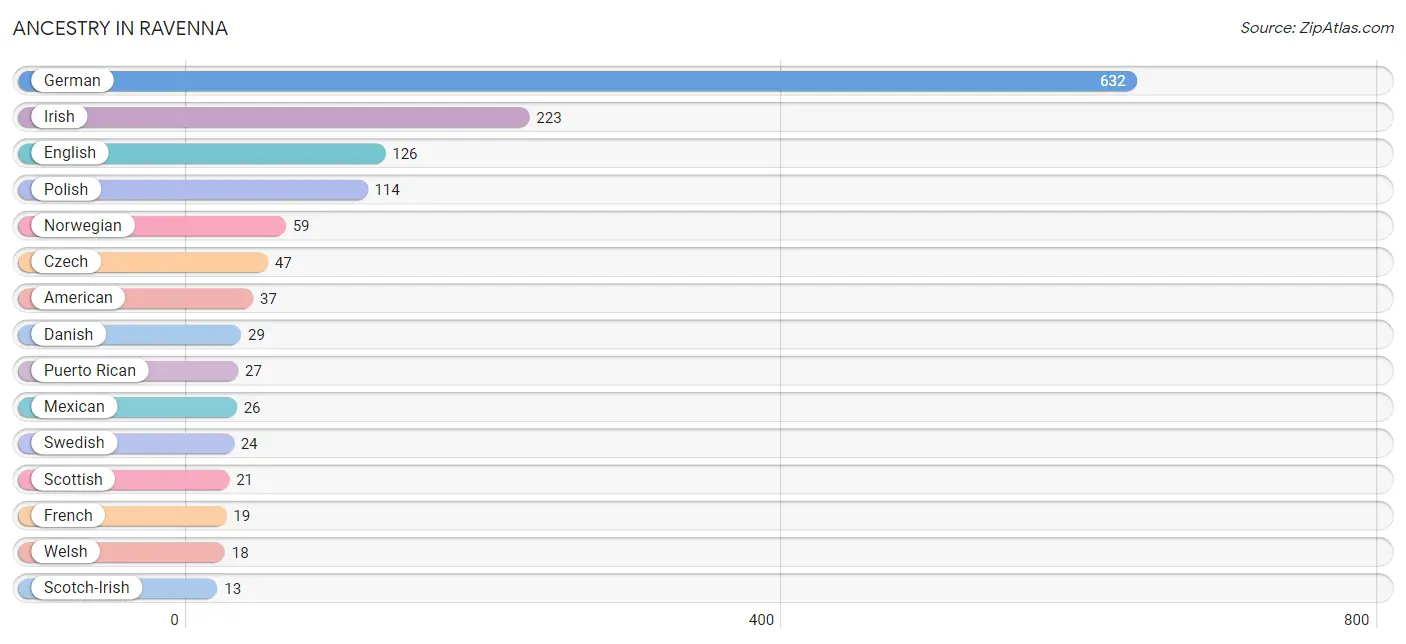
| Ancestry | # Population | % Population |
| American | 37 | 2.6% |
| Austrian | 4 | 0.3% |
| British | 3 | 0.2% |
| Central American | 4 | 0.3% |
| Cherokee | 4 | 0.3% |
| Czech | 47 | 3.3% |
| Czechoslovakian | 2 | 0.1% |
| Danish | 29 | 2.1% |
| Dutch | 7 | 0.5% |
| English | 126 | 8.9% |
| Finnish | 3 | 0.2% |
| French | 19 | 1.3% |
| French Canadian | 5 | 0.4% |
| German | 632 | 44.9% |
| Guatemalan | 4 | 0.3% |
| Irish | 223 | 15.8% |
| Italian | 7 | 0.5% |
| Mexican | 26 | 1.8% |
| Navajo | 1 | 0.1% |
| Norwegian | 59 | 4.2% |
| Paiute | 1 | 0.1% |
| Polish | 114 | 8.1% |
| Puerto Rican | 27 | 1.9% |
| Russian | 5 | 0.4% |
| Scotch-Irish | 13 | 0.9% |
| Scottish | 21 | 1.5% |
| Swedish | 24 | 1.7% |
| Ukrainian | 3 | 0.2% |
| Welsh | 18 | 1.3% | View All 29 Rows |
Immigrants in Ravenna
The most numerous immigrant groups reported in Ravenna came from Europe (7 | 0.5%), Asia (5 | 0.4%), Syria (5 | 0.4%), Western Asia (5 | 0.4%), and Southern Europe (4 | 0.3%), together accounting for 1.9% of all Ravenna residents.
| Immigration Origin | # Population | % Population |
| Asia | 5 | 0.4% |
| Eastern Europe | 3 | 0.2% |
| Europe | 7 | 0.5% |
| Southern Europe | 4 | 0.3% |
| Spain | 4 | 0.3% |
| Syria | 5 | 0.4% |
| Ukraine | 3 | 0.2% |
| Western Asia | 5 | 0.4% | View All 8 Rows |
Sex and Age in Ravenna
Sex and Age in Ravenna
The most populous age groups in Ravenna are 45 to 49 Years (93 | 12.5%) for men and 50 to 54 Years (72 | 10.8%) for women.
| Age Bracket | Male | Female |
| Under 5 Years | 25 (3.4%) | 37 (5.6%) |
| 5 to 9 Years | 27 (3.6%) | 40 (6.0%) |
| 10 to 14 Years | 44 (5.9%) | 41 (6.2%) |
| 15 to 19 Years | 77 (10.4%) | 19 (2.9%) |
| 20 to 24 Years | 44 (5.9%) | 51 (7.7%) |
| 25 to 29 Years | 46 (6.2%) | 32 (4.8%) |
| 30 to 34 Years | 51 (6.9%) | 56 (8.4%) |
| 35 to 39 Years | 53 (7.1%) | 47 (7.1%) |
| 40 to 44 Years | 22 (3.0%) | 31 (4.7%) |
| 45 to 49 Years | 93 (12.5%) | 44 (6.6%) |
| 50 to 54 Years | 34 (4.6%) | 72 (10.8%) |
| 55 to 59 Years | 49 (6.6%) | 23 (3.5%) |
| 60 to 64 Years | 34 (4.6%) | 41 (6.2%) |
| 65 to 69 Years | 33 (4.4%) | 42 (6.3%) |
| 70 to 74 Years | 20 (2.7%) | 16 (2.4%) |
| 75 to 79 Years | 33 (4.4%) | 22 (3.3%) |
| 80 to 84 Years | 30 (4.0%) | 22 (3.3%) |
| 85 Years and over | 28 (3.8%) | 29 (4.4%) |
| Total | 743 (100.0%) | 665 (100.0%) |
Families and Households in Ravenna
Median Family Size in Ravenna
The median family size in Ravenna is 3.00 persons per family, with married-couple families (261 | 79.6%) accounting for the largest median family size of 3.02 persons per family. On the other hand, single male/father families (22 | 6.7%) represent the smallest median family size with 2.73 persons per family.
| Family Type | # Families | Family Size |
| Married-Couple | 261 (79.6%) | 3.02 |
| Single Male/Father | 22 (6.7%) | 2.73 |
| Single Female/Mother | 45 (13.7%) | 3.02 |
| Total Families | 328 (100.0%) | 3.00 |
Median Household Size in Ravenna
The median household size in Ravenna is 2.34 persons per household, with single female/mother households (45 | 7.7%) accounting for the largest median household size of 3.96 persons per household. non-family households (257 | 43.9%) represent the smallest median household size with 1.28 persons per household.
| Household Type | # Households | Household Size |
| Married-Couple | 261 (44.6%) | 3.04 |
| Single Male/Father | 22 (3.8%) | 3.05 |
| Single Female/Mother | 45 (7.7%) | 3.96 |
| Non-family | 257 (43.9%) | 1.28 |
| Total Households | 585 (100.0%) | 2.34 |
Household Size by Marriage Status in Ravenna
Out of a total of 585 households in Ravenna, 328 (56.1%) are family households, while 257 (43.9%) are nonfamily households. The most numerous type of family households are 2-person households, comprising 131, and the most common type of nonfamily households are 1-person households, comprising 210.
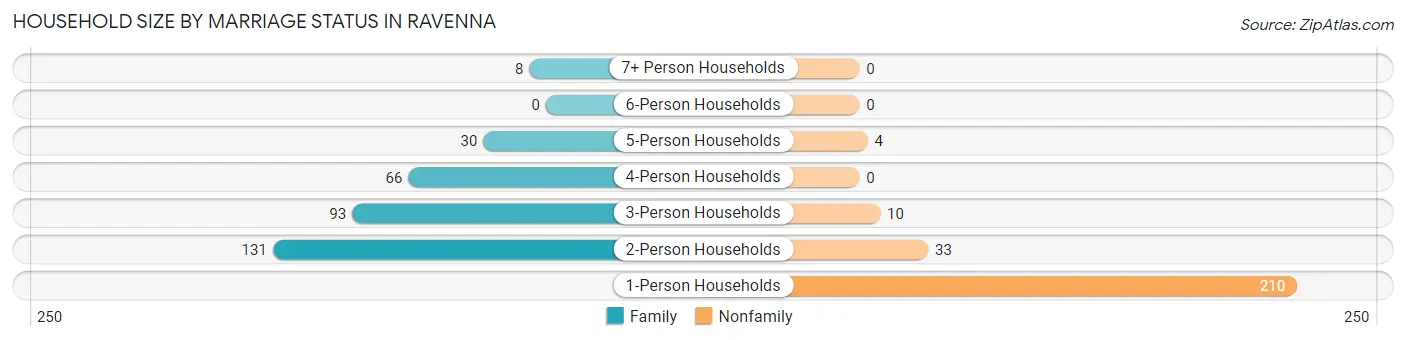
| Household Size | Family Households | Nonfamily Households |
| 1-Person Households | - | 210 (35.9%) |
| 2-Person Households | 131 (22.4%) | 33 (5.6%) |
| 3-Person Households | 93 (15.9%) | 10 (1.7%) |
| 4-Person Households | 66 (11.3%) | 0 (0.0%) |
| 5-Person Households | 30 (5.1%) | 4 (0.7%) |
| 6-Person Households | 0 (0.0%) | 0 (0.0%) |
| 7+ Person Households | 8 (1.4%) | 0 (0.0%) |
| Total | 328 (56.1%) | 257 (43.9%) |
Female Fertility in Ravenna
Fertility by Age in Ravenna
Average fertility rate in Ravenna is 24.0 births per 1,000 women. Women in the age bracket of 20 to 34 years have the highest fertility rate with 50.0 births per 1,000 women. Women in the age bracket of 20 to 34 years acount for 100.0% of all women with births.
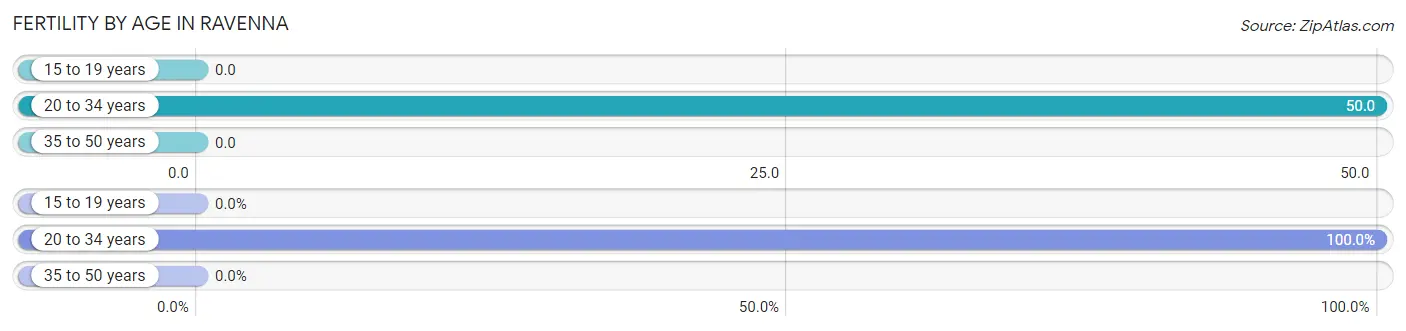
| Age Bracket | Women with Births | Births / 1,000 Women |
| 15 to 19 years | 0 (0.0%) | 0.0 |
| 20 to 34 years | 7 (100.0%) | 50.0 |
| 35 to 50 years | 0 (0.0%) | 0.0 |
| Total | 7 (100.0%) | 24.0 |
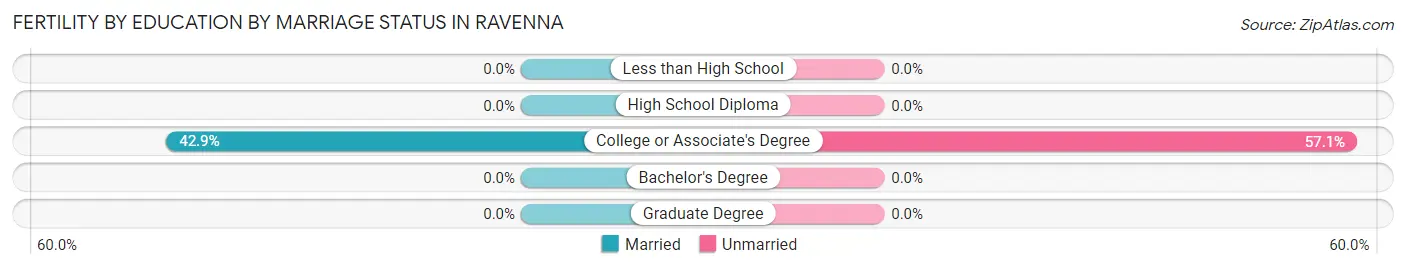
Fertility by Age by Marriage Status in Ravenna
42.9% of women with births (7) in Ravenna are married. The highest percentage of unmarried women with births falls into 20 to 34 years age bracket with 57.1% of them unmarried at the time of birth, while the lowest percentage of unmarried women with births belong to 20 to 34 years age bracket with 57.1% of them unmarried.
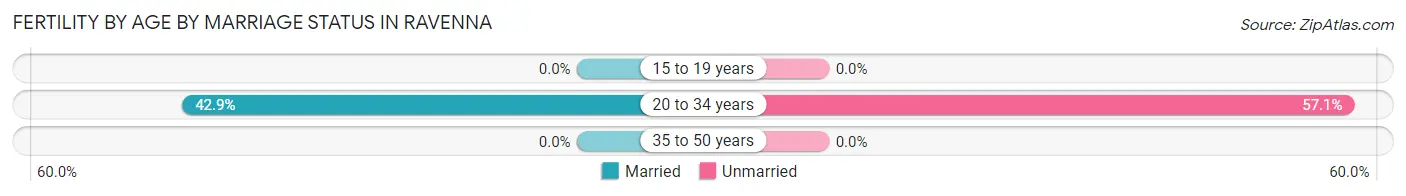
| Age Bracket | Married | Unmarried |
| 15 to 19 years | 0 (0.0%) | 0 (0.0%) |
| 20 to 34 years | 3 (42.9%) | 4 (57.1%) |
| 35 to 50 years | 0 (0.0%) | 0 (0.0%) |
| Total | 3 (42.9%) | 4 (57.1%) |
Fertility by Education in Ravenna
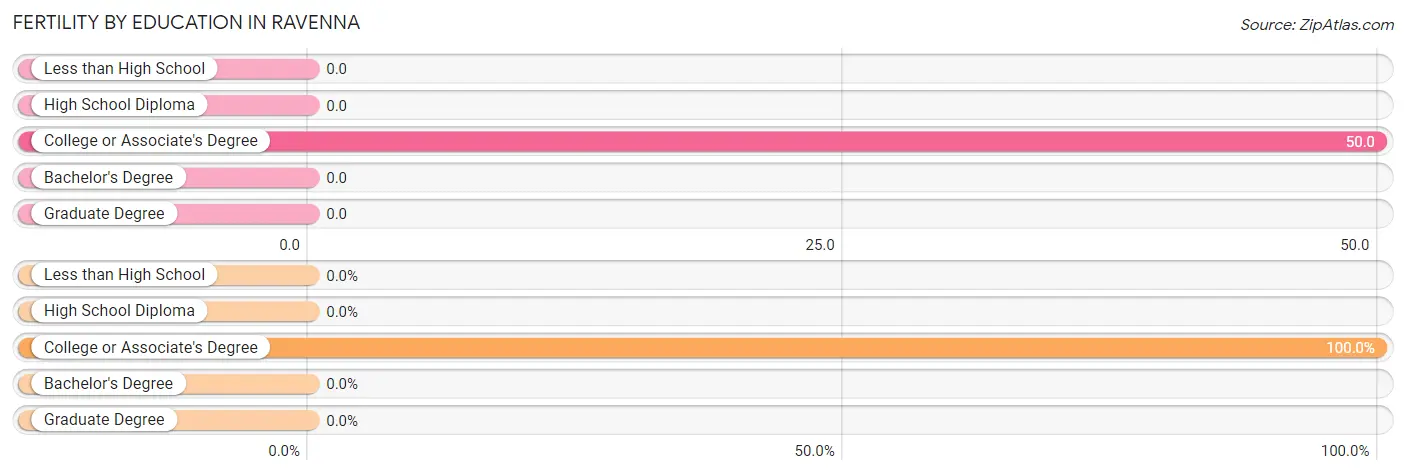
| Educational Attainment | Women with Births | Births / 1,000 Women |
| Less than High School | 0 (0.0%) | 0.0 |
| High School Diploma | 0 (0.0%) | 0.0 |
| College or Associate's Degree | 7 (100.0%) | 50.0 |
| Bachelor's Degree | 0 (0.0%) | 0.0 |
| Graduate Degree | 0 (0.0%) | 0.0 |
| Total | 7 (100.0%) | 24.0 |
Fertility by Education by Marriage Status in Ravenna
57.1% of women with births in Ravenna are unmarried. Women with the educational attainment of college or associate's degree are most likely to be married with 42.9% of them married at childbirth, while women with the educational attainment of college or associate's degree are least likely to be married with 57.1% of them unmarried at childbirth.
| Educational Attainment | Married | Unmarried |
| Less than High School | 0 (0.0%) | 0 (0.0%) |
| High School Diploma | 0 (0.0%) | 0 (0.0%) |
| College or Associate's Degree | 3 (42.9%) | 4 (57.1%) |
| Bachelor's Degree | 0 (0.0%) | 0 (0.0%) |
| Graduate Degree | 0 (0.0%) | 0 (0.0%) |
| Total | 3 (42.9%) | 4 (57.1%) |
Employment Characteristics in Ravenna
Employment by Class of Employer in Ravenna
Among the 725 employed individuals in Ravenna, private company employees (474 | 65.4%), local government employees (78 | 10.8%), and self-employed (not incorporated) (56 | 7.7%) make up the most common classes of employment.
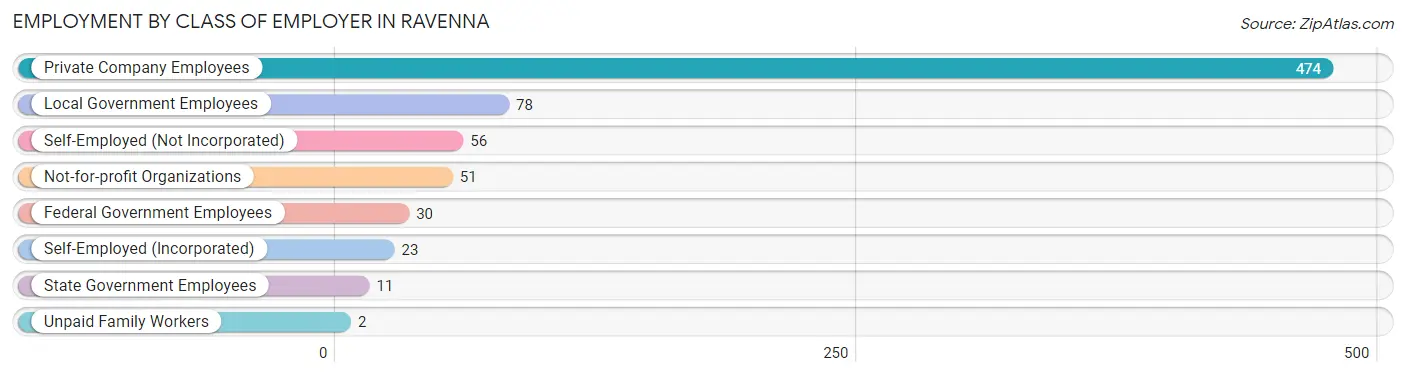
| Employer Class | # Employees | % Employees |
| Private Company Employees | 474 | 65.4% |
| Self-Employed (Incorporated) | 23 | 3.2% |
| Self-Employed (Not Incorporated) | 56 | 7.7% |
| Not-for-profit Organizations | 51 | 7.0% |
| Local Government Employees | 78 | 10.8% |
| State Government Employees | 11 | 1.5% |
| Federal Government Employees | 30 | 4.1% |
| Unpaid Family Workers | 2 | 0.3% |
| Total | 725 | 100.0% |
Employment Status by Age in Ravenna
According to the labor force statistics for Ravenna, out of the total population over 16 years of age (1,183), 64.5% or 763 individuals are in the labor force, with 2.8% or 21 of them unemployed. The age group with the highest labor force participation rate is 45 to 54 years, with 94.7% or 230 individuals in the labor force. Within the labor force, the 35 to 44 years age range has the highest percentage of unemployed individuals, with 12.9% or 18 of them being unemployed.
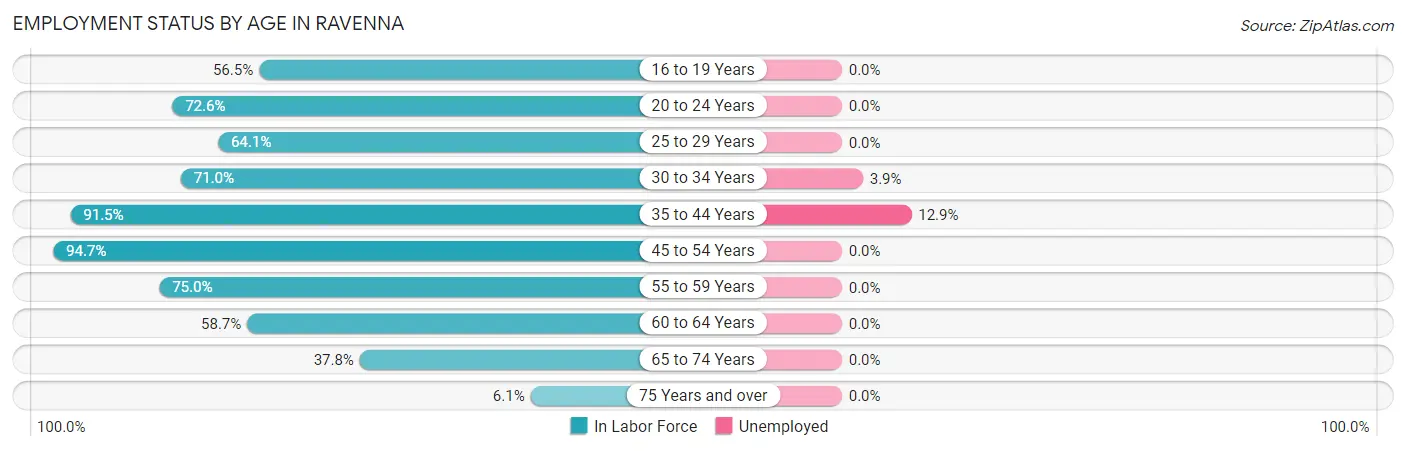
| Age Bracket | In Labor Force | Unemployed |
| 16 to 19 Years | 48 (56.5%) | 0 (0.0%) |
| 20 to 24 Years | 69 (72.6%) | 0 (0.0%) |
| 25 to 29 Years | 50 (64.1%) | 0 (0.0%) |
| 30 to 34 Years | 76 (71.0%) | 3 (3.9%) |
| 35 to 44 Years | 140 (91.5%) | 18 (12.9%) |
| 45 to 54 Years | 230 (94.7%) | 0 (0.0%) |
| 55 to 59 Years | 54 (75.0%) | 0 (0.0%) |
| 60 to 64 Years | 44 (58.7%) | 0 (0.0%) |
| 65 to 74 Years | 42 (37.8%) | 0 (0.0%) |
| 75 Years and over | 10 (6.1%) | 0 (0.0%) |
| Total | 763 (64.5%) | 21 (2.8%) |
Employment Status by Educational Attainment in Ravenna
According to labor force statistics for Ravenna, 81.6% of individuals (594) out of the total population between 25 and 64 years of age (728) are in the labor force, with 3.5% or 21 of them being unemployed. The group with the highest labor force participation rate are those with the educational attainment of bachelor's degree or higher, with 90.2% or 101 individuals in the labor force. Within the labor force, individuals with less than high school education have the highest percentage of unemployment, with 22.4% or 11 of them being unemployed.
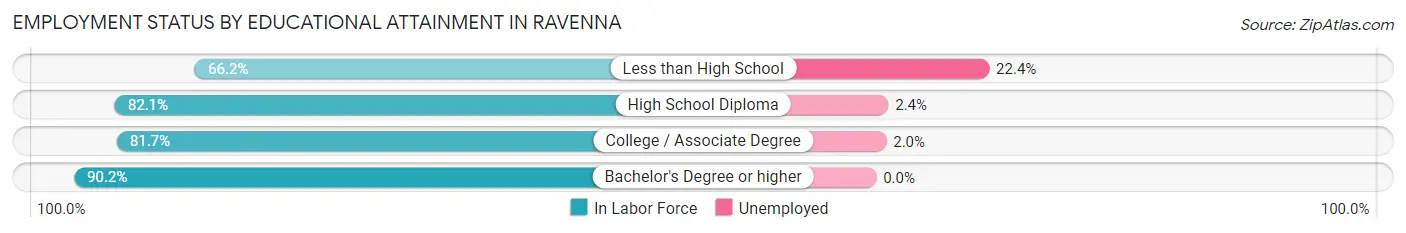
| Educational Attainment | In Labor Force | Unemployed |
| Less than High School | 49 (66.2%) | 17 (22.4%) |
| High School Diploma | 248 (82.1%) | 7 (2.4%) |
| College / Associate Degree | 196 (81.7%) | 5 (2.0%) |
| Bachelor's Degree or higher | 101 (90.2%) | 0 (0.0%) |
| Total | 594 (81.6%) | 25 (3.5%) |
Employment Occupations by Sex in Ravenna
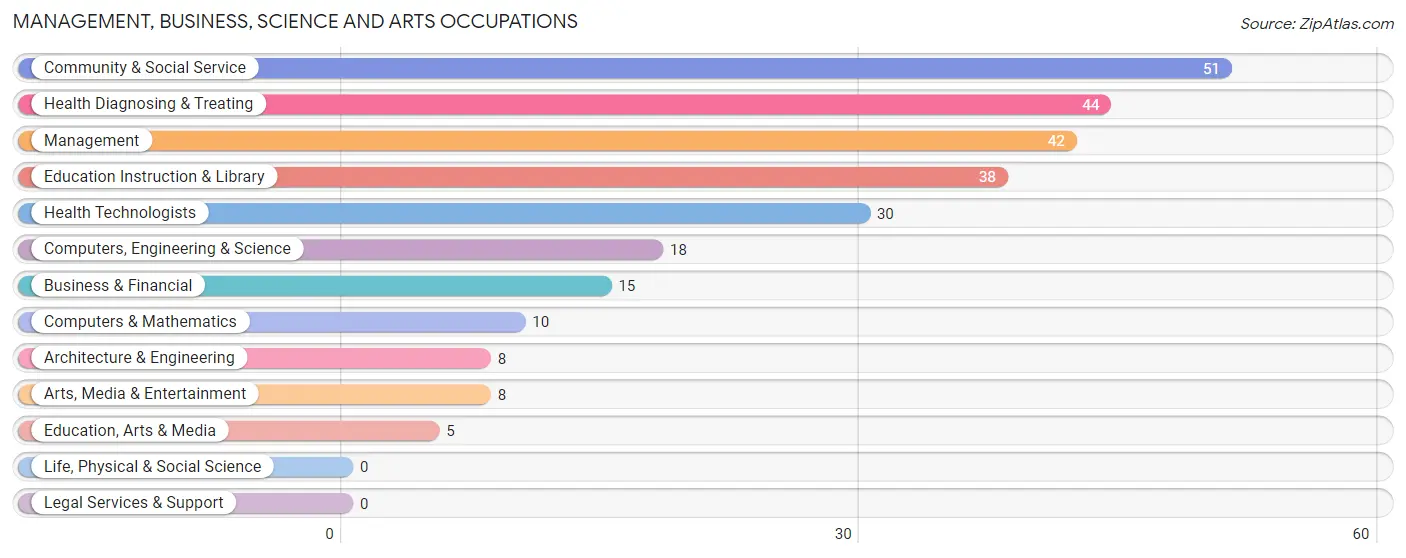
Management, Business, Science and Arts Occupations
The most common Management, Business, Science and Arts occupations in Ravenna are Community & Social Service (51 | 6.9%), Health Diagnosing & Treating (44 | 5.9%), Management (42 | 5.7%), Education Instruction & Library (38 | 5.1%), and Health Technologists (30 | 4.0%).
Management, Business, Science and Arts Occupations by Sex
Within the Management, Business, Science and Arts occupations in Ravenna, the most male-oriented occupations are Computers & Mathematics (100.0%), Management (90.5%), and Computers, Engineering & Science (77.8%), while the most female-oriented occupations are Education, Arts & Media (100.0%), Education Instruction & Library (100.0%), and Health Diagnosing & Treating (100.0%).
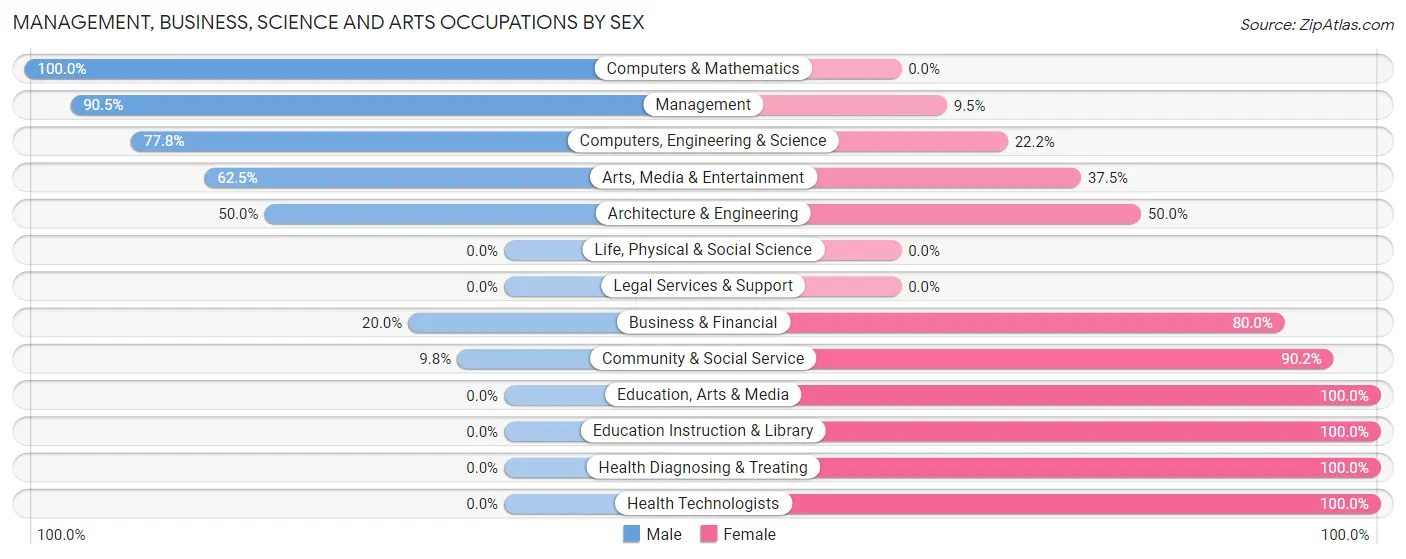
| Occupation | Male | Female |
| Management | 38 (90.5%) | 4 (9.5%) |
| Business & Financial | 3 (20.0%) | 12 (80.0%) |
| Computers, Engineering & Science | 14 (77.8%) | 4 (22.2%) |
| Computers & Mathematics | 10 (100.0%) | 0 (0.0%) |
| Architecture & Engineering | 4 (50.0%) | 4 (50.0%) |
| Life, Physical & Social Science | 0 (0.0%) | 0 (0.0%) |
| Community & Social Service | 5 (9.8%) | 46 (90.2%) |
| Education, Arts & Media | 0 (0.0%) | 5 (100.0%) |
| Legal Services & Support | 0 (0.0%) | 0 (0.0%) |
| Education Instruction & Library | 0 (0.0%) | 38 (100.0%) |
| Arts, Media & Entertainment | 5 (62.5%) | 3 (37.5%) |
| Health Diagnosing & Treating | 0 (0.0%) | 44 (100.0%) |
| Health Technologists | 0 (0.0%) | 30 (100.0%) |
| Total (Category) | 60 (35.3%) | 110 (64.7%) |
| Total (Overall) | 384 (51.7%) | 358 (48.2%) |
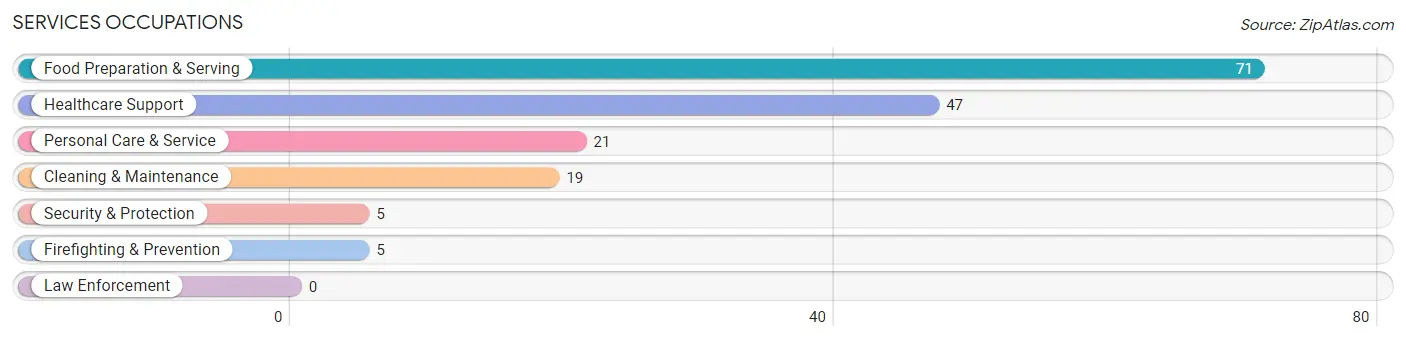
Services Occupations
The most common Services occupations in Ravenna are Food Preparation & Serving (71 | 9.6%), Healthcare Support (47 | 6.3%), Personal Care & Service (21 | 2.8%), Cleaning & Maintenance (19 | 2.6%), and Security & Protection (5 | 0.7%).
Services Occupations by Sex
Within the Services occupations in Ravenna, the most male-oriented occupations are Security & Protection (100.0%), Firefighting & Prevention (100.0%), and Cleaning & Maintenance (63.2%), while the most female-oriented occupations are Healthcare Support (83.0%), Personal Care & Service (57.1%), and Food Preparation & Serving (40.8%).
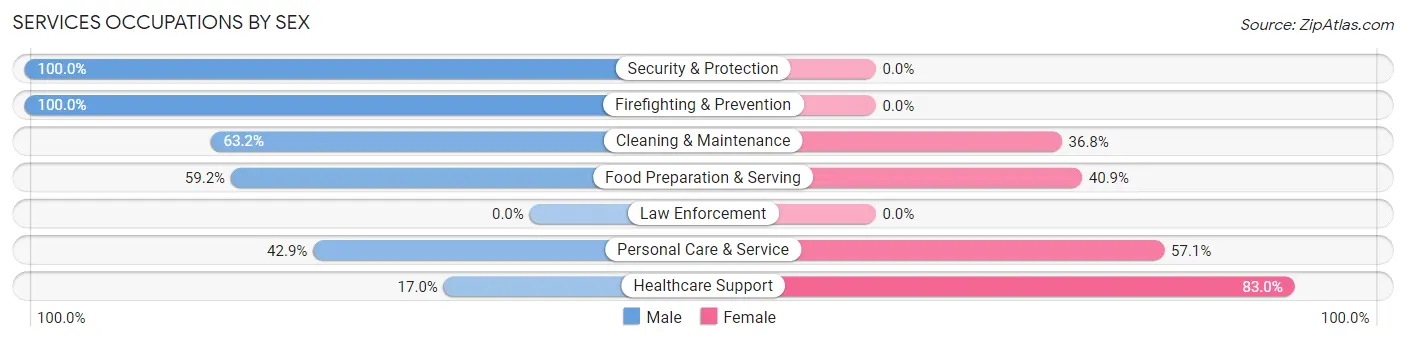
| Occupation | Male | Female |
| Healthcare Support | 8 (17.0%) | 39 (83.0%) |
| Security & Protection | 5 (100.0%) | 0 (0.0%) |
| Firefighting & Prevention | 5 (100.0%) | 0 (0.0%) |
| Law Enforcement | 0 (0.0%) | 0 (0.0%) |
| Food Preparation & Serving | 42 (59.2%) | 29 (40.8%) |
| Cleaning & Maintenance | 12 (63.2%) | 7 (36.8%) |
| Personal Care & Service | 9 (42.9%) | 12 (57.1%) |
| Total (Category) | 76 (46.6%) | 87 (53.4%) |
| Total (Overall) | 384 (51.7%) | 358 (48.2%) |
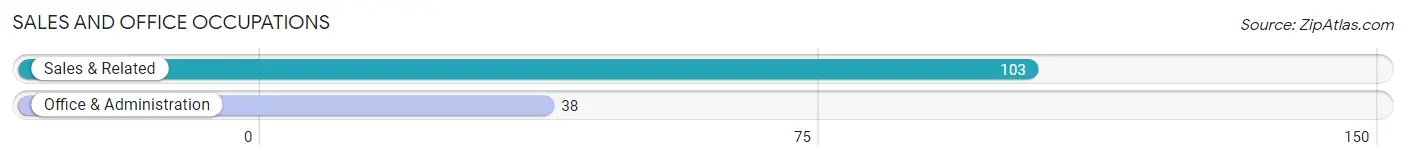
Sales and Office Occupations
The most common Sales and Office occupations in Ravenna are Sales & Related (103 | 13.9%), and Office & Administration (38 | 5.1%).
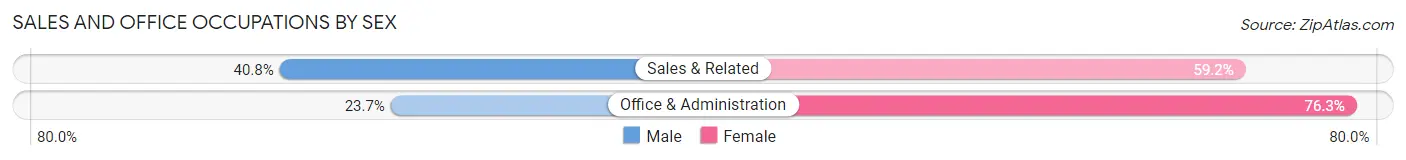
Sales and Office Occupations by Sex
| Occupation | Male | Female |
| Sales & Related | 42 (40.8%) | 61 (59.2%) |
| Office & Administration | 9 (23.7%) | 29 (76.3%) |
| Total (Category) | 51 (36.2%) | 90 (63.8%) |
| Total (Overall) | 384 (51.7%) | 358 (48.2%) |
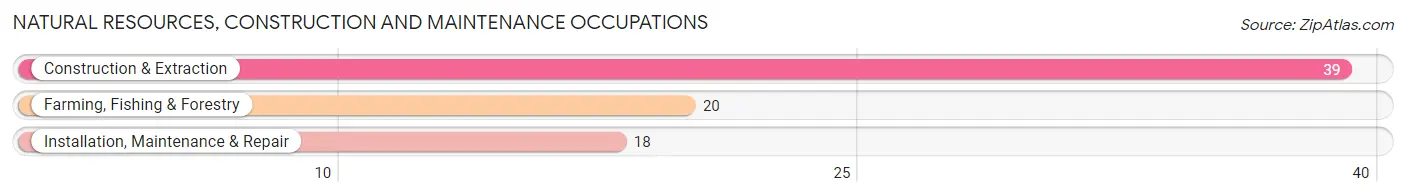
Natural Resources, Construction and Maintenance Occupations
The most common Natural Resources, Construction and Maintenance occupations in Ravenna are Construction & Extraction (39 | 5.3%), Farming, Fishing & Forestry (20 | 2.7%), and Installation, Maintenance & Repair (18 | 2.4%).
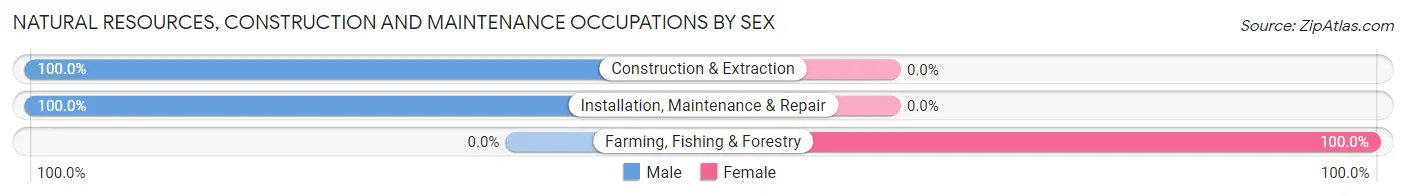
Natural Resources, Construction and Maintenance Occupations by Sex
| Occupation | Male | Female |
| Farming, Fishing & Forestry | 0 (0.0%) | 20 (100.0%) |
| Construction & Extraction | 39 (100.0%) | 0 (0.0%) |
| Installation, Maintenance & Repair | 18 (100.0%) | 0 (0.0%) |
| Total (Category) | 57 (74.0%) | 20 (26.0%) |
| Total (Overall) | 384 (51.7%) | 358 (48.2%) |
Production, Transportation and Moving Occupations
The most common Production, Transportation and Moving occupations in Ravenna are Material Moving (79 | 10.6%), Production (65 | 8.8%), and Transportation (47 | 6.3%).
Production, Transportation and Moving Occupations by Sex
| Occupation | Male | Female |
| Production | 46 (70.8%) | 19 (29.2%) |
| Transportation | 36 (76.6%) | 11 (23.4%) |
| Material Moving | 58 (73.4%) | 21 (26.6%) |
| Total (Category) | 140 (73.3%) | 51 (26.7%) |
| Total (Overall) | 384 (51.7%) | 358 (48.2%) |
Employment Industries by Sex in Ravenna
Employment Industries in Ravenna
The major employment industries in Ravenna include Health Care & Social Assistance (133 | 17.9%), Manufacturing (105 | 14.1%), Retail Trade (76 | 10.2%), Educational Services (64 | 8.6%), and Construction (62 | 8.4%).
Employment Industries by Sex in Ravenna
The Ravenna industries that see more men than women are Mining, Quarrying, & Extraction (100.0%), Construction (100.0%), and Wholesale Trade (90.2%), whereas the industries that tend to have a higher number of women are Professional & Scientific (100.0%), Administrative & Support (100.0%), and Accommodation & Food Services (100.0%).
| Industry | Male | Female |
| Agriculture, Fishing & Hunting | 22 (47.8%) | 24 (52.2%) |
| Mining, Quarrying, & Extraction | 11 (100.0%) | 0 (0.0%) |
| Construction | 62 (100.0%) | 0 (0.0%) |
| Manufacturing | 84 (80.0%) | 21 (20.0%) |
| Wholesale Trade | 46 (90.2%) | 5 (9.8%) |
| Retail Trade | 23 (30.3%) | 53 (69.7%) |
| Transportation & Warehousing | 24 (44.4%) | 30 (55.6%) |
| Utilities | 0 (0.0%) | 0 (0.0%) |
| Information | 0 (0.0%) | 0 (0.0%) |
| Finance & Insurance | 4 (36.4%) | 7 (63.6%) |
| Real Estate, Rental & Leasing | 7 (70.0%) | 3 (30.0%) |
| Professional & Scientific | 0 (0.0%) | 3 (100.0%) |
| Enterprise Management | 0 (0.0%) | 0 (0.0%) |
| Administrative & Support | 0 (0.0%) | 3 (100.0%) |
| Educational Services | 14 (21.9%) | 50 (78.1%) |
| Health Care & Social Assistance | 41 (30.8%) | 92 (69.2%) |
| Arts, Entertainment & Recreation | 12 (54.5%) | 10 (45.5%) |
| Accommodation & Food Services | 0 (0.0%) | 16 (100.0%) |
| Public Administration | 9 (81.8%) | 2 (18.2%) |
| Total | 384 (51.7%) | 358 (48.2%) |
Education in Ravenna
School Enrollment in Ravenna
The most common levels of schooling among the 323 students in Ravenna are high school (132 | 40.9%), middle school (66 | 20.4%), and elementary school (59 | 18.3%).
| School Level | # Students | % Students |
| Nursery / Preschool | 23 | 7.1% |
| Kindergarten | 15 | 4.6% |
| Elementary School | 59 | 18.3% |
| Middle School | 66 | 20.4% |
| High School | 132 | 40.9% |
| College / Undergraduate | 22 | 6.8% |
| Graduate / Professional | 6 | 1.9% |
| Total | 323 | 100.0% |
School Enrollment by Age by Funding Source in Ravenna
Out of a total of 323 students who are enrolled in schools in Ravenna, 10 (3.1%) attend a private institution, while the remaining 313 (96.9%) are enrolled in public schools. The age group of 15 to 17 year olds has the highest likelihood of being enrolled in private schools, with 4 (5.1% in the age bracket) enrolled. Conversely, the age group of 3 to 4 year olds has the lowest likelihood of being enrolled in a private school, with 23 (100.0% in the age bracket) attending a public institution.
| Age Bracket | Public School | Private School |
| 3 to 4 Year Olds | 23 (100.0%) | 0 (0.0%) |
| 5 to 9 Year Old | 59 (95.2%) | 3 (4.8%) |
| 10 to 14 Year Olds | 82 (96.5%) | 3 (3.5%) |
| 15 to 17 Year Olds | 75 (94.9%) | 4 (5.1%) |
| 18 to 19 Year Olds | 14 (100.0%) | 0 (0.0%) |
| 20 to 24 Year Olds | 18 (100.0%) | 0 (0.0%) |
| 25 to 34 Year Olds | 10 (100.0%) | 0 (0.0%) |
| 35 Years and over | 32 (100.0%) | 0 (0.0%) |
| Total | 313 (96.9%) | 10 (3.1%) |
Educational Attainment by Field of Study in Ravenna
Education (37 | 24.8%), business (31 | 20.8%), science & technology (20 | 13.4%), arts & humanities (20 | 13.4%), and psychology (10 | 6.7%) are the most common fields of study among 149 individuals in Ravenna who have obtained a bachelor's degree or higher.
| Field of Study | # Graduates | % Graduates |
| Computers & Mathematics | 6 | 4.0% |
| Bio, Nature & Agricultural | 6 | 4.0% |
| Physical & Health Sciences | 3 | 2.0% |
| Psychology | 10 | 6.7% |
| Social Sciences | 2 | 1.3% |
| Engineering | 0 | 0.0% |
| Multidisciplinary Studies | 0 | 0.0% |
| Science & Technology | 20 | 13.4% |
| Business | 31 | 20.8% |
| Education | 37 | 24.8% |
| Literature & Languages | 10 | 6.7% |
| Liberal Arts & History | 0 | 0.0% |
| Visual & Performing Arts | 0 | 0.0% |
| Communications | 4 | 2.7% |
| Arts & Humanities | 20 | 13.4% |
| Total | 149 | 100.0% |
Transportation & Commute in Ravenna
Vehicle Availability by Sex in Ravenna
The most prevalent vehicle ownership categories in Ravenna are males with 2 vehicles (106, accounting for 28.8%) and females with 2 vehicles (127, making up 29.7%).
| Vehicles Available | Male | Female |
| No Vehicle | 4 (1.1%) | 0 (0.0%) |
| 1 Vehicle | 54 (14.7%) | 88 (24.6%) |
| 2 Vehicles | 106 (28.8%) | 127 (35.6%) |
| 3 Vehicles | 86 (23.4%) | 80 (22.4%) |
| 4 Vehicles | 97 (26.4%) | 42 (11.8%) |
| 5 or more Vehicles | 21 (5.7%) | 20 (5.6%) |
| Total | 368 (100.0%) | 357 (100.0%) |
Commute Time in Ravenna
The most frequently occuring commute durations in Ravenna are 5 to 9 minutes (144 commuters, 20.4%), less than 5 minutes (131 commuters, 18.6%), and 30 to 34 minutes (98 commuters, 13.9%).
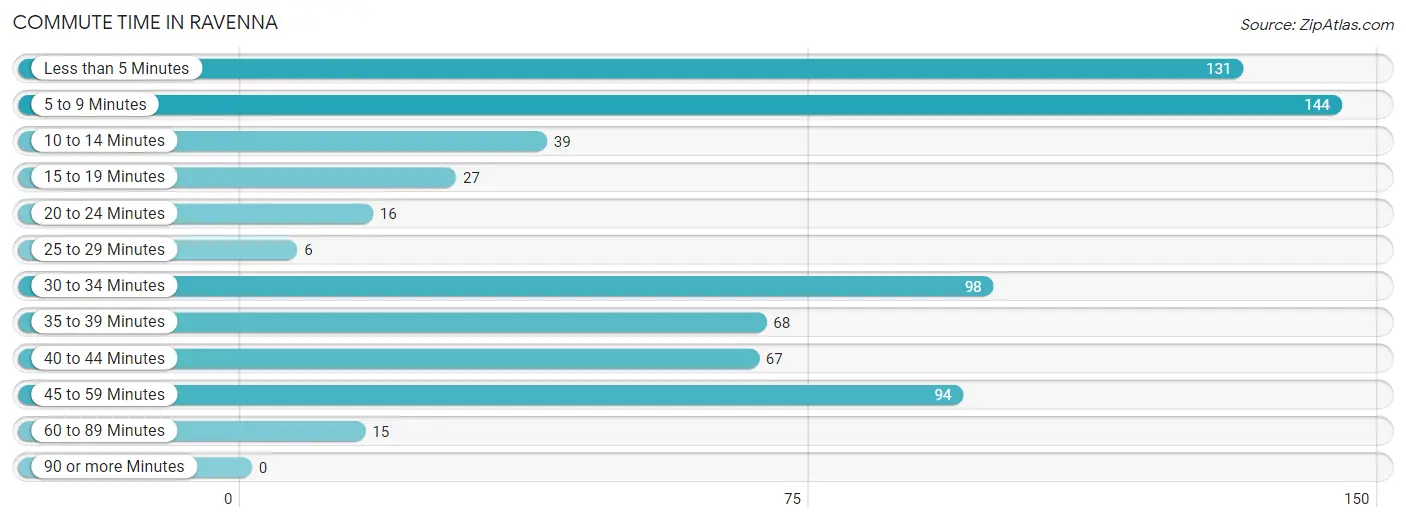
| Commute Time | # Commuters | % Commuters |
| Less than 5 Minutes | 131 | 18.6% |
| 5 to 9 Minutes | 144 | 20.4% |
| 10 to 14 Minutes | 39 | 5.5% |
| 15 to 19 Minutes | 27 | 3.8% |
| 20 to 24 Minutes | 16 | 2.3% |
| 25 to 29 Minutes | 6 | 0.9% |
| 30 to 34 Minutes | 98 | 13.9% |
| 35 to 39 Minutes | 68 | 9.7% |
| 40 to 44 Minutes | 67 | 9.5% |
| 45 to 59 Minutes | 94 | 13.3% |
| 60 to 89 Minutes | 15 | 2.1% |
| 90 or more Minutes | 0 | 0.0% |
Commute Time by Sex in Ravenna
The most common commute times in Ravenna are 5 to 9 minutes (69 commuters, 19.5%) for males and less than 5 minutes (77 commuters, 21.9%) for females.
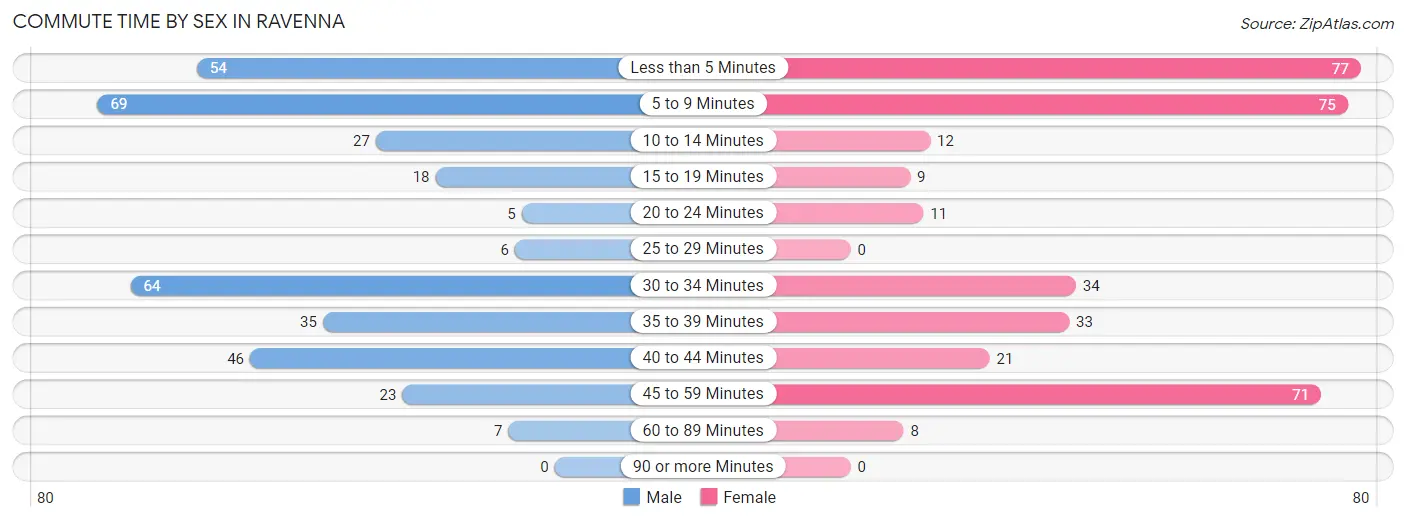
| Commute Time | Male | Female |
| Less than 5 Minutes | 54 (15.2%) | 77 (21.9%) |
| 5 to 9 Minutes | 69 (19.5%) | 75 (21.4%) |
| 10 to 14 Minutes | 27 (7.6%) | 12 (3.4%) |
| 15 to 19 Minutes | 18 (5.1%) | 9 (2.6%) |
| 20 to 24 Minutes | 5 (1.4%) | 11 (3.1%) |
| 25 to 29 Minutes | 6 (1.7%) | 0 (0.0%) |
| 30 to 34 Minutes | 64 (18.1%) | 34 (9.7%) |
| 35 to 39 Minutes | 35 (9.9%) | 33 (9.4%) |
| 40 to 44 Minutes | 46 (13.0%) | 21 (6.0%) |
| 45 to 59 Minutes | 23 (6.5%) | 71 (20.2%) |
| 60 to 89 Minutes | 7 (2.0%) | 8 (2.3%) |
| 90 or more Minutes | 0 (0.0%) | 0 (0.0%) |
Time of Departure to Work by Sex in Ravenna
The most frequent times of departure to work in Ravenna are 6:00 AM to 6:29 AM (65, 18.4%) for males and 7:30 AM to 7:59 AM (63, 17.9%) for females.
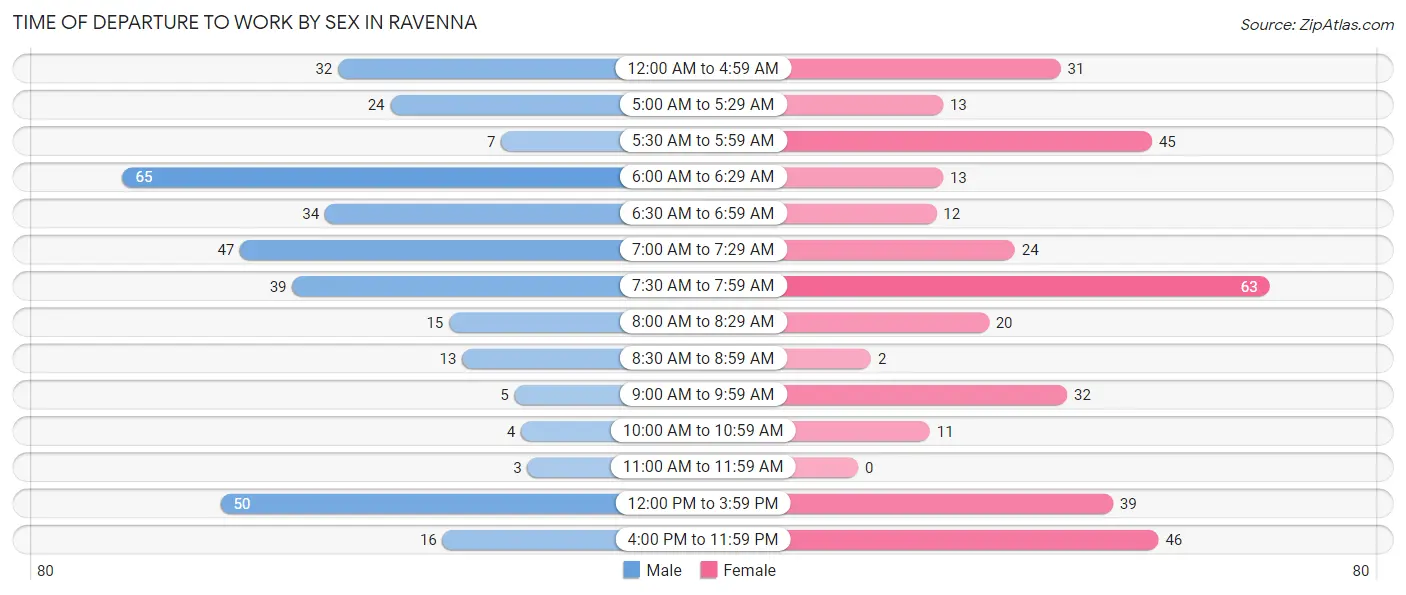
| Time of Departure | Male | Female |
| 12:00 AM to 4:59 AM | 32 (9.0%) | 31 (8.8%) |
| 5:00 AM to 5:29 AM | 24 (6.8%) | 13 (3.7%) |
| 5:30 AM to 5:59 AM | 7 (2.0%) | 45 (12.8%) |
| 6:00 AM to 6:29 AM | 65 (18.4%) | 13 (3.7%) |
| 6:30 AM to 6:59 AM | 34 (9.6%) | 12 (3.4%) |
| 7:00 AM to 7:29 AM | 47 (13.3%) | 24 (6.8%) |
| 7:30 AM to 7:59 AM | 39 (11.0%) | 63 (17.9%) |
| 8:00 AM to 8:29 AM | 15 (4.2%) | 20 (5.7%) |
| 8:30 AM to 8:59 AM | 13 (3.7%) | 2 (0.6%) |
| 9:00 AM to 9:59 AM | 5 (1.4%) | 32 (9.1%) |
| 10:00 AM to 10:59 AM | 4 (1.1%) | 11 (3.1%) |
| 11:00 AM to 11:59 AM | 3 (0.9%) | 0 (0.0%) |
| 12:00 PM to 3:59 PM | 50 (14.1%) | 39 (11.1%) |
| 4:00 PM to 11:59 PM | 16 (4.5%) | 46 (13.1%) |
| Total | 354 (100.0%) | 351 (100.0%) |
Housing Occupancy in Ravenna
Occupancy by Ownership in Ravenna
Of the total 585 dwellings in Ravenna, owner-occupied units account for 358 (61.2%), while renter-occupied units make up 227 (38.8%).
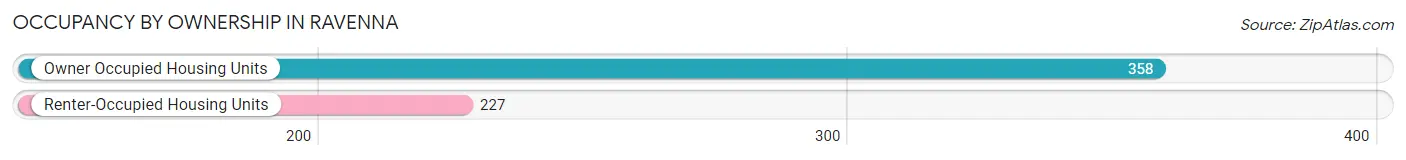
| Occupancy | # Housing Units | % Housing Units |
| Owner Occupied Housing Units | 358 | 61.2% |
| Renter-Occupied Housing Units | 227 | 38.8% |
| Total Occupied Housing Units | 585 | 100.0% |
Occupancy by Household Size in Ravenna
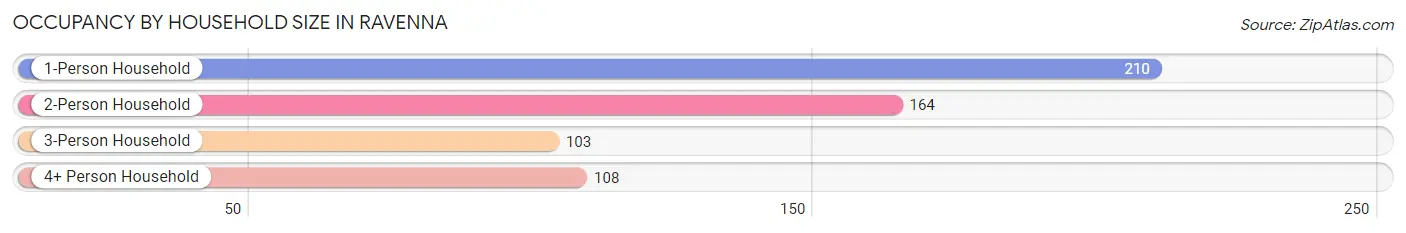
| Household Size | # Housing Units | % Housing Units |
| 1-Person Household | 210 | 35.9% |
| 2-Person Household | 164 | 28.0% |
| 3-Person Household | 103 | 17.6% |
| 4+ Person Household | 108 | 18.5% |
| Total Housing Units | 585 | 100.0% |
Occupancy by Ownership by Household Size in Ravenna
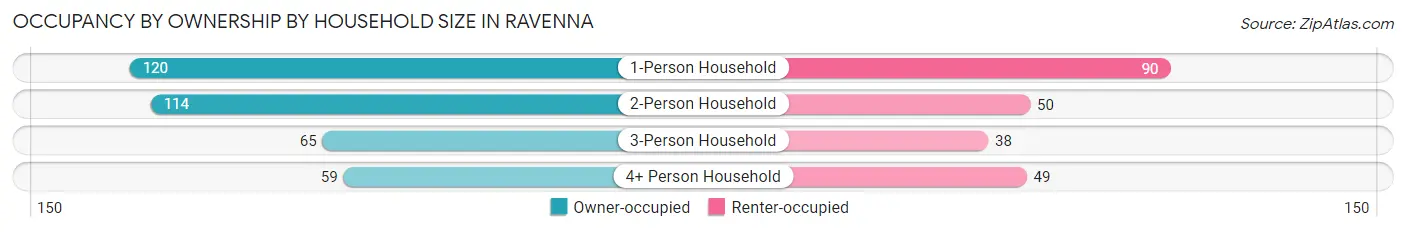
| Household Size | Owner-occupied | Renter-occupied |
| 1-Person Household | 120 (57.1%) | 90 (42.9%) |
| 2-Person Household | 114 (69.5%) | 50 (30.5%) |
| 3-Person Household | 65 (63.1%) | 38 (36.9%) |
| 4+ Person Household | 59 (54.6%) | 49 (45.4%) |
| Total Housing Units | 358 (61.2%) | 227 (38.8%) |
Occupancy by Educational Attainment in Ravenna
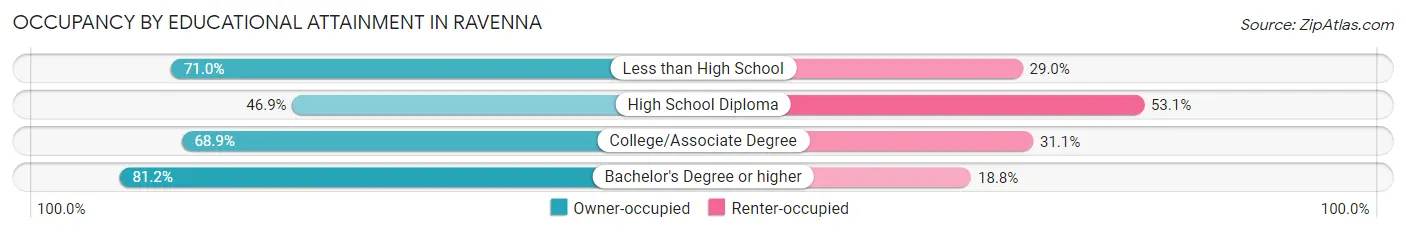
| Household Size | Owner-occupied | Renter-occupied |
| Less than High School | 44 (71.0%) | 18 (29.0%) |
| High School Diploma | 121 (46.9%) | 137 (53.1%) |
| College/Associate Degree | 124 (68.9%) | 56 (31.1%) |
| Bachelor's Degree or higher | 69 (81.2%) | 16 (18.8%) |
Occupancy by Age of Householder in Ravenna
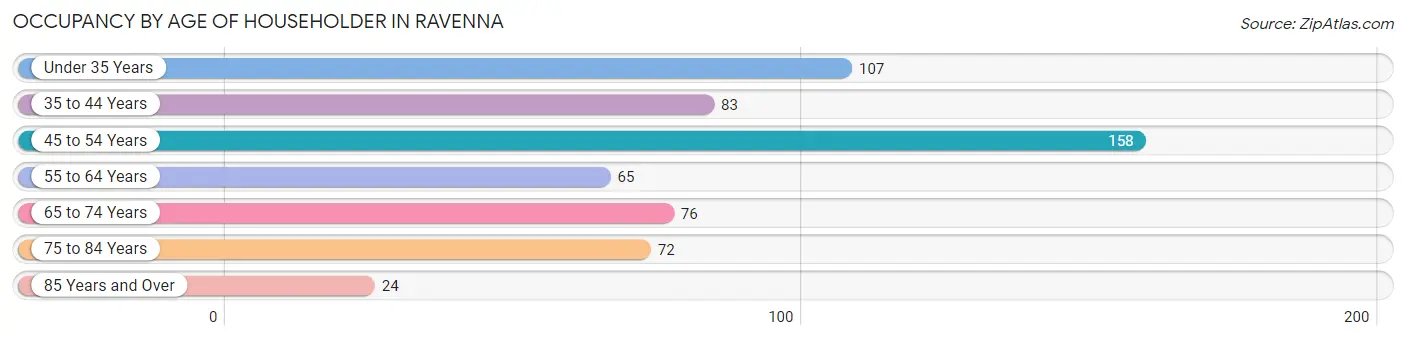
| Age Bracket | # Households | % Households |
| Under 35 Years | 107 | 18.3% |
| 35 to 44 Years | 83 | 14.2% |
| 45 to 54 Years | 158 | 27.0% |
| 55 to 64 Years | 65 | 11.1% |
| 65 to 74 Years | 76 | 13.0% |
| 75 to 84 Years | 72 | 12.3% |
| 85 Years and Over | 24 | 4.1% |
| Total | 585 | 100.0% |
Housing Finances in Ravenna
Median Income by Occupancy in Ravenna
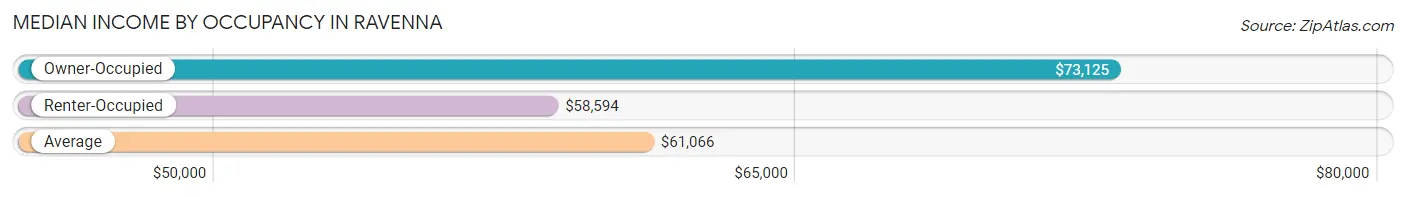
| Occupancy Type | # Households | Median Income |
| Owner-Occupied | 358 (61.2%) | $73,125 |
| Renter-Occupied | 227 (38.8%) | $58,594 |
| Average | 585 (100.0%) | $61,066 |
Occupancy by Householder Income Bracket in Ravenna
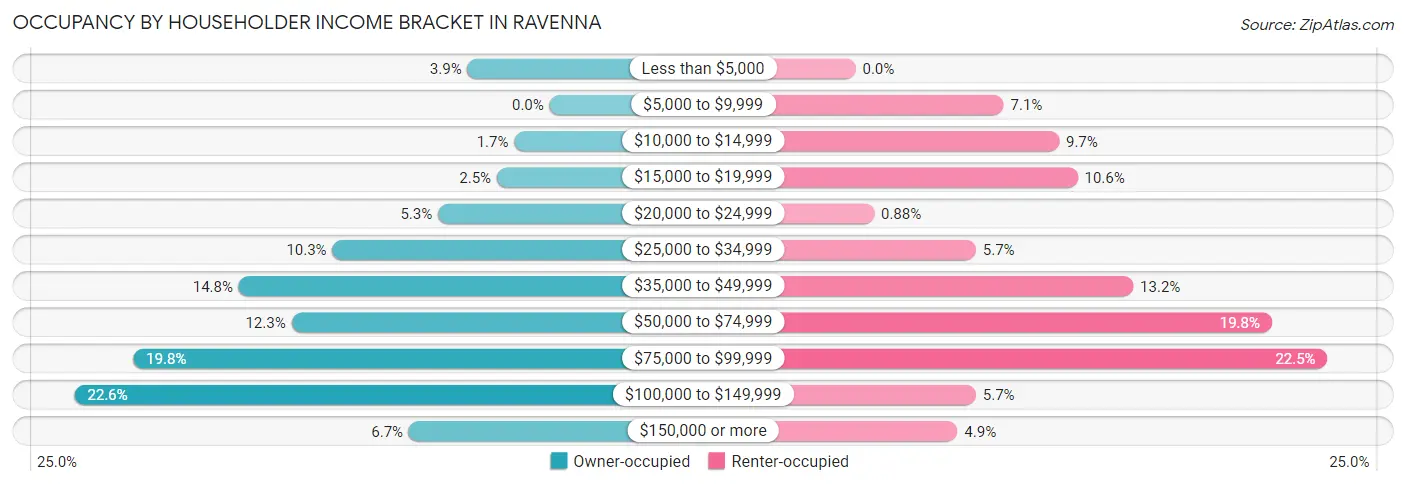
| Income Bracket | Owner-occupied | Renter-occupied |
| Less than $5,000 | 14 (3.9%) | 0 (0.0%) |
| $5,000 to $9,999 | 0 (0.0%) | 16 (7.0%) |
| $10,000 to $14,999 | 6 (1.7%) | 22 (9.7%) |
| $15,000 to $19,999 | 9 (2.5%) | 24 (10.6%) |
| $20,000 to $24,999 | 19 (5.3%) | 2 (0.9%) |
| $25,000 to $34,999 | 37 (10.3%) | 13 (5.7%) |
| $35,000 to $49,999 | 53 (14.8%) | 30 (13.2%) |
| $50,000 to $74,999 | 44 (12.3%) | 45 (19.8%) |
| $75,000 to $99,999 | 71 (19.8%) | 51 (22.5%) |
| $100,000 to $149,999 | 81 (22.6%) | 13 (5.7%) |
| $150,000 or more | 24 (6.7%) | 11 (4.9%) |
| Total | 358 (100.0%) | 227 (100.0%) |
Monthly Housing Cost Tiers in Ravenna
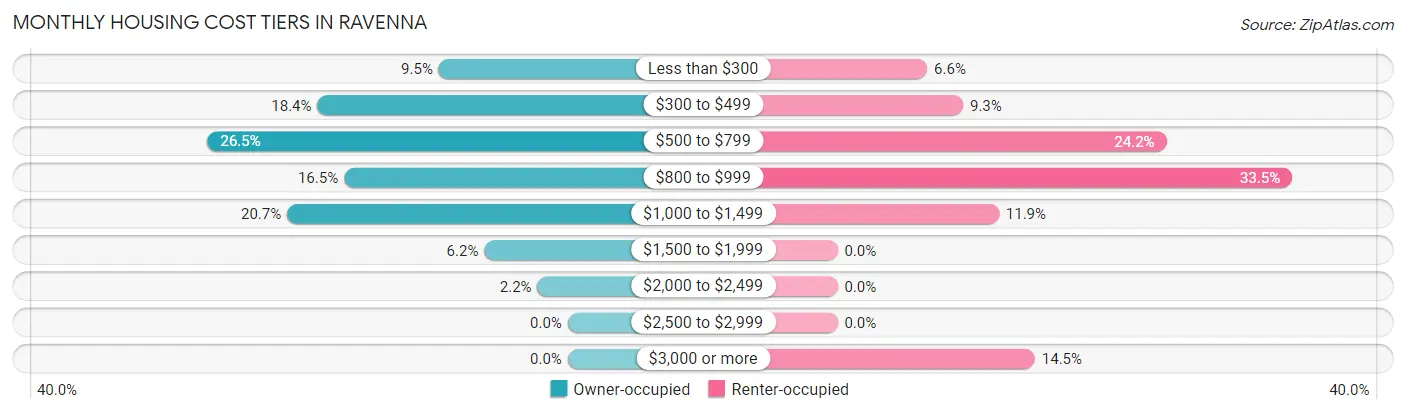
| Monthly Cost | Owner-occupied | Renter-occupied |
| Less than $300 | 34 (9.5%) | 15 (6.6%) |
| $300 to $499 | 66 (18.4%) | 21 (9.2%) |
| $500 to $799 | 95 (26.5%) | 55 (24.2%) |
| $800 to $999 | 59 (16.5%) | 76 (33.5%) |
| $1,000 to $1,499 | 74 (20.7%) | 27 (11.9%) |
| $1,500 to $1,999 | 22 (6.1%) | 0 (0.0%) |
| $2,000 to $2,499 | 8 (2.2%) | 0 (0.0%) |
| $2,500 to $2,999 | 0 (0.0%) | 0 (0.0%) |
| $3,000 or more | 0 (0.0%) | 33 (14.5%) |
| Total | 358 (100.0%) | 227 (100.0%) |
Physical Housing Characteristics in Ravenna
Housing Structures in Ravenna
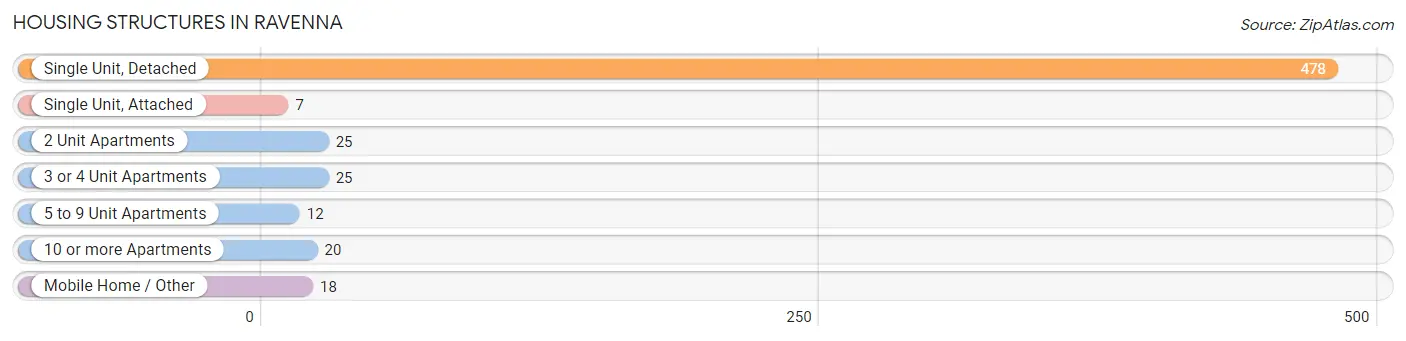
| Structure Type | # Housing Units | % Housing Units |
| Single Unit, Detached | 478 | 81.7% |
| Single Unit, Attached | 7 | 1.2% |
| 2 Unit Apartments | 25 | 4.3% |
| 3 or 4 Unit Apartments | 25 | 4.3% |
| 5 to 9 Unit Apartments | 12 | 2.1% |
| 10 or more Apartments | 20 | 3.4% |
| Mobile Home / Other | 18 | 3.1% |
| Total | 585 | 100.0% |
Housing Structures by Occupancy in Ravenna
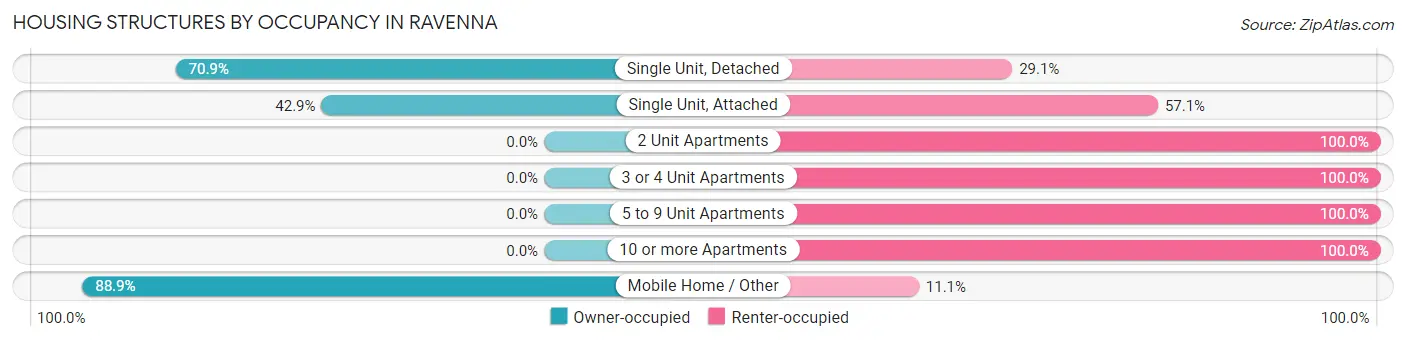
| Structure Type | Owner-occupied | Renter-occupied |
| Single Unit, Detached | 339 (70.9%) | 139 (29.1%) |
| Single Unit, Attached | 3 (42.9%) | 4 (57.1%) |
| 2 Unit Apartments | 0 (0.0%) | 25 (100.0%) |
| 3 or 4 Unit Apartments | 0 (0.0%) | 25 (100.0%) |
| 5 to 9 Unit Apartments | 0 (0.0%) | 12 (100.0%) |
| 10 or more Apartments | 0 (0.0%) | 20 (100.0%) |
| Mobile Home / Other | 16 (88.9%) | 2 (11.1%) |
| Total | 358 (61.2%) | 227 (38.8%) |
Housing Structures by Number of Rooms in Ravenna
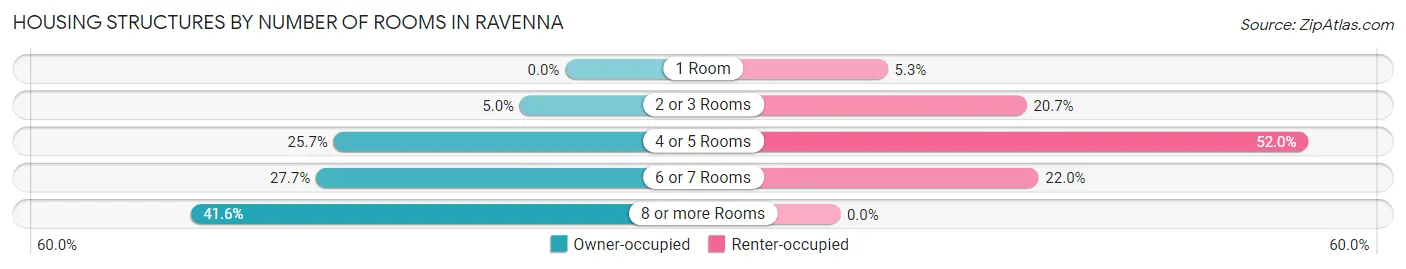
| Number of Rooms | Owner-occupied | Renter-occupied |
| 1 Room | 0 (0.0%) | 12 (5.3%) |
| 2 or 3 Rooms | 18 (5.0%) | 47 (20.7%) |
| 4 or 5 Rooms | 92 (25.7%) | 118 (52.0%) |
| 6 or 7 Rooms | 99 (27.7%) | 50 (22.0%) |
| 8 or more Rooms | 149 (41.6%) | 0 (0.0%) |
| Total | 358 (100.0%) | 227 (100.0%) |
Housing Structure by Heating Type in Ravenna
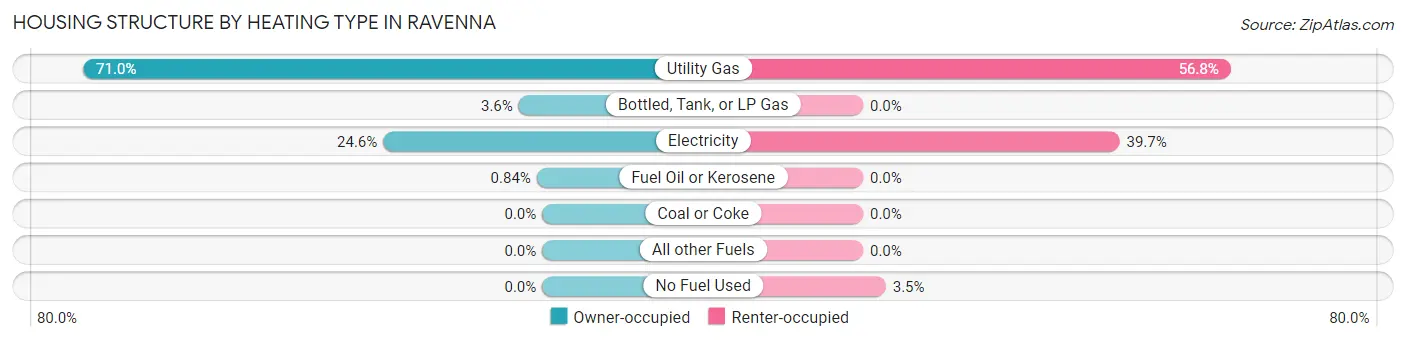
| Heating Type | Owner-occupied | Renter-occupied |
| Utility Gas | 254 (71.0%) | 129 (56.8%) |
| Bottled, Tank, or LP Gas | 13 (3.6%) | 0 (0.0%) |
| Electricity | 88 (24.6%) | 90 (39.7%) |
| Fuel Oil or Kerosene | 3 (0.8%) | 0 (0.0%) |
| Coal or Coke | 0 (0.0%) | 0 (0.0%) |
| All other Fuels | 0 (0.0%) | 0 (0.0%) |
| No Fuel Used | 0 (0.0%) | 8 (3.5%) |
| Total | 358 (100.0%) | 227 (100.0%) |
Household Vehicle Usage in Ravenna
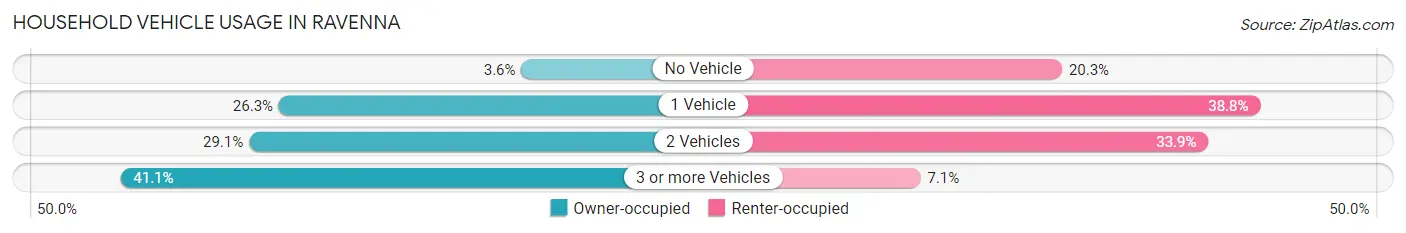
| Vehicles per Household | Owner-occupied | Renter-occupied |
| No Vehicle | 13 (3.6%) | 46 (20.3%) |
| 1 Vehicle | 94 (26.3%) | 88 (38.8%) |
| 2 Vehicles | 104 (29.0%) | 77 (33.9%) |
| 3 or more Vehicles | 147 (41.1%) | 16 (7.0%) |
| Total | 358 (100.0%) | 227 (100.0%) |
Real Estate & Mortgages in Ravenna
Real Estate and Mortgage Overview in Ravenna
| Characteristic | Without Mortgage | With Mortgage |
| Housing Units | 209 | 149 |
| Median Property Value | $97,300 | $129,200 |
| Median Household Income | $49,125 | $20 |
| Monthly Housing Costs | $516 | $0 |
| Real Estate Taxes | $1,421 | $1 |
Property Value by Mortgage Status in Ravenna
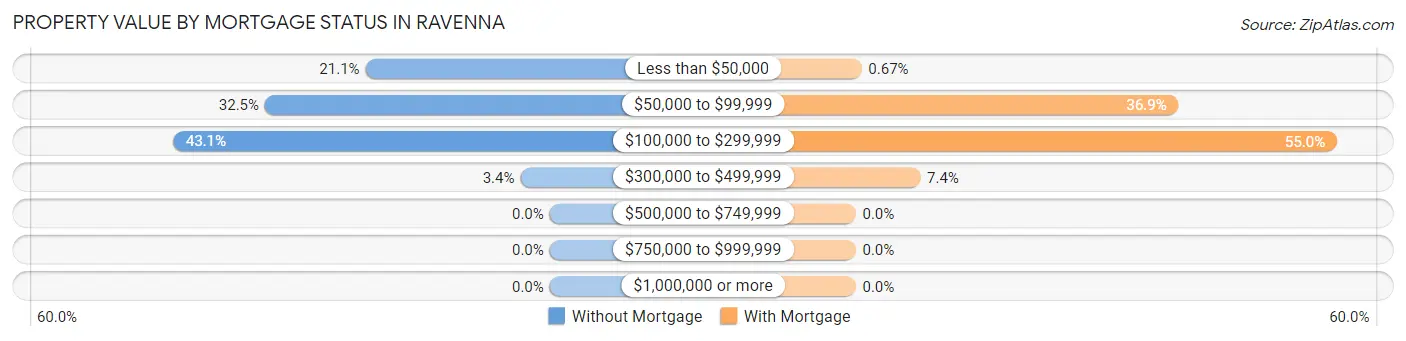
| Property Value | Without Mortgage | With Mortgage |
| Less than $50,000 | 44 (21.0%) | 1 (0.7%) |
| $50,000 to $99,999 | 68 (32.5%) | 55 (36.9%) |
| $100,000 to $299,999 | 90 (43.1%) | 82 (55.0%) |
| $300,000 to $499,999 | 7 (3.4%) | 11 (7.4%) |
| $500,000 to $749,999 | 0 (0.0%) | 0 (0.0%) |
| $750,000 to $999,999 | 0 (0.0%) | 0 (0.0%) |
| $1,000,000 or more | 0 (0.0%) | 0 (0.0%) |
| Total | 209 (100.0%) | 149 (100.0%) |
Household Income by Mortgage Status in Ravenna
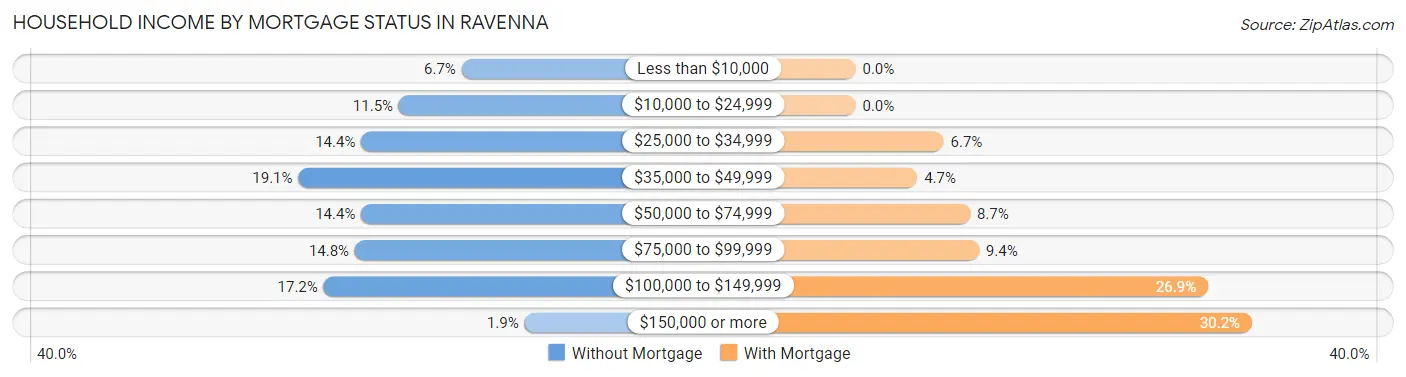
| Household Income | Without Mortgage | With Mortgage |
| Less than $10,000 | 14 (6.7%) | 0 (0.0%) |
| $10,000 to $24,999 | 24 (11.5%) | 0 (0.0%) |
| $25,000 to $34,999 | 30 (14.3%) | 10 (6.7%) |
| $35,000 to $49,999 | 40 (19.1%) | 7 (4.7%) |
| $50,000 to $74,999 | 30 (14.3%) | 13 (8.7%) |
| $75,000 to $99,999 | 31 (14.8%) | 14 (9.4%) |
| $100,000 to $149,999 | 36 (17.2%) | 40 (26.9%) |
| $150,000 or more | 4 (1.9%) | 45 (30.2%) |
| Total | 209 (100.0%) | 149 (100.0%) |
Property Value to Household Income Ratio in Ravenna
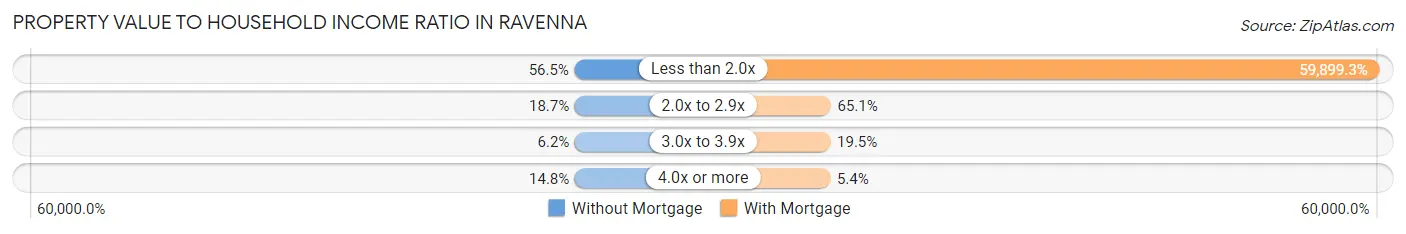
| Value-to-Income Ratio | Without Mortgage | With Mortgage |
| Less than 2.0x | 118 (56.5%) | 89,250 (59,899.3%) |
| 2.0x to 2.9x | 39 (18.7%) | 97 (65.1%) |
| 3.0x to 3.9x | 13 (6.2%) | 29 (19.5%) |
| 4.0x or more | 31 (14.8%) | 8 (5.4%) |
| Total | 209 (100.0%) | 149 (100.0%) |
Real Estate Taxes by Mortgage Status in Ravenna
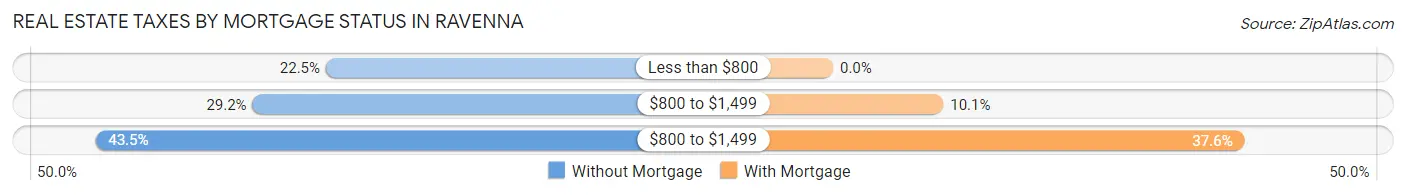
| Property Taxes | Without Mortgage | With Mortgage |
| Less than $800 | 47 (22.5%) | 0 (0.0%) |
| $800 to $1,499 | 61 (29.2%) | 15 (10.1%) |
| $800 to $1,499 | 91 (43.5%) | 56 (37.6%) |
| Total | 209 (100.0%) | 149 (100.0%) |
Health & Disability in Ravenna
Health Insurance Coverage by Age in Ravenna
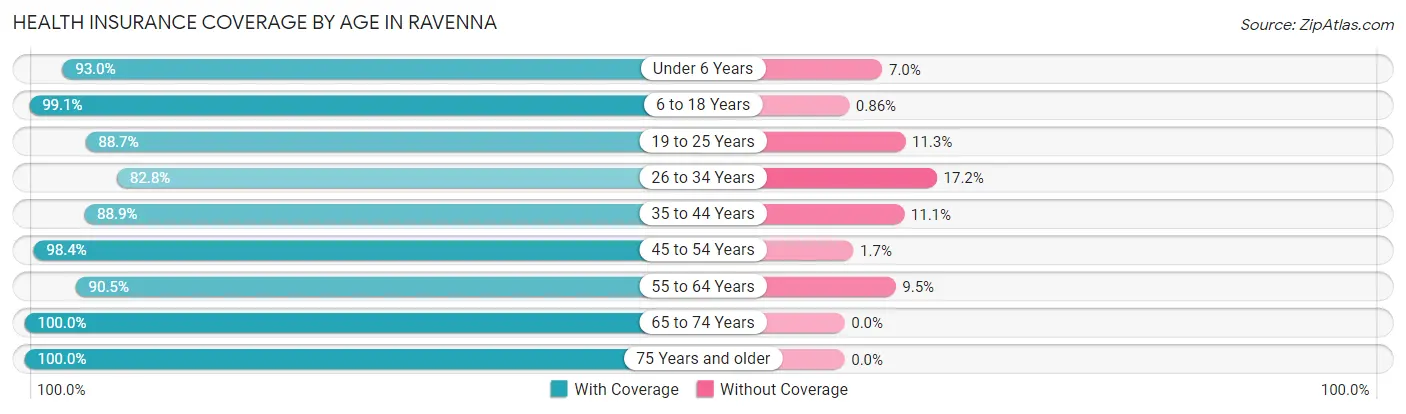
| Age Bracket | With Coverage | Without Coverage |
| Under 6 Years | 66 (93.0%) | 5 (7.0%) |
| 6 to 18 Years | 231 (99.1%) | 2 (0.9%) |
| 19 to 25 Years | 94 (88.7%) | 12 (11.3%) |
| 26 to 34 Years | 149 (82.8%) | 31 (17.2%) |
| 35 to 44 Years | 136 (88.9%) | 17 (11.1%) |
| 45 to 54 Years | 239 (98.4%) | 4 (1.7%) |
| 55 to 64 Years | 133 (90.5%) | 14 (9.5%) |
| 65 to 74 Years | 106 (100.0%) | 0 (0.0%) |
| 75 Years and older | 127 (100.0%) | 0 (0.0%) |
| Total | 1,281 (93.8%) | 85 (6.2%) |
Health Insurance Coverage by Citizenship Status in Ravenna
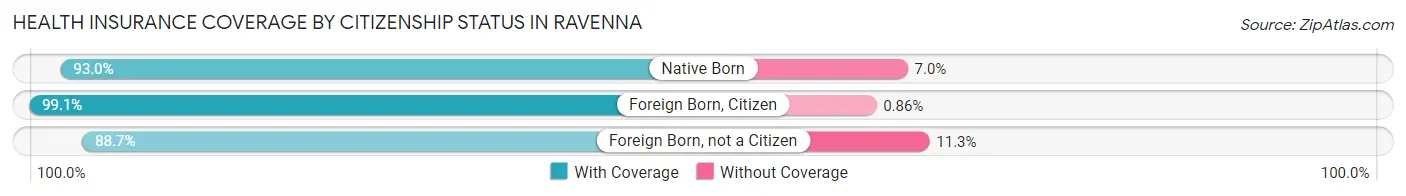
| Citizenship Status | With Coverage | Without Coverage |
| Native Born | 66 (93.0%) | 5 (7.0%) |
| Foreign Born, Citizen | 231 (99.1%) | 2 (0.9%) |
| Foreign Born, not a Citizen | 94 (88.7%) | 12 (11.3%) |
Health Insurance Coverage by Household Income in Ravenna
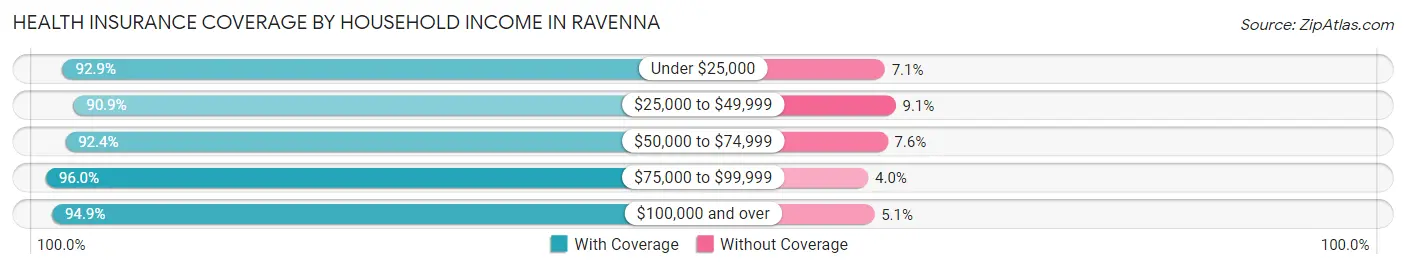
| Household Income | With Coverage | Without Coverage |
| Under $25,000 | 183 (92.9%) | 14 (7.1%) |
| $25,000 to $49,999 | 209 (90.9%) | 21 (9.1%) |
| $50,000 to $74,999 | 194 (92.4%) | 16 (7.6%) |
| $75,000 to $99,999 | 289 (96.0%) | 12 (4.0%) |
| $100,000 and over | 406 (94.9%) | 22 (5.1%) |
Public vs Private Health Insurance Coverage by Age in Ravenna
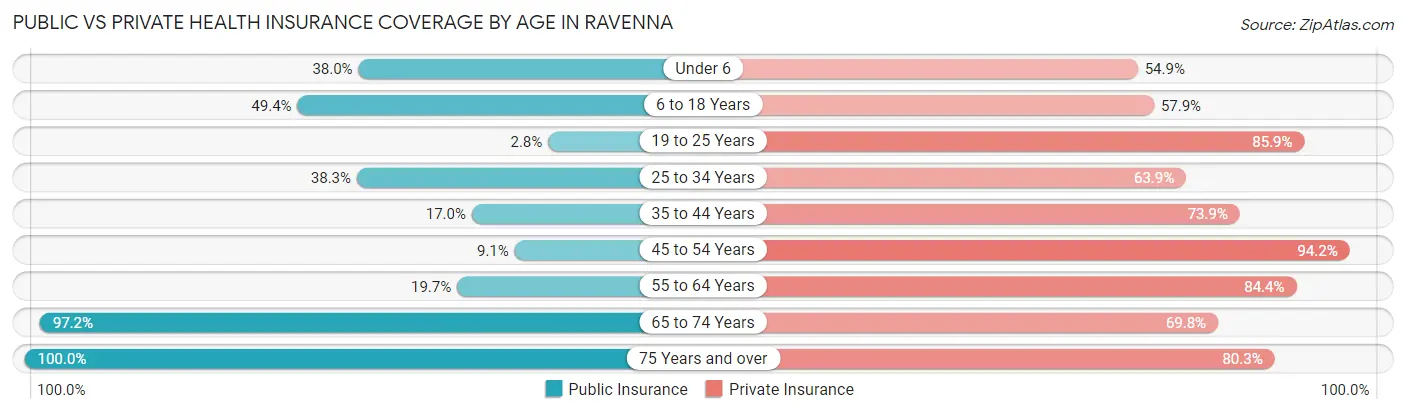
| Age Bracket | Public Insurance | Private Insurance |
| Under 6 | 27 (38.0%) | 39 (54.9%) |
| 6 to 18 Years | 115 (49.4%) | 135 (57.9%) |
| 19 to 25 Years | 3 (2.8%) | 91 (85.9%) |
| 25 to 34 Years | 69 (38.3%) | 115 (63.9%) |
| 35 to 44 Years | 26 (17.0%) | 113 (73.9%) |
| 45 to 54 Years | 22 (9.0%) | 229 (94.2%) |
| 55 to 64 Years | 29 (19.7%) | 124 (84.4%) |
| 65 to 74 Years | 103 (97.2%) | 74 (69.8%) |
| 75 Years and over | 127 (100.0%) | 102 (80.3%) |
| Total | 521 (38.1%) | 1,022 (74.8%) |
Disability Status by Sex by Age in Ravenna
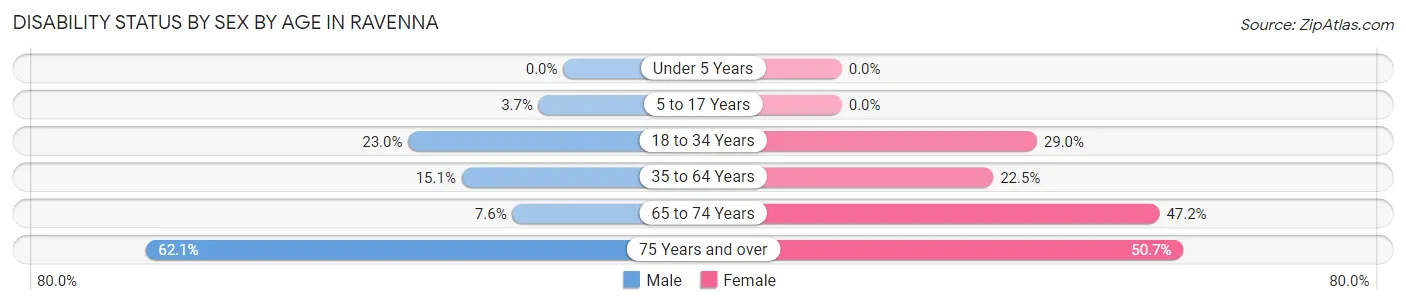
| Age Bracket | Male | Female |
| Under 5 Years | 0 (0.0%) | 0 (0.0%) |
| 5 to 17 Years | 5 (3.6%) | 0 (0.0%) |
| 18 to 34 Years | 35 (23.0%) | 42 (29.0%) |
| 35 to 64 Years | 43 (15.1%) | 58 (22.5%) |
| 65 to 74 Years | 4 (7.5%) | 25 (47.2%) |
| 75 Years and over | 36 (62.1%) | 35 (50.7%) |
Disability Class by Sex by Age in Ravenna
Disability Class: Hearing Difficulty
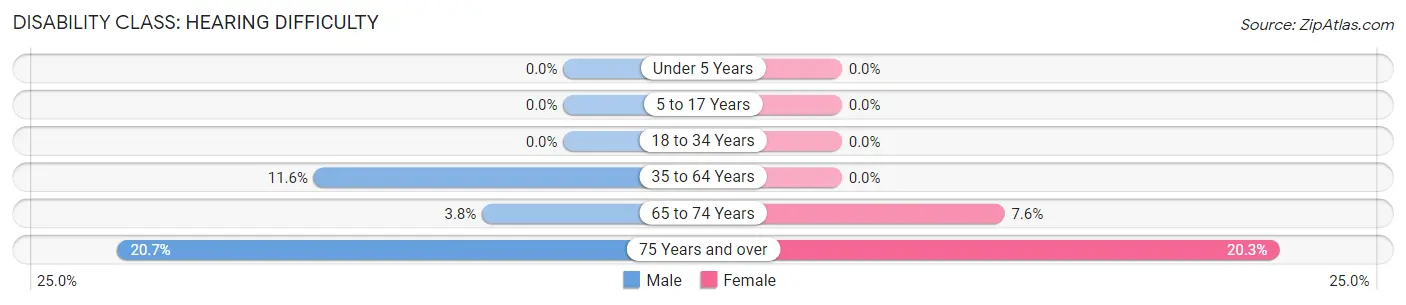
| Age Bracket | Male | Female |
| Under 5 Years | 0 (0.0%) | 0 (0.0%) |
| 5 to 17 Years | 0 (0.0%) | 0 (0.0%) |
| 18 to 34 Years | 0 (0.0%) | 0 (0.0%) |
| 35 to 64 Years | 33 (11.6%) | 0 (0.0%) |
| 65 to 74 Years | 2 (3.8%) | 4 (7.5%) |
| 75 Years and over | 12 (20.7%) | 14 (20.3%) |
Disability Class: Vision Difficulty
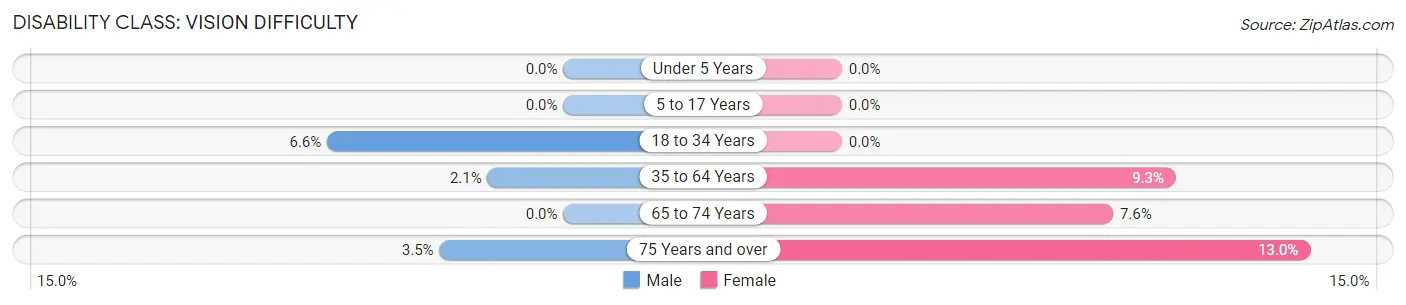
| Age Bracket | Male | Female |
| Under 5 Years | 0 (0.0%) | 0 (0.0%) |
| 5 to 17 Years | 0 (0.0%) | 0 (0.0%) |
| 18 to 34 Years | 10 (6.6%) | 0 (0.0%) |
| 35 to 64 Years | 6 (2.1%) | 24 (9.3%) |
| 65 to 74 Years | 0 (0.0%) | 4 (7.5%) |
| 75 Years and over | 2 (3.5%) | 9 (13.0%) |
Disability Class: Cognitive Difficulty
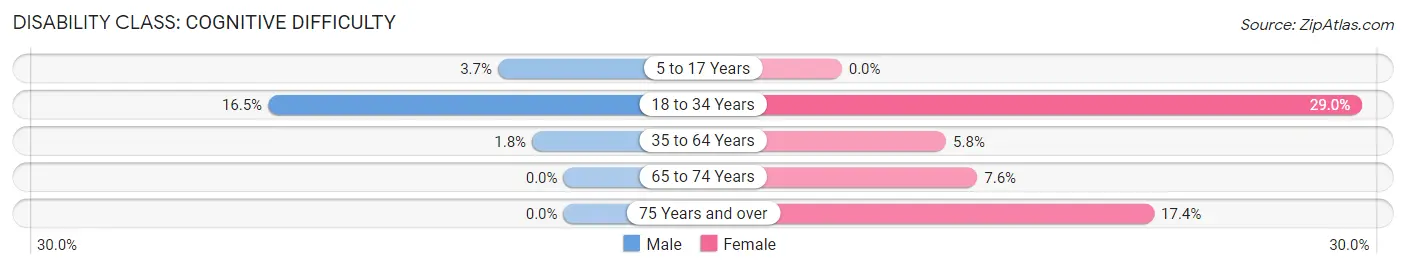
| Age Bracket | Male | Female |
| 5 to 17 Years | 5 (3.6%) | 0 (0.0%) |
| 18 to 34 Years | 25 (16.5%) | 42 (29.0%) |
| 35 to 64 Years | 5 (1.8%) | 15 (5.8%) |
| 65 to 74 Years | 0 (0.0%) | 4 (7.5%) |
| 75 Years and over | 0 (0.0%) | 12 (17.4%) |
Disability Class: Ambulatory Difficulty
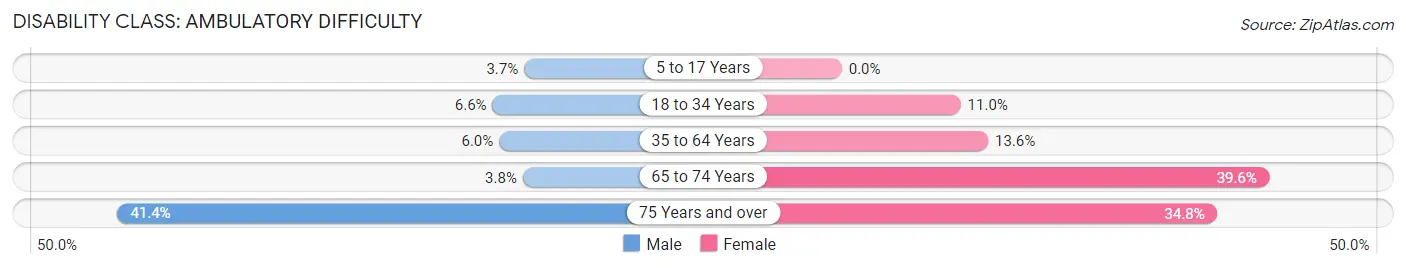
| Age Bracket | Male | Female |
| 5 to 17 Years | 5 (3.6%) | 0 (0.0%) |
| 18 to 34 Years | 10 (6.6%) | 16 (11.0%) |
| 35 to 64 Years | 17 (6.0%) | 35 (13.6%) |
| 65 to 74 Years | 2 (3.8%) | 21 (39.6%) |
| 75 Years and over | 24 (41.4%) | 24 (34.8%) |
Disability Class: Self-Care Difficulty
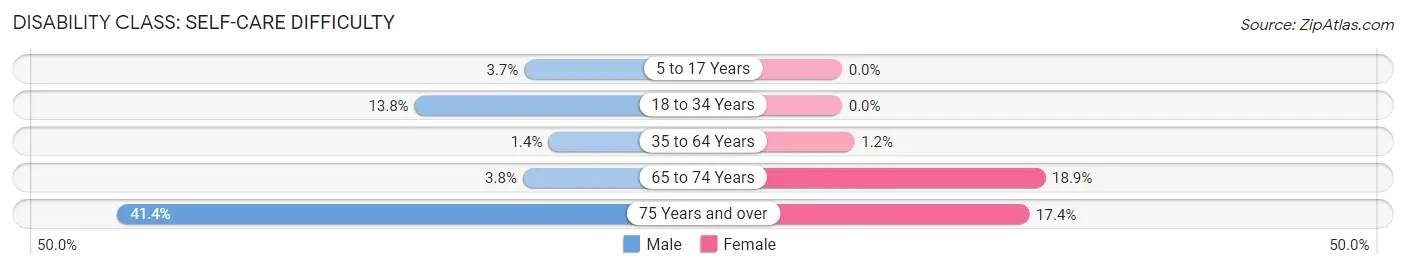
| Age Bracket | Male | Female |
| 5 to 17 Years | 5 (3.6%) | 0 (0.0%) |
| 18 to 34 Years | 21 (13.8%) | 0 (0.0%) |
| 35 to 64 Years | 4 (1.4%) | 3 (1.2%) |
| 65 to 74 Years | 2 (3.8%) | 10 (18.9%) |
| 75 Years and over | 24 (41.4%) | 12 (17.4%) |
Technology Access in Ravenna
Computing Device Access in Ravenna
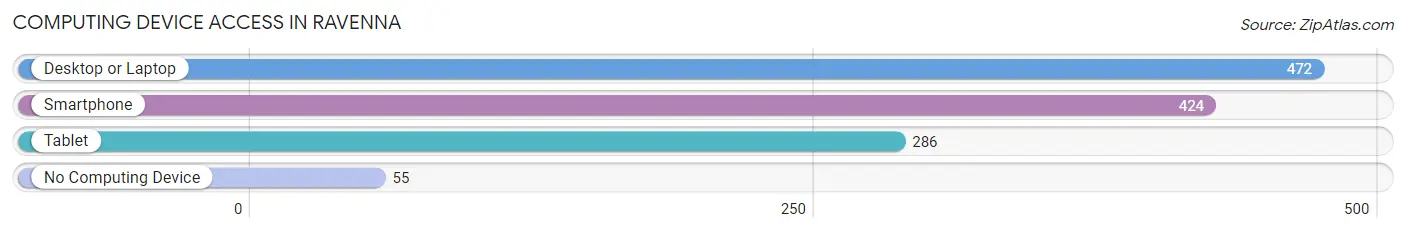
| Device Type | # Households | % Households |
| Desktop or Laptop | 472 | 80.7% |
| Smartphone | 424 | 72.5% |
| Tablet | 286 | 48.9% |
| No Computing Device | 55 | 9.4% |
| Total | 585 | 100.0% |
Internet Access in Ravenna
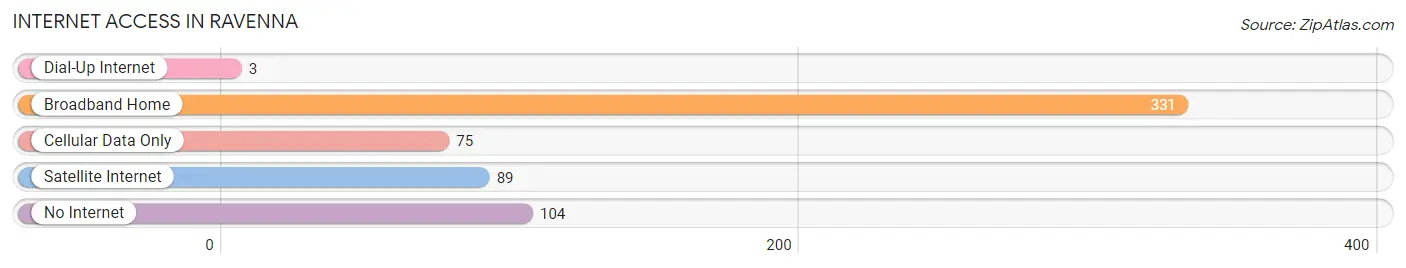
| Internet Type | # Households | % Households |
| Dial-Up Internet | 3 | 0.5% |
| Broadband Home | 331 | 56.6% |
| Cellular Data Only | 75 | 12.8% |
| Satellite Internet | 89 | 15.2% |
| No Internet | 104 | 17.8% |
| Total | 585 | 100.0% |
Ravenna Summary
Ravenna is a small city located in the state of Nebraska, in the United States of America. It is located in the south-central part of the state, in Buffalo County, and is part of the Kearney, Nebraska Metropolitan Statistical Area. The city has a population of 1,845 people, according to the 2010 census.
History
The city of Ravenna was founded in 1887, when the Burlington and Missouri River Railroad was built through the area. The city was named after Ravenna, Ohio, the hometown of one of the railroad's engineers. The city was incorporated in 1891, and the first mayor was elected in 1892.
The city grew rapidly in the early 20th century, and by 1910, the population had grown to 1,093. The city was home to a variety of businesses, including a bank, a newspaper, a hotel, a lumberyard, a creamery, and a variety of other businesses.
In the 1920s, the city was home to a number of fraternal organizations, including the Masons, the Odd Fellows, and the Knights of Pythias. The city also had a number of churches, including the Methodist, Presbyterian, and Catholic churches.
Geography
Ravenna is located in south-central Nebraska, in Buffalo County. It is situated at the intersection of U.S. Route 30 and Nebraska Highway 10. The city is located approximately 25 miles east of Kearney, the county seat, and approximately 50 miles west of Grand Island.
The city is located in the Central Plains region of the United States, and is part of the Great Plains. The city is located at an elevation of 2,072 feet above sea level.
The city is located in a semi-arid climate, with hot summers and cold winters. The average annual temperature is 52.3 degrees Fahrenheit, and the average annual precipitation is 22.3 inches.
Economy
The economy of Ravenna is largely based on agriculture. The city is home to a number of farms, and the surrounding area is home to a variety of crops, including corn, soybeans, wheat, and alfalfa.
The city is also home to a number of businesses, including a grocery store, a hardware store, a bank, a newspaper, and a variety of other businesses. The city is also home to a number of manufacturing companies, including a furniture manufacturer, a plastics manufacturer, and a metal fabrication company.
Demographics
According to the 2010 census, the population of Ravenna was 1,845 people. The racial makeup of the city was 97.2% White, 0.3% African American, 0.2% Native American, 0.2% Asian, 0.1% Pacific Islander, 0.7% from other races, and 1.3% from two or more races. Hispanic or Latino of any race were 2.2% of the population.
The median household income in Ravenna was $41,250, and the median family income was $50,000. The per capita income was $19,945. About 11.2% of the population was below the poverty line.
Common Questions
What is Per Capita Income in Ravenna?
Per Capita income in Ravenna is $32,045.
What is the Median Family Income in Ravenna?
Median Family Income in Ravenna is $61,544.
What is the Median Household income in Ravenna?
Median Household Income in Ravenna is $61,066.
What is Income or Wage Gap in Ravenna?
Income or Wage Gap in Ravenna is 17.4%.
Women in Ravenna earn 82.6 cents for every dollar earned by a man.
What is Inequality or Gini Index in Ravenna?
Inequality or Gini Index in Ravenna is 0.39.
What is the Total Population of Ravenna?
Total Population of Ravenna is 1,408.
What is the Total Male Population of Ravenna?
Total Male Population of Ravenna is 743.
What is the Total Female Population of Ravenna?
Total Female Population of Ravenna is 665.
What is the Ratio of Males per 100 Females in Ravenna?
There are 111.73 Males per 100 Females in Ravenna.
What is the Ratio of Females per 100 Males in Ravenna?
There are 89.50 Females per 100 Males in Ravenna.
What is the Median Population Age in Ravenna?
Median Population Age in Ravenna is 40.4 Years.
What is the Average Family Size in Ravenna
Average Family Size in Ravenna is 3.0 People.
What is the Average Household Size in Ravenna
Average Household Size in Ravenna is 2.3 People.
How Large is the Labor Force in Ravenna?
There are 763 People in the Labor Forcein in Ravenna.
What is the Percentage of People in the Labor Force in Ravenna?
64.5% of People are in the Labor Force in Ravenna.
What is the Unemployment Rate in Ravenna?
Unemployment Rate in Ravenna is 2.8%.