Verdigre, NE Map & Demographics
Verdigre Map
Verdigre Overview
$21,191
PER CAPITA INCOME
$62,778
AVG FAMILY INCOME
$50,250
AVG HOUSEHOLD INCOME
44.2%
WAGE / INCOME GAP [ % ]
55.8¢/ $1
WAGE / INCOME GAP [ $ ]
0.42
INEQUALITY / GINI INDEX
609
TOTAL POPULATION
315
MALE POPULATION
294
FEMALE POPULATION
107.14
MALES / 100 FEMALES
93.33
FEMALES / 100 MALES
43.2
MEDIAN AGE
3.3
AVG FAMILY SIZE
2.5
AVG HOUSEHOLD SIZE
265
LABOR FORCE [ PEOPLE ]
55.1%
PERCENT IN LABOR FORCE
5.3%
UNEMPLOYMENT RATE
Verdigre Zip Codes
Verdigre Area Codes
Income in Verdigre
Income Overview in Verdigre
Per Capita Income in Verdigre is $21,191, while median incomes of families and households are $62,778 and $50,250 respectively.
| Characteristic | Number | Measure |
| Per Capita Income | 609 | $21,191 |
| Median Family Income | 148 | $62,778 |
| Mean Family Income | 148 | $67,995 |
| Median Household Income | 223 | $50,250 |
| Mean Household Income | 223 | $56,481 |
| Income Deficit | 148 | $0 |
| Wage / Income Gap (%) | 609 | 44.23% |
| Wage / Income Gap ($) | 609 | 55.77¢ per $1 |
| Gini / Inequality Index | 609 | 0.42 |
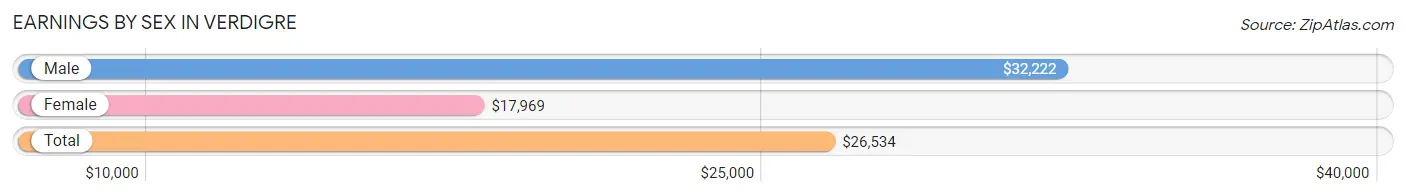
Earnings by Sex in Verdigre
Average Earnings in Verdigre are $26,534, $32,222 for men and $17,969 for women, a difference of 44.2%.
| Sex | Number | Average Earnings |
| Male | 150 (51.5%) | $32,222 |
| Female | 141 (48.4%) | $17,969 |
| Total | 291 (100.0%) | $26,534 |
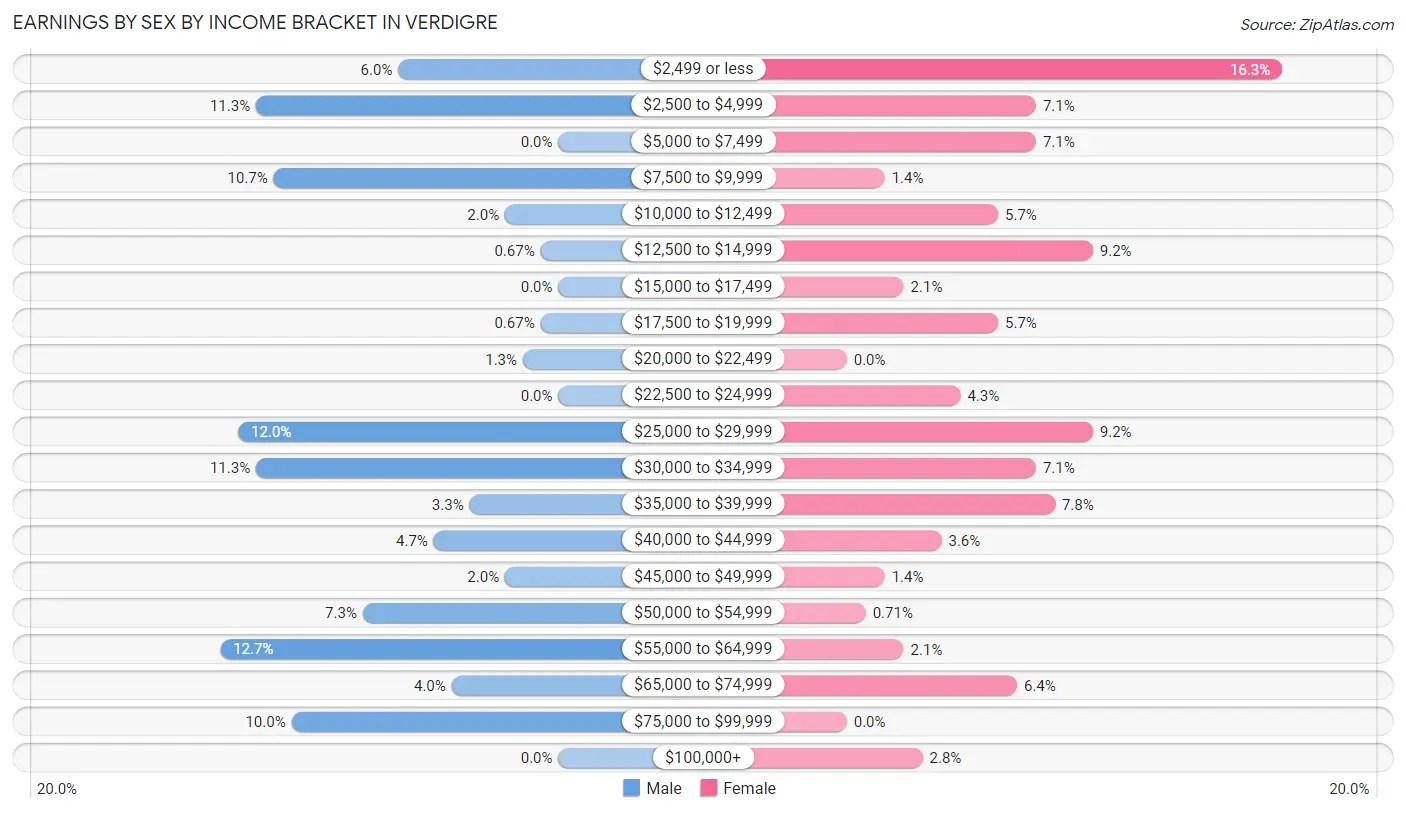
Earnings by Sex by Income Bracket in Verdigre
The most common earnings brackets in Verdigre are $55,000 to $64,999 for men (19 | 12.7%) and $2,499 or less for women (23 | 16.3%).
| Income | Male | Female |
| $2,499 or less | 9 (6.0%) | 23 (16.3%) |
| $2,500 to $4,999 | 17 (11.3%) | 10 (7.1%) |
| $5,000 to $7,499 | 0 (0.0%) | 10 (7.1%) |
| $7,500 to $9,999 | 16 (10.7%) | 2 (1.4%) |
| $10,000 to $12,499 | 3 (2.0%) | 8 (5.7%) |
| $12,500 to $14,999 | 1 (0.7%) | 13 (9.2%) |
| $15,000 to $17,499 | 0 (0.0%) | 3 (2.1%) |
| $17,500 to $19,999 | 1 (0.7%) | 8 (5.7%) |
| $20,000 to $22,499 | 2 (1.3%) | 0 (0.0%) |
| $22,500 to $24,999 | 0 (0.0%) | 6 (4.3%) |
| $25,000 to $29,999 | 18 (12.0%) | 13 (9.2%) |
| $30,000 to $34,999 | 17 (11.3%) | 10 (7.1%) |
| $35,000 to $39,999 | 5 (3.3%) | 11 (7.8%) |
| $40,000 to $44,999 | 7 (4.7%) | 5 (3.5%) |
| $45,000 to $49,999 | 3 (2.0%) | 2 (1.4%) |
| $50,000 to $54,999 | 11 (7.3%) | 1 (0.7%) |
| $55,000 to $64,999 | 19 (12.7%) | 3 (2.1%) |
| $65,000 to $74,999 | 6 (4.0%) | 9 (6.4%) |
| $75,000 to $99,999 | 15 (10.0%) | 0 (0.0%) |
| $100,000+ | 0 (0.0%) | 4 (2.8%) |
| Total | 150 (100.0%) | 141 (100.0%) |
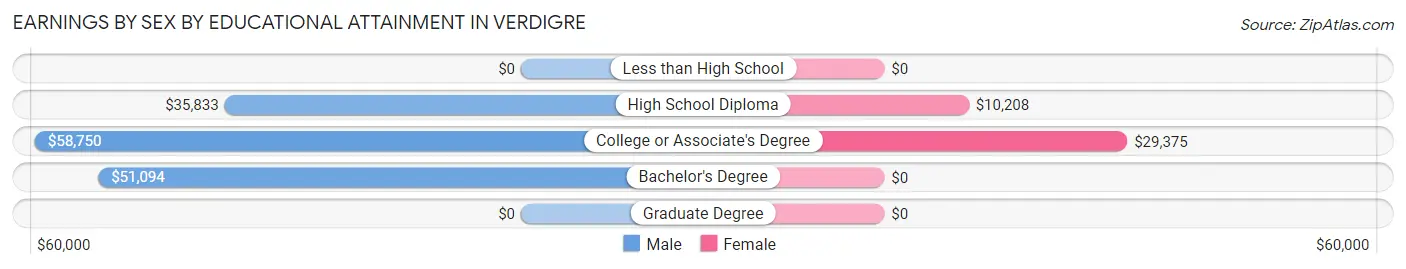
Earnings by Sex by Educational Attainment in Verdigre
Average earnings in Verdigre are $41,250 for men and $22,917 for women, a difference of 44.4%. Men with an educational attainment of college or associate's degree enjoy the highest average annual earnings of $58,750, while those with high school diploma education earn the least with $35,833. Women with an educational attainment of college or associate's degree earn the most with the average annual earnings of $29,375, while those with high school diploma education have the smallest earnings of $10,208.
| Educational Attainment | Male Income | Female Income |
| Less than High School | - | - |
| High School Diploma | $35,833 | $10,208 |
| College or Associate's Degree | $58,750 | $29,375 |
| Bachelor's Degree | $51,094 | $0 |
| Graduate Degree | - | - |
| Total | $41,250 | $22,917 |
Family Income in Verdigre
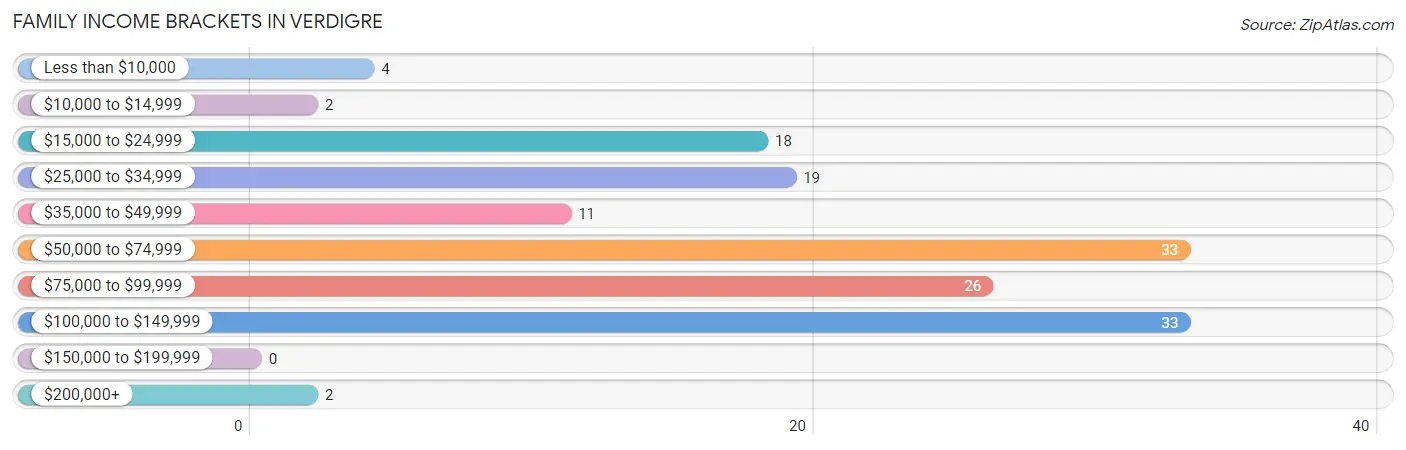
Family Income Brackets in Verdigre
According to the Verdigre family income data, there are 33 families falling into the $50,000 to $74,999 income range, which is the most common income bracket and makes up 22.3% of all families.
| Income Bracket | # Families | % Families |
| Less than $10,000 | 4 | 2.7% |
| $10,000 to $14,999 | 2 | 1.4% |
| $15,000 to $24,999 | 18 | 12.2% |
| $25,000 to $34,999 | 19 | 12.8% |
| $35,000 to $49,999 | 11 | 7.4% |
| $50,000 to $74,999 | 33 | 22.3% |
| $75,000 to $99,999 | 26 | 17.6% |
| $100,000 to $149,999 | 33 | 22.3% |
| $150,000 to $199,999 | 0 | 0.0% |
| $200,000+ | 2 | 1.4% |
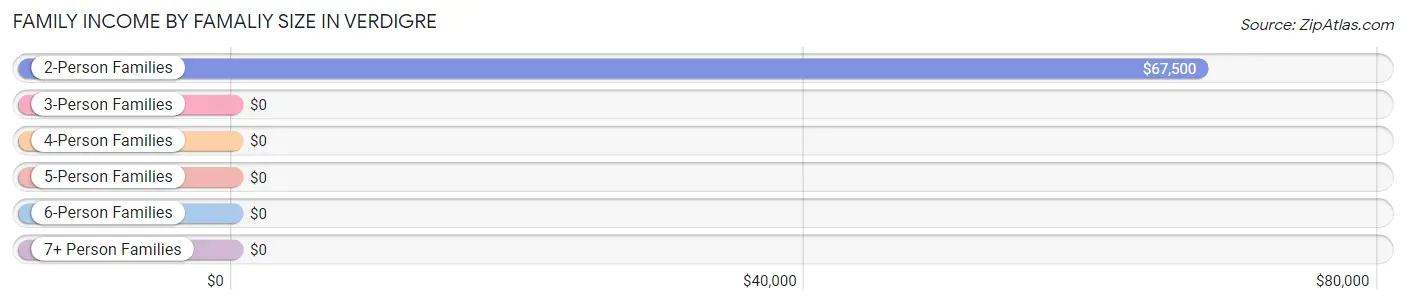
Family Income by Famaliy Size in Verdigre
2-person families (86 | 58.1%) account for the highest median family income in Verdigre with $67,500 per family, while 2-person families (86 | 58.1%) have the highest median income of $33,750 per family member.
| Income Bracket | # Families | Median Income |
| 2-Person Families | 86 (58.1%) | $67,500 |
| 3-Person Families | 16 (10.8%) | $0 |
| 4-Person Families | 13 (8.8%) | $0 |
| 5-Person Families | 6 (4.1%) | $0 |
| 6-Person Families | 9 (6.1%) | $0 |
| 7+ Person Families | 18 (12.2%) | $0 |
| Total | 148 (100.0%) | $62,778 |
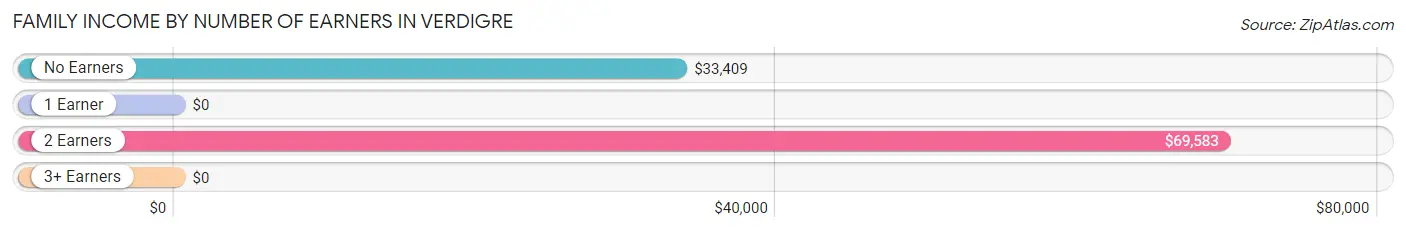
Family Income by Number of Earners in Verdigre
| Number of Earners | # Families | Median Income |
| No Earners | 20 (13.5%) | $33,409 |
| 1 Earner | 35 (23.6%) | $0 |
| 2 Earners | 73 (49.3%) | $69,583 |
| 3+ Earners | 20 (13.5%) | $0 |
| Total | 148 (100.0%) | $62,778 |
Household Income in Verdigre
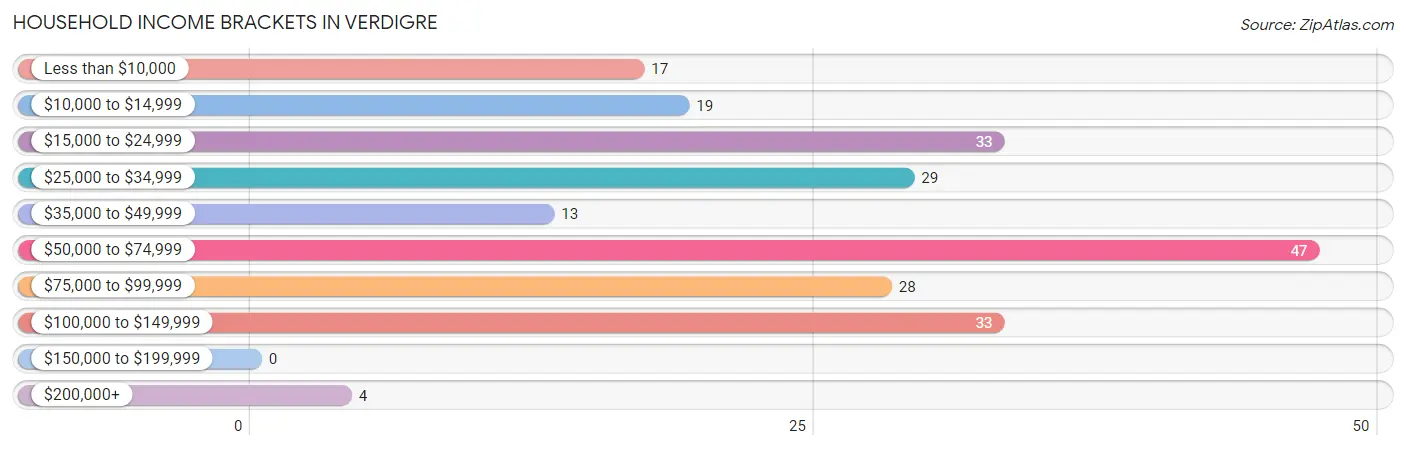
Household Income Brackets in Verdigre
With 47 households falling in the category, the $50,000 to $74,999 income range is the most frequent in Verdigre, accounting for 21.1% of all households.
| Income Bracket | # Households | % Households |
| Less than $10,000 | 17 | 7.6% |
| $10,000 to $14,999 | 19 | 8.5% |
| $15,000 to $24,999 | 33 | 14.8% |
| $25,000 to $34,999 | 29 | 13.0% |
| $35,000 to $49,999 | 13 | 5.8% |
| $50,000 to $74,999 | 47 | 21.1% |
| $75,000 to $99,999 | 28 | 12.6% |
| $100,000 to $149,999 | 33 | 14.8% |
| $150,000 to $199,999 | 0 | 0.0% |
| $200,000+ | 4 | 1.8% |
Household Income by Householder Age in Verdigre
The median household income in Verdigre is $50,250, with the highest median household income of $54,500 found in the 45 to 64 years age bracket for the primary householder. A total of 90 households (40.4%) fall into this category. Meanwhile, the 15 to 24 years age bracket for the primary householder has the lowest median household income of $0, with 14 households (6.3%) in this group.
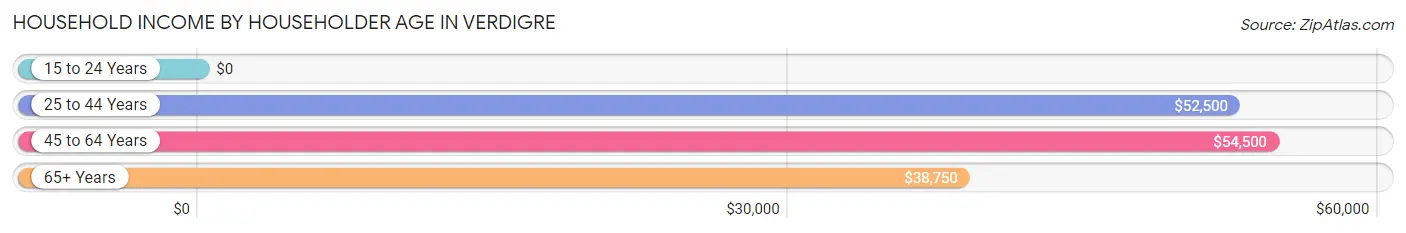
| Income Bracket | # Households | Median Income |
| 15 to 24 Years | 14 (6.3%) | $0 |
| 25 to 44 Years | 38 (17.0%) | $52,500 |
| 45 to 64 Years | 90 (40.4%) | $54,500 |
| 65+ Years | 81 (36.3%) | $38,750 |
| Total | 223 (100.0%) | $50,250 |
Poverty in Verdigre
Income Below Poverty by Sex and Age in Verdigre
With 20.1% poverty level for males and 31.4% for females among the residents of Verdigre, 15 year old males and 18 to 24 year old females are the most vulnerable to poverty, with 2 males (66.7%) and 19 females (79.2%) in their respective age groups living below the poverty level.
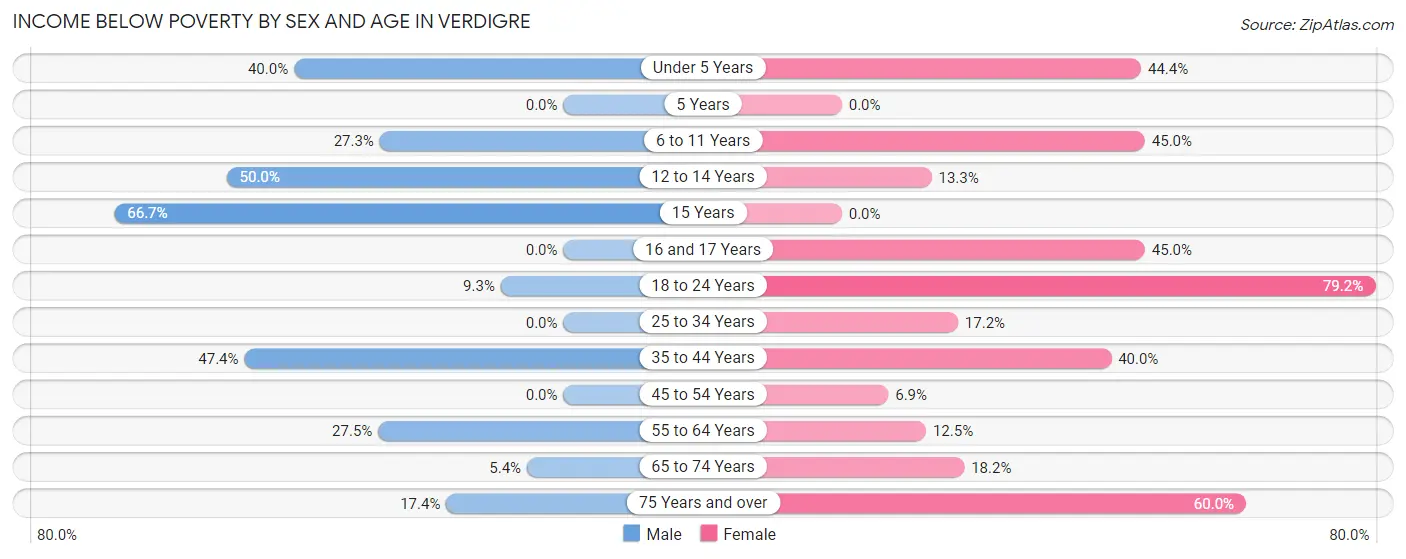
| Age Bracket | Male | Female |
| Under 5 Years | 16 (40.0%) | 4 (44.4%) |
| 5 Years | 0 (0.0%) | 0 (0.0%) |
| 6 to 11 Years | 6 (27.3%) | 9 (45.0%) |
| 12 to 14 Years | 6 (50.0%) | 2 (13.3%) |
| 15 Years | 2 (66.7%) | 0 (0.0%) |
| 16 and 17 Years | 0 (0.0%) | 9 (45.0%) |
| 18 to 24 Years | 4 (9.3%) | 19 (79.2%) |
| 25 to 34 Years | 0 (0.0%) | 5 (17.2%) |
| 35 to 44 Years | 9 (47.4%) | 12 (40.0%) |
| 45 to 54 Years | 0 (0.0%) | 2 (6.9%) |
| 55 to 64 Years | 11 (27.5%) | 5 (12.5%) |
| 65 to 74 Years | 2 (5.4%) | 6 (18.2%) |
| 75 Years and over | 4 (17.4%) | 12 (60.0%) |
| Total | 60 (20.1%) | 85 (31.4%) |
Income Above Poverty by Sex and Age in Verdigre
According to the poverty statistics in Verdigre, males aged 5 years and females aged 15 years are the age groups that are most secure financially, with 100.0% of males and 100.0% of females in these age groups living above the poverty line.
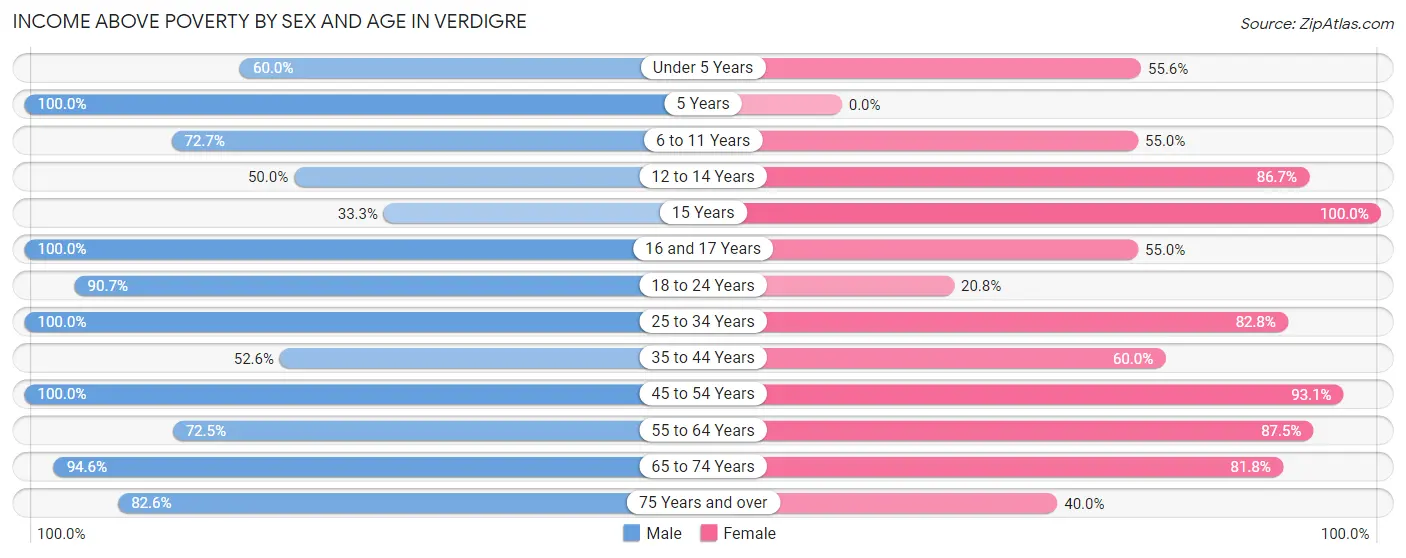
| Age Bracket | Male | Female |
| Under 5 Years | 24 (60.0%) | 5 (55.6%) |
| 5 Years | 5 (100.0%) | 0 (0.0%) |
| 6 to 11 Years | 16 (72.7%) | 11 (55.0%) |
| 12 to 14 Years | 6 (50.0%) | 13 (86.7%) |
| 15 Years | 1 (33.3%) | 2 (100.0%) |
| 16 and 17 Years | 5 (100.0%) | 11 (55.0%) |
| 18 to 24 Years | 39 (90.7%) | 5 (20.8%) |
| 25 to 34 Years | 22 (100.0%) | 24 (82.8%) |
| 35 to 44 Years | 10 (52.6%) | 18 (60.0%) |
| 45 to 54 Years | 27 (100.0%) | 27 (93.1%) |
| 55 to 64 Years | 29 (72.5%) | 35 (87.5%) |
| 65 to 74 Years | 35 (94.6%) | 27 (81.8%) |
| 75 Years and over | 19 (82.6%) | 8 (40.0%) |
| Total | 238 (79.9%) | 186 (68.6%) |
Income Below Poverty Among Married-Couple Families in Verdigre
The poverty statistics for married-couple families in Verdigre show that 3.4% or 4 of the total 117 families live below the poverty line. Families with 3 or 4 children have the highest poverty rate of 7.7%, comprising of 2 families. On the other hand, families with 1 or 2 children have the lowest poverty rate of 0.0%, which includes 0 families.
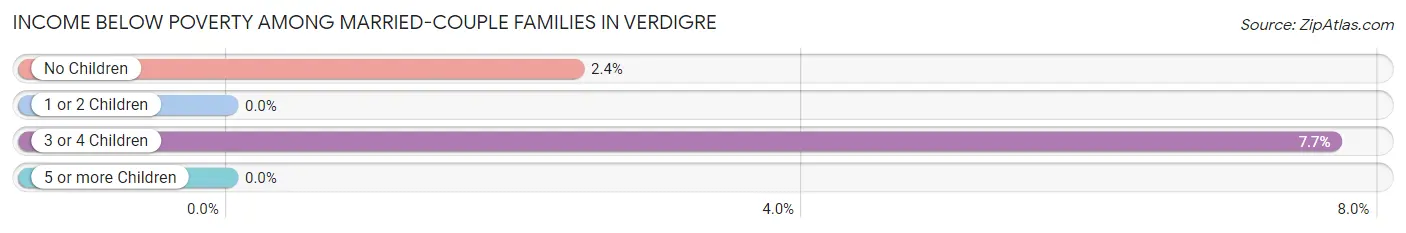
| Children | Above Poverty | Below Poverty |
| No Children | 81 (97.6%) | 2 (2.4%) |
| 1 or 2 Children | 8 (100.0%) | 0 (0.0%) |
| 3 or 4 Children | 24 (92.3%) | 2 (7.7%) |
| 5 or more Children | 0 (0.0%) | 0 (0.0%) |
| Total | 113 (96.6%) | 4 (3.4%) |
Income Below Poverty Among Single-Parent Households in Verdigre
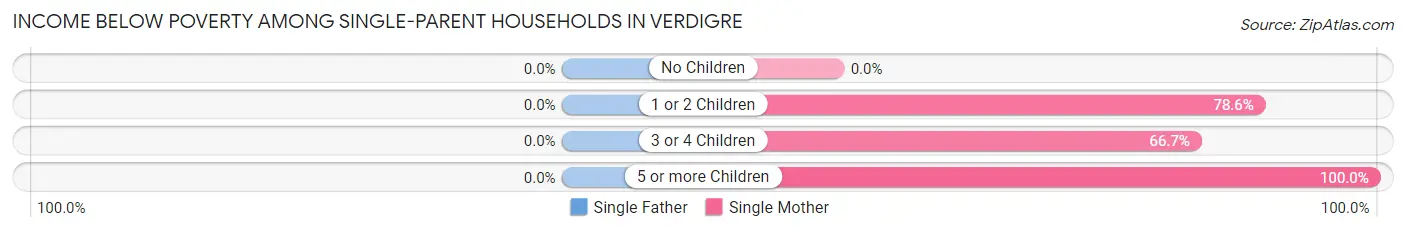
| Children | Single Father | Single Mother |
| No Children | 0 (0.0%) | 0 (0.0%) |
| 1 or 2 Children | 0 (0.0%) | 11 (78.6%) |
| 3 or 4 Children | 0 (0.0%) | 2 (66.7%) |
| 5 or more Children | 0 (0.0%) | 5 (100.0%) |
| Total | 0 (0.0%) | 18 (72.0%) |
Income Below Poverty Among Married-Couple vs Single-Parent Households in Verdigre
The poverty data for Verdigre shows that 4 of the married-couple family households (3.4%) and 18 of the single-parent households (58.1%) are living below the poverty level. Within the married-couple family households, those with 3 or 4 children have the highest poverty rate, with 2 households (7.7%) falling below the poverty line. Among the single-parent households, those with 5 or more children have the highest poverty rate, with 5 household (100.0%) living below poverty.
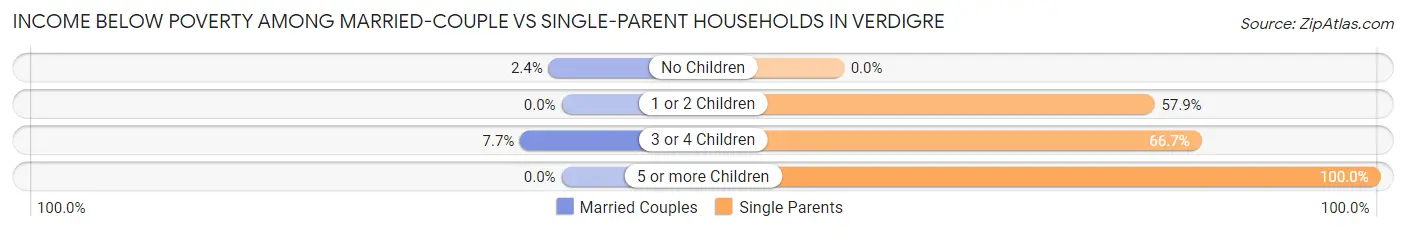
| Children | Married-Couple Families | Single-Parent Households |
| No Children | 2 (2.4%) | 0 (0.0%) |
| 1 or 2 Children | 0 (0.0%) | 11 (57.9%) |
| 3 or 4 Children | 2 (7.7%) | 2 (66.7%) |
| 5 or more Children | 0 (0.0%) | 5 (100.0%) |
| Total | 4 (3.4%) | 18 (58.1%) |
Race in Verdigre
The most populous races in Verdigre are White / Caucasian (462 | 75.9%), Native / Alaskan (123 | 20.2%), and Hispanic or Latino (13 | 2.1%).
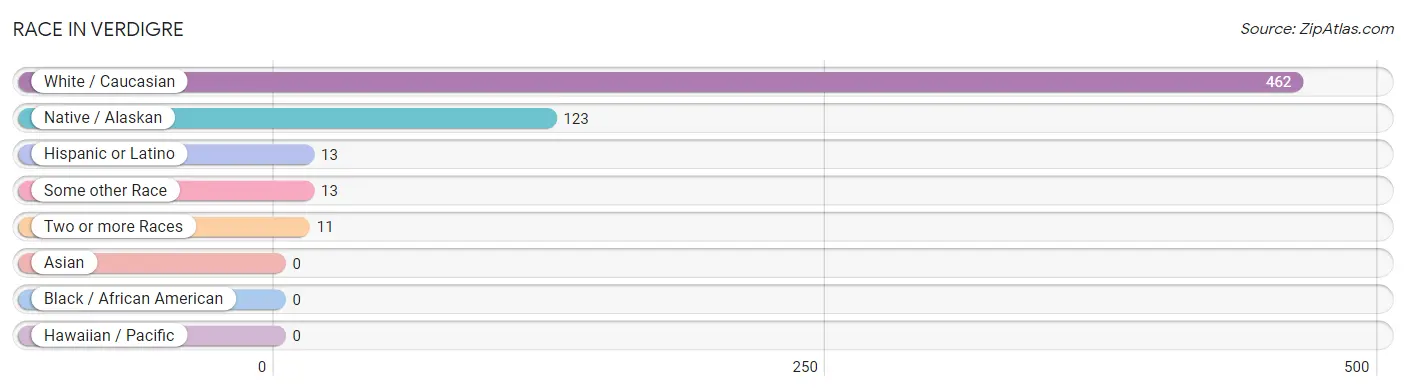
| Race | # Population | % Population |
| Asian | 0 | 0.0% |
| Black / African American | 0 | 0.0% |
| Hawaiian / Pacific | 0 | 0.0% |
| Hispanic or Latino | 13 | 2.1% |
| Native / Alaskan | 123 | 20.2% |
| White / Caucasian | 462 | 75.9% |
| Two or more Races | 11 | 1.8% |
| Some other Race | 13 | 2.1% |
| Total | 609 | 100.0% |
Ancestry in Verdigre
The most populous ancestries reported in Verdigre are German (187 | 30.7%), Czech (185 | 30.4%), Sioux (45 | 7.4%), American (28 | 4.6%), and Irish (26 | 4.3%), together accounting for 77.3% of all Verdigre residents.
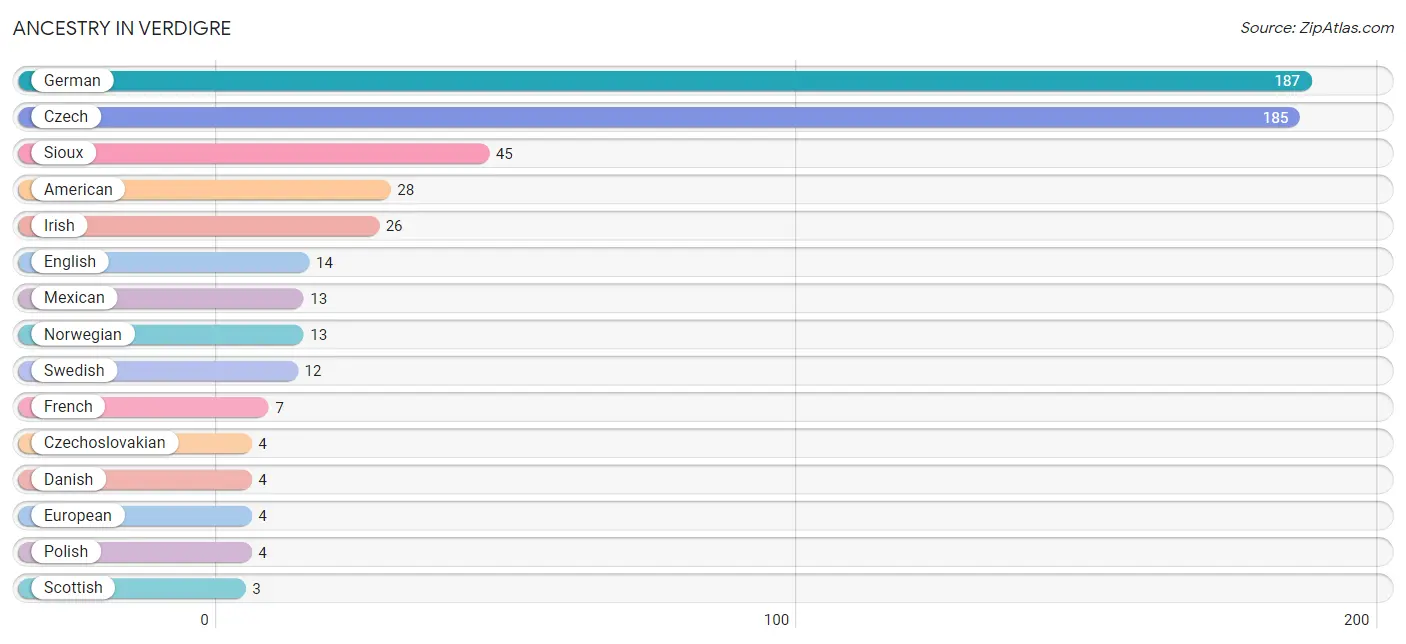
| Ancestry | # Population | % Population |
| American | 28 | 4.6% |
| Czech | 185 | 30.4% |
| Czechoslovakian | 4 | 0.7% |
| Danish | 4 | 0.7% |
| English | 14 | 2.3% |
| European | 4 | 0.7% |
| Finnish | 2 | 0.3% |
| French | 7 | 1.1% |
| German | 187 | 30.7% |
| Irish | 26 | 4.3% |
| Italian | 2 | 0.3% |
| Mexican | 13 | 2.1% |
| Norwegian | 13 | 2.1% |
| Polish | 4 | 0.7% |
| Scottish | 3 | 0.5% |
| Sioux | 45 | 7.4% |
| Swedish | 12 | 2.0% | View All 17 Rows |
Immigrants in Verdigre

| Immigration Origin | # Population | % Population | View All 0 Rows |
Sex and Age in Verdigre
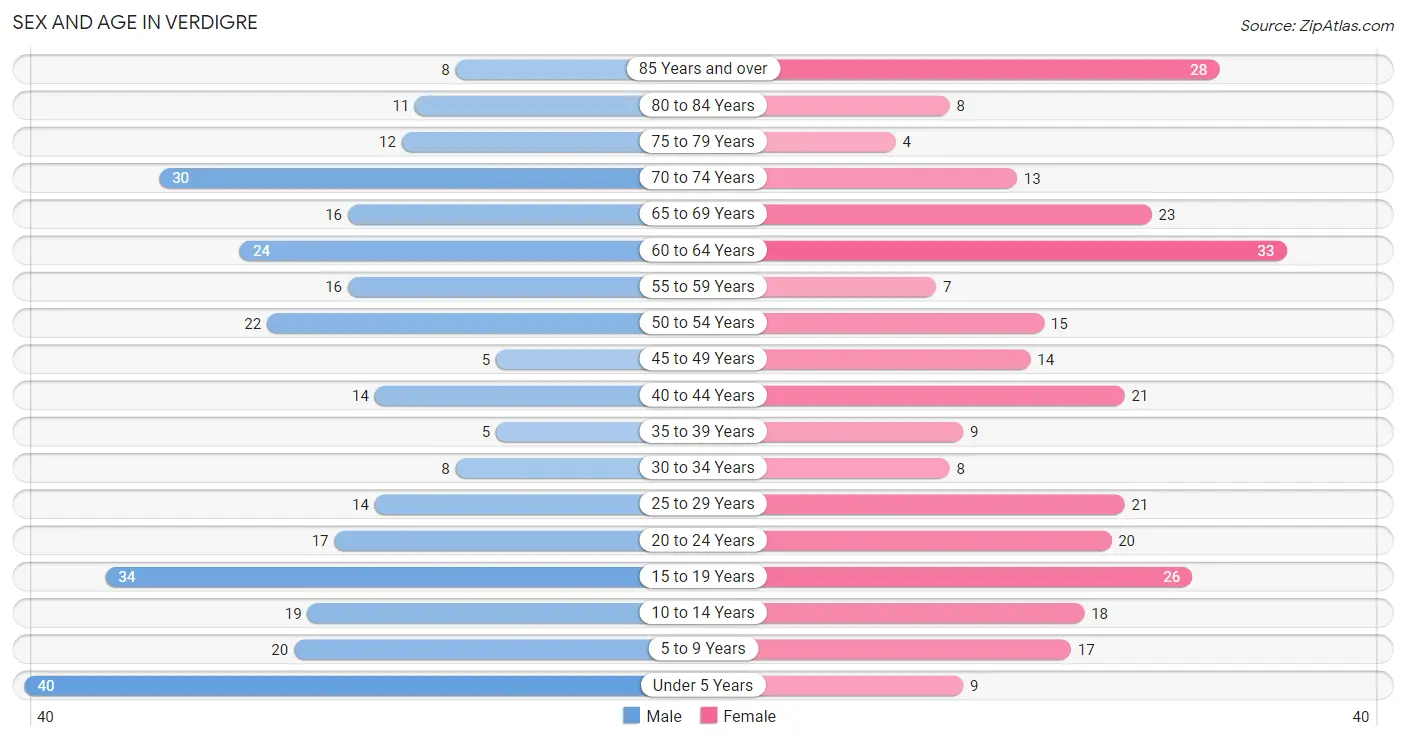
Sex and Age in Verdigre
The most populous age groups in Verdigre are Under 5 Years (40 | 12.7%) for men and 60 to 64 Years (33 | 11.2%) for women.
| Age Bracket | Male | Female |
| Under 5 Years | 40 (12.7%) | 9 (3.1%) |
| 5 to 9 Years | 20 (6.4%) | 17 (5.8%) |
| 10 to 14 Years | 19 (6.0%) | 18 (6.1%) |
| 15 to 19 Years | 34 (10.8%) | 26 (8.8%) |
| 20 to 24 Years | 17 (5.4%) | 20 (6.8%) |
| 25 to 29 Years | 14 (4.4%) | 21 (7.1%) |
| 30 to 34 Years | 8 (2.5%) | 8 (2.7%) |
| 35 to 39 Years | 5 (1.6%) | 9 (3.1%) |
| 40 to 44 Years | 14 (4.4%) | 21 (7.1%) |
| 45 to 49 Years | 5 (1.6%) | 14 (4.8%) |
| 50 to 54 Years | 22 (7.0%) | 15 (5.1%) |
| 55 to 59 Years | 16 (5.1%) | 7 (2.4%) |
| 60 to 64 Years | 24 (7.6%) | 33 (11.2%) |
| 65 to 69 Years | 16 (5.1%) | 23 (7.8%) |
| 70 to 74 Years | 30 (9.5%) | 13 (4.4%) |
| 75 to 79 Years | 12 (3.8%) | 4 (1.4%) |
| 80 to 84 Years | 11 (3.5%) | 8 (2.7%) |
| 85 Years and over | 8 (2.5%) | 28 (9.5%) |
| Total | 315 (100.0%) | 294 (100.0%) |
Families and Households in Verdigre
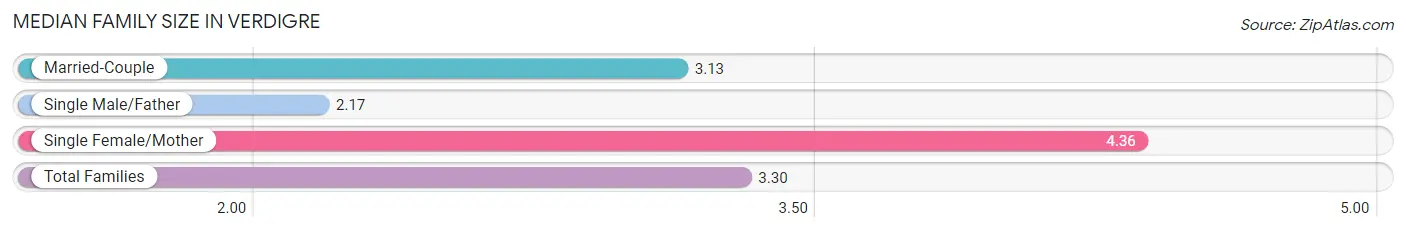
Median Family Size in Verdigre
The median family size in Verdigre is 3.30 persons per family, with single female/mother families (25 | 16.9%) accounting for the largest median family size of 4.36 persons per family. On the other hand, single male/father families (6 | 4.1%) represent the smallest median family size with 2.17 persons per family.
| Family Type | # Families | Family Size |
| Married-Couple | 117 (79.0%) | 3.13 |
| Single Male/Father | 6 (4.1%) | 2.17 |
| Single Female/Mother | 25 (16.9%) | 4.36 |
| Total Families | 148 (100.0%) | 3.30 |
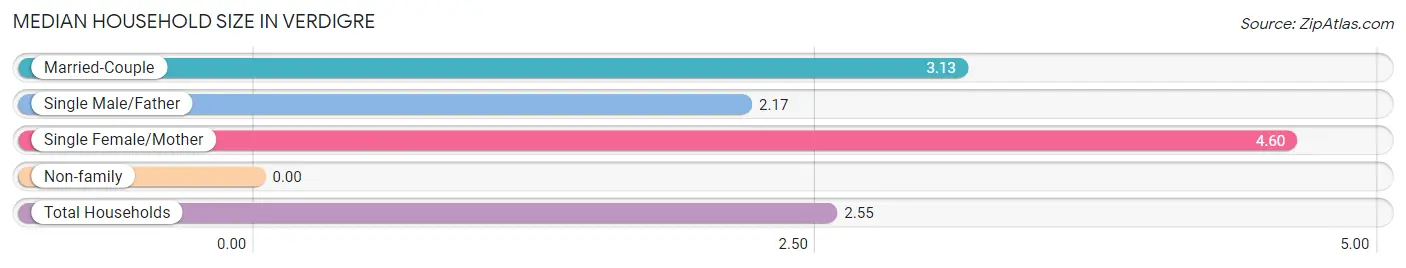
Median Household Size in Verdigre
| Household Type | # Households | Household Size |
| Married-Couple | 117 (52.5%) | 3.13 |
| Single Male/Father | 6 (2.7%) | 2.17 |
| Single Female/Mother | 25 (11.2%) | 4.60 |
| Non-family | 75 (33.6%) | - |
| Total Households | 223 (100.0%) | 2.55 |
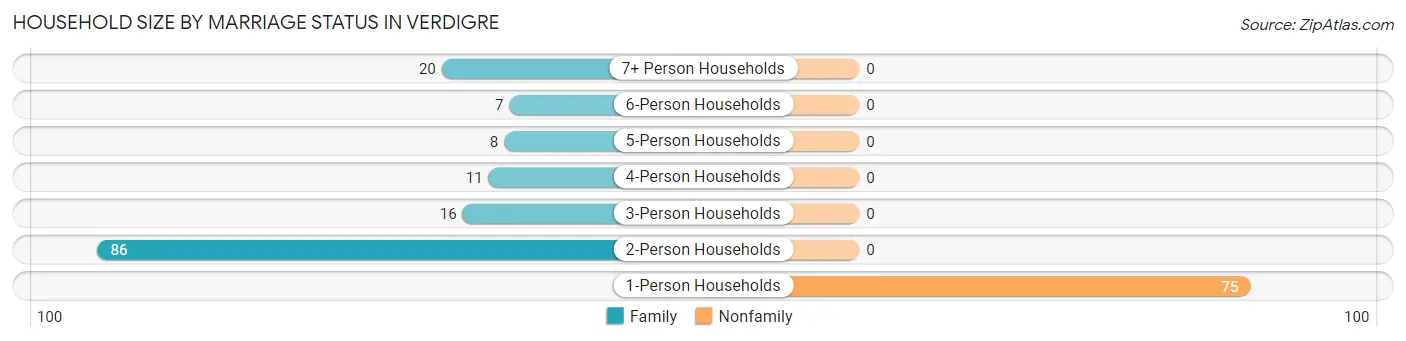
Household Size by Marriage Status in Verdigre
Out of a total of 223 households in Verdigre, 148 (66.4%) are family households, while 75 (33.6%) are nonfamily households. The most numerous type of family households are 2-person households, comprising 86, and the most common type of nonfamily households are 1-person households, comprising 75.
| Household Size | Family Households | Nonfamily Households |
| 1-Person Households | - | 75 (33.6%) |
| 2-Person Households | 86 (38.6%) | 0 (0.0%) |
| 3-Person Households | 16 (7.2%) | 0 (0.0%) |
| 4-Person Households | 11 (4.9%) | 0 (0.0%) |
| 5-Person Households | 8 (3.6%) | 0 (0.0%) |
| 6-Person Households | 7 (3.1%) | 0 (0.0%) |
| 7+ Person Households | 20 (9.0%) | 0 (0.0%) |
| Total | 148 (66.4%) | 75 (33.6%) |
Female Fertility in Verdigre
Fertility by Age in Verdigre
Average fertility rate in Verdigre is 269.0 births per 1,000 women. Women in the age bracket of 20 to 34 years have the highest fertility rate with 592.0 births per 1,000 women. Women in the age bracket of 20 to 34 years acount for 90.6% of all women with births.
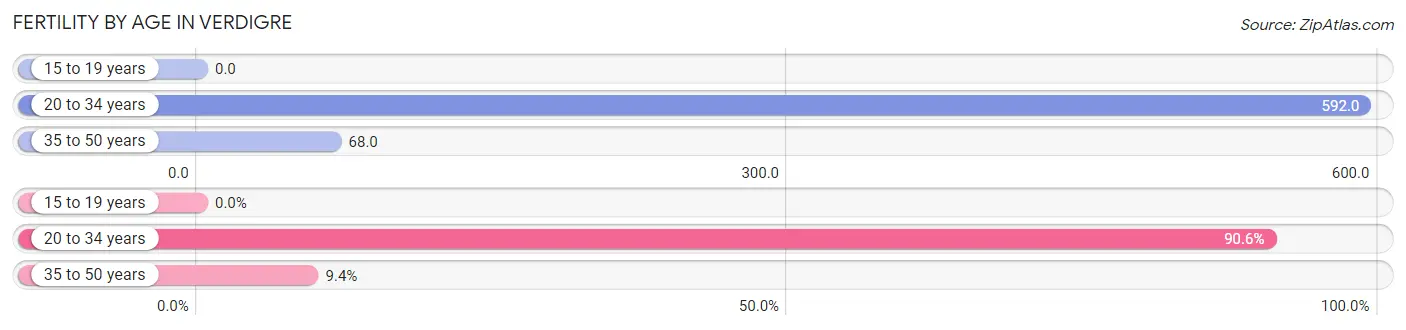
| Age Bracket | Women with Births | Births / 1,000 Women |
| 15 to 19 years | 0 (0.0%) | 0.0 |
| 20 to 34 years | 29 (90.6%) | 592.0 |
| 35 to 50 years | 3 (9.4%) | 68.0 |
| Total | 32 (100.0%) | 269.0 |
Fertility by Age by Marriage Status in Verdigre
56.2% of women with births (32) in Verdigre are married. The highest percentage of unmarried women with births falls into 35 to 50 years age bracket with 100.0% of them unmarried at the time of birth, while the lowest percentage of unmarried women with births belong to 20 to 34 years age bracket with 37.9% of them unmarried.
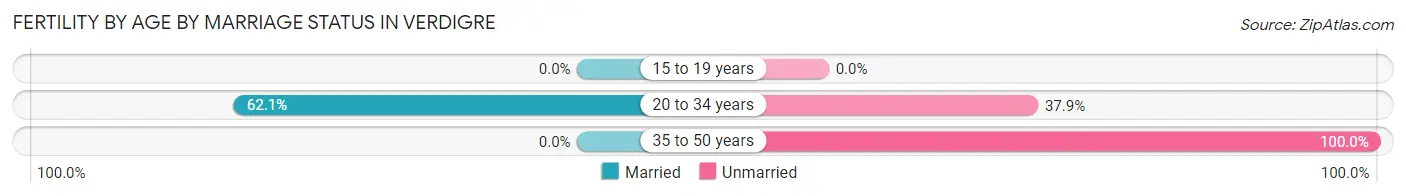
| Age Bracket | Married | Unmarried |
| 15 to 19 years | 0 (0.0%) | 0 (0.0%) |
| 20 to 34 years | 18 (62.1%) | 11 (37.9%) |
| 35 to 50 years | 0 (0.0%) | 3 (100.0%) |
| Total | 18 (56.2%) | 14 (43.8%) |
Fertility by Education in Verdigre
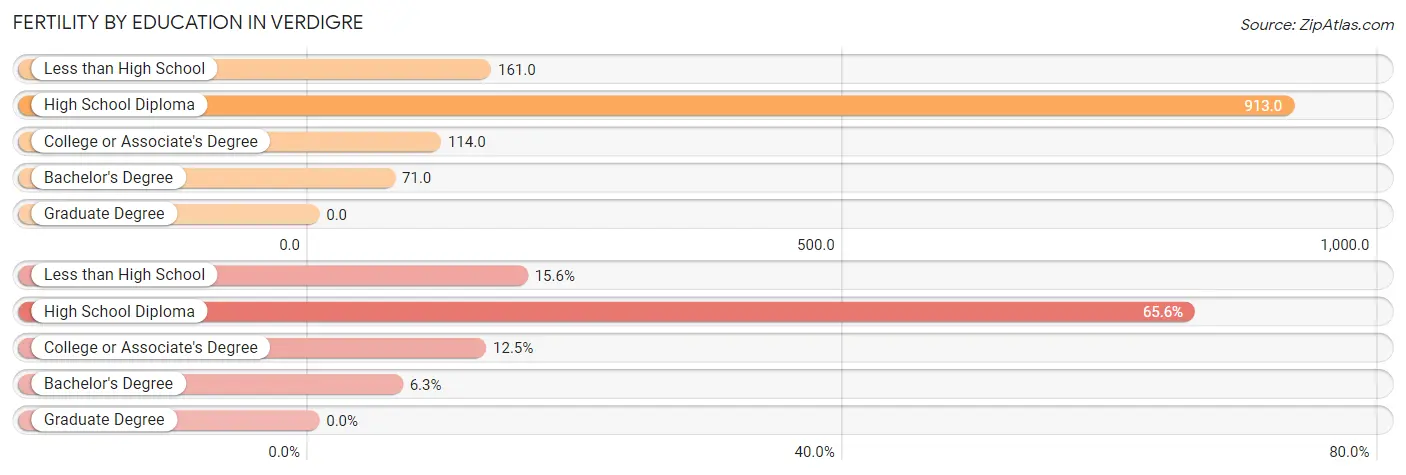
| Educational Attainment | Women with Births | Births / 1,000 Women |
| Less than High School | 5 (15.6%) | 161.0 |
| High School Diploma | 21 (65.6%) | 913.0 |
| College or Associate's Degree | 4 (12.5%) | 114.0 |
| Bachelor's Degree | 2 (6.2%) | 71.0 |
| Graduate Degree | 0 (0.0%) | 0.0 |
| Total | 32 (100.0%) | 269.0 |
Fertility by Education by Marriage Status in Verdigre
43.8% of women with births in Verdigre are unmarried. Women with the educational attainment of college or associate's degree are most likely to be married with 100.0% of them married at childbirth, while women with the educational attainment of less than high school are least likely to be married with 100.0% of them unmarried at childbirth.
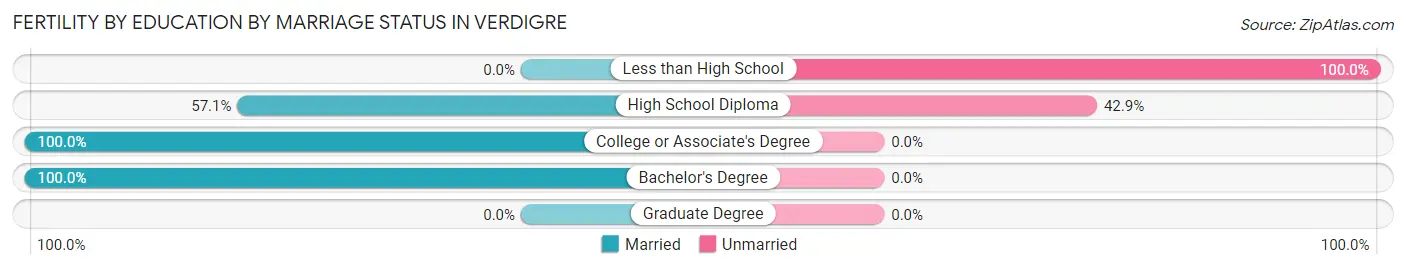
| Educational Attainment | Married | Unmarried |
| Less than High School | 0 (0.0%) | 5 (100.0%) |
| High School Diploma | 12 (57.1%) | 9 (42.9%) |
| College or Associate's Degree | 4 (100.0%) | 0 (0.0%) |
| Bachelor's Degree | 2 (100.0%) | 0 (0.0%) |
| Graduate Degree | 0 (0.0%) | 0 (0.0%) |
| Total | 18 (56.2%) | 14 (43.8%) |
Employment Characteristics in Verdigre
Employment by Class of Employer in Verdigre
Among the 238 employed individuals in Verdigre, private company employees (147 | 61.8%), not-for-profit organizations (32 | 13.5%), and local government employees (25 | 10.5%) make up the most common classes of employment.
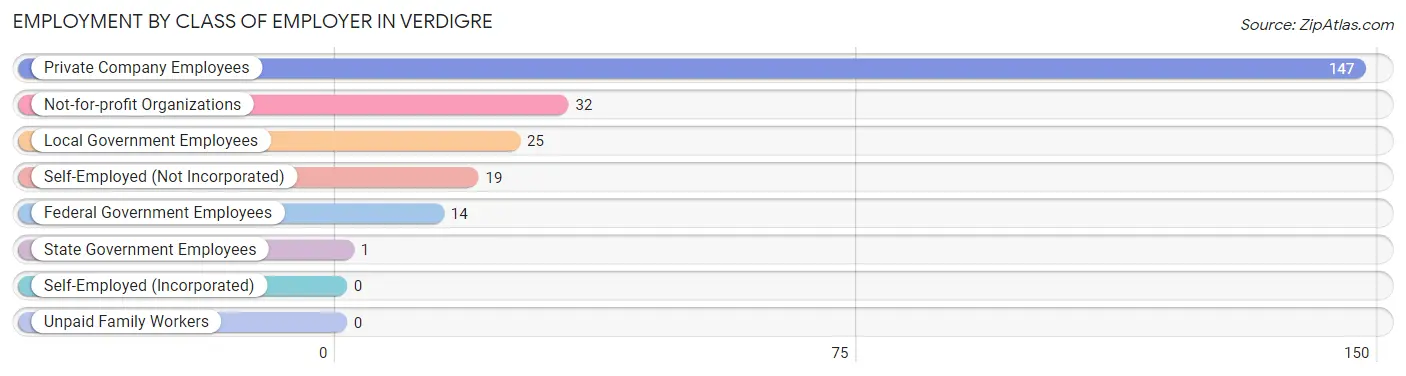
| Employer Class | # Employees | % Employees |
| Private Company Employees | 147 | 61.8% |
| Self-Employed (Incorporated) | 0 | 0.0% |
| Self-Employed (Not Incorporated) | 19 | 8.0% |
| Not-for-profit Organizations | 32 | 13.5% |
| Local Government Employees | 25 | 10.5% |
| State Government Employees | 1 | 0.4% |
| Federal Government Employees | 14 | 5.9% |
| Unpaid Family Workers | 0 | 0.0% |
| Total | 238 | 100.0% |
Employment Status by Age in Verdigre
According to the labor force statistics for Verdigre, out of the total population over 16 years of age (481), 55.1% or 265 individuals are in the labor force, with 5.3% or 14 of them unemployed. The age group with the highest labor force participation rate is 25 to 29 years, with 100.0% or 35 individuals in the labor force. Within the labor force, the 20 to 24 years age range has the highest percentage of unemployed individuals, with 18.2% or 4 of them being unemployed.
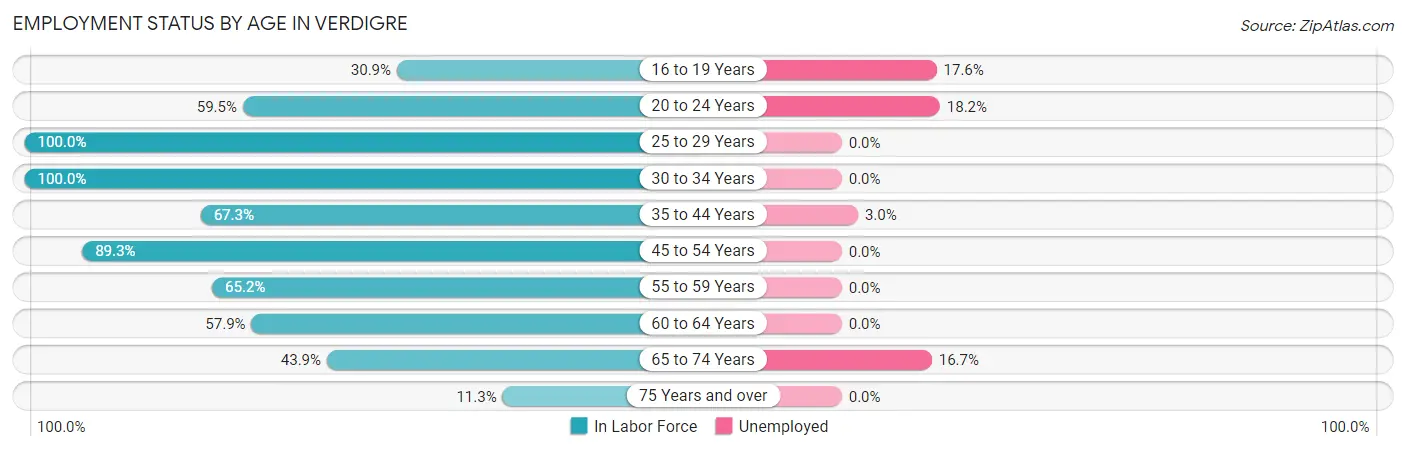
| Age Bracket | In Labor Force | Unemployed |
| 16 to 19 Years | 17 (30.9%) | 3 (17.6%) |
| 20 to 24 Years | 22 (59.5%) | 4 (18.2%) |
| 25 to 29 Years | 35 (100.0%) | 0 (0.0%) |
| 30 to 34 Years | 16 (100.0%) | 0 (0.0%) |
| 35 to 44 Years | 33 (67.3%) | 1 (3.0%) |
| 45 to 54 Years | 50 (89.3%) | 0 (0.0%) |
| 55 to 59 Years | 15 (65.2%) | 0 (0.0%) |
| 60 to 64 Years | 33 (57.9%) | 0 (0.0%) |
| 65 to 74 Years | 36 (43.9%) | 6 (16.7%) |
| 75 Years and over | 8 (11.3%) | 0 (0.0%) |
| Total | 265 (55.1%) | 14 (5.3%) |
Employment Status by Educational Attainment in Verdigre
According to labor force statistics for Verdigre, 77.1% of individuals (182) out of the total population between 25 and 64 years of age (236) are in the labor force, with 0.5% or 1 of them being unemployed. The group with the highest labor force participation rate are those with the educational attainment of bachelor's degree or higher, with 87.2% or 41 individuals in the labor force. Within the labor force, individuals with high school diploma education have the highest percentage of unemployment, with 1.7% or 1 of them being unemployed.
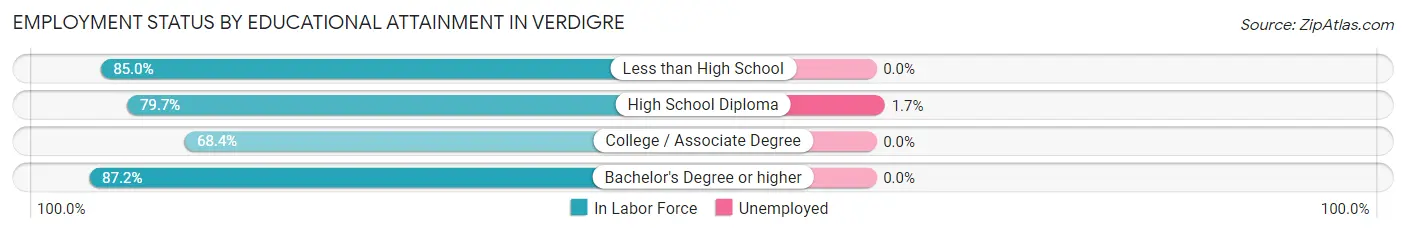
| Educational Attainment | In Labor Force | Unemployed |
| Less than High School | 17 (85.0%) | 0 (0.0%) |
| High School Diploma | 59 (79.7%) | 1 (1.7%) |
| College / Associate Degree | 65 (68.4%) | 0 (0.0%) |
| Bachelor's Degree or higher | 41 (87.2%) | 0 (0.0%) |
| Total | 182 (77.1%) | 1 (0.5%) |
Employment Occupations by Sex in Verdigre
Management, Business, Science and Arts Occupations
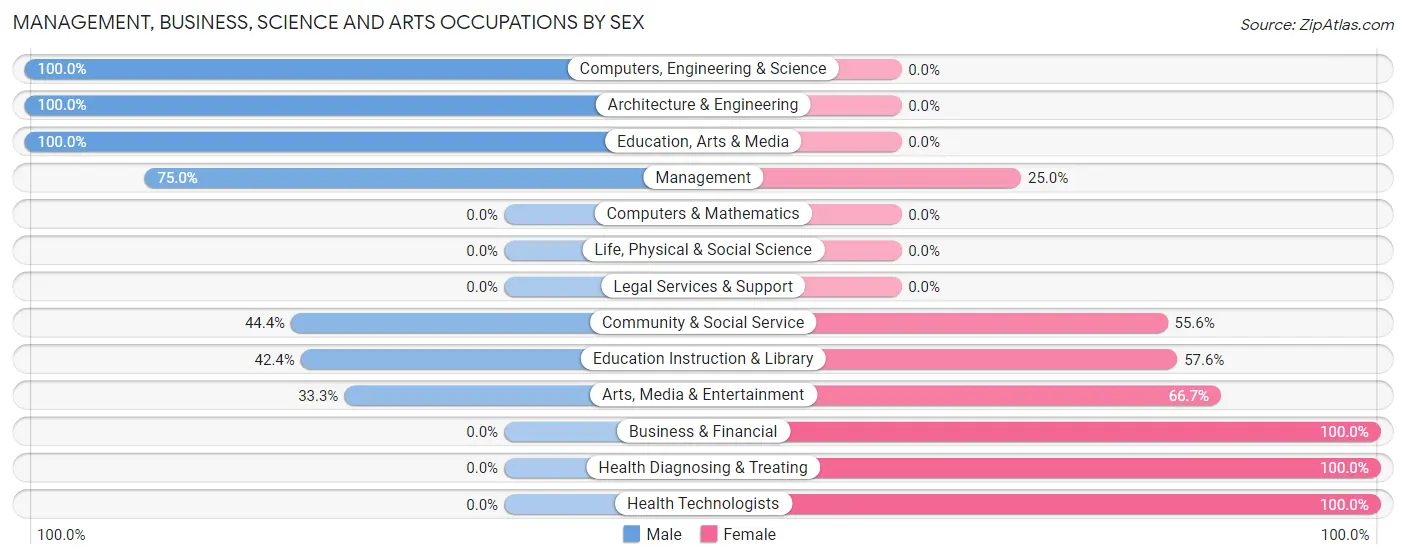
The most common Management, Business, Science and Arts occupations in Verdigre are Community & Social Service (45 | 17.9%), Education Instruction & Library (33 | 13.2%), Management (16 | 6.4%), Health Diagnosing & Treating (15 | 6.0%), and Health Technologists (15 | 6.0%).
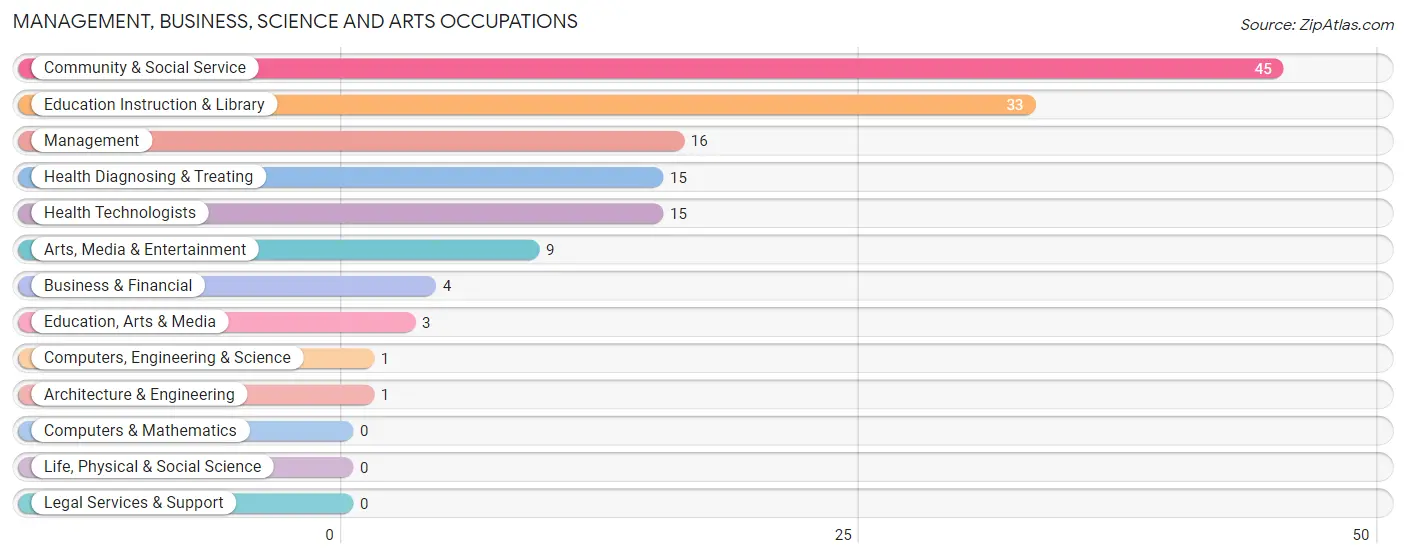
Management, Business, Science and Arts Occupations by Sex
Within the Management, Business, Science and Arts occupations in Verdigre, the most male-oriented occupations are Computers, Engineering & Science (100.0%), Architecture & Engineering (100.0%), and Education, Arts & Media (100.0%), while the most female-oriented occupations are Business & Financial (100.0%), Health Diagnosing & Treating (100.0%), and Health Technologists (100.0%).
| Occupation | Male | Female |
| Management | 12 (75.0%) | 4 (25.0%) |
| Business & Financial | 0 (0.0%) | 4 (100.0%) |
| Computers, Engineering & Science | 1 (100.0%) | 0 (0.0%) |
| Computers & Mathematics | 0 (0.0%) | 0 (0.0%) |
| Architecture & Engineering | 1 (100.0%) | 0 (0.0%) |
| Life, Physical & Social Science | 0 (0.0%) | 0 (0.0%) |
| Community & Social Service | 20 (44.4%) | 25 (55.6%) |
| Education, Arts & Media | 3 (100.0%) | 0 (0.0%) |
| Legal Services & Support | 0 (0.0%) | 0 (0.0%) |
| Education Instruction & Library | 14 (42.4%) | 19 (57.6%) |
| Arts, Media & Entertainment | 3 (33.3%) | 6 (66.7%) |
| Health Diagnosing & Treating | 0 (0.0%) | 15 (100.0%) |
| Health Technologists | 0 (0.0%) | 15 (100.0%) |
| Total (Category) | 33 (40.7%) | 48 (59.3%) |
| Total (Overall) | 131 (52.2%) | 120 (47.8%) |
Services Occupations
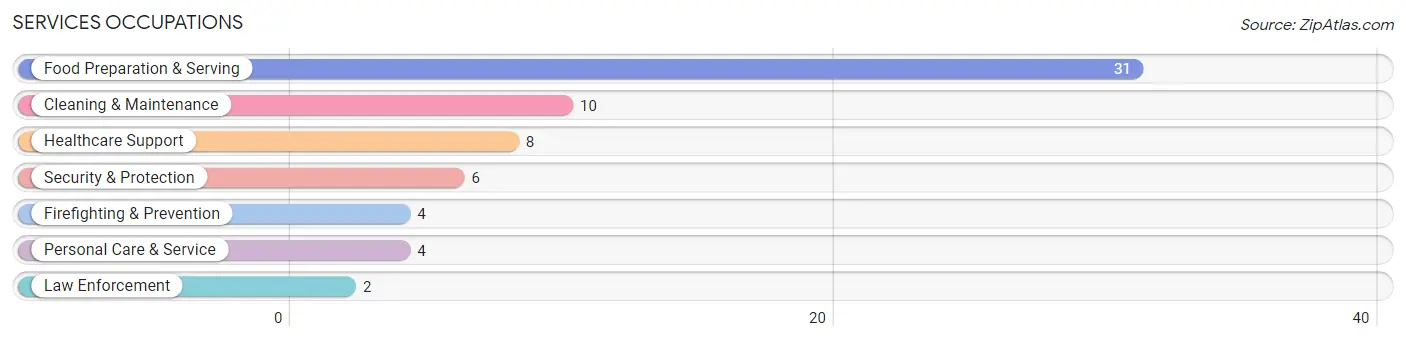
The most common Services occupations in Verdigre are Food Preparation & Serving (31 | 12.3%), Cleaning & Maintenance (10 | 4.0%), Healthcare Support (8 | 3.2%), Security & Protection (6 | 2.4%), and Firefighting & Prevention (4 | 1.6%).
Services Occupations by Sex
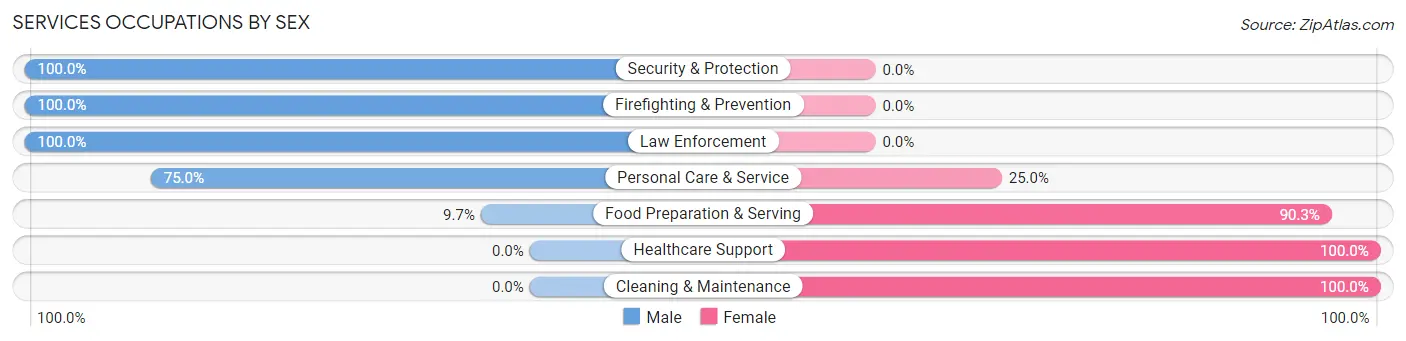
Within the Services occupations in Verdigre, the most male-oriented occupations are Security & Protection (100.0%), Firefighting & Prevention (100.0%), and Law Enforcement (100.0%), while the most female-oriented occupations are Healthcare Support (100.0%), Cleaning & Maintenance (100.0%), and Food Preparation & Serving (90.3%).
| Occupation | Male | Female |
| Healthcare Support | 0 (0.0%) | 8 (100.0%) |
| Security & Protection | 6 (100.0%) | 0 (0.0%) |
| Firefighting & Prevention | 4 (100.0%) | 0 (0.0%) |
| Law Enforcement | 2 (100.0%) | 0 (0.0%) |
| Food Preparation & Serving | 3 (9.7%) | 28 (90.3%) |
| Cleaning & Maintenance | 0 (0.0%) | 10 (100.0%) |
| Personal Care & Service | 3 (75.0%) | 1 (25.0%) |
| Total (Category) | 12 (20.3%) | 47 (79.7%) |
| Total (Overall) | 131 (52.2%) | 120 (47.8%) |
Sales and Office Occupations
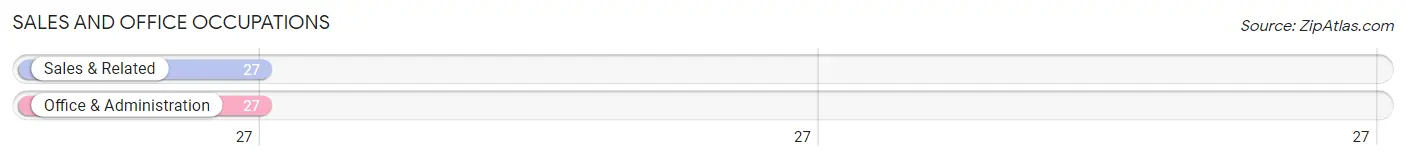
The most common Sales and Office occupations in Verdigre are Sales & Related (27 | 10.8%), and Office & Administration (27 | 10.8%).
Sales and Office Occupations by Sex
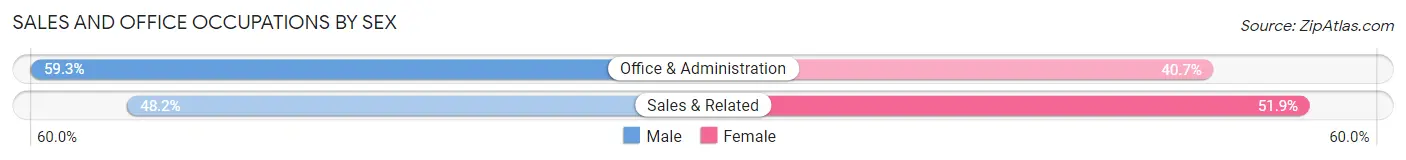
| Occupation | Male | Female |
| Sales & Related | 13 (48.1%) | 14 (51.8%) |
| Office & Administration | 16 (59.3%) | 11 (40.7%) |
| Total (Category) | 29 (53.7%) | 25 (46.3%) |
| Total (Overall) | 131 (52.2%) | 120 (47.8%) |
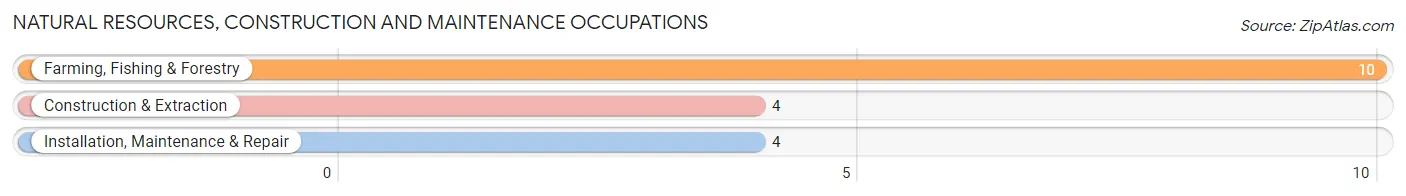
Natural Resources, Construction and Maintenance Occupations
The most common Natural Resources, Construction and Maintenance occupations in Verdigre are Farming, Fishing & Forestry (10 | 4.0%), Construction & Extraction (4 | 1.6%), and Installation, Maintenance & Repair (4 | 1.6%).
Natural Resources, Construction and Maintenance Occupations by Sex
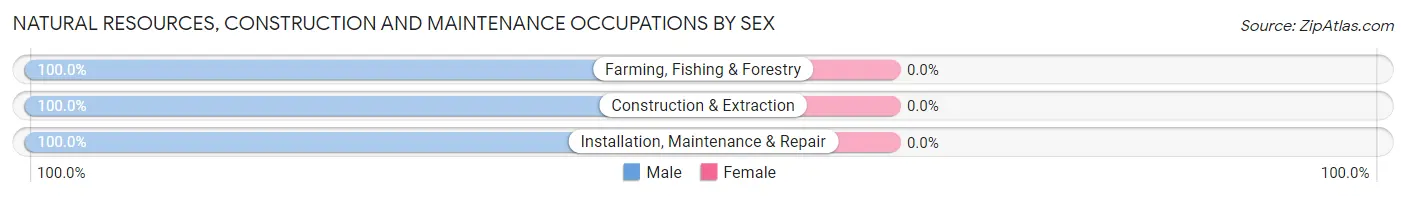
| Occupation | Male | Female |
| Farming, Fishing & Forestry | 10 (100.0%) | 0 (0.0%) |
| Construction & Extraction | 4 (100.0%) | 0 (0.0%) |
| Installation, Maintenance & Repair | 4 (100.0%) | 0 (0.0%) |
| Total (Category) | 18 (100.0%) | 0 (0.0%) |
| Total (Overall) | 131 (52.2%) | 120 (47.8%) |
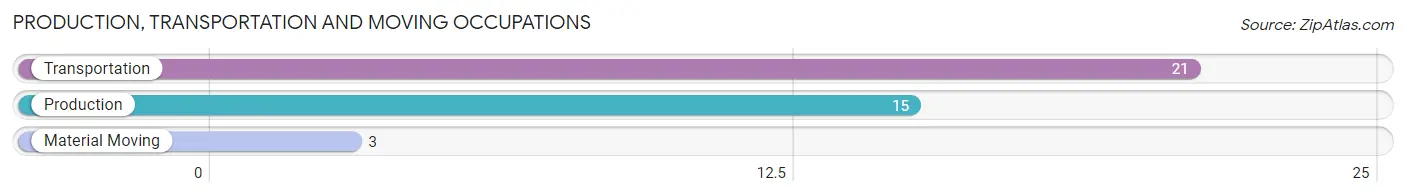
Production, Transportation and Moving Occupations
The most common Production, Transportation and Moving occupations in Verdigre are Transportation (21 | 8.4%), Production (15 | 6.0%), and Material Moving (3 | 1.2%).
Production, Transportation and Moving Occupations by Sex
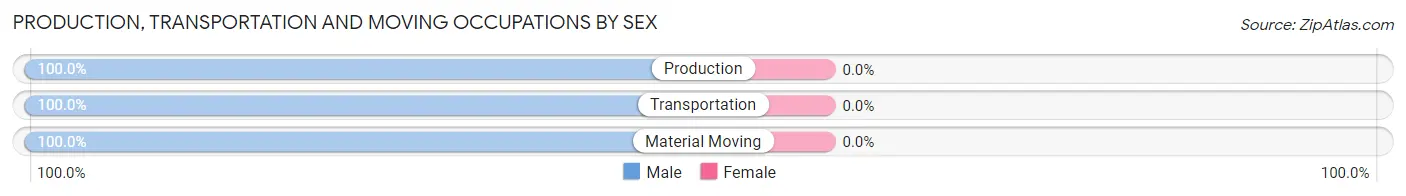
| Occupation | Male | Female |
| Production | 15 (100.0%) | 0 (0.0%) |
| Transportation | 21 (100.0%) | 0 (0.0%) |
| Material Moving | 3 (100.0%) | 0 (0.0%) |
| Total (Category) | 39 (100.0%) | 0 (0.0%) |
| Total (Overall) | 131 (52.2%) | 120 (47.8%) |
Employment Industries by Sex in Verdigre
Employment Industries in Verdigre
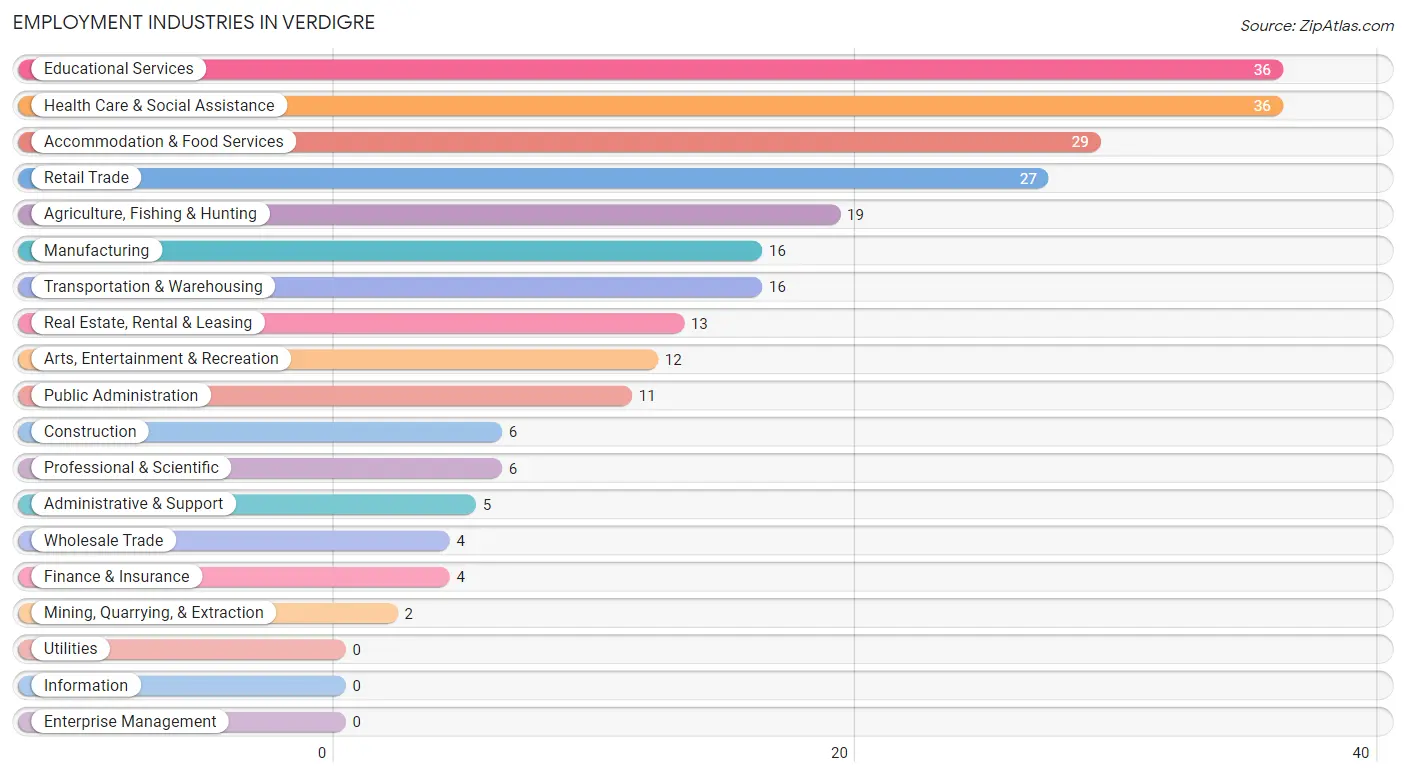
The major employment industries in Verdigre include Educational Services (36 | 14.3%), Health Care & Social Assistance (36 | 14.3%), Accommodation & Food Services (29 | 11.6%), Retail Trade (27 | 10.8%), and Agriculture, Fishing & Hunting (19 | 7.6%).
Employment Industries by Sex in Verdigre
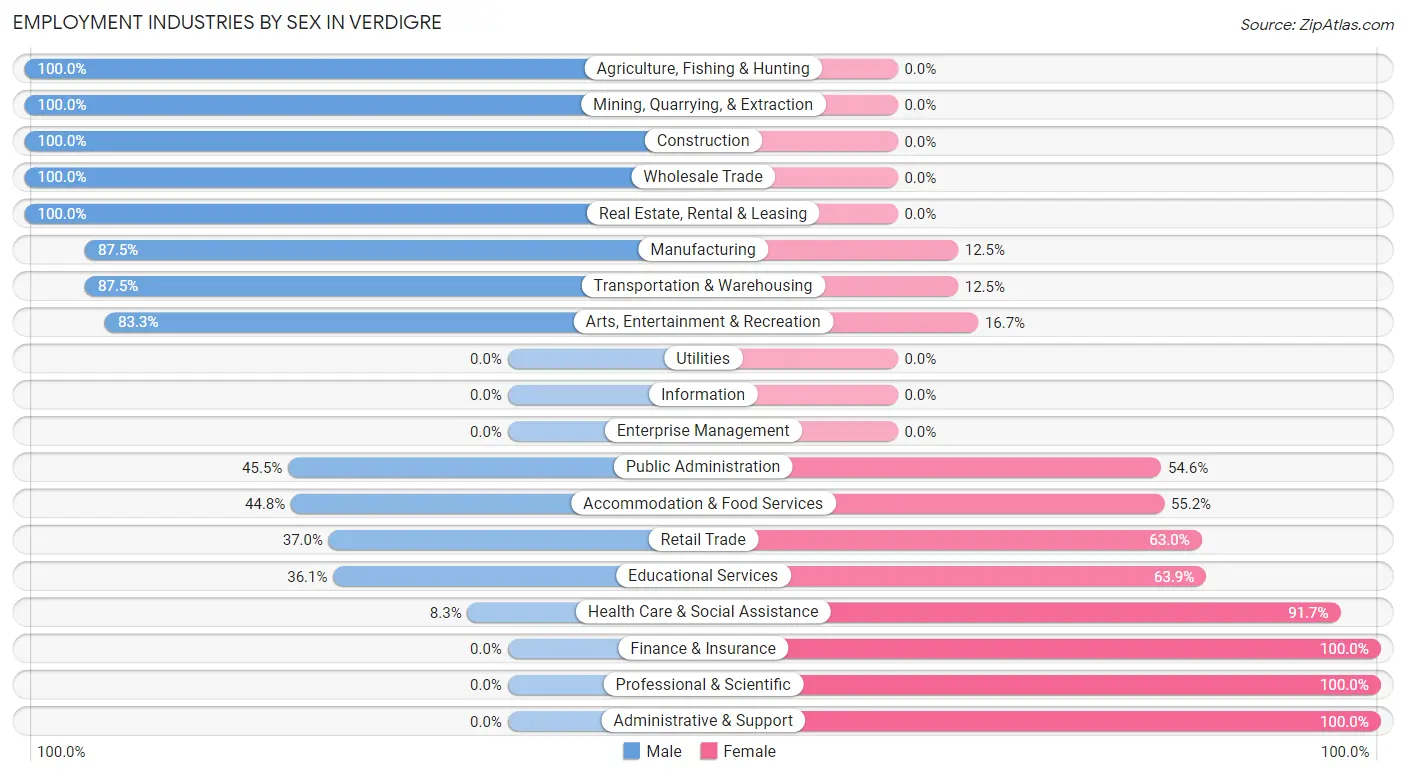
The Verdigre industries that see more men than women are Agriculture, Fishing & Hunting (100.0%), Mining, Quarrying, & Extraction (100.0%), and Construction (100.0%), whereas the industries that tend to have a higher number of women are Finance & Insurance (100.0%), Professional & Scientific (100.0%), and Administrative & Support (100.0%).
| Industry | Male | Female |
| Agriculture, Fishing & Hunting | 19 (100.0%) | 0 (0.0%) |
| Mining, Quarrying, & Extraction | 2 (100.0%) | 0 (0.0%) |
| Construction | 6 (100.0%) | 0 (0.0%) |
| Manufacturing | 14 (87.5%) | 2 (12.5%) |
| Wholesale Trade | 4 (100.0%) | 0 (0.0%) |
| Retail Trade | 10 (37.0%) | 17 (63.0%) |
| Transportation & Warehousing | 14 (87.5%) | 2 (12.5%) |
| Utilities | 0 (0.0%) | 0 (0.0%) |
| Information | 0 (0.0%) | 0 (0.0%) |
| Finance & Insurance | 0 (0.0%) | 4 (100.0%) |
| Real Estate, Rental & Leasing | 13 (100.0%) | 0 (0.0%) |
| Professional & Scientific | 0 (0.0%) | 6 (100.0%) |
| Enterprise Management | 0 (0.0%) | 0 (0.0%) |
| Administrative & Support | 0 (0.0%) | 5 (100.0%) |
| Educational Services | 13 (36.1%) | 23 (63.9%) |
| Health Care & Social Assistance | 3 (8.3%) | 33 (91.7%) |
| Arts, Entertainment & Recreation | 10 (83.3%) | 2 (16.7%) |
| Accommodation & Food Services | 13 (44.8%) | 16 (55.2%) |
| Public Administration | 5 (45.5%) | 6 (54.5%) |
| Total | 131 (52.2%) | 120 (47.8%) |
Education in Verdigre
School Enrollment in Verdigre
The most common levels of schooling among the 145 students in Verdigre are high school (49 | 33.8%), middle school (28 | 19.3%), and elementary school (26 | 17.9%).
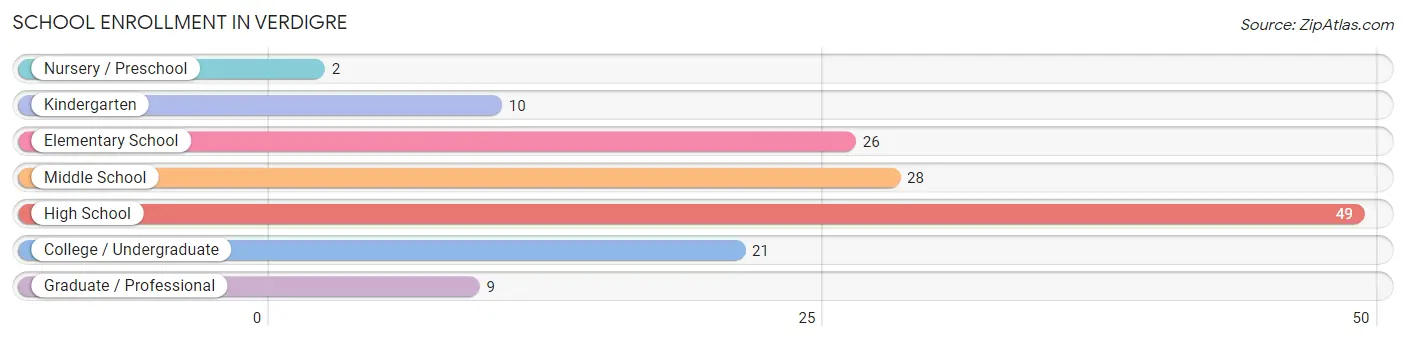
| School Level | # Students | % Students |
| Nursery / Preschool | 2 | 1.4% |
| Kindergarten | 10 | 6.9% |
| Elementary School | 26 | 17.9% |
| Middle School | 28 | 19.3% |
| High School | 49 | 33.8% |
| College / Undergraduate | 21 | 14.5% |
| Graduate / Professional | 9 | 6.2% |
| Total | 145 | 100.0% |
School Enrollment by Age by Funding Source in Verdigre
Out of a total of 145 students who are enrolled in schools in Verdigre, 1 (0.7%) attend a private institution, while the remaining 144 (99.3%) are enrolled in public schools. The age group of 35 years and over has the highest likelihood of being enrolled in private schools, with 1 (8.3% in the age bracket) enrolled. Conversely, the age group of 3 to 4 year olds has the lowest likelihood of being enrolled in a private school, with 2 (100.0% in the age bracket) attending a public institution.
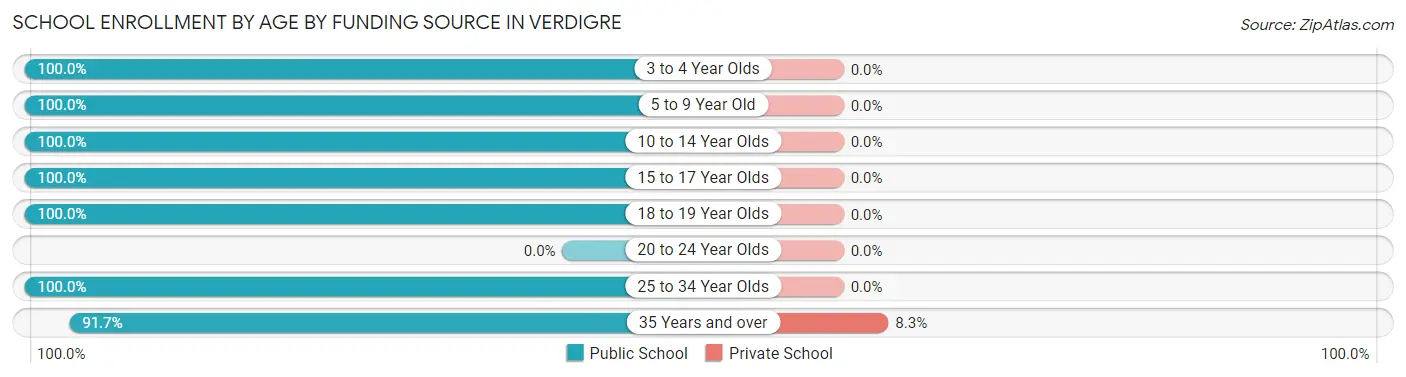
| Age Bracket | Public School | Private School |
| 3 to 4 Year Olds | 2 (100.0%) | 0 (0.0%) |
| 5 to 9 Year Old | 32 (100.0%) | 0 (0.0%) |
| 10 to 14 Year Olds | 37 (100.0%) | 0 (0.0%) |
| 15 to 17 Year Olds | 30 (100.0%) | 0 (0.0%) |
| 18 to 19 Year Olds | 27 (100.0%) | 0 (0.0%) |
| 20 to 24 Year Olds | 0 (0.0%) | 0 (0.0%) |
| 25 to 34 Year Olds | 5 (100.0%) | 0 (0.0%) |
| 35 Years and over | 11 (91.7%) | 1 (8.3%) |
| Total | 144 (99.3%) | 1 (0.7%) |
Educational Attainment by Field of Study in Verdigre
Education (27 | 28.1%), science & technology (13 | 13.5%), social sciences (12 | 12.5%), business (10 | 10.4%), and visual & performing arts (10 | 10.4%) are the most common fields of study among 96 individuals in Verdigre who have obtained a bachelor's degree or higher.
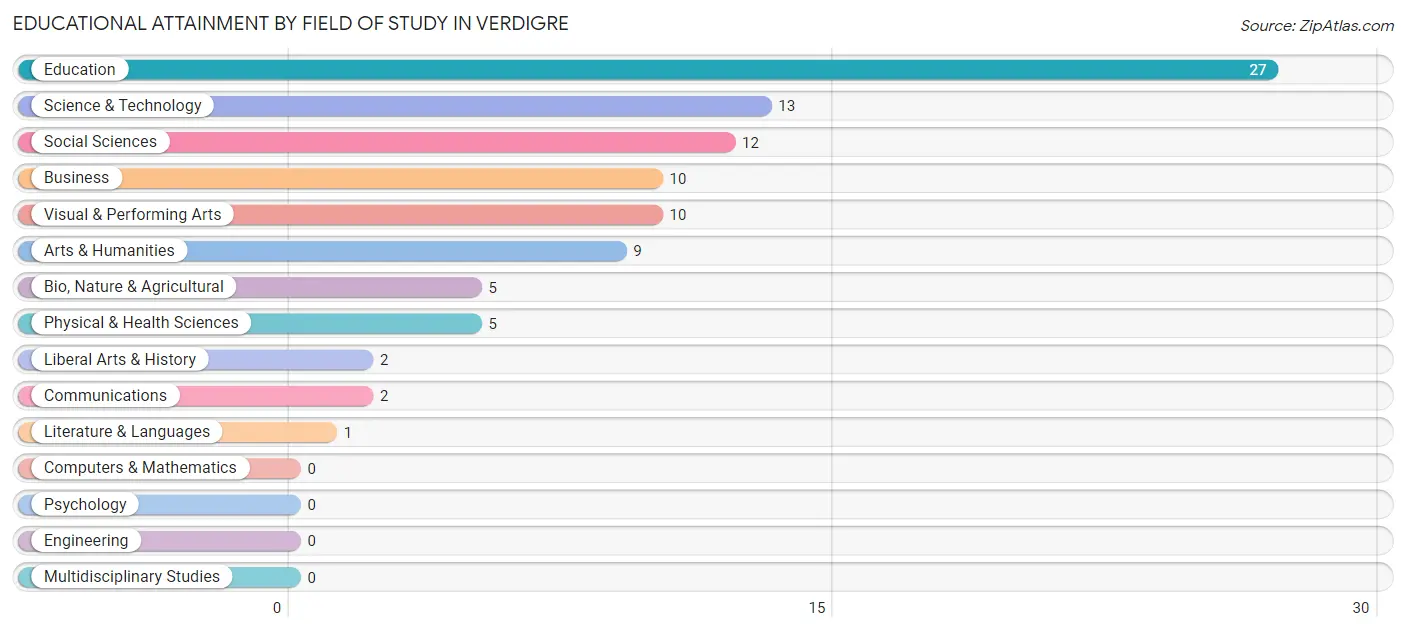
| Field of Study | # Graduates | % Graduates |
| Computers & Mathematics | 0 | 0.0% |
| Bio, Nature & Agricultural | 5 | 5.2% |
| Physical & Health Sciences | 5 | 5.2% |
| Psychology | 0 | 0.0% |
| Social Sciences | 12 | 12.5% |
| Engineering | 0 | 0.0% |
| Multidisciplinary Studies | 0 | 0.0% |
| Science & Technology | 13 | 13.5% |
| Business | 10 | 10.4% |
| Education | 27 | 28.1% |
| Literature & Languages | 1 | 1.0% |
| Liberal Arts & History | 2 | 2.1% |
| Visual & Performing Arts | 10 | 10.4% |
| Communications | 2 | 2.1% |
| Arts & Humanities | 9 | 9.4% |
| Total | 96 | 100.0% |
Transportation & Commute in Verdigre
Vehicle Availability by Sex in Verdigre
The most prevalent vehicle ownership categories in Verdigre are males with 2 vehicles (49, accounting for 38.6%) and females with 2 vehicles (43, making up 44.1%).
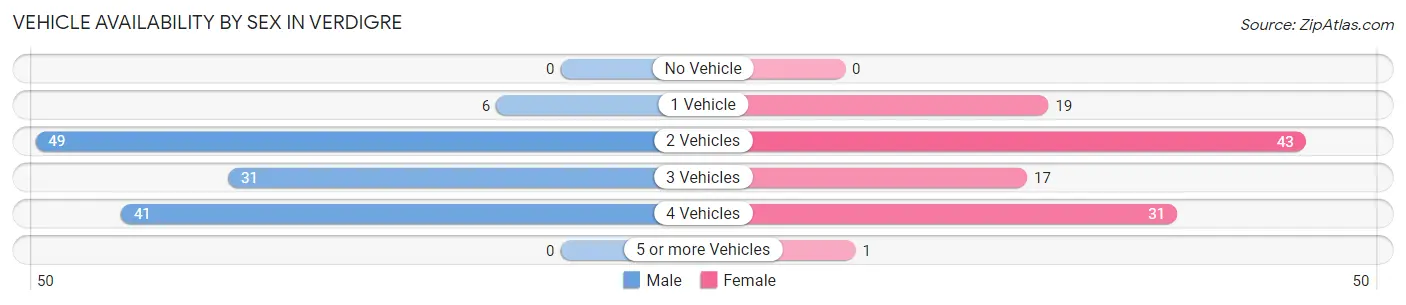
| Vehicles Available | Male | Female |
| No Vehicle | 0 (0.0%) | 0 (0.0%) |
| 1 Vehicle | 6 (4.7%) | 19 (17.1%) |
| 2 Vehicles | 49 (38.6%) | 43 (38.7%) |
| 3 Vehicles | 31 (24.4%) | 17 (15.3%) |
| 4 Vehicles | 41 (32.3%) | 31 (27.9%) |
| 5 or more Vehicles | 0 (0.0%) | 1 (0.9%) |
| Total | 127 (100.0%) | 111 (100.0%) |
Commute Time in Verdigre
The most frequently occuring commute durations in Verdigre are less than 5 minutes (74 commuters, 32.3%), 5 to 9 minutes (39 commuters, 17.0%), and 20 to 24 minutes (31 commuters, 13.5%).
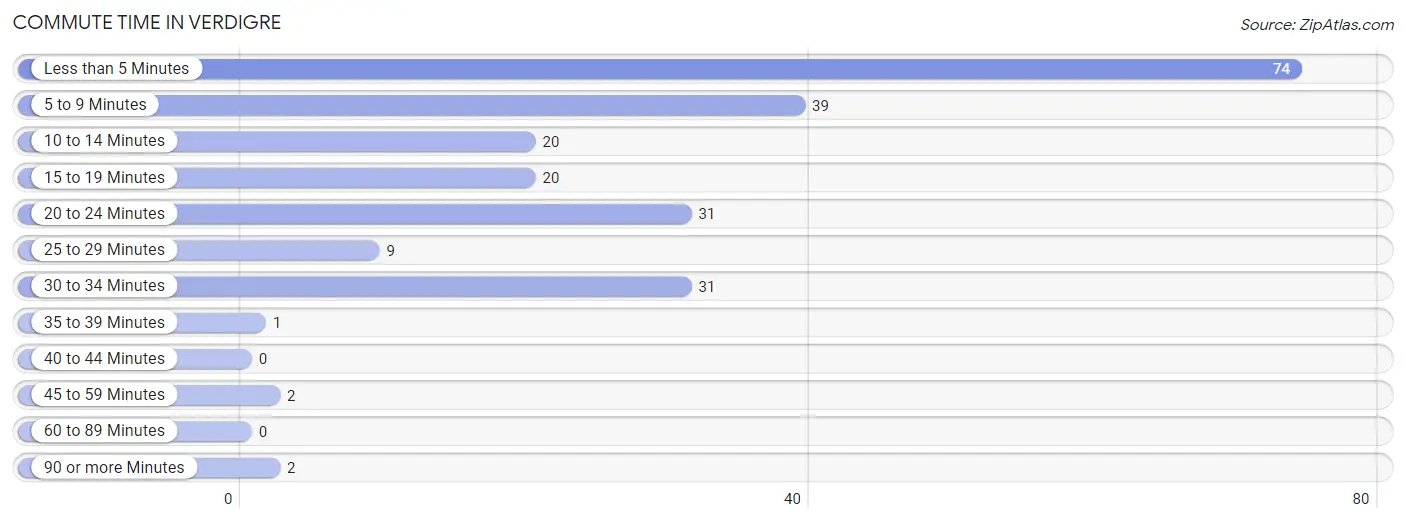
| Commute Time | # Commuters | % Commuters |
| Less than 5 Minutes | 74 | 32.3% |
| 5 to 9 Minutes | 39 | 17.0% |
| 10 to 14 Minutes | 20 | 8.7% |
| 15 to 19 Minutes | 20 | 8.7% |
| 20 to 24 Minutes | 31 | 13.5% |
| 25 to 29 Minutes | 9 | 3.9% |
| 30 to 34 Minutes | 31 | 13.5% |
| 35 to 39 Minutes | 1 | 0.4% |
| 40 to 44 Minutes | 0 | 0.0% |
| 45 to 59 Minutes | 2 | 0.9% |
| 60 to 89 Minutes | 0 | 0.0% |
| 90 or more Minutes | 2 | 0.9% |
Commute Time by Sex in Verdigre
The most common commute times in Verdigre are less than 5 minutes (38 commuters, 29.9%) for males and less than 5 minutes (36 commuters, 35.3%) for females.
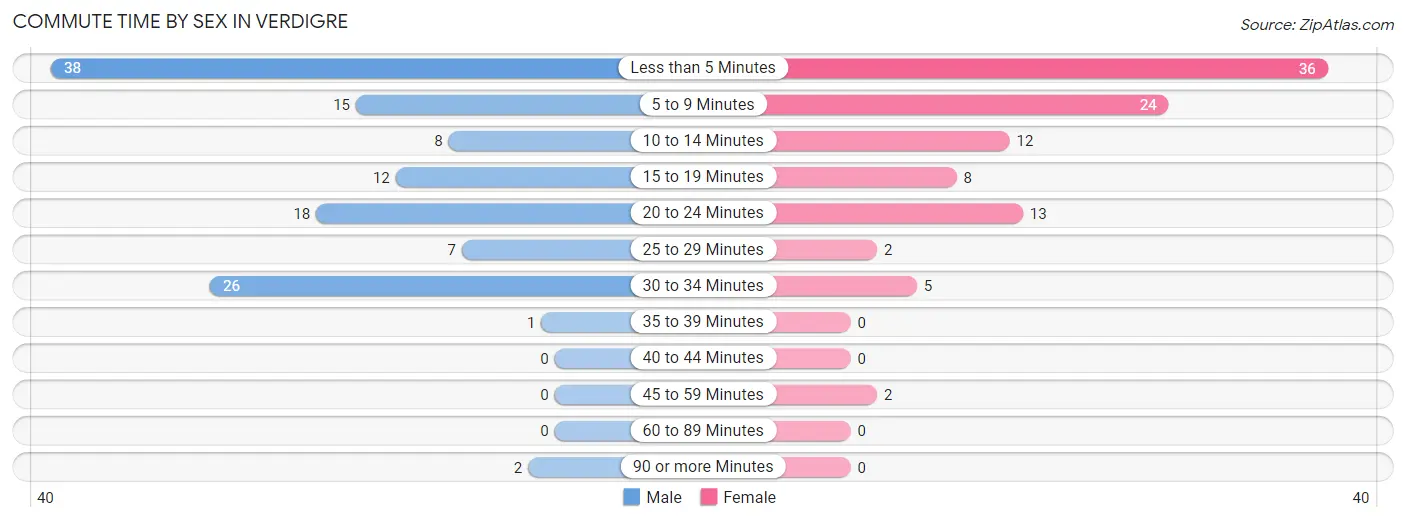
| Commute Time | Male | Female |
| Less than 5 Minutes | 38 (29.9%) | 36 (35.3%) |
| 5 to 9 Minutes | 15 (11.8%) | 24 (23.5%) |
| 10 to 14 Minutes | 8 (6.3%) | 12 (11.8%) |
| 15 to 19 Minutes | 12 (9.5%) | 8 (7.8%) |
| 20 to 24 Minutes | 18 (14.2%) | 13 (12.8%) |
| 25 to 29 Minutes | 7 (5.5%) | 2 (2.0%) |
| 30 to 34 Minutes | 26 (20.5%) | 5 (4.9%) |
| 35 to 39 Minutes | 1 (0.8%) | 0 (0.0%) |
| 40 to 44 Minutes | 0 (0.0%) | 0 (0.0%) |
| 45 to 59 Minutes | 0 (0.0%) | 2 (2.0%) |
| 60 to 89 Minutes | 0 (0.0%) | 0 (0.0%) |
| 90 or more Minutes | 2 (1.6%) | 0 (0.0%) |
Time of Departure to Work by Sex in Verdigre
The most frequent times of departure to work in Verdigre are 7:30 AM to 7:59 AM (33, 26.0%) for males and 7:30 AM to 7:59 AM (32, 31.4%) for females.
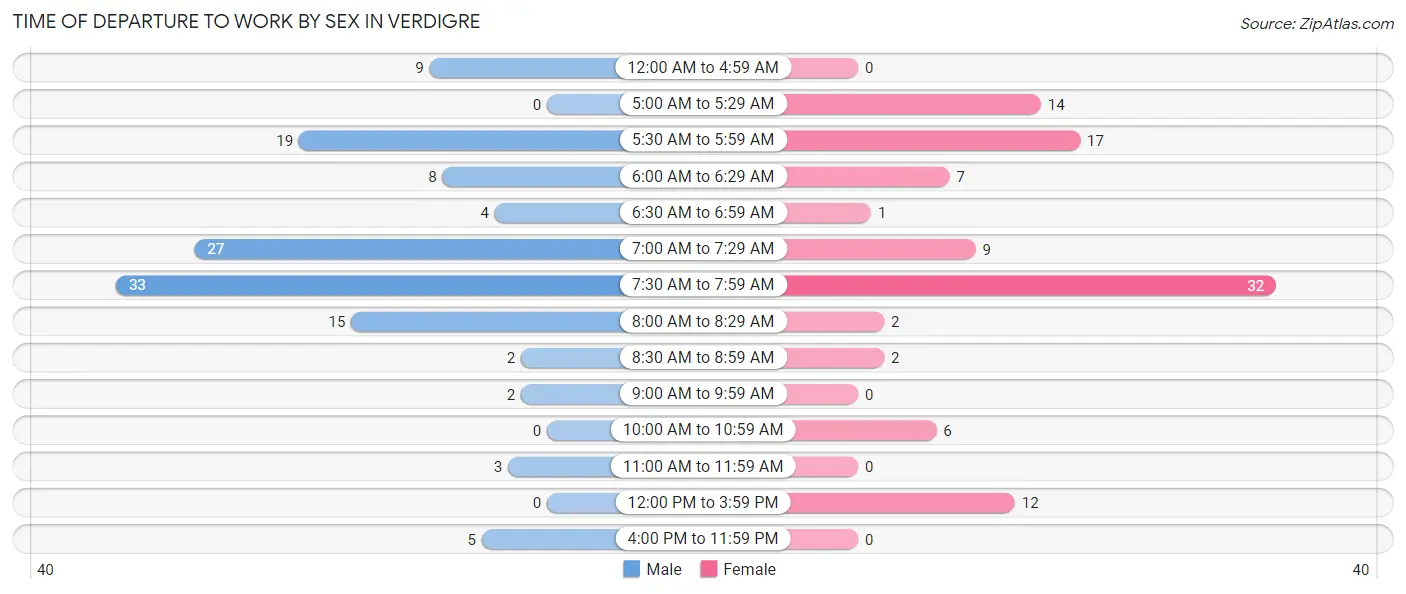
| Time of Departure | Male | Female |
| 12:00 AM to 4:59 AM | 9 (7.1%) | 0 (0.0%) |
| 5:00 AM to 5:29 AM | 0 (0.0%) | 14 (13.7%) |
| 5:30 AM to 5:59 AM | 19 (15.0%) | 17 (16.7%) |
| 6:00 AM to 6:29 AM | 8 (6.3%) | 7 (6.9%) |
| 6:30 AM to 6:59 AM | 4 (3.2%) | 1 (1.0%) |
| 7:00 AM to 7:29 AM | 27 (21.3%) | 9 (8.8%) |
| 7:30 AM to 7:59 AM | 33 (26.0%) | 32 (31.4%) |
| 8:00 AM to 8:29 AM | 15 (11.8%) | 2 (2.0%) |
| 8:30 AM to 8:59 AM | 2 (1.6%) | 2 (2.0%) |
| 9:00 AM to 9:59 AM | 2 (1.6%) | 0 (0.0%) |
| 10:00 AM to 10:59 AM | 0 (0.0%) | 6 (5.9%) |
| 11:00 AM to 11:59 AM | 3 (2.4%) | 0 (0.0%) |
| 12:00 PM to 3:59 PM | 0 (0.0%) | 12 (11.8%) |
| 4:00 PM to 11:59 PM | 5 (3.9%) | 0 (0.0%) |
| Total | 127 (100.0%) | 102 (100.0%) |
Housing Occupancy in Verdigre
Occupancy by Ownership in Verdigre
Of the total 223 dwellings in Verdigre, owner-occupied units account for 152 (68.2%), while renter-occupied units make up 71 (31.8%).
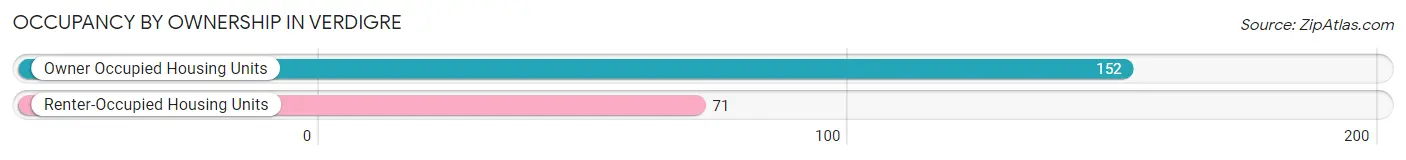
| Occupancy | # Housing Units | % Housing Units |
| Owner Occupied Housing Units | 152 | 68.2% |
| Renter-Occupied Housing Units | 71 | 31.8% |
| Total Occupied Housing Units | 223 | 100.0% |
Occupancy by Household Size in Verdigre
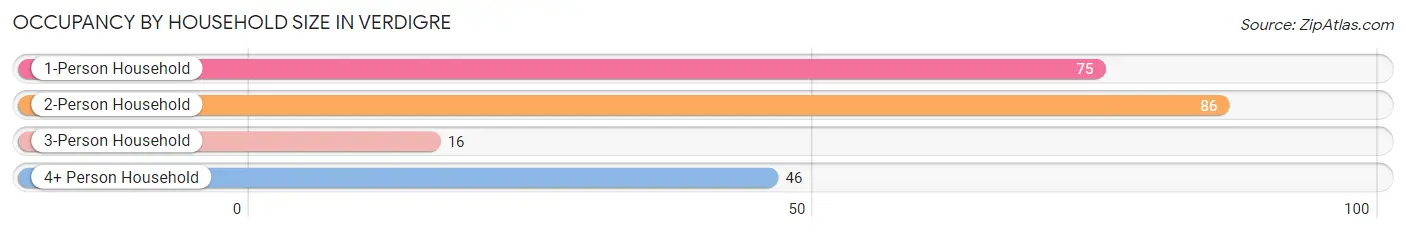
| Household Size | # Housing Units | % Housing Units |
| 1-Person Household | 75 | 33.6% |
| 2-Person Household | 86 | 38.6% |
| 3-Person Household | 16 | 7.2% |
| 4+ Person Household | 46 | 20.6% |
| Total Housing Units | 223 | 100.0% |
Occupancy by Ownership by Household Size in Verdigre
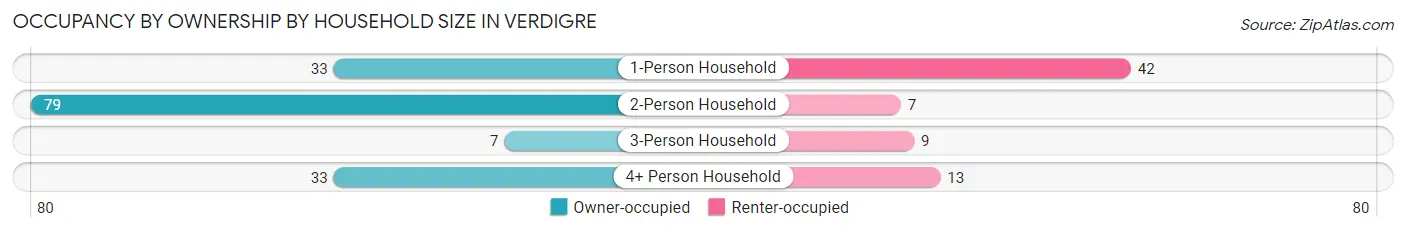
| Household Size | Owner-occupied | Renter-occupied |
| 1-Person Household | 33 (44.0%) | 42 (56.0%) |
| 2-Person Household | 79 (91.9%) | 7 (8.1%) |
| 3-Person Household | 7 (43.8%) | 9 (56.2%) |
| 4+ Person Household | 33 (71.7%) | 13 (28.3%) |
| Total Housing Units | 152 (68.2%) | 71 (31.8%) |
Occupancy by Educational Attainment in Verdigre
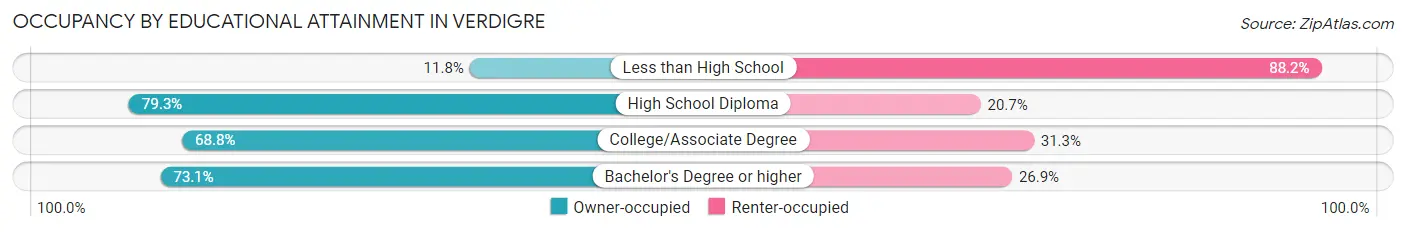
| Household Size | Owner-occupied | Renter-occupied |
| Less than High School | 2 (11.8%) | 15 (88.2%) |
| High School Diploma | 46 (79.3%) | 12 (20.7%) |
| College/Associate Degree | 66 (68.8%) | 30 (31.2%) |
| Bachelor's Degree or higher | 38 (73.1%) | 14 (26.9%) |
Occupancy by Age of Householder in Verdigre
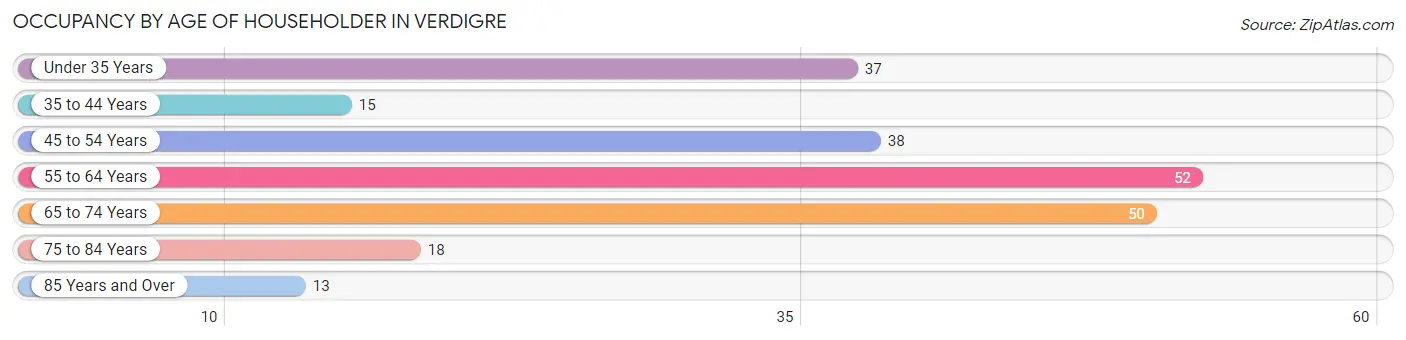
| Age Bracket | # Households | % Households |
| Under 35 Years | 37 | 16.6% |
| 35 to 44 Years | 15 | 6.7% |
| 45 to 54 Years | 38 | 17.0% |
| 55 to 64 Years | 52 | 23.3% |
| 65 to 74 Years | 50 | 22.4% |
| 75 to 84 Years | 18 | 8.1% |
| 85 Years and Over | 13 | 5.8% |
| Total | 223 | 100.0% |
Housing Finances in Verdigre
Median Income by Occupancy in Verdigre
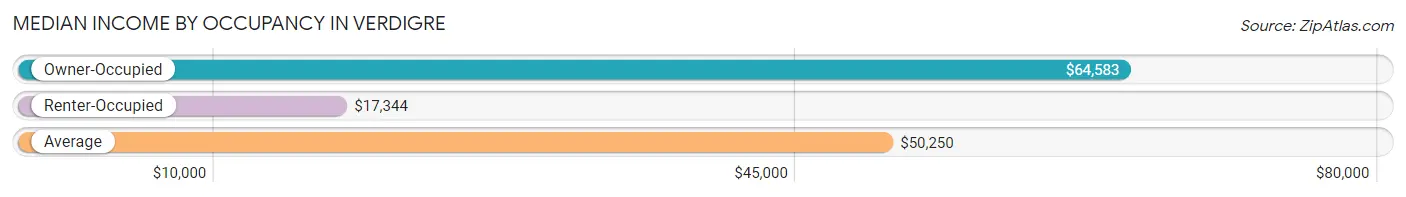
| Occupancy Type | # Households | Median Income |
| Owner-Occupied | 152 (68.2%) | $64,583 |
| Renter-Occupied | 71 (31.8%) | $17,344 |
| Average | 223 (100.0%) | $50,250 |
Occupancy by Householder Income Bracket in Verdigre
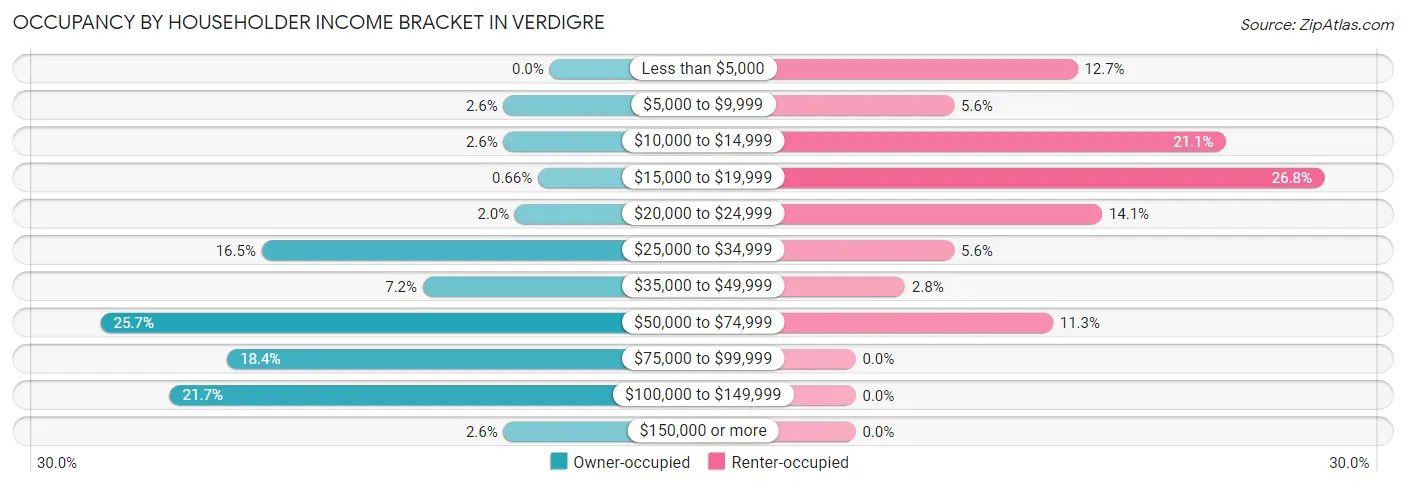
| Income Bracket | Owner-occupied | Renter-occupied |
| Less than $5,000 | 0 (0.0%) | 9 (12.7%) |
| $5,000 to $9,999 | 4 (2.6%) | 4 (5.6%) |
| $10,000 to $14,999 | 4 (2.6%) | 15 (21.1%) |
| $15,000 to $19,999 | 1 (0.7%) | 19 (26.8%) |
| $20,000 to $24,999 | 3 (2.0%) | 10 (14.1%) |
| $25,000 to $34,999 | 25 (16.5%) | 4 (5.6%) |
| $35,000 to $49,999 | 11 (7.2%) | 2 (2.8%) |
| $50,000 to $74,999 | 39 (25.7%) | 8 (11.3%) |
| $75,000 to $99,999 | 28 (18.4%) | 0 (0.0%) |
| $100,000 to $149,999 | 33 (21.7%) | 0 (0.0%) |
| $150,000 or more | 4 (2.6%) | 0 (0.0%) |
| Total | 152 (100.0%) | 71 (100.0%) |
Monthly Housing Cost Tiers in Verdigre
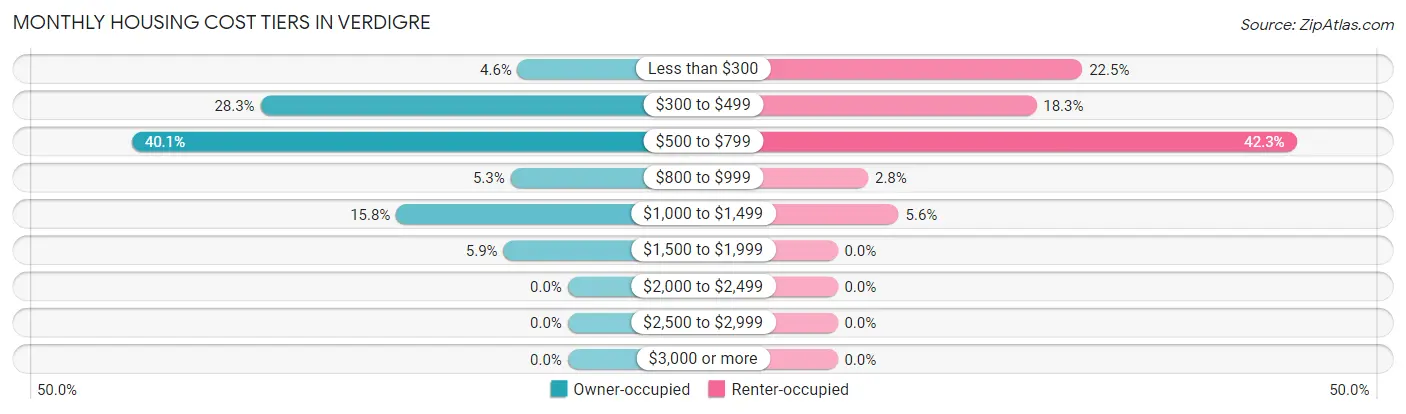
| Monthly Cost | Owner-occupied | Renter-occupied |
| Less than $300 | 7 (4.6%) | 16 (22.5%) |
| $300 to $499 | 43 (28.3%) | 13 (18.3%) |
| $500 to $799 | 61 (40.1%) | 30 (42.2%) |
| $800 to $999 | 8 (5.3%) | 2 (2.8%) |
| $1,000 to $1,499 | 24 (15.8%) | 4 (5.6%) |
| $1,500 to $1,999 | 9 (5.9%) | 0 (0.0%) |
| $2,000 to $2,499 | 0 (0.0%) | 0 (0.0%) |
| $2,500 to $2,999 | 0 (0.0%) | 0 (0.0%) |
| $3,000 or more | 0 (0.0%) | 0 (0.0%) |
| Total | 152 (100.0%) | 71 (100.0%) |
Physical Housing Characteristics in Verdigre
Housing Structures in Verdigre
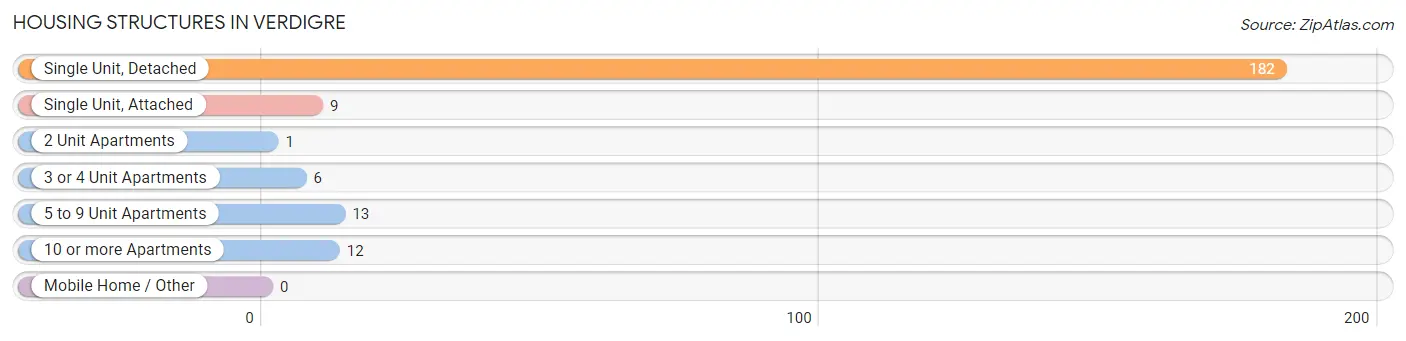
| Structure Type | # Housing Units | % Housing Units |
| Single Unit, Detached | 182 | 81.6% |
| Single Unit, Attached | 9 | 4.0% |
| 2 Unit Apartments | 1 | 0.4% |
| 3 or 4 Unit Apartments | 6 | 2.7% |
| 5 to 9 Unit Apartments | 13 | 5.8% |
| 10 or more Apartments | 12 | 5.4% |
| Mobile Home / Other | 0 | 0.0% |
| Total | 223 | 100.0% |
Housing Structures by Occupancy in Verdigre
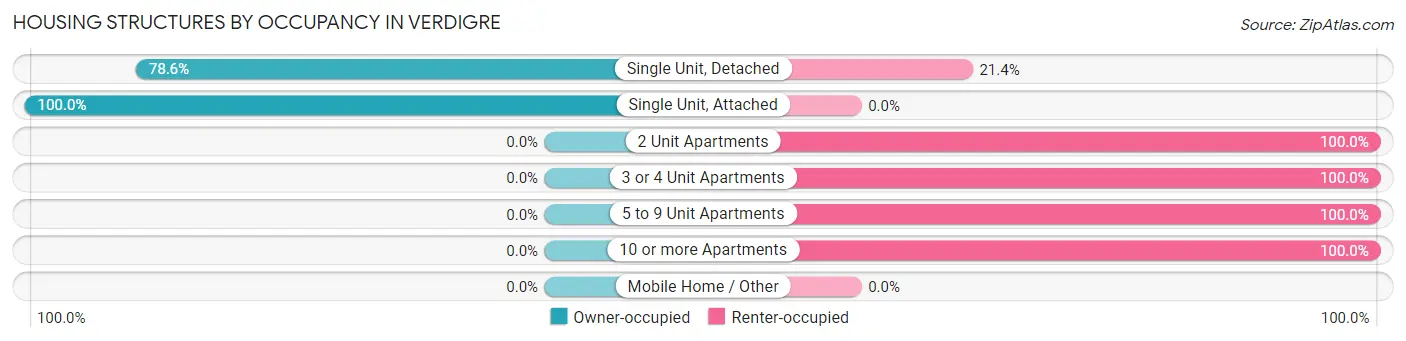
| Structure Type | Owner-occupied | Renter-occupied |
| Single Unit, Detached | 143 (78.6%) | 39 (21.4%) |
| Single Unit, Attached | 9 (100.0%) | 0 (0.0%) |
| 2 Unit Apartments | 0 (0.0%) | 1 (100.0%) |
| 3 or 4 Unit Apartments | 0 (0.0%) | 6 (100.0%) |
| 5 to 9 Unit Apartments | 0 (0.0%) | 13 (100.0%) |
| 10 or more Apartments | 0 (0.0%) | 12 (100.0%) |
| Mobile Home / Other | 0 (0.0%) | 0 (0.0%) |
| Total | 152 (68.2%) | 71 (31.8%) |
Housing Structures by Number of Rooms in Verdigre
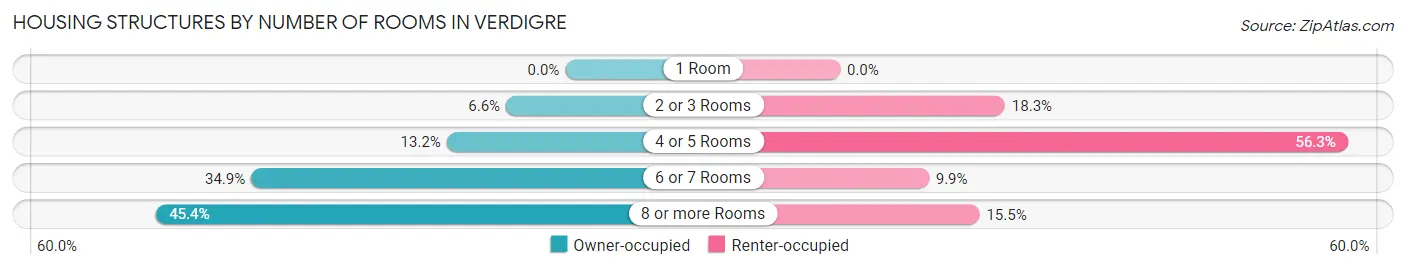
| Number of Rooms | Owner-occupied | Renter-occupied |
| 1 Room | 0 (0.0%) | 0 (0.0%) |
| 2 or 3 Rooms | 10 (6.6%) | 13 (18.3%) |
| 4 or 5 Rooms | 20 (13.2%) | 40 (56.3%) |
| 6 or 7 Rooms | 53 (34.9%) | 7 (9.9%) |
| 8 or more Rooms | 69 (45.4%) | 11 (15.5%) |
| Total | 152 (100.0%) | 71 (100.0%) |
Housing Structure by Heating Type in Verdigre
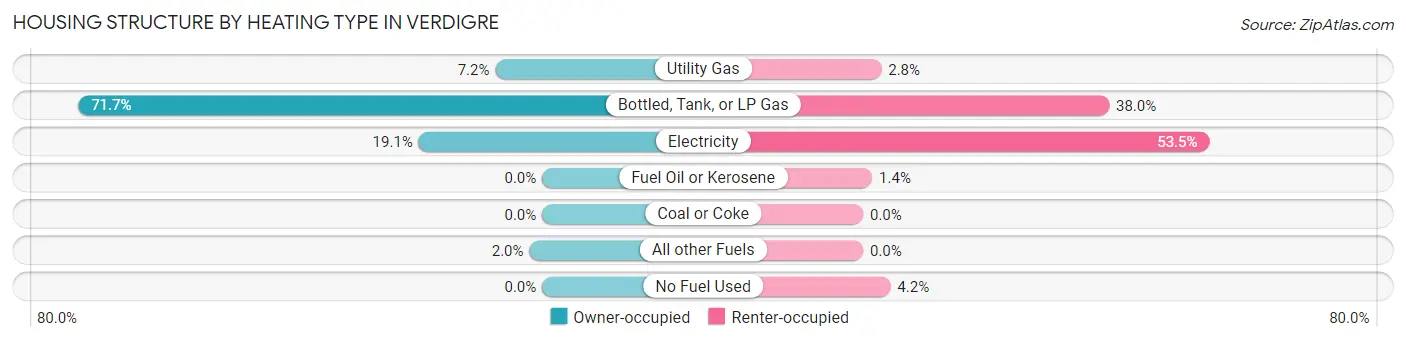
| Heating Type | Owner-occupied | Renter-occupied |
| Utility Gas | 11 (7.2%) | 2 (2.8%) |
| Bottled, Tank, or LP Gas | 109 (71.7%) | 27 (38.0%) |
| Electricity | 29 (19.1%) | 38 (53.5%) |
| Fuel Oil or Kerosene | 0 (0.0%) | 1 (1.4%) |
| Coal or Coke | 0 (0.0%) | 0 (0.0%) |
| All other Fuels | 3 (2.0%) | 0 (0.0%) |
| No Fuel Used | 0 (0.0%) | 3 (4.2%) |
| Total | 152 (100.0%) | 71 (100.0%) |
Household Vehicle Usage in Verdigre
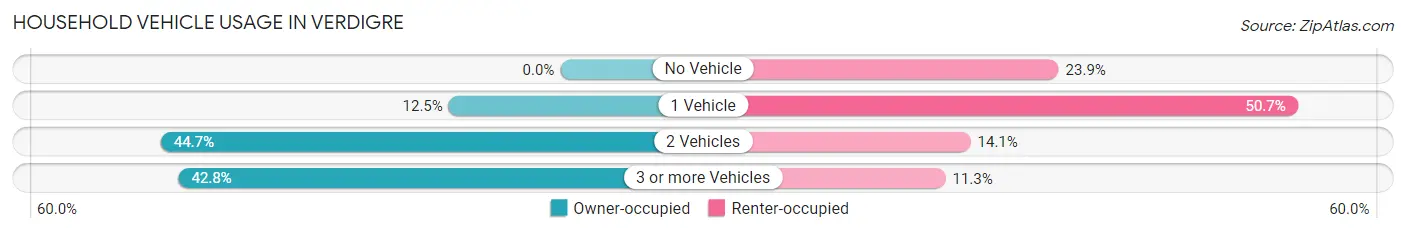
| Vehicles per Household | Owner-occupied | Renter-occupied |
| No Vehicle | 0 (0.0%) | 17 (23.9%) |
| 1 Vehicle | 19 (12.5%) | 36 (50.7%) |
| 2 Vehicles | 68 (44.7%) | 10 (14.1%) |
| 3 or more Vehicles | 65 (42.8%) | 8 (11.3%) |
| Total | 152 (100.0%) | 71 (100.0%) |
Real Estate & Mortgages in Verdigre
Real Estate and Mortgage Overview in Verdigre
| Characteristic | Without Mortgage | With Mortgage |
| Housing Units | 92 | 60 |
| Median Property Value | $80,900 | $90,000 |
| Median Household Income | $56,250 | $4 |
| Monthly Housing Costs | $489 | $0 |
| Real Estate Taxes | $1,122 | $0 |
Property Value by Mortgage Status in Verdigre
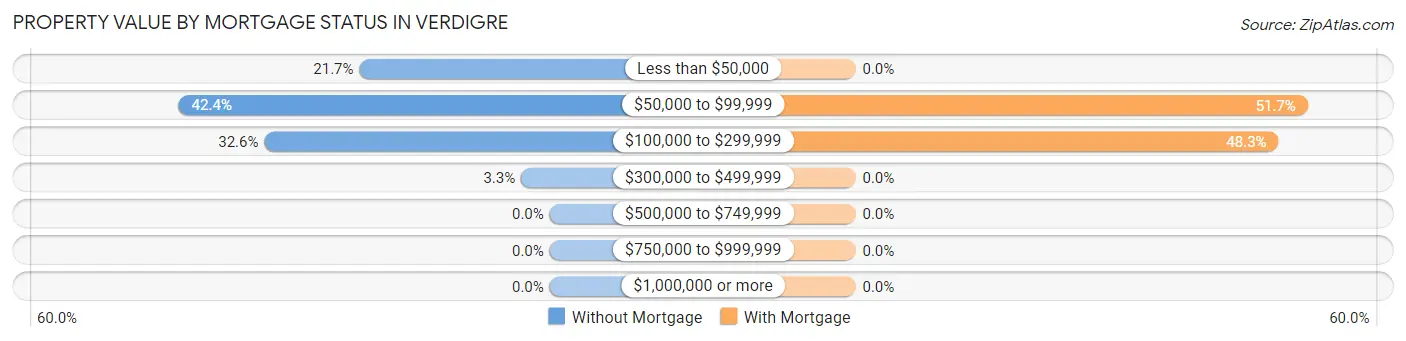
| Property Value | Without Mortgage | With Mortgage |
| Less than $50,000 | 20 (21.7%) | 0 (0.0%) |
| $50,000 to $99,999 | 39 (42.4%) | 31 (51.7%) |
| $100,000 to $299,999 | 30 (32.6%) | 29 (48.3%) |
| $300,000 to $499,999 | 3 (3.3%) | 0 (0.0%) |
| $500,000 to $749,999 | 0 (0.0%) | 0 (0.0%) |
| $750,000 to $999,999 | 0 (0.0%) | 0 (0.0%) |
| $1,000,000 or more | 0 (0.0%) | 0 (0.0%) |
| Total | 92 (100.0%) | 60 (100.0%) |
Household Income by Mortgage Status in Verdigre
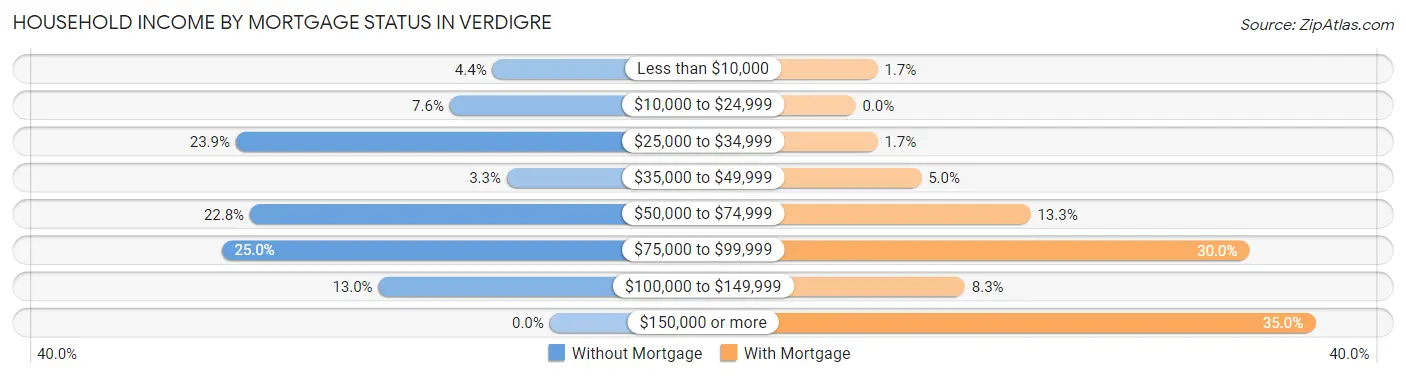
| Household Income | Without Mortgage | With Mortgage |
| Less than $10,000 | 4 (4.3%) | 1 (1.7%) |
| $10,000 to $24,999 | 7 (7.6%) | 0 (0.0%) |
| $25,000 to $34,999 | 22 (23.9%) | 1 (1.7%) |
| $35,000 to $49,999 | 3 (3.3%) | 3 (5.0%) |
| $50,000 to $74,999 | 21 (22.8%) | 8 (13.3%) |
| $75,000 to $99,999 | 23 (25.0%) | 18 (30.0%) |
| $100,000 to $149,999 | 12 (13.0%) | 5 (8.3%) |
| $150,000 or more | 0 (0.0%) | 21 (35.0%) |
| Total | 92 (100.0%) | 60 (100.0%) |
Property Value to Household Income Ratio in Verdigre
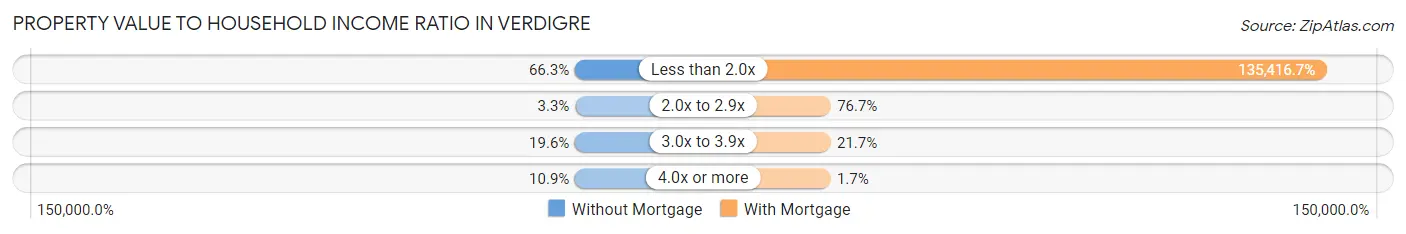
| Value-to-Income Ratio | Without Mortgage | With Mortgage |
| Less than 2.0x | 61 (66.3%) | 81,250 (135,416.7%) |
| 2.0x to 2.9x | 3 (3.3%) | 46 (76.7%) |
| 3.0x to 3.9x | 18 (19.6%) | 13 (21.7%) |
| 4.0x or more | 10 (10.9%) | 1 (1.7%) |
| Total | 92 (100.0%) | 60 (100.0%) |
Real Estate Taxes by Mortgage Status in Verdigre
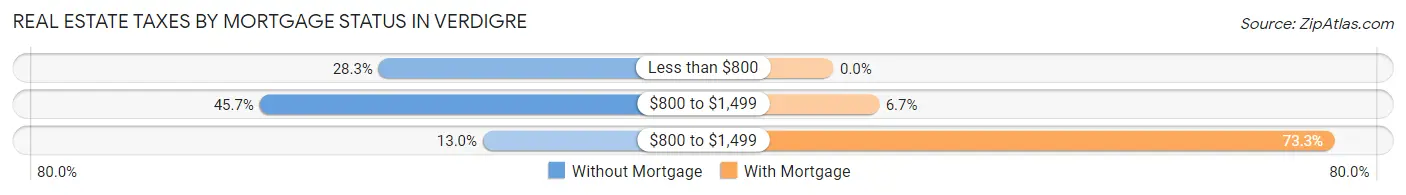
| Property Taxes | Without Mortgage | With Mortgage |
| Less than $800 | 26 (28.3%) | 0 (0.0%) |
| $800 to $1,499 | 42 (45.7%) | 4 (6.7%) |
| $800 to $1,499 | 12 (13.0%) | 44 (73.3%) |
| Total | 92 (100.0%) | 60 (100.0%) |
Health & Disability in Verdigre
Health Insurance Coverage by Age in Verdigre
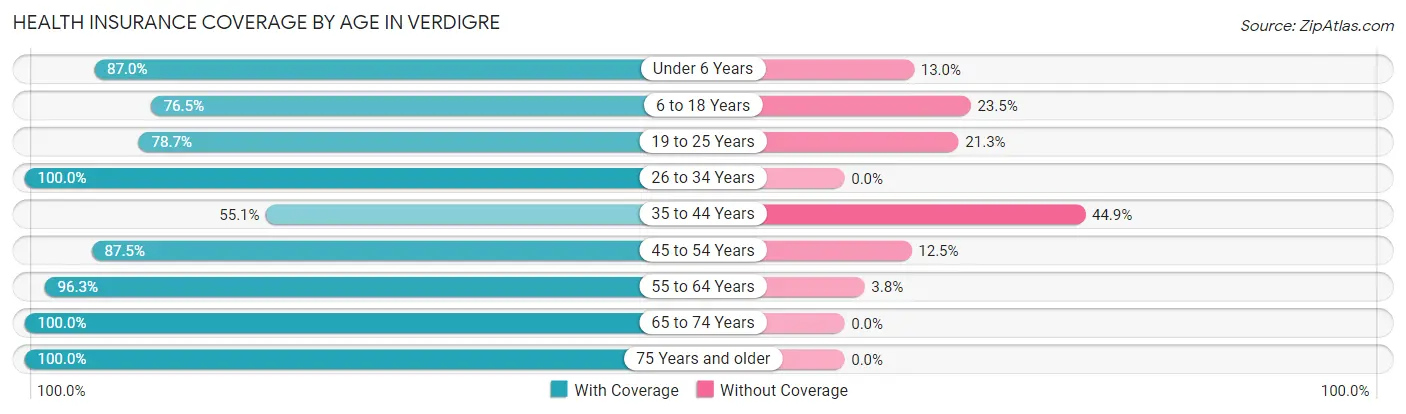
| Age Bracket | With Coverage | Without Coverage |
| Under 6 Years | 47 (87.0%) | 7 (13.0%) |
| 6 to 18 Years | 91 (76.5%) | 28 (23.5%) |
| 19 to 25 Years | 37 (78.7%) | 10 (21.3%) |
| 26 to 34 Years | 51 (100.0%) | 0 (0.0%) |
| 35 to 44 Years | 27 (55.1%) | 22 (44.9%) |
| 45 to 54 Years | 49 (87.5%) | 7 (12.5%) |
| 55 to 64 Years | 77 (96.3%) | 3 (3.7%) |
| 65 to 74 Years | 70 (100.0%) | 0 (0.0%) |
| 75 Years and older | 43 (100.0%) | 0 (0.0%) |
| Total | 492 (86.5%) | 77 (13.5%) |
Health Insurance Coverage by Citizenship Status in Verdigre
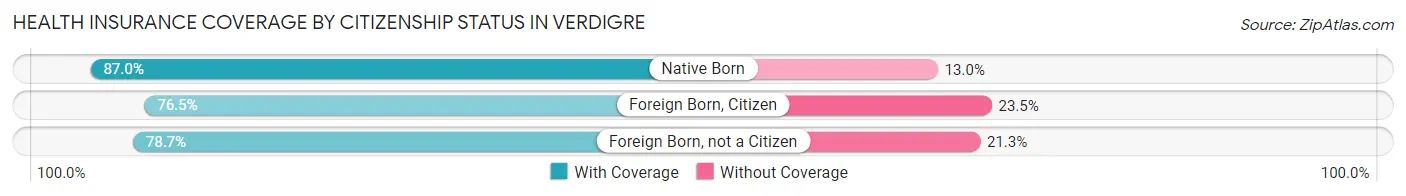
| Citizenship Status | With Coverage | Without Coverage |
| Native Born | 47 (87.0%) | 7 (13.0%) |
| Foreign Born, Citizen | 91 (76.5%) | 28 (23.5%) |
| Foreign Born, not a Citizen | 37 (78.7%) | 10 (21.3%) |
Health Insurance Coverage by Household Income in Verdigre
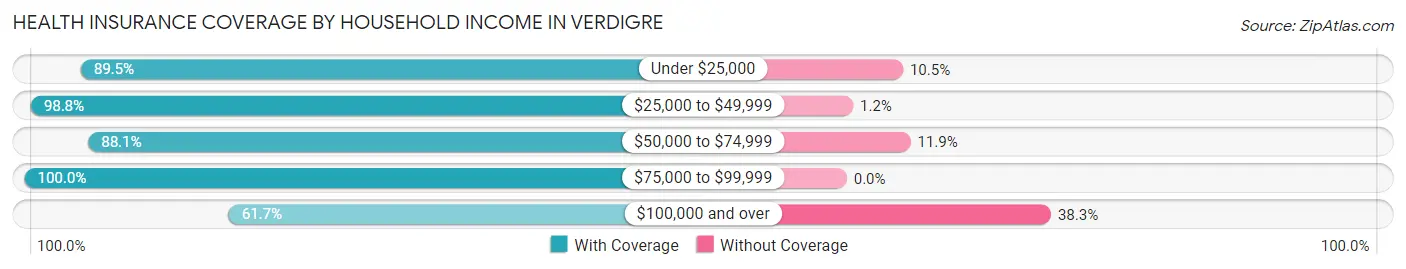
| Household Income | With Coverage | Without Coverage |
| Under $25,000 | 136 (89.5%) | 16 (10.5%) |
| $25,000 to $49,999 | 84 (98.8%) | 1 (1.2%) |
| $50,000 to $74,999 | 118 (88.1%) | 16 (11.9%) |
| $75,000 to $99,999 | 83 (100.0%) | 0 (0.0%) |
| $100,000 and over | 71 (61.7%) | 44 (38.3%) |
Public vs Private Health Insurance Coverage by Age in Verdigre
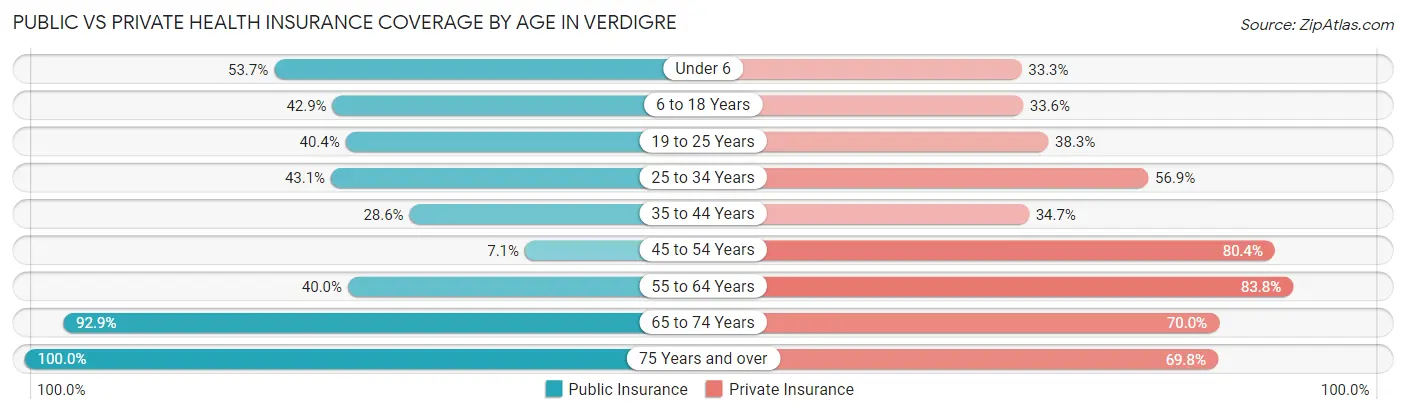
| Age Bracket | Public Insurance | Private Insurance |
| Under 6 | 29 (53.7%) | 18 (33.3%) |
| 6 to 18 Years | 51 (42.9%) | 40 (33.6%) |
| 19 to 25 Years | 19 (40.4%) | 18 (38.3%) |
| 25 to 34 Years | 22 (43.1%) | 29 (56.9%) |
| 35 to 44 Years | 14 (28.6%) | 17 (34.7%) |
| 45 to 54 Years | 4 (7.1%) | 45 (80.4%) |
| 55 to 64 Years | 32 (40.0%) | 67 (83.8%) |
| 65 to 74 Years | 65 (92.9%) | 49 (70.0%) |
| 75 Years and over | 43 (100.0%) | 30 (69.8%) |
| Total | 279 (49.0%) | 313 (55.0%) |
Disability Status by Sex by Age in Verdigre
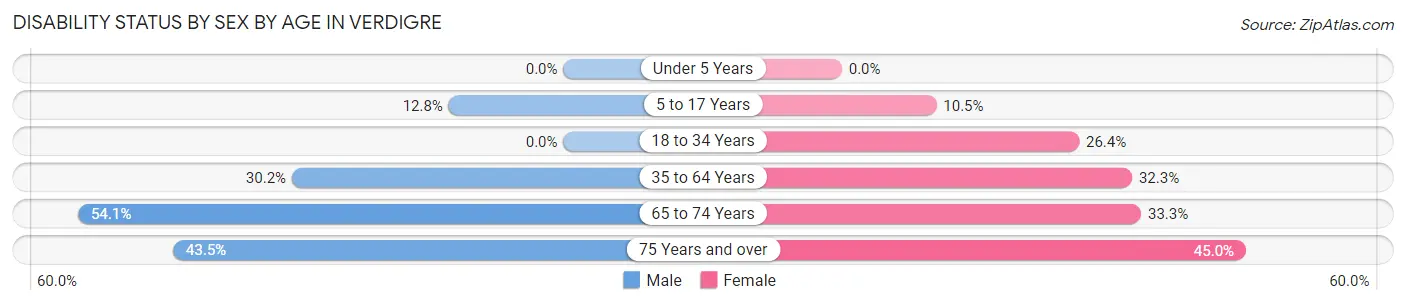
| Age Bracket | Male | Female |
| Under 5 Years | 0 (0.0%) | 0 (0.0%) |
| 5 to 17 Years | 6 (12.8%) | 6 (10.5%) |
| 18 to 34 Years | 0 (0.0%) | 14 (26.4%) |
| 35 to 64 Years | 26 (30.2%) | 32 (32.3%) |
| 65 to 74 Years | 20 (54.0%) | 11 (33.3%) |
| 75 Years and over | 10 (43.5%) | 9 (45.0%) |
Disability Class by Sex by Age in Verdigre
Disability Class: Hearing Difficulty
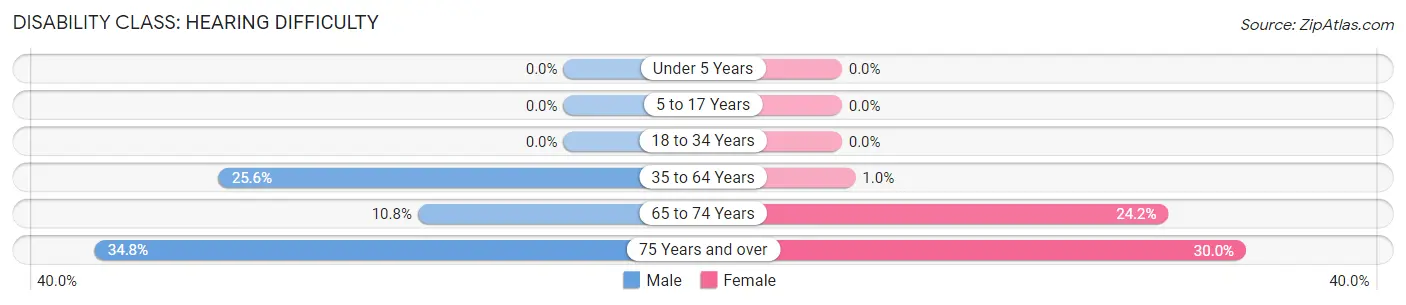
| Age Bracket | Male | Female |
| Under 5 Years | 0 (0.0%) | 0 (0.0%) |
| 5 to 17 Years | 0 (0.0%) | 0 (0.0%) |
| 18 to 34 Years | 0 (0.0%) | 0 (0.0%) |
| 35 to 64 Years | 22 (25.6%) | 1 (1.0%) |
| 65 to 74 Years | 4 (10.8%) | 8 (24.2%) |
| 75 Years and over | 8 (34.8%) | 6 (30.0%) |
Disability Class: Vision Difficulty
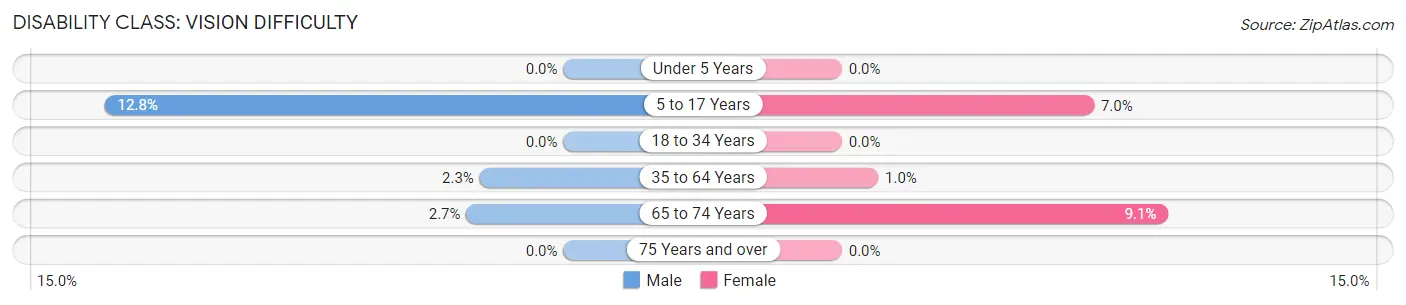
| Age Bracket | Male | Female |
| Under 5 Years | 0 (0.0%) | 0 (0.0%) |
| 5 to 17 Years | 6 (12.8%) | 4 (7.0%) |
| 18 to 34 Years | 0 (0.0%) | 0 (0.0%) |
| 35 to 64 Years | 2 (2.3%) | 1 (1.0%) |
| 65 to 74 Years | 1 (2.7%) | 3 (9.1%) |
| 75 Years and over | 0 (0.0%) | 0 (0.0%) |
Disability Class: Cognitive Difficulty
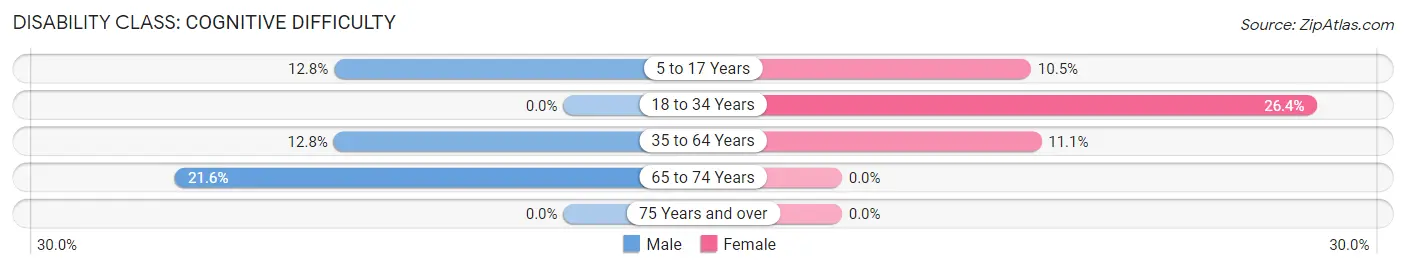
| Age Bracket | Male | Female |
| 5 to 17 Years | 6 (12.8%) | 6 (10.5%) |
| 18 to 34 Years | 0 (0.0%) | 14 (26.4%) |
| 35 to 64 Years | 11 (12.8%) | 11 (11.1%) |
| 65 to 74 Years | 8 (21.6%) | 0 (0.0%) |
| 75 Years and over | 0 (0.0%) | 0 (0.0%) |
Disability Class: Ambulatory Difficulty
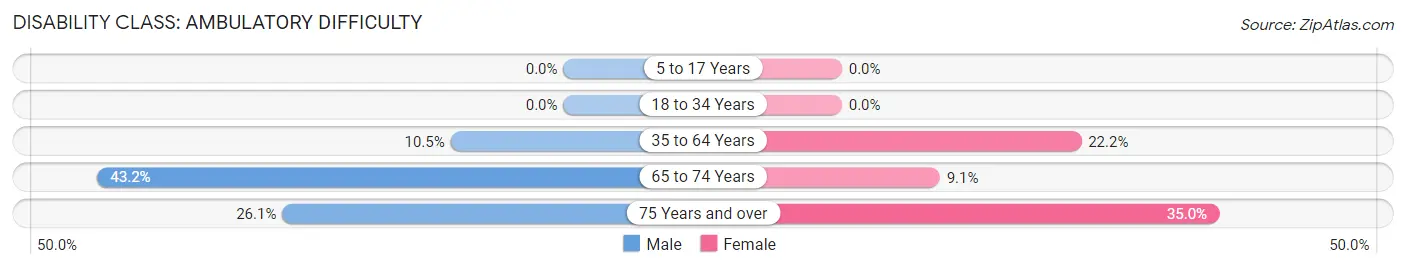
| Age Bracket | Male | Female |
| 5 to 17 Years | 0 (0.0%) | 0 (0.0%) |
| 18 to 34 Years | 0 (0.0%) | 0 (0.0%) |
| 35 to 64 Years | 9 (10.5%) | 22 (22.2%) |
| 65 to 74 Years | 16 (43.2%) | 3 (9.1%) |
| 75 Years and over | 6 (26.1%) | 7 (35.0%) |
Disability Class: Self-Care Difficulty
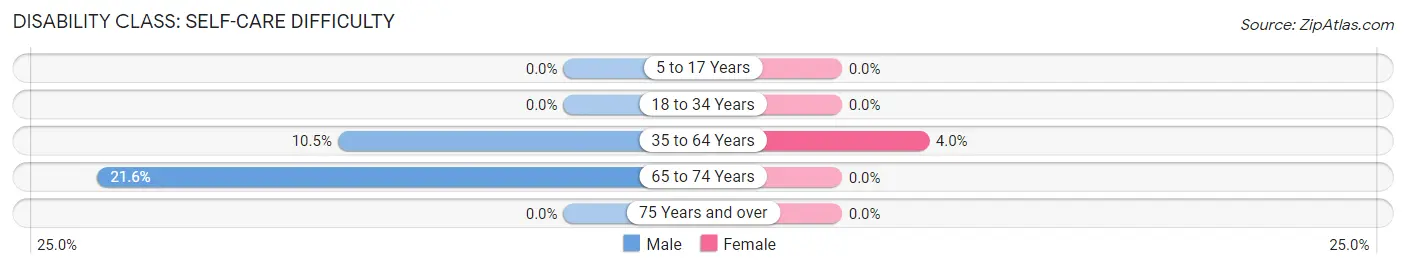
| Age Bracket | Male | Female |
| 5 to 17 Years | 0 (0.0%) | 0 (0.0%) |
| 18 to 34 Years | 0 (0.0%) | 0 (0.0%) |
| 35 to 64 Years | 9 (10.5%) | 4 (4.0%) |
| 65 to 74 Years | 8 (21.6%) | 0 (0.0%) |
| 75 Years and over | 0 (0.0%) | 0 (0.0%) |
Technology Access in Verdigre
Computing Device Access in Verdigre
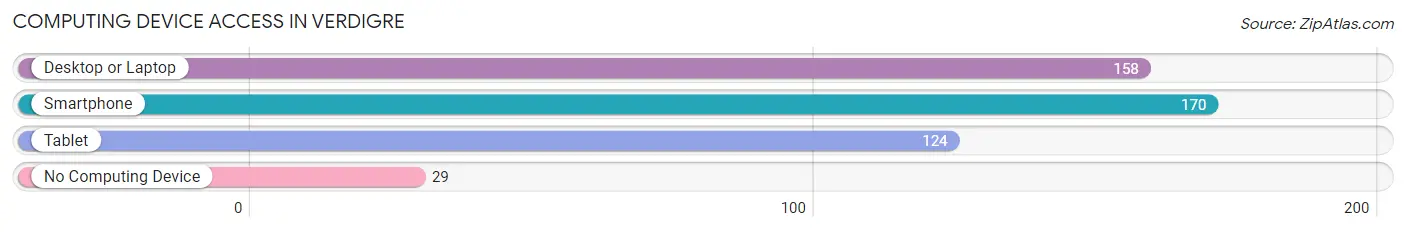
| Device Type | # Households | % Households |
| Desktop or Laptop | 158 | 70.9% |
| Smartphone | 170 | 76.2% |
| Tablet | 124 | 55.6% |
| No Computing Device | 29 | 13.0% |
| Total | 223 | 100.0% |
Internet Access in Verdigre
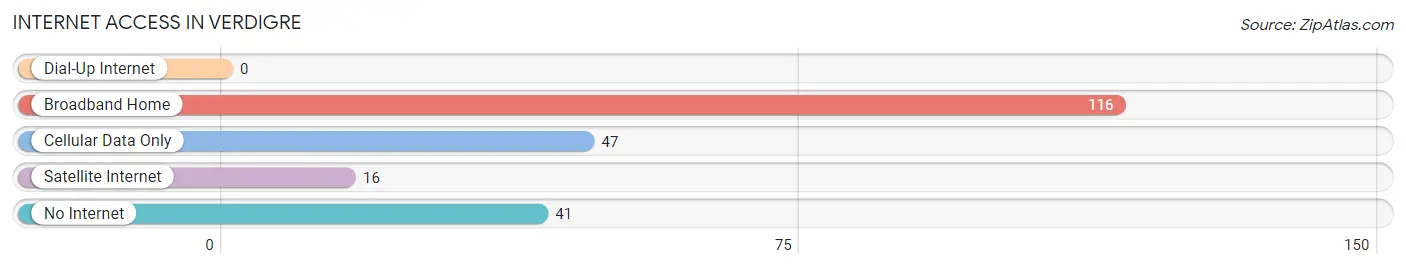
| Internet Type | # Households | % Households |
| Dial-Up Internet | 0 | 0.0% |
| Broadband Home | 116 | 52.0% |
| Cellular Data Only | 47 | 21.1% |
| Satellite Internet | 16 | 7.2% |
| No Internet | 41 | 18.4% |
| Total | 223 | 100.0% |
Verdigre Summary
Verdigre, Nebraska is a small village located in Knox County, Nebraska. It is situated in the northeastern corner of the state, approximately 30 miles from the South Dakota border. The village has a population of approximately 500 people and is the county seat of Knox County.
Verdigre was founded in 1871 by a group of settlers from Bohemia, a region of the Czech Republic. The settlers were attracted to the area by the fertile soil and abundant water supply. The village was named after the nearby Verdigre Creek, which was named by the settlers after the Czech word for “green”.
Verdigre is located in the rolling hills of the Missouri River Valley. The area is known for its rich agricultural land, which is used to grow corn, soybeans, and other crops. The village is also home to a variety of wildlife, including deer, wild turkeys, and pheasants.
The economy of Verdigre is largely based on agriculture. The village is home to several grain elevators, which are used to store and transport grain. The village also has a number of small businesses, including a grocery store, a hardware store, and a restaurant.
Verdigre is served by the Verdigre Public School District, which consists of two elementary schools, a middle school, and a high school. The village also has a public library and a post office.
Verdigre is a predominantly white community, with a population of approximately 95% white and 5% other races. The median household income in Verdigre is $41,000, and the median home value is $90,000. The village has a low unemployment rate of 3.2%.
Verdigre is a small, rural community with a rich history and a strong sense of community. The village is home to a variety of festivals and events throughout the year, including the Verdigre Czech Festival, which celebrates the village’s Czech heritage. The village also hosts a number of other events, such as the Verdigre County Fair and the Verdigre Harvest Festival.
Verdigre is a great place to live and work, with a strong sense of community and a variety of activities and events to enjoy. The village is a great place to raise a family, with a low cost of living and a safe, friendly environment.
Common Questions
What is Per Capita Income in Verdigre?
Per Capita income in Verdigre is $21,191.
What is the Median Family Income in Verdigre?
Median Family Income in Verdigre is $62,778.
What is the Median Household income in Verdigre?
Median Household Income in Verdigre is $50,250.
What is Income or Wage Gap in Verdigre?
Income or Wage Gap in Verdigre is 44.2%.
Women in Verdigre earn 55.8 cents for every dollar earned by a man.
What is Inequality or Gini Index in Verdigre?
Inequality or Gini Index in Verdigre is 0.42.
What is the Total Population of Verdigre?
Total Population of Verdigre is 609.
What is the Total Male Population of Verdigre?
Total Male Population of Verdigre is 315.
What is the Total Female Population of Verdigre?
Total Female Population of Verdigre is 294.
What is the Ratio of Males per 100 Females in Verdigre?
There are 107.14 Males per 100 Females in Verdigre.
What is the Ratio of Females per 100 Males in Verdigre?
There are 93.33 Females per 100 Males in Verdigre.
What is the Median Population Age in Verdigre?
Median Population Age in Verdigre is 43.2 Years.
What is the Average Family Size in Verdigre
Average Family Size in Verdigre is 3.3 People.
What is the Average Household Size in Verdigre
Average Household Size in Verdigre is 2.5 People.
How Large is the Labor Force in Verdigre?
There are 265 People in the Labor Forcein in Verdigre.
What is the Percentage of People in the Labor Force in Verdigre?
55.1% of People are in the Labor Force in Verdigre.
What is the Unemployment Rate in Verdigre?
Unemployment Rate in Verdigre is 5.3%.