McCook, NE Map & Demographics
McCook Map
McCook Overview
$34,758
PER CAPITA INCOME
$74,861
AVG FAMILY INCOME
$53,750
AVG HOUSEHOLD INCOME
19.2%
WAGE / INCOME GAP [ % ]
80.8¢/ $1
WAGE / INCOME GAP [ $ ]
0.48
INEQUALITY / GINI INDEX
7,412
TOTAL POPULATION
3,520
MALE POPULATION
3,892
FEMALE POPULATION
90.44
MALES / 100 FEMALES
110.57
FEMALES / 100 MALES
41.5
MEDIAN AGE
3.2
AVG FAMILY SIZE
2.3
AVG HOUSEHOLD SIZE
3,918
LABOR FORCE [ PEOPLE ]
63.7%
PERCENT IN LABOR FORCE
2.6%
UNEMPLOYMENT RATE
McCook Area Codes
Income in McCook
Income Overview in McCook
Per Capita Income in McCook is $34,758, while median incomes of families and households are $74,861 and $53,750 respectively.
| Characteristic | Number | Measure |
| Per Capita Income | 7,412 | $34,758 |
| Median Family Income | 1,734 | $74,861 |
| Mean Family Income | 1,734 | $86,375 |
| Median Household Income | 3,168 | $53,750 |
| Mean Household Income | 3,168 | $76,399 |
| Income Deficit | 1,734 | $0 |
| Wage / Income Gap (%) | 7,412 | 19.22% |
| Wage / Income Gap ($) | 7,412 | 80.78¢ per $1 |
| Gini / Inequality Index | 7,412 | 0.48 |
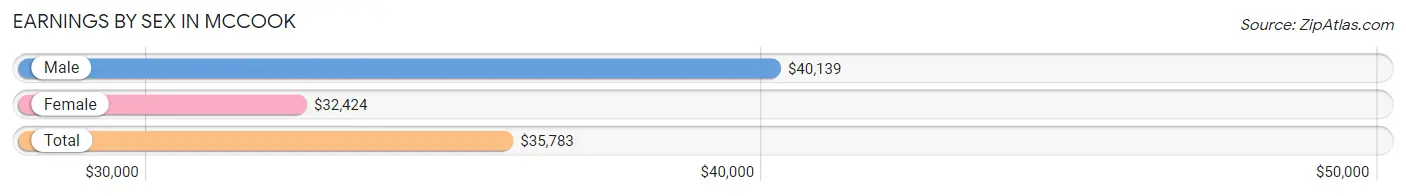
Earnings by Sex in McCook
Average Earnings in McCook are $35,783, $40,139 for men and $32,424 for women, a difference of 19.2%.
| Sex | Number | Average Earnings |
| Male | 2,178 (51.4%) | $40,139 |
| Female | 2,058 (48.6%) | $32,424 |
| Total | 4,236 (100.0%) | $35,783 |
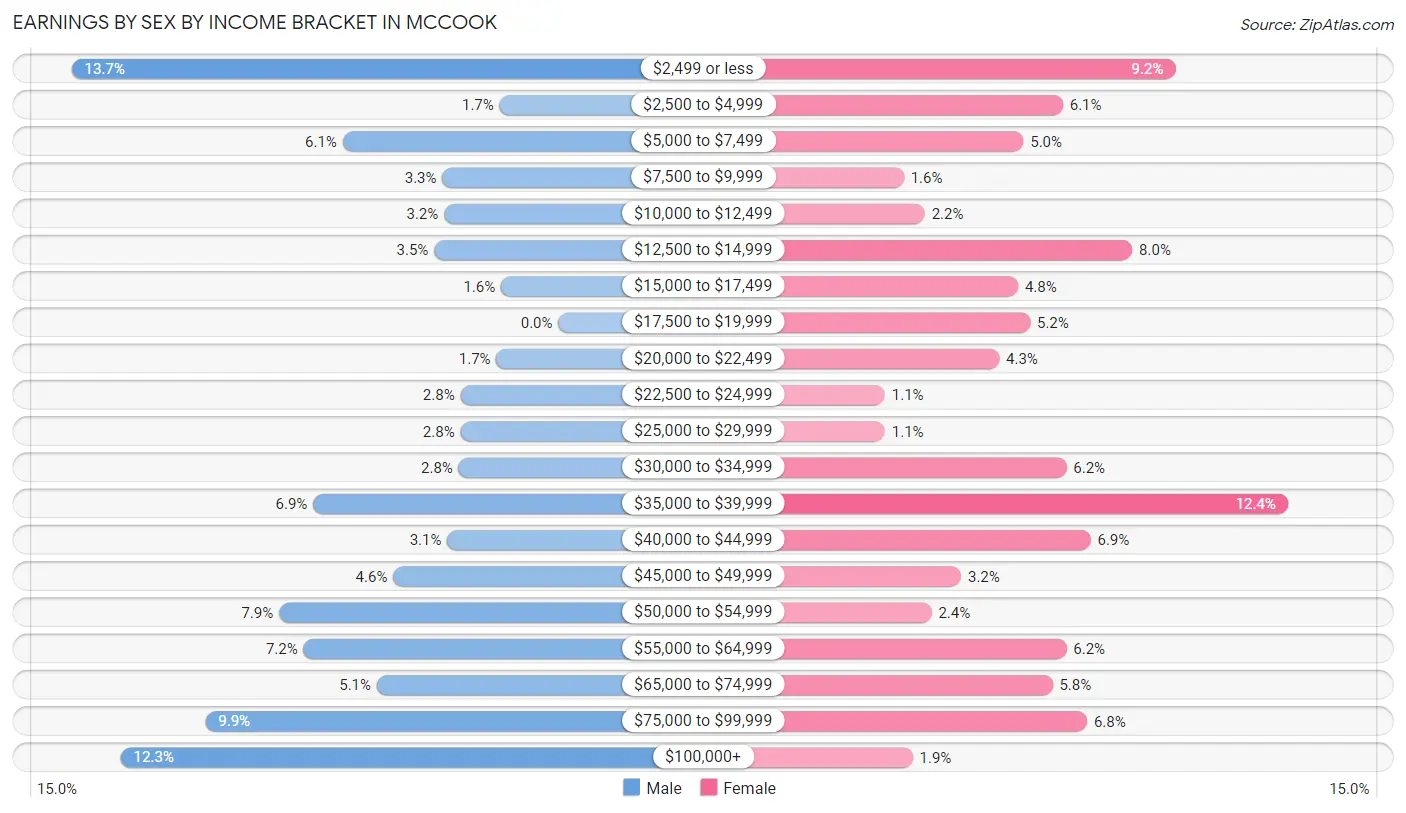
Earnings by Sex by Income Bracket in McCook
The most common earnings brackets in McCook are $2,499 or less for men (298 | 13.7%) and $35,000 to $39,999 for women (255 | 12.4%).
| Income | Male | Female |
| $2,499 or less | 298 (13.7%) | 190 (9.2%) |
| $2,500 to $4,999 | 36 (1.7%) | 125 (6.1%) |
| $5,000 to $7,499 | 132 (6.1%) | 102 (5.0%) |
| $7,500 to $9,999 | 71 (3.3%) | 33 (1.6%) |
| $10,000 to $12,499 | 70 (3.2%) | 45 (2.2%) |
| $12,500 to $14,999 | 76 (3.5%) | 165 (8.0%) |
| $15,000 to $17,499 | 35 (1.6%) | 99 (4.8%) |
| $17,500 to $19,999 | 0 (0.0%) | 106 (5.1%) |
| $20,000 to $22,499 | 38 (1.7%) | 88 (4.3%) |
| $22,500 to $24,999 | 60 (2.8%) | 22 (1.1%) |
| $25,000 to $29,999 | 60 (2.8%) | 22 (1.1%) |
| $30,000 to $34,999 | 61 (2.8%) | 127 (6.2%) |
| $35,000 to $39,999 | 150 (6.9%) | 255 (12.4%) |
| $40,000 to $44,999 | 68 (3.1%) | 141 (6.9%) |
| $45,000 to $49,999 | 101 (4.6%) | 66 (3.2%) |
| $50,000 to $54,999 | 171 (7.9%) | 49 (2.4%) |
| $55,000 to $64,999 | 156 (7.2%) | 127 (6.2%) |
| $65,000 to $74,999 | 111 (5.1%) | 119 (5.8%) |
| $75,000 to $99,999 | 216 (9.9%) | 139 (6.8%) |
| $100,000+ | 268 (12.3%) | 38 (1.8%) |
| Total | 2,178 (100.0%) | 2,058 (100.0%) |
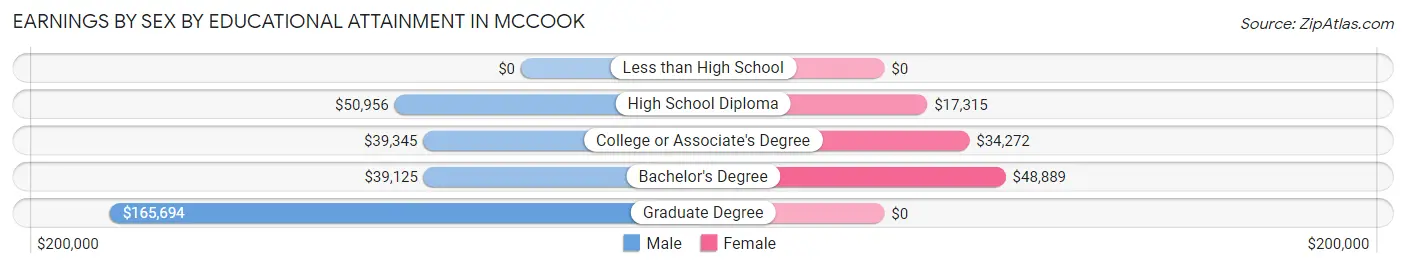
Earnings by Sex by Educational Attainment in McCook
Average earnings in McCook are $49,311 for men and $34,601 for women, a difference of 29.8%. Men with an educational attainment of graduate degree enjoy the highest average annual earnings of $165,694, while those with bachelor's degree education earn the least with $39,125. Women with an educational attainment of bachelor's degree earn the most with the average annual earnings of $48,889, while those with high school diploma education have the smallest earnings of $17,315.
| Educational Attainment | Male Income | Female Income |
| Less than High School | - | - |
| High School Diploma | $50,956 | $17,315 |
| College or Associate's Degree | $39,345 | $34,272 |
| Bachelor's Degree | $39,125 | $48,889 |
| Graduate Degree | $165,694 | $0 |
| Total | $49,311 | $34,601 |
Family Income in McCook
Family Income Brackets in McCook
According to the McCook family income data, there are 326 families falling into the $75,000 to $99,999 income range, which is the most common income bracket and makes up 18.8% of all families. Conversely, the $15,000 to $24,999 income bracket is the least frequent group with only 7 families (0.4%) belonging to this category.
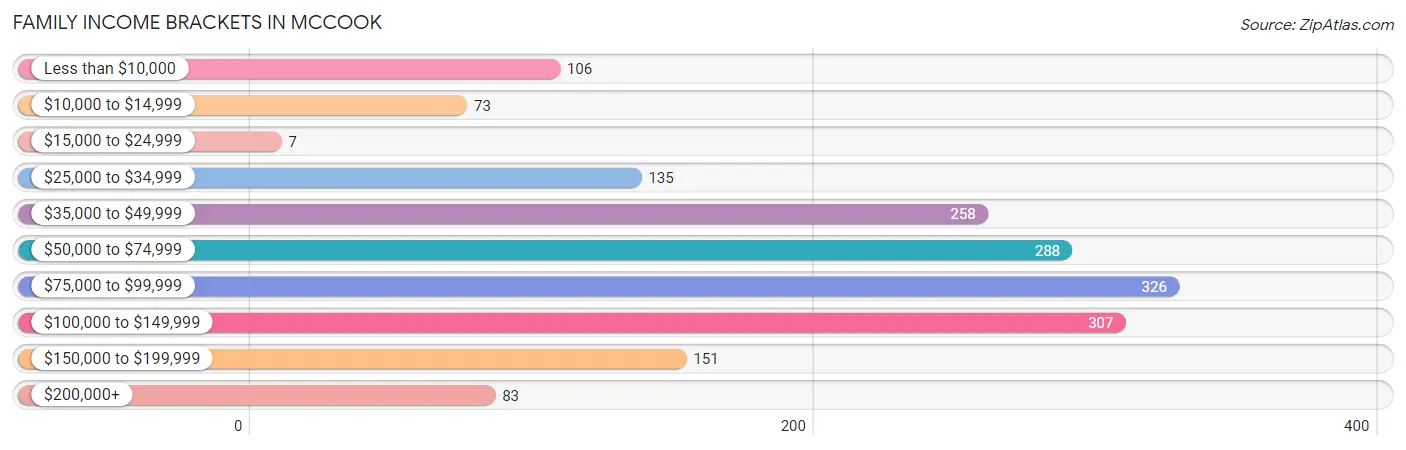
| Income Bracket | # Families | % Families |
| Less than $10,000 | 106 | 6.1% |
| $10,000 to $14,999 | 73 | 4.2% |
| $15,000 to $24,999 | 7 | 0.4% |
| $25,000 to $34,999 | 135 | 7.8% |
| $35,000 to $49,999 | 258 | 14.9% |
| $50,000 to $74,999 | 288 | 16.6% |
| $75,000 to $99,999 | 326 | 18.8% |
| $100,000 to $149,999 | 307 | 17.7% |
| $150,000 to $199,999 | 151 | 8.7% |
| $200,000+ | 83 | 4.8% |
Family Income by Famaliy Size in McCook
3-person families (409 | 23.6%) account for the highest median family income in McCook with $119,861 per family, while 3-person families (409 | 23.6%) have the highest median income of $39,954 per family member.
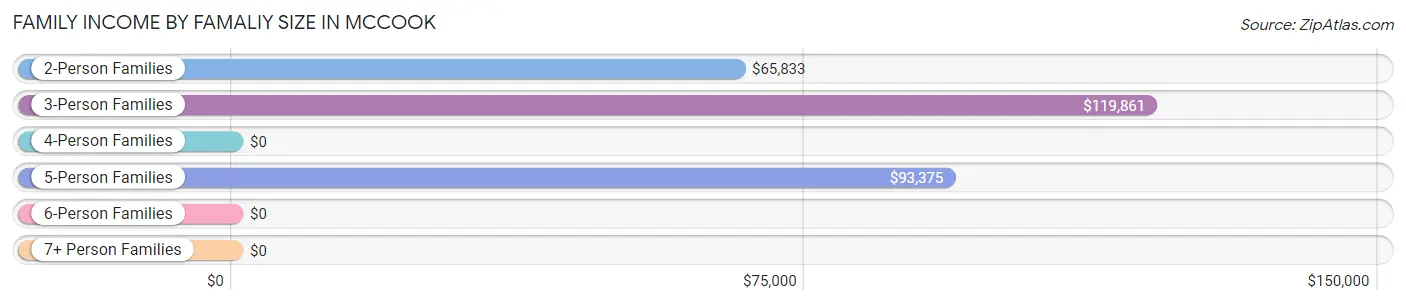
| Income Bracket | # Families | Median Income |
| 2-Person Families | 1,042 (60.1%) | $65,833 |
| 3-Person Families | 409 (23.6%) | $119,861 |
| 4-Person Families | 214 (12.3%) | $0 |
| 5-Person Families | 48 (2.8%) | $93,375 |
| 6-Person Families | 2 (0.1%) | $0 |
| 7+ Person Families | 19 (1.1%) | $0 |
| Total | 1,734 (100.0%) | $74,861 |
Family Income by Number of Earners in McCook
The median family income in McCook is $74,861, with families comprising 3+ earners (108) having the highest median family income of $119,167, while families with 1 earner (487) have the lowest median family income of $44,620, accounting for 6.2% and 28.1% of families, respectively.
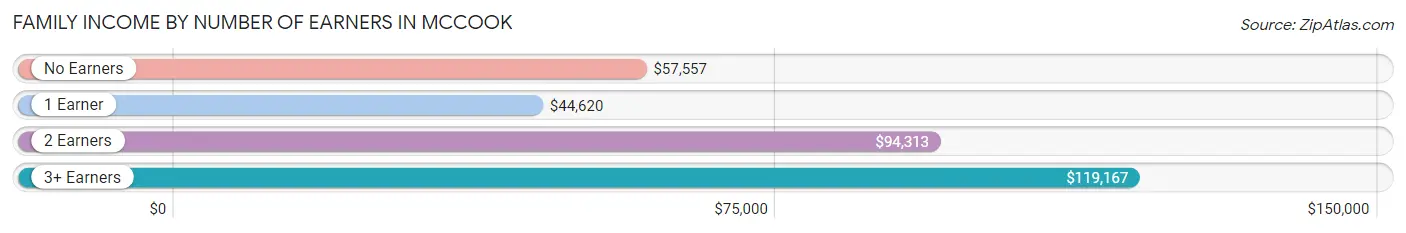
| Number of Earners | # Families | Median Income |
| No Earners | 302 (17.4%) | $57,557 |
| 1 Earner | 487 (28.1%) | $44,620 |
| 2 Earners | 837 (48.3%) | $94,313 |
| 3+ Earners | 108 (6.2%) | $119,167 |
| Total | 1,734 (100.0%) | $74,861 |
Household Income in McCook
Household Income Brackets in McCook
With 608 households falling in the category, the $35,000 to $49,999 income range is the most frequent in McCook, accounting for 19.2% of all households. In contrast, only 146 households (4.6%) fall into the $200,000+ income bracket, making it the least populous group.
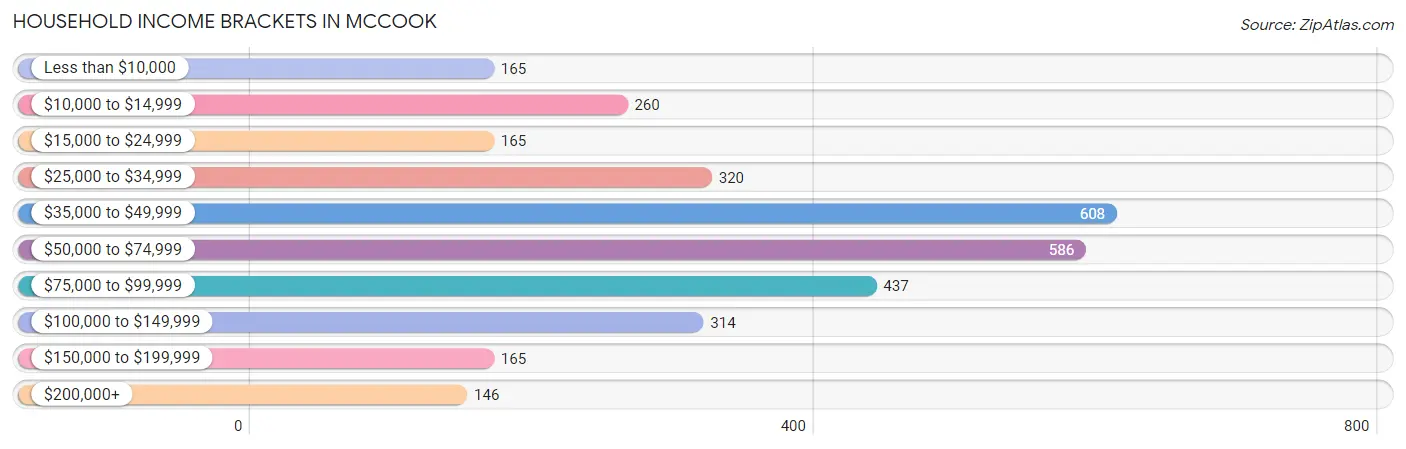
| Income Bracket | # Households | % Households |
| Less than $10,000 | 165 | 5.2% |
| $10,000 to $14,999 | 260 | 8.2% |
| $15,000 to $24,999 | 165 | 5.2% |
| $25,000 to $34,999 | 320 | 10.1% |
| $35,000 to $49,999 | 608 | 19.2% |
| $50,000 to $74,999 | 586 | 18.5% |
| $75,000 to $99,999 | 437 | 13.8% |
| $100,000 to $149,999 | 314 | 9.9% |
| $150,000 to $199,999 | 165 | 5.2% |
| $200,000+ | 146 | 4.6% |
Household Income by Householder Age in McCook
The median household income in McCook is $53,750, with the highest median household income of $71,042 found in the 45 to 64 years age bracket for the primary householder. A total of 1,094 households (34.5%) fall into this category. Meanwhile, the 15 to 24 years age bracket for the primary householder has the lowest median household income of $0, with 180 households (5.7%) in this group.
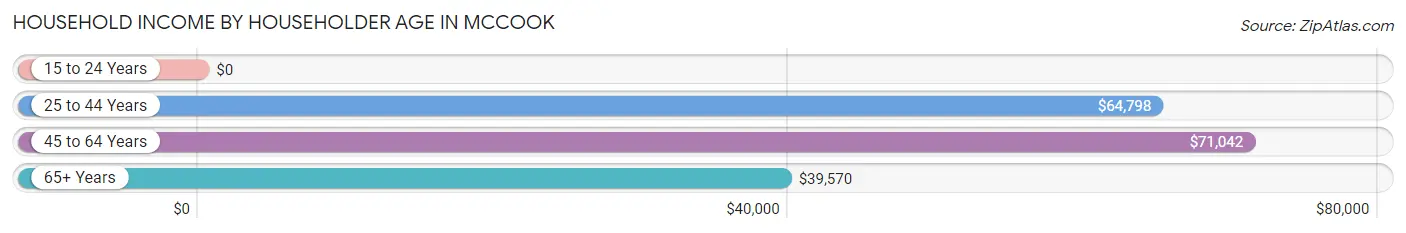
| Income Bracket | # Households | Median Income |
| 15 to 24 Years | 180 (5.7%) | $0 |
| 25 to 44 Years | 801 (25.3%) | $64,798 |
| 45 to 64 Years | 1,094 (34.5%) | $71,042 |
| 65+ Years | 1,093 (34.5%) | $39,570 |
| Total | 3,168 (100.0%) | $53,750 |
Poverty in McCook
Income Below Poverty by Sex and Age in McCook
With 13.1% poverty level for males and 14.6% for females among the residents of McCook, under 5 year old males and 18 to 24 year old females are the most vulnerable to poverty, with 82 males (54.3%) and 134 females (42.9%) in their respective age groups living below the poverty level.
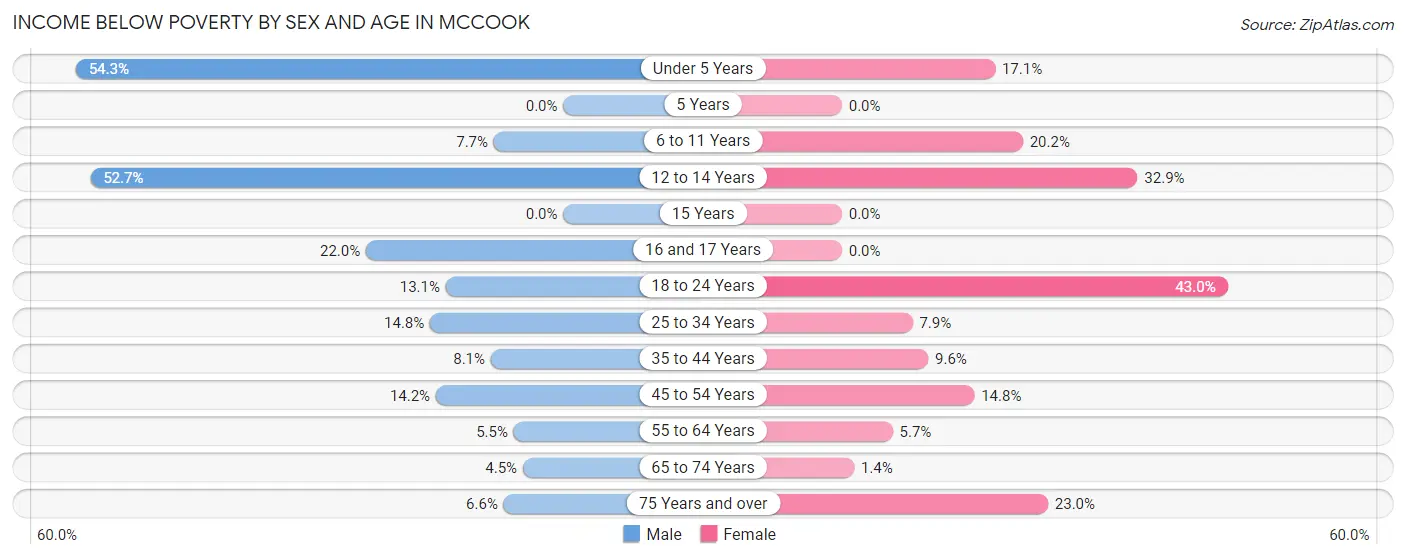
| Age Bracket | Male | Female |
| Under 5 Years | 82 (54.3%) | 36 (17.1%) |
| 5 Years | 0 (0.0%) | 0 (0.0%) |
| 6 to 11 Years | 24 (7.7%) | 53 (20.2%) |
| 12 to 14 Years | 49 (52.7%) | 53 (32.9%) |
| 15 Years | 0 (0.0%) | 0 (0.0%) |
| 16 and 17 Years | 29 (22.0%) | 0 (0.0%) |
| 18 to 24 Years | 47 (13.1%) | 134 (42.9%) |
| 25 to 34 Years | 54 (14.8%) | 31 (7.9%) |
| 35 to 44 Years | 36 (8.1%) | 42 (9.6%) |
| 45 to 54 Years | 67 (14.2%) | 73 (14.7%) |
| 55 to 64 Years | 24 (5.5%) | 28 (5.7%) |
| 65 to 74 Years | 18 (4.5%) | 6 (1.4%) |
| 75 Years and over | 18 (6.6%) | 98 (23.0%) |
| Total | 448 (13.1%) | 554 (14.6%) |
Income Above Poverty by Sex and Age in McCook
According to the poverty statistics in McCook, males aged 65 to 74 years and females aged 5 years are the age groups that are most secure financially, with 95.5% of males and 100.0% of females in these age groups living above the poverty line.
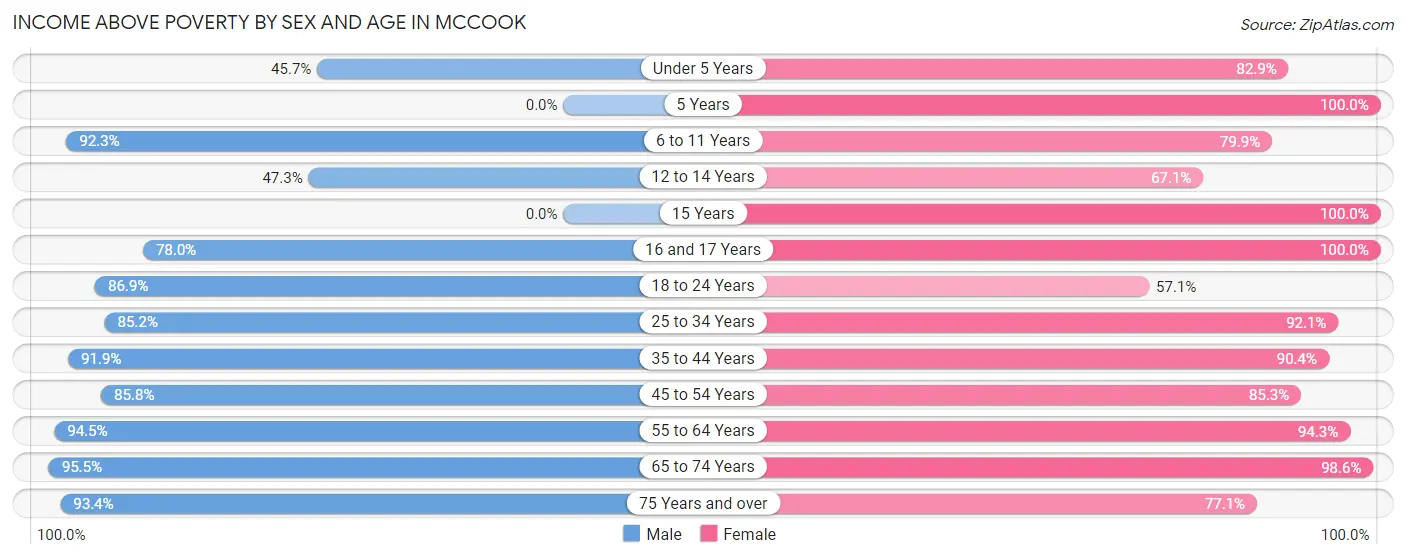
| Age Bracket | Male | Female |
| Under 5 Years | 69 (45.7%) | 175 (82.9%) |
| 5 Years | 0 (0.0%) | 39 (100.0%) |
| 6 to 11 Years | 286 (92.3%) | 210 (79.8%) |
| 12 to 14 Years | 44 (47.3%) | 108 (67.1%) |
| 15 Years | 0 (0.0%) | 34 (100.0%) |
| 16 and 17 Years | 103 (78.0%) | 80 (100.0%) |
| 18 to 24 Years | 312 (86.9%) | 178 (57.1%) |
| 25 to 34 Years | 310 (85.2%) | 363 (92.1%) |
| 35 to 44 Years | 410 (91.9%) | 395 (90.4%) |
| 45 to 54 Years | 405 (85.8%) | 422 (85.3%) |
| 55 to 64 Years | 411 (94.5%) | 467 (94.3%) |
| 65 to 74 Years | 382 (95.5%) | 436 (98.6%) |
| 75 Years and over | 253 (93.4%) | 329 (77.0%) |
| Total | 2,985 (87.0%) | 3,236 (85.4%) |
Income Below Poverty Among Married-Couple Families in McCook
The poverty statistics for married-couple families in McCook show that 6.8% or 98 of the total 1,449 families live below the poverty line. Families with 1 or 2 children have the highest poverty rate of 12.7%, comprising of 57 families. On the other hand, families with 3 or 4 children have the lowest poverty rate of 0.0%, which includes 0 families.
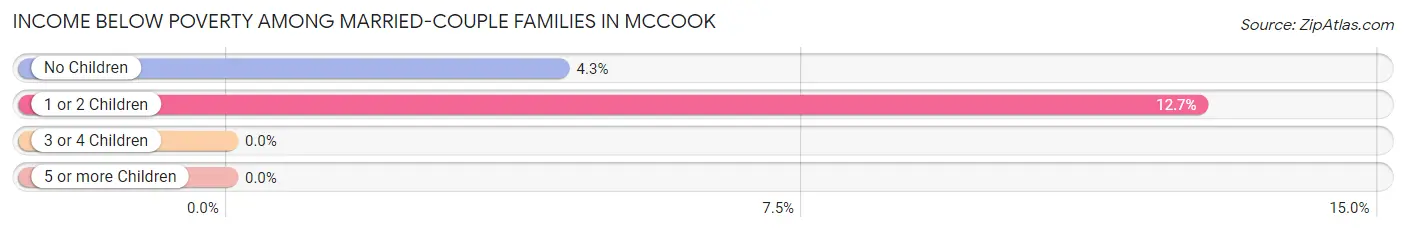
| Children | Above Poverty | Below Poverty |
| No Children | 906 (95.7%) | 41 (4.3%) |
| 1 or 2 Children | 393 (87.3%) | 57 (12.7%) |
| 3 or 4 Children | 33 (100.0%) | 0 (0.0%) |
| 5 or more Children | 19 (100.0%) | 0 (0.0%) |
| Total | 1,351 (93.2%) | 98 (6.8%) |
Income Below Poverty Among Single-Parent Households in McCook
According to the poverty data in McCook, 29.7% or 27 single-father households and 27.3% or 53 single-mother households are living below the poverty line. Among single-father households, those with 1 or 2 children have the highest poverty rate, with 27 households (45.0%) experiencing poverty. Likewise, among single-mother households, those with 1 or 2 children have the highest poverty rate, with 53 households (35.6%) falling below the poverty line.
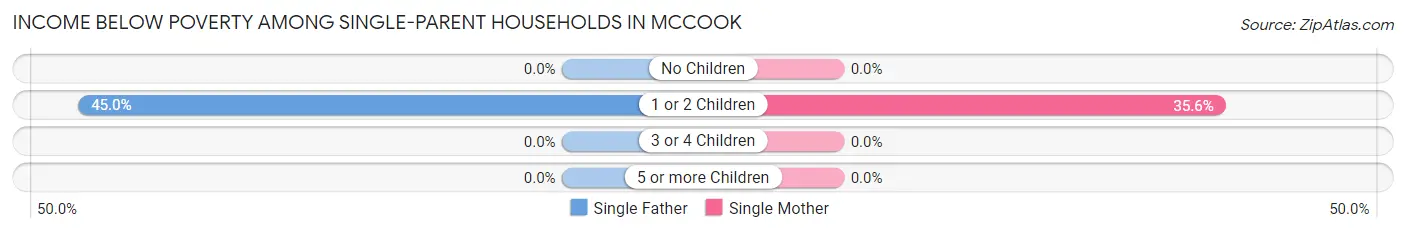
| Children | Single Father | Single Mother |
| No Children | 0 (0.0%) | 0 (0.0%) |
| 1 or 2 Children | 27 (45.0%) | 53 (35.6%) |
| 3 or 4 Children | 0 (0.0%) | 0 (0.0%) |
| 5 or more Children | 0 (0.0%) | 0 (0.0%) |
| Total | 27 (29.7%) | 53 (27.3%) |
Income Below Poverty Among Married-Couple vs Single-Parent Households in McCook
The poverty data for McCook shows that 98 of the married-couple family households (6.8%) and 80 of the single-parent households (28.1%) are living below the poverty level. Within the married-couple family households, those with 1 or 2 children have the highest poverty rate, with 57 households (12.7%) falling below the poverty line. Among the single-parent households, those with 1 or 2 children have the highest poverty rate, with 80 household (38.3%) living below poverty.
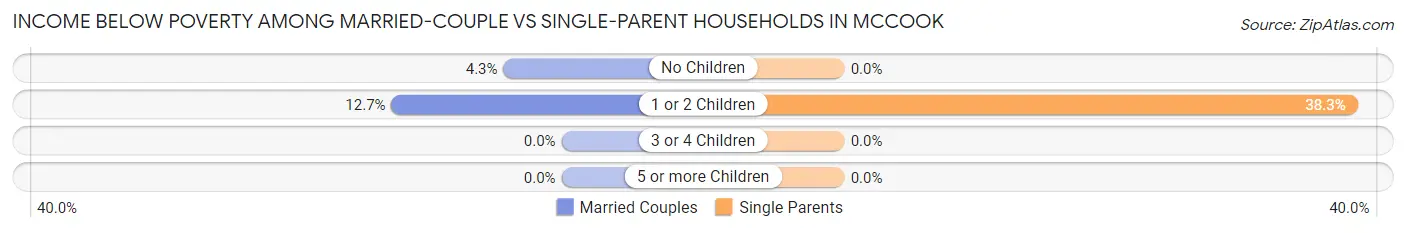
| Children | Married-Couple Families | Single-Parent Households |
| No Children | 41 (4.3%) | 0 (0.0%) |
| 1 or 2 Children | 57 (12.7%) | 80 (38.3%) |
| 3 or 4 Children | 0 (0.0%) | 0 (0.0%) |
| 5 or more Children | 0 (0.0%) | 0 (0.0%) |
| Total | 98 (6.8%) | 80 (28.1%) |
Race in McCook
The most populous races in McCook are White / Caucasian (6,795 | 91.7%), Hispanic or Latino (335 | 4.5%), and Two or more Races (315 | 4.3%).
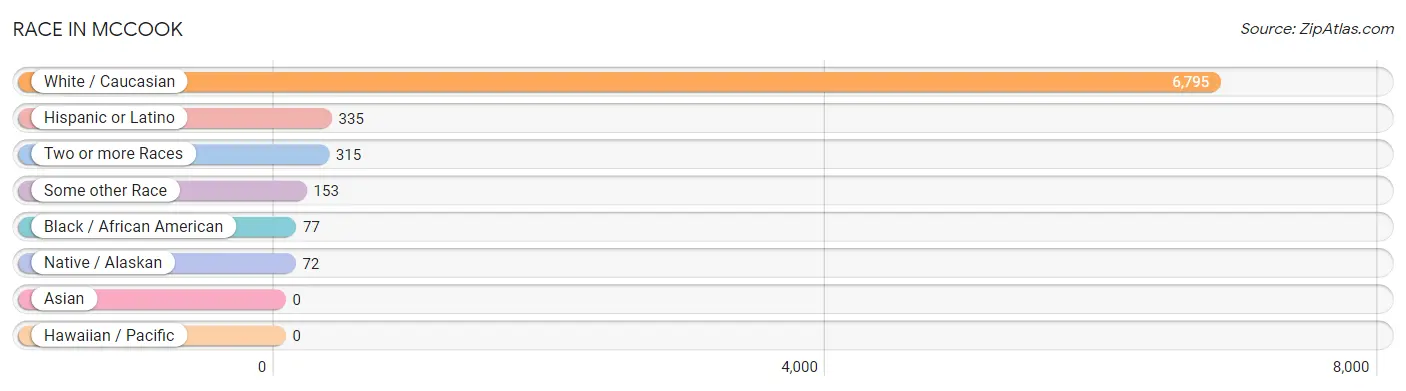
| Race | # Population | % Population |
| Asian | 0 | 0.0% |
| Black / African American | 77 | 1.0% |
| Hawaiian / Pacific | 0 | 0.0% |
| Hispanic or Latino | 335 | 4.5% |
| Native / Alaskan | 72 | 1.0% |
| White / Caucasian | 6,795 | 91.7% |
| Two or more Races | 315 | 4.3% |
| Some other Race | 153 | 2.1% |
| Total | 7,412 | 100.0% |
Ancestry in McCook
The most populous ancestries reported in McCook are German (3,237 | 43.7%), English (792 | 10.7%), Irish (762 | 10.3%), Scottish (416 | 5.6%), and European (354 | 4.8%), together accounting for 75.0% of all McCook residents.
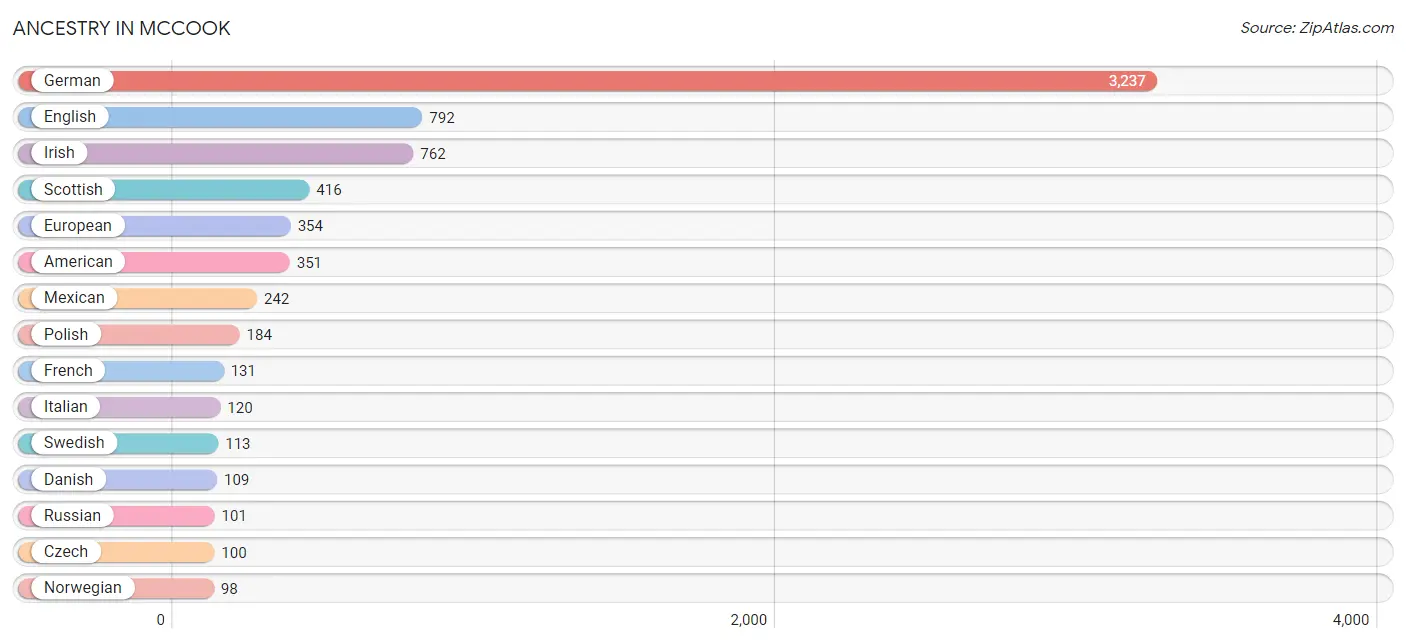
| Ancestry | # Population | % Population |
| Alaska Native | 5 | 0.1% |
| American | 351 | 4.7% |
| Apache | 80 | 1.1% |
| Austrian | 20 | 0.3% |
| Celtic | 10 | 0.1% |
| Cherokee | 51 | 0.7% |
| Chippewa | 24 | 0.3% |
| Czech | 100 | 1.3% |
| Czechoslovakian | 17 | 0.2% |
| Danish | 109 | 1.5% |
| Dutch | 83 | 1.1% |
| English | 792 | 10.7% |
| European | 354 | 4.8% |
| French | 131 | 1.8% |
| French Canadian | 26 | 0.4% |
| German | 3,237 | 43.7% |
| German Russian | 9 | 0.1% |
| Greek | 4 | 0.1% |
| Indian (Asian) | 40 | 0.5% |
| Irish | 762 | 10.3% |
| Italian | 120 | 1.6% |
| Jamaican | 27 | 0.4% |
| Lithuanian | 17 | 0.2% |
| Mexican | 242 | 3.3% |
| Navajo | 81 | 1.1% |
| Norwegian | 98 | 1.3% |
| Polish | 184 | 2.5% |
| Puerto Rican | 4 | 0.1% |
| Russian | 101 | 1.4% |
| Scandinavian | 14 | 0.2% |
| Scotch-Irish | 48 | 0.6% |
| Scottish | 416 | 5.6% |
| Sioux | 11 | 0.2% |
| Slavic | 12 | 0.2% |
| Spaniard | 80 | 1.1% |
| Swedish | 113 | 1.5% |
| Swiss | 43 | 0.6% |
| Welsh | 17 | 0.2% | View All 38 Rows |
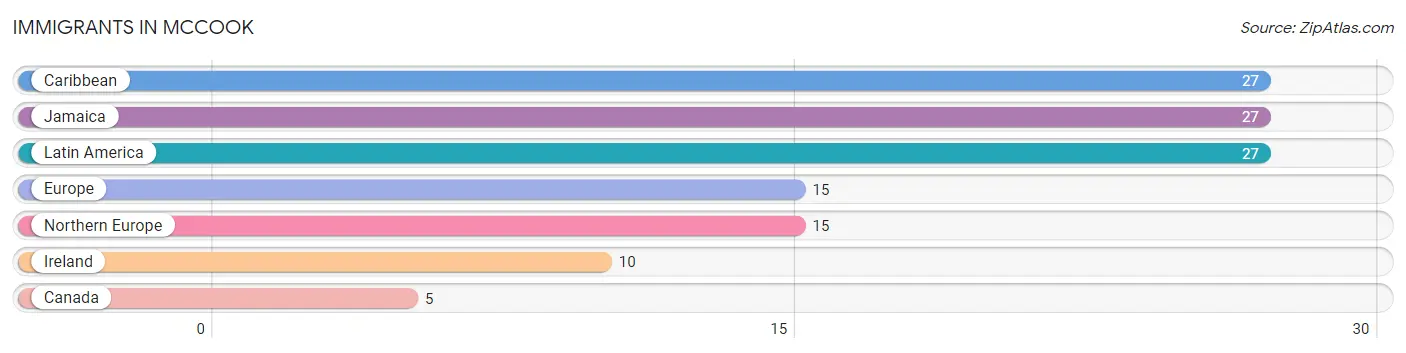
Immigrants in McCook
The most numerous immigrant groups reported in McCook came from Caribbean (27 | 0.4%), Jamaica (27 | 0.4%), Latin America (27 | 0.4%), Europe (15 | 0.2%), and Northern Europe (15 | 0.2%), together accounting for 1.5% of all McCook residents.
| Immigration Origin | # Population | % Population |
| Canada | 5 | 0.1% |
| Caribbean | 27 | 0.4% |
| Europe | 15 | 0.2% |
| Ireland | 10 | 0.1% |
| Jamaica | 27 | 0.4% |
| Latin America | 27 | 0.4% |
| Northern Europe | 15 | 0.2% | View All 7 Rows |
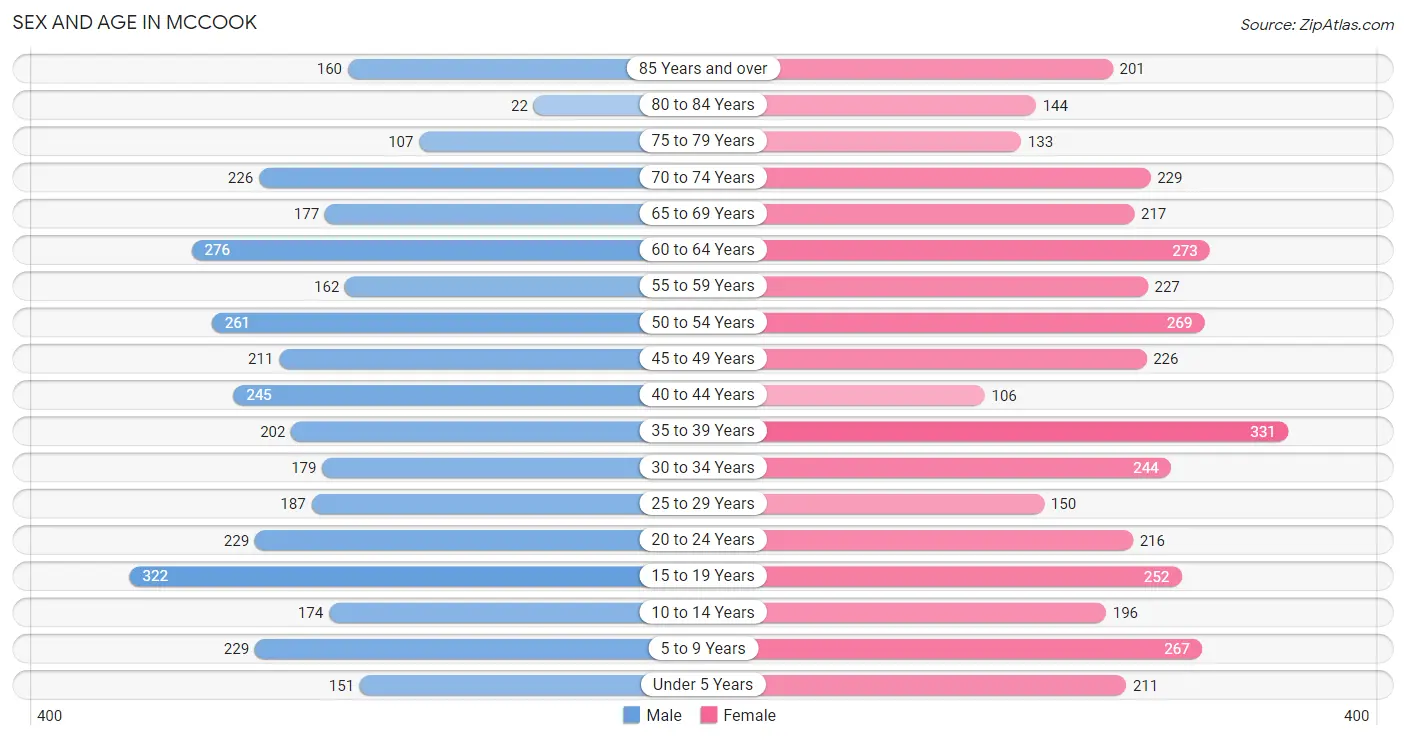
Sex and Age in McCook
Sex and Age in McCook
The most populous age groups in McCook are 15 to 19 Years (322 | 9.1%) for men and 35 to 39 Years (331 | 8.5%) for women.
| Age Bracket | Male | Female |
| Under 5 Years | 151 (4.3%) | 211 (5.4%) |
| 5 to 9 Years | 229 (6.5%) | 267 (6.9%) |
| 10 to 14 Years | 174 (4.9%) | 196 (5.0%) |
| 15 to 19 Years | 322 (9.1%) | 252 (6.5%) |
| 20 to 24 Years | 229 (6.5%) | 216 (5.6%) |
| 25 to 29 Years | 187 (5.3%) | 150 (3.8%) |
| 30 to 34 Years | 179 (5.1%) | 244 (6.3%) |
| 35 to 39 Years | 202 (5.7%) | 331 (8.5%) |
| 40 to 44 Years | 245 (7.0%) | 106 (2.7%) |
| 45 to 49 Years | 211 (6.0%) | 226 (5.8%) |
| 50 to 54 Years | 261 (7.4%) | 269 (6.9%) |
| 55 to 59 Years | 162 (4.6%) | 227 (5.8%) |
| 60 to 64 Years | 276 (7.8%) | 273 (7.0%) |
| 65 to 69 Years | 177 (5.0%) | 217 (5.6%) |
| 70 to 74 Years | 226 (6.4%) | 229 (5.9%) |
| 75 to 79 Years | 107 (3.0%) | 133 (3.4%) |
| 80 to 84 Years | 22 (0.6%) | 144 (3.7%) |
| 85 Years and over | 160 (4.5%) | 201 (5.2%) |
| Total | 3,520 (100.0%) | 3,892 (100.0%) |
Families and Households in McCook
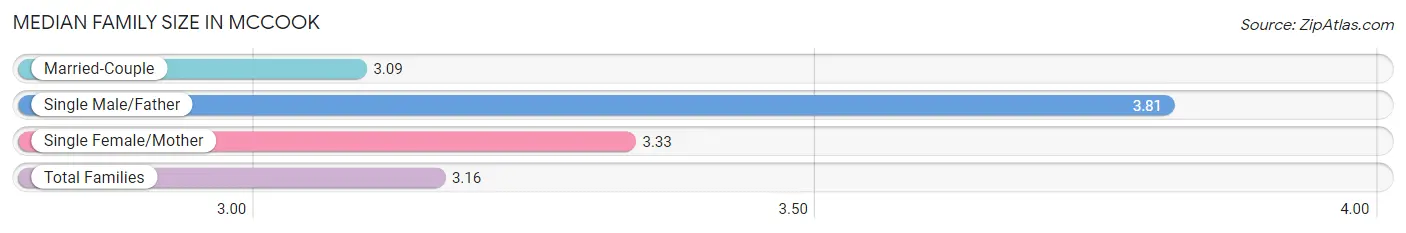
Median Family Size in McCook
The median family size in McCook is 3.16 persons per family, with single male/father families (91 | 5.2%) accounting for the largest median family size of 3.81 persons per family. On the other hand, married-couple families (1,449 | 83.6%) represent the smallest median family size with 3.09 persons per family.
| Family Type | # Families | Family Size |
| Married-Couple | 1,449 (83.6%) | 3.09 |
| Single Male/Father | 91 (5.2%) | 3.81 |
| Single Female/Mother | 194 (11.2%) | 3.33 |
| Total Families | 1,734 (100.0%) | 3.16 |
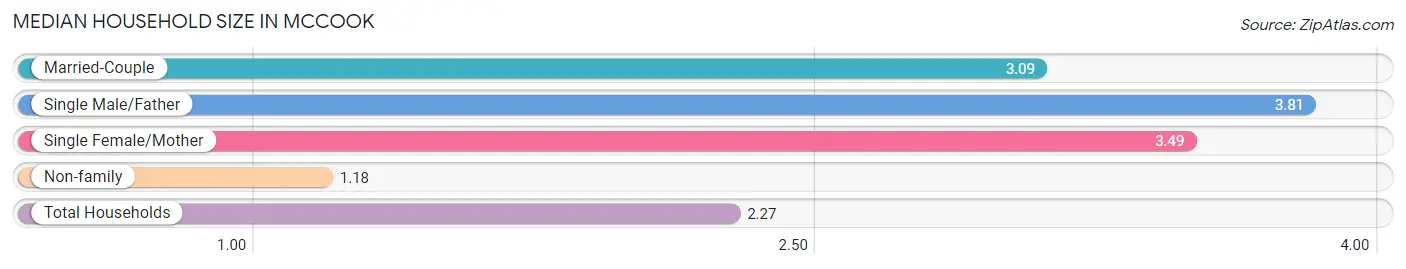
Median Household Size in McCook
The median household size in McCook is 2.27 persons per household, with single male/father households (91 | 2.9%) accounting for the largest median household size of 3.81 persons per household. non-family households (1,434 | 45.3%) represent the smallest median household size with 1.18 persons per household.
| Household Type | # Households | Household Size |
| Married-Couple | 1,449 (45.7%) | 3.09 |
| Single Male/Father | 91 (2.9%) | 3.81 |
| Single Female/Mother | 194 (6.1%) | 3.49 |
| Non-family | 1,434 (45.3%) | 1.18 |
| Total Households | 3,168 (100.0%) | 2.27 |
Household Size by Marriage Status in McCook
Out of a total of 3,168 households in McCook, 1,734 (54.7%) are family households, while 1,434 (45.3%) are nonfamily households. The most numerous type of family households are 2-person households, comprising 1,042, and the most common type of nonfamily households are 1-person households, comprising 1,253.
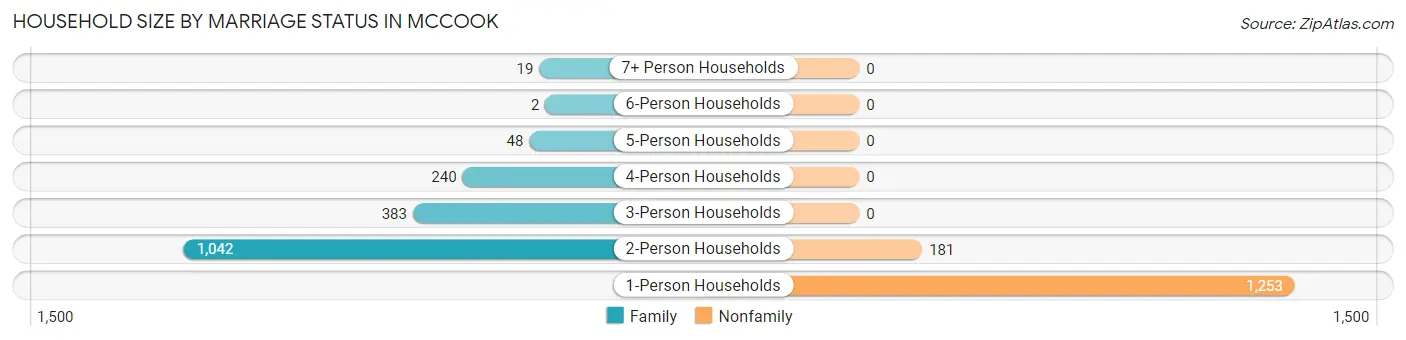
| Household Size | Family Households | Nonfamily Households |
| 1-Person Households | - | 1,253 (39.6%) |
| 2-Person Households | 1,042 (32.9%) | 181 (5.7%) |
| 3-Person Households | 383 (12.1%) | 0 (0.0%) |
| 4-Person Households | 240 (7.6%) | 0 (0.0%) |
| 5-Person Households | 48 (1.5%) | 0 (0.0%) |
| 6-Person Households | 2 (0.1%) | 0 (0.0%) |
| 7+ Person Households | 19 (0.6%) | 0 (0.0%) |
| Total | 1,734 (54.7%) | 1,434 (45.3%) |
Female Fertility in McCook
Fertility by Age in McCook
Average fertility rate in McCook is 63.0 births per 1,000 women. Women in the age bracket of 20 to 34 years have the highest fertility rate with 80.0 births per 1,000 women. Women in the age bracket of 35 to 50 years acount for 51.5% of all women with births.
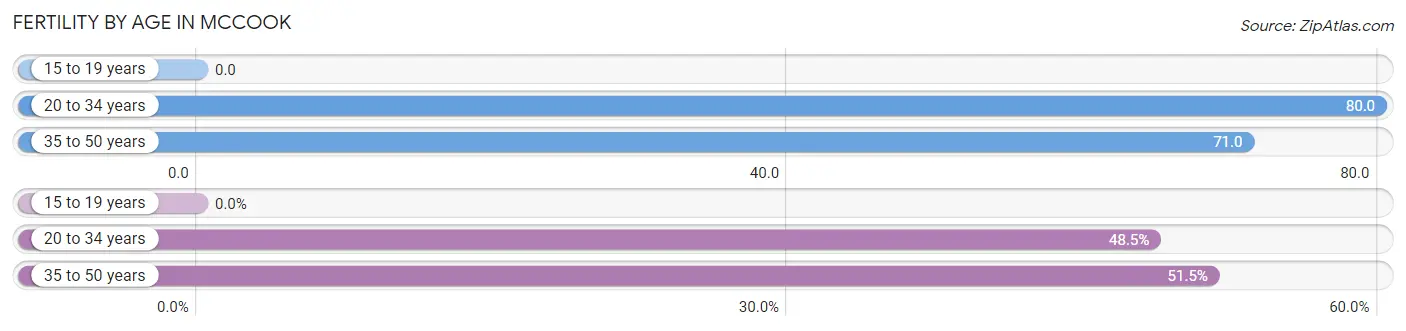
| Age Bracket | Women with Births | Births / 1,000 Women |
| 15 to 19 years | 0 (0.0%) | 0.0 |
| 20 to 34 years | 49 (48.5%) | 80.0 |
| 35 to 50 years | 52 (51.5%) | 71.0 |
| Total | 101 (100.0%) | 63.0 |
Fertility by Age by Marriage Status in McCook
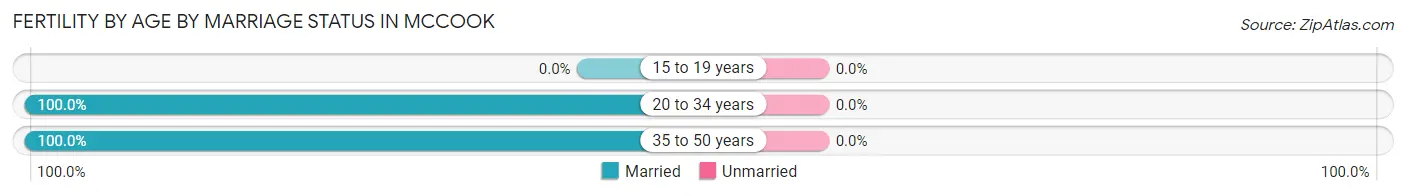
| Age Bracket | Married | Unmarried |
| 15 to 19 years | 0 (0.0%) | 0 (0.0%) |
| 20 to 34 years | 49 (100.0%) | 0 (0.0%) |
| 35 to 50 years | 52 (100.0%) | 0 (0.0%) |
| Total | 101 (100.0%) | 0 (0.0%) |
Fertility by Education in McCook
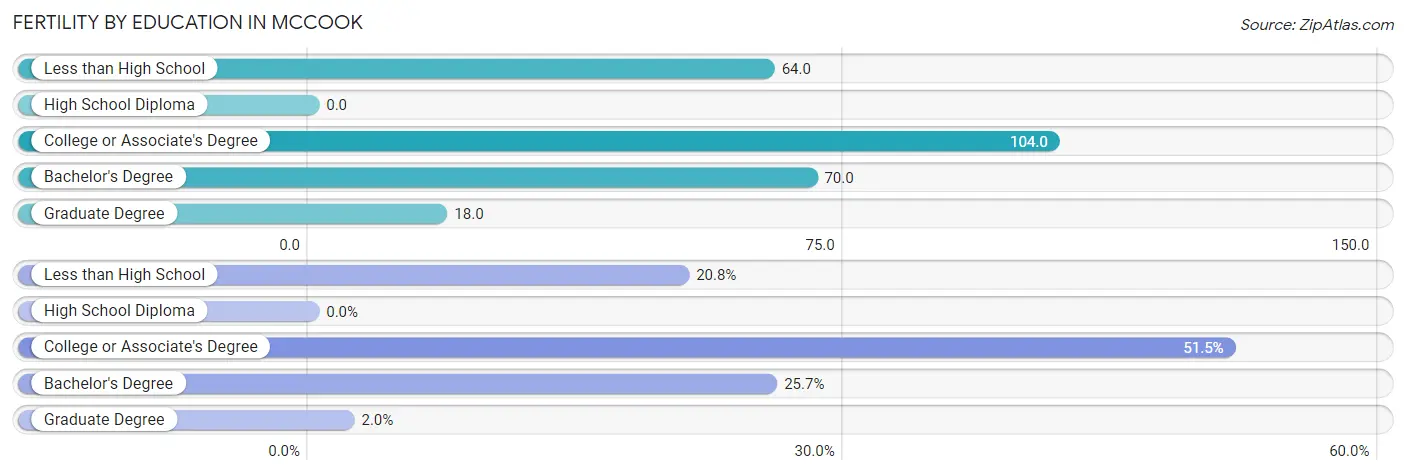
| Educational Attainment | Women with Births | Births / 1,000 Women |
| Less than High School | 21 (20.8%) | 64.0 |
| High School Diploma | 0 (0.0%) | 0.0 |
| College or Associate's Degree | 52 (51.5%) | 104.0 |
| Bachelor's Degree | 26 (25.7%) | 70.0 |
| Graduate Degree | 2 (2.0%) | 18.0 |
| Total | 101 (100.0%) | 63.0 |
Fertility by Education by Marriage Status in McCook
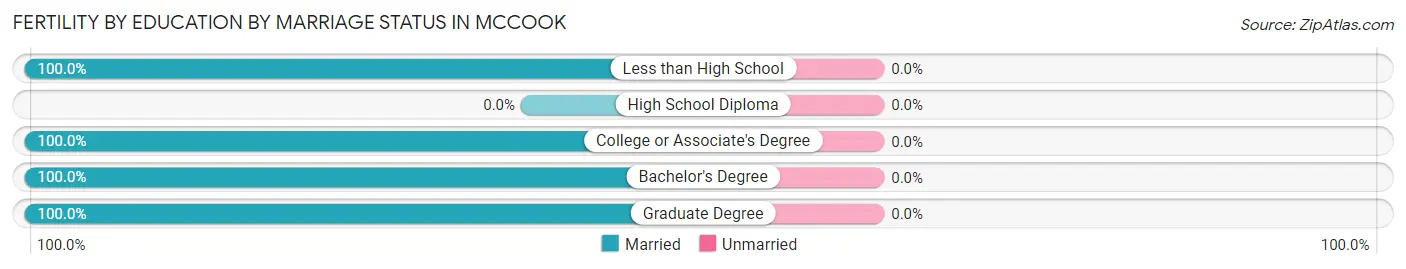
| Educational Attainment | Married | Unmarried |
| Less than High School | 21 (100.0%) | 0 (0.0%) |
| High School Diploma | 0 (0.0%) | 0 (0.0%) |
| College or Associate's Degree | 52 (100.0%) | 0 (0.0%) |
| Bachelor's Degree | 26 (100.0%) | 0 (0.0%) |
| Graduate Degree | 2 (100.0%) | 0 (0.0%) |
| Total | 101 (100.0%) | 0 (0.0%) |
Employment Characteristics in McCook
Employment by Class of Employer in McCook
Among the 3,723 employed individuals in McCook, private company employees (2,485 | 66.7%), self-employed (not incorporated) (299 | 8.0%), and self-employed (incorporated) (269 | 7.2%) make up the most common classes of employment.
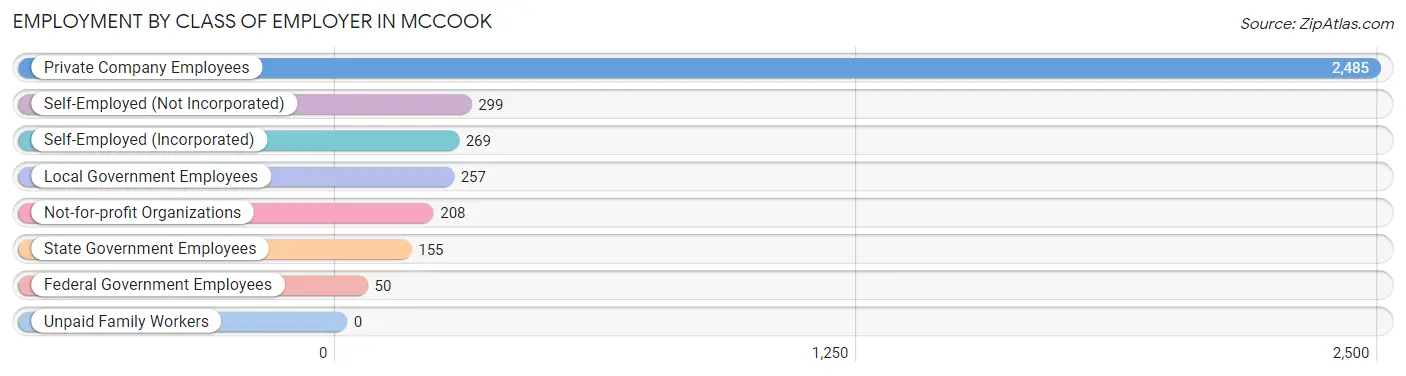
| Employer Class | # Employees | % Employees |
| Private Company Employees | 2,485 | 66.7% |
| Self-Employed (Incorporated) | 269 | 7.2% |
| Self-Employed (Not Incorporated) | 299 | 8.0% |
| Not-for-profit Organizations | 208 | 5.6% |
| Local Government Employees | 257 | 6.9% |
| State Government Employees | 155 | 4.2% |
| Federal Government Employees | 50 | 1.3% |
| Unpaid Family Workers | 0 | 0.0% |
| Total | 3,723 | 100.0% |
Employment Status by Age in McCook
According to the labor force statistics for McCook, out of the total population over 16 years of age (6,150), 63.7% or 3,918 individuals are in the labor force, with 2.6% or 102 of them unemployed. The age group with the highest labor force participation rate is 30 to 34 years, with 98.8% or 418 individuals in the labor force. Within the labor force, the 20 to 24 years age range has the highest percentage of unemployed individuals, with 20.7% or 57 of them being unemployed.
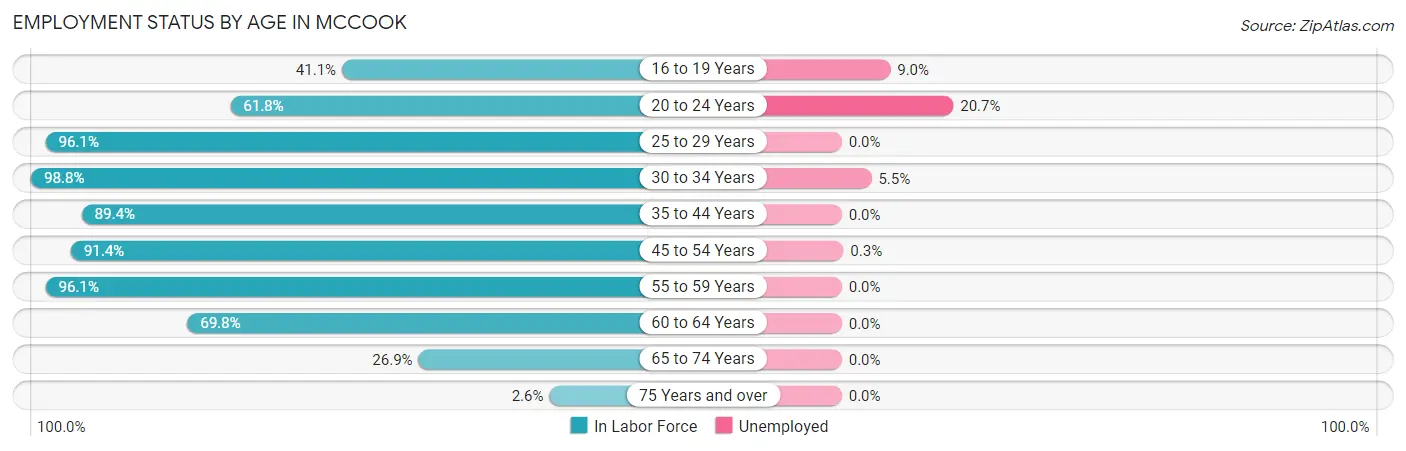
| Age Bracket | In Labor Force | Unemployed |
| 16 to 19 Years | 222 (41.1%) | 20 (9.0%) |
| 20 to 24 Years | 275 (61.8%) | 57 (20.7%) |
| 25 to 29 Years | 324 (96.1%) | 0 (0.0%) |
| 30 to 34 Years | 418 (98.8%) | 23 (5.5%) |
| 35 to 44 Years | 790 (89.4%) | 0 (0.0%) |
| 45 to 54 Years | 884 (91.4%) | 3 (0.3%) |
| 55 to 59 Years | 374 (96.1%) | 0 (0.0%) |
| 60 to 64 Years | 383 (69.8%) | 0 (0.0%) |
| 65 to 74 Years | 228 (26.9%) | 0 (0.0%) |
| 75 Years and over | 20 (2.6%) | 0 (0.0%) |
| Total | 3,918 (63.7%) | 102 (2.6%) |
Employment Status by Educational Attainment in McCook
According to labor force statistics for McCook, 89.4% of individuals (3,173) out of the total population between 25 and 64 years of age (3,549) are in the labor force, with 0.8% or 25 of them being unemployed. The group with the highest labor force participation rate are those with the educational attainment of bachelor's degree or higher, with 94.4% or 917 individuals in the labor force. Within the labor force, individuals with bachelor's degree or higher education have the highest percentage of unemployment, with 2.8% or 26 of them being unemployed.
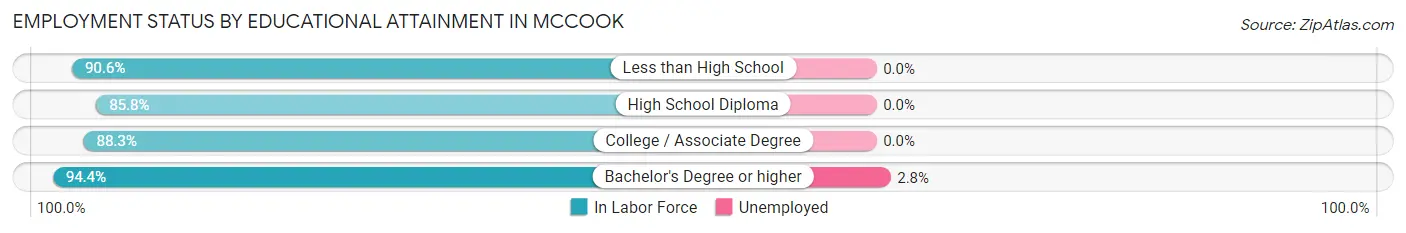
| Educational Attainment | In Labor Force | Unemployed |
| Less than High School | 231 (90.6%) | 0 (0.0%) |
| High School Diploma | 875 (85.8%) | 0 (0.0%) |
| College / Associate Degree | 1,151 (88.3%) | 0 (0.0%) |
| Bachelor's Degree or higher | 917 (94.4%) | 27 (2.8%) |
| Total | 3,173 (89.4%) | 28 (0.8%) |
Employment Occupations by Sex in McCook
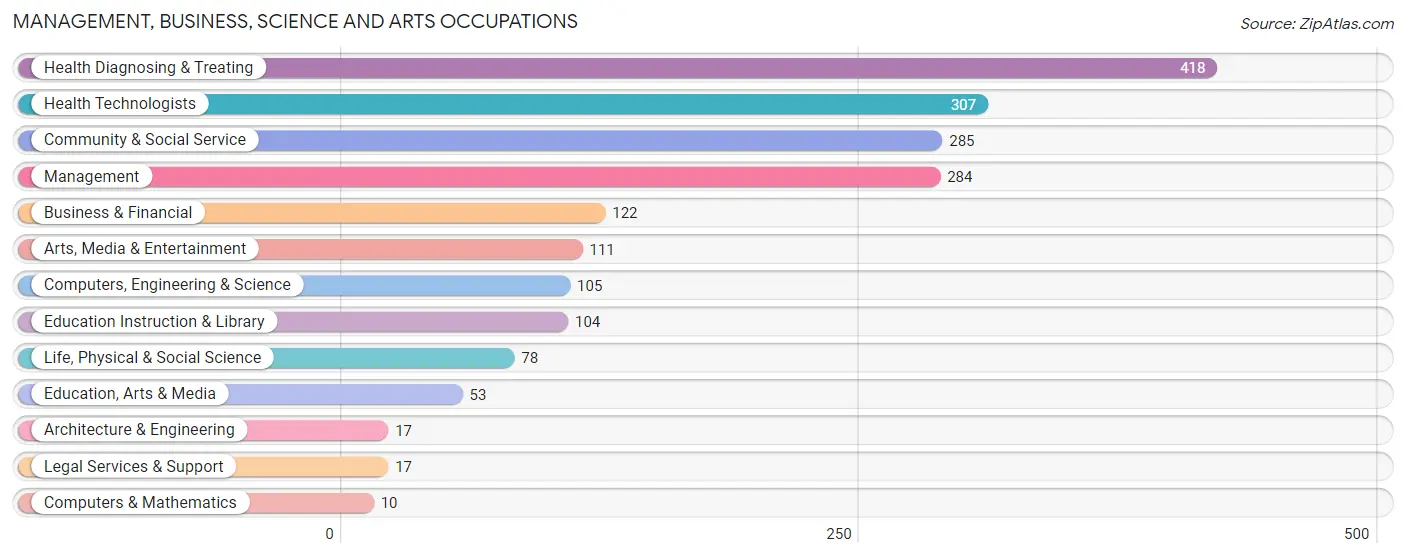
Management, Business, Science and Arts Occupations
The most common Management, Business, Science and Arts occupations in McCook are Health Diagnosing & Treating (418 | 11.0%), Health Technologists (307 | 8.1%), Community & Social Service (285 | 7.5%), Management (284 | 7.4%), and Business & Financial (122 | 3.2%).
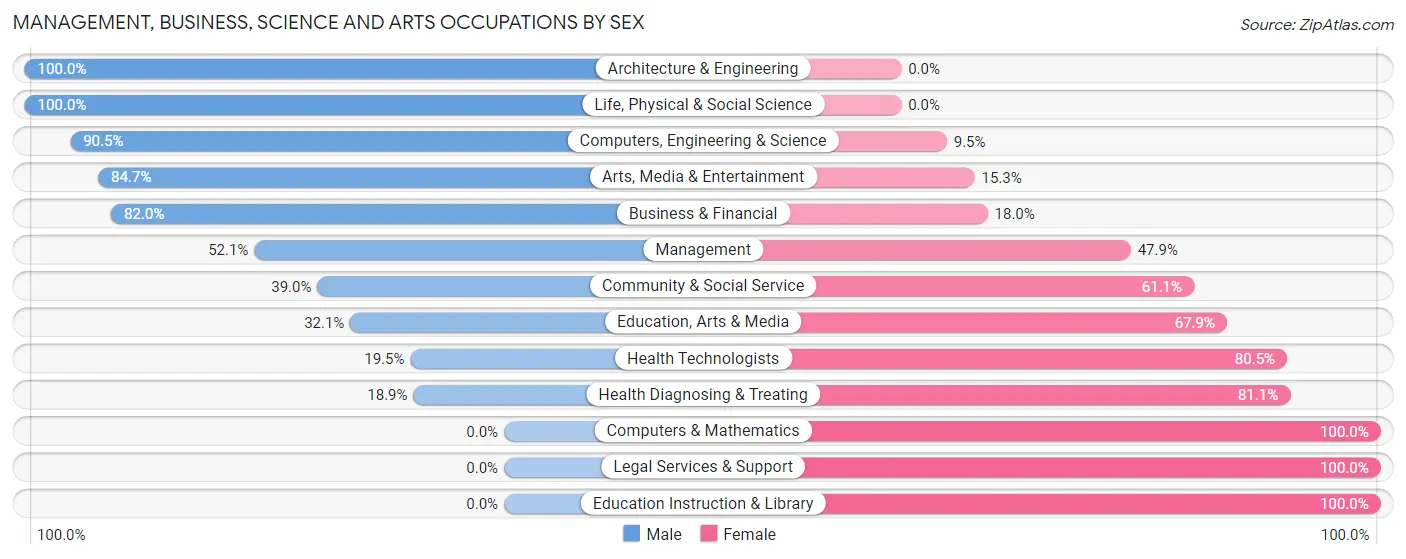
Management, Business, Science and Arts Occupations by Sex
Within the Management, Business, Science and Arts occupations in McCook, the most male-oriented occupations are Architecture & Engineering (100.0%), Life, Physical & Social Science (100.0%), and Computers, Engineering & Science (90.5%), while the most female-oriented occupations are Computers & Mathematics (100.0%), Legal Services & Support (100.0%), and Education Instruction & Library (100.0%).
| Occupation | Male | Female |
| Management | 148 (52.1%) | 136 (47.9%) |
| Business & Financial | 100 (82.0%) | 22 (18.0%) |
| Computers, Engineering & Science | 95 (90.5%) | 10 (9.5%) |
| Computers & Mathematics | 0 (0.0%) | 10 (100.0%) |
| Architecture & Engineering | 17 (100.0%) | 0 (0.0%) |
| Life, Physical & Social Science | 78 (100.0%) | 0 (0.0%) |
| Community & Social Service | 111 (39.0%) | 174 (61.1%) |
| Education, Arts & Media | 17 (32.1%) | 36 (67.9%) |
| Legal Services & Support | 0 (0.0%) | 17 (100.0%) |
| Education Instruction & Library | 0 (0.0%) | 104 (100.0%) |
| Arts, Media & Entertainment | 94 (84.7%) | 17 (15.3%) |
| Health Diagnosing & Treating | 79 (18.9%) | 339 (81.1%) |
| Health Technologists | 60 (19.5%) | 247 (80.5%) |
| Total (Category) | 533 (43.9%) | 681 (56.1%) |
| Total (Overall) | 1,946 (51.0%) | 1,869 (49.0%) |
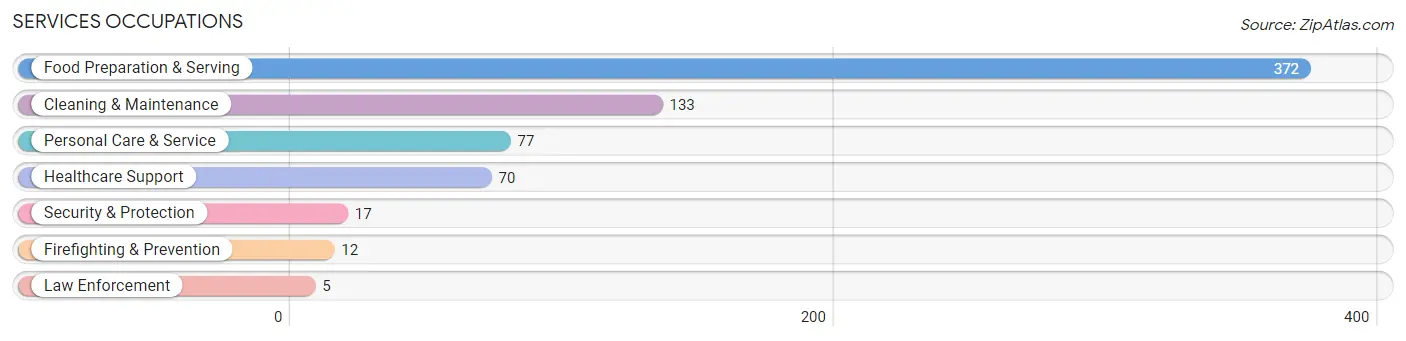
Services Occupations
The most common Services occupations in McCook are Food Preparation & Serving (372 | 9.8%), Cleaning & Maintenance (133 | 3.5%), Personal Care & Service (77 | 2.0%), Healthcare Support (70 | 1.8%), and Security & Protection (17 | 0.4%).
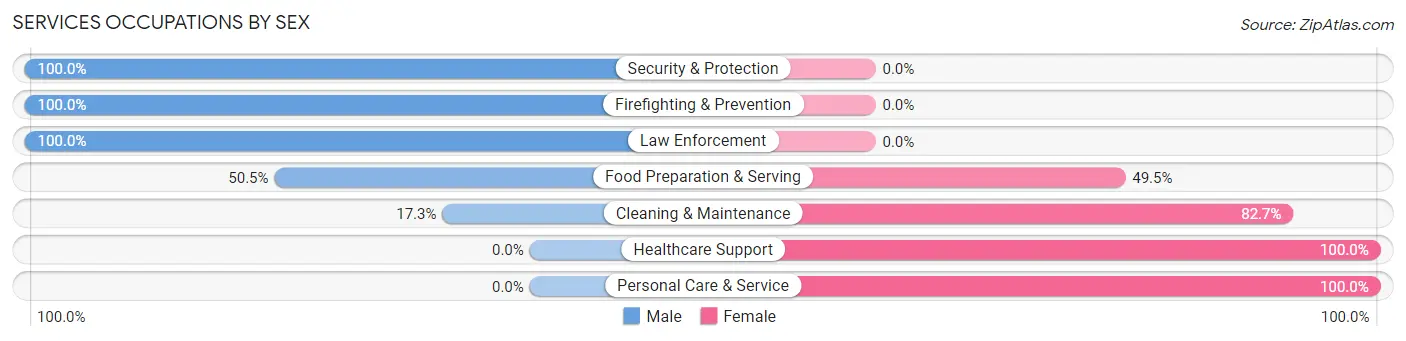
Services Occupations by Sex
Within the Services occupations in McCook, the most male-oriented occupations are Security & Protection (100.0%), Firefighting & Prevention (100.0%), and Law Enforcement (100.0%), while the most female-oriented occupations are Healthcare Support (100.0%), Personal Care & Service (100.0%), and Cleaning & Maintenance (82.7%).
| Occupation | Male | Female |
| Healthcare Support | 0 (0.0%) | 70 (100.0%) |
| Security & Protection | 17 (100.0%) | 0 (0.0%) |
| Firefighting & Prevention | 12 (100.0%) | 0 (0.0%) |
| Law Enforcement | 5 (100.0%) | 0 (0.0%) |
| Food Preparation & Serving | 188 (50.5%) | 184 (49.5%) |
| Cleaning & Maintenance | 23 (17.3%) | 110 (82.7%) |
| Personal Care & Service | 0 (0.0%) | 77 (100.0%) |
| Total (Category) | 228 (34.1%) | 441 (65.9%) |
| Total (Overall) | 1,946 (51.0%) | 1,869 (49.0%) |
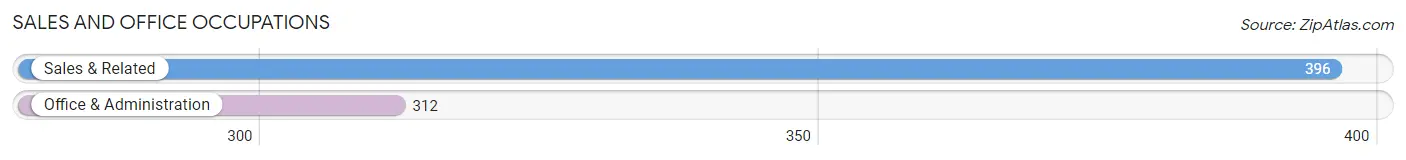
Sales and Office Occupations
The most common Sales and Office occupations in McCook are Sales & Related (396 | 10.4%), and Office & Administration (312 | 8.2%).
Sales and Office Occupations by Sex
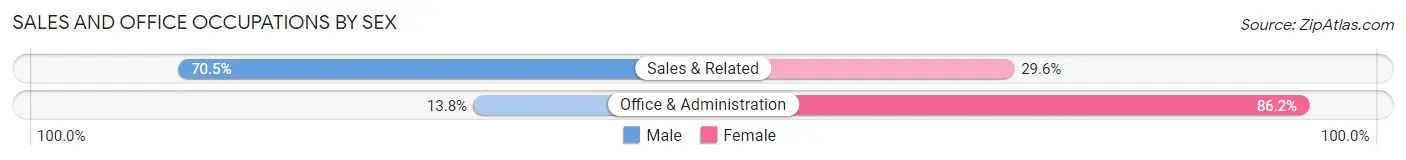
| Occupation | Male | Female |
| Sales & Related | 279 (70.5%) | 117 (29.5%) |
| Office & Administration | 43 (13.8%) | 269 (86.2%) |
| Total (Category) | 322 (45.5%) | 386 (54.5%) |
| Total (Overall) | 1,946 (51.0%) | 1,869 (49.0%) |
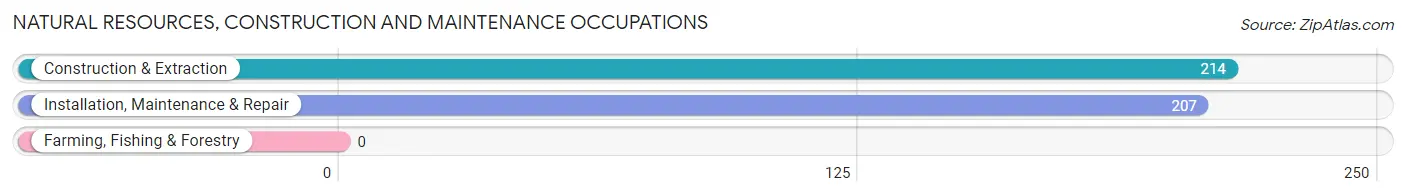
Natural Resources, Construction and Maintenance Occupations
The most common Natural Resources, Construction and Maintenance occupations in McCook are Construction & Extraction (214 | 5.6%), and Installation, Maintenance & Repair (207 | 5.4%).
Natural Resources, Construction and Maintenance Occupations by Sex
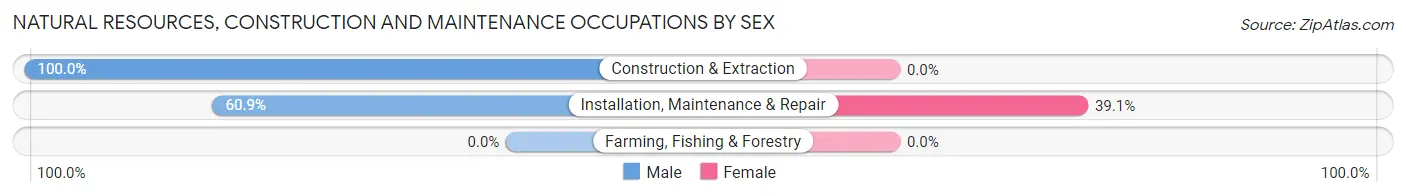
| Occupation | Male | Female |
| Farming, Fishing & Forestry | 0 (0.0%) | 0 (0.0%) |
| Construction & Extraction | 214 (100.0%) | 0 (0.0%) |
| Installation, Maintenance & Repair | 126 (60.9%) | 81 (39.1%) |
| Total (Category) | 340 (80.8%) | 81 (19.2%) |
| Total (Overall) | 1,946 (51.0%) | 1,869 (49.0%) |
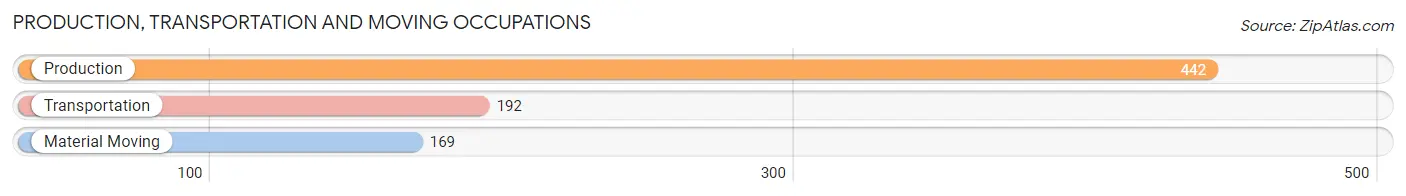
Production, Transportation and Moving Occupations
The most common Production, Transportation and Moving occupations in McCook are Production (442 | 11.6%), Transportation (192 | 5.0%), and Material Moving (169 | 4.4%).
Production, Transportation and Moving Occupations by Sex
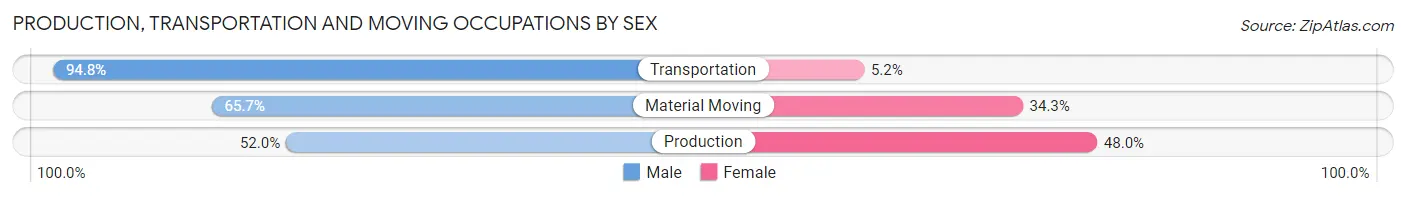
| Occupation | Male | Female |
| Production | 230 (52.0%) | 212 (48.0%) |
| Transportation | 182 (94.8%) | 10 (5.2%) |
| Material Moving | 111 (65.7%) | 58 (34.3%) |
| Total (Category) | 523 (65.1%) | 280 (34.9%) |
| Total (Overall) | 1,946 (51.0%) | 1,869 (49.0%) |
Employment Industries by Sex in McCook
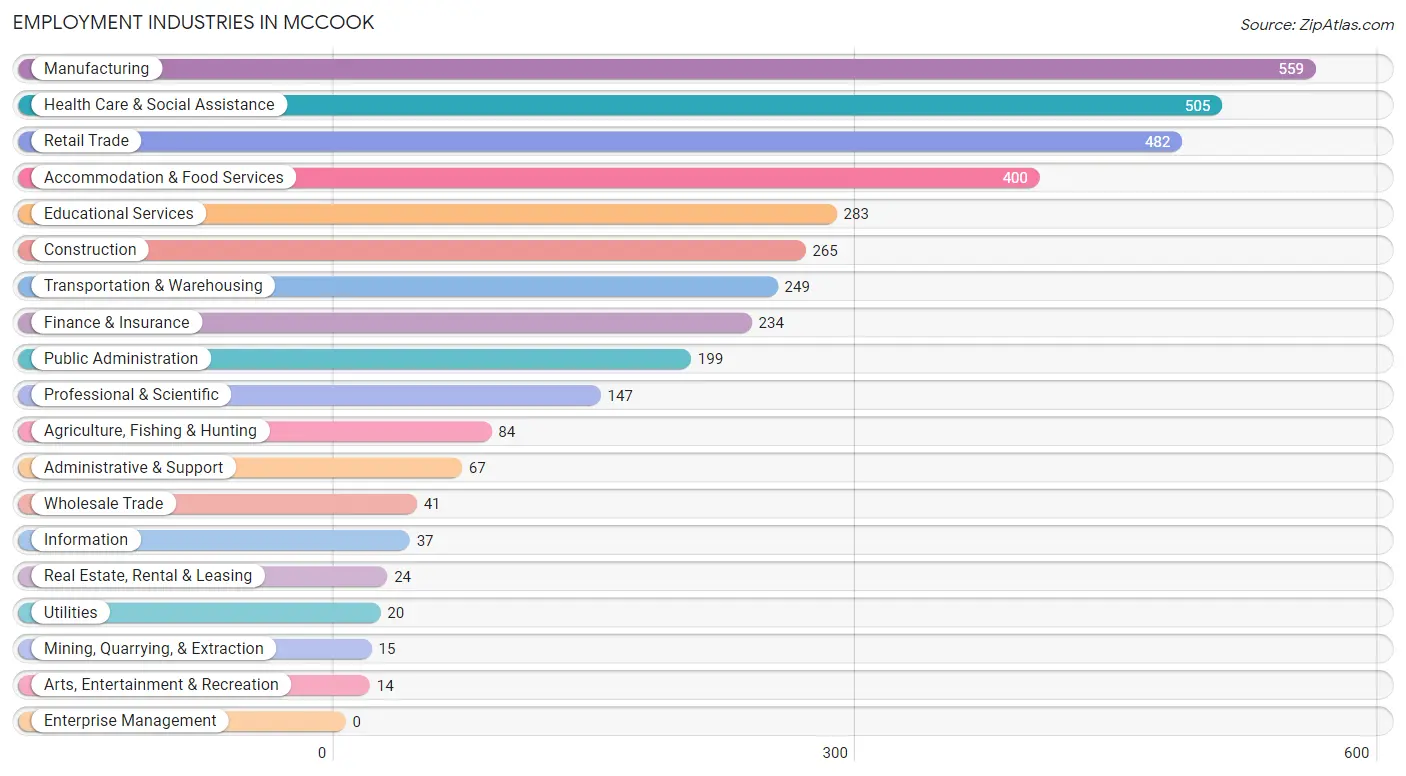
Employment Industries in McCook
The major employment industries in McCook include Manufacturing (559 | 14.6%), Health Care & Social Assistance (505 | 13.2%), Retail Trade (482 | 12.6%), Accommodation & Food Services (400 | 10.5%), and Educational Services (283 | 7.4%).
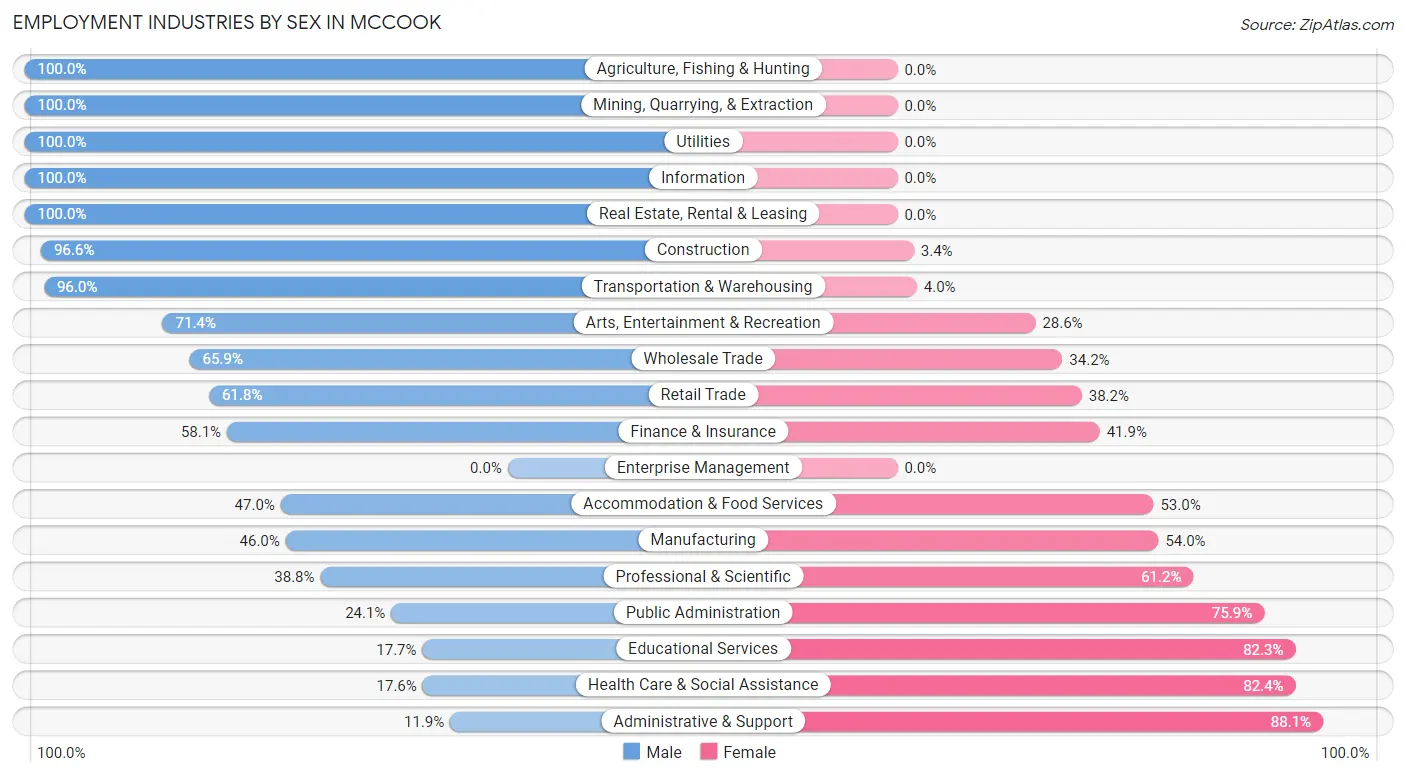
Employment Industries by Sex in McCook
The McCook industries that see more men than women are Agriculture, Fishing & Hunting (100.0%), Mining, Quarrying, & Extraction (100.0%), and Utilities (100.0%), whereas the industries that tend to have a higher number of women are Administrative & Support (88.1%), Health Care & Social Assistance (82.4%), and Educational Services (82.3%).
| Industry | Male | Female |
| Agriculture, Fishing & Hunting | 84 (100.0%) | 0 (0.0%) |
| Mining, Quarrying, & Extraction | 15 (100.0%) | 0 (0.0%) |
| Construction | 256 (96.6%) | 9 (3.4%) |
| Manufacturing | 257 (46.0%) | 302 (54.0%) |
| Wholesale Trade | 27 (65.8%) | 14 (34.2%) |
| Retail Trade | 298 (61.8%) | 184 (38.2%) |
| Transportation & Warehousing | 239 (96.0%) | 10 (4.0%) |
| Utilities | 20 (100.0%) | 0 (0.0%) |
| Information | 37 (100.0%) | 0 (0.0%) |
| Finance & Insurance | 136 (58.1%) | 98 (41.9%) |
| Real Estate, Rental & Leasing | 24 (100.0%) | 0 (0.0%) |
| Professional & Scientific | 57 (38.8%) | 90 (61.2%) |
| Enterprise Management | 0 (0.0%) | 0 (0.0%) |
| Administrative & Support | 8 (11.9%) | 59 (88.1%) |
| Educational Services | 50 (17.7%) | 233 (82.3%) |
| Health Care & Social Assistance | 89 (17.6%) | 416 (82.4%) |
| Arts, Entertainment & Recreation | 10 (71.4%) | 4 (28.6%) |
| Accommodation & Food Services | 188 (47.0%) | 212 (53.0%) |
| Public Administration | 48 (24.1%) | 151 (75.9%) |
| Total | 1,946 (51.0%) | 1,869 (49.0%) |
Education in McCook
School Enrollment in McCook
The most common levels of schooling among the 1,626 students in McCook are high school (477 | 29.3%), elementary school (362 | 22.3%), and middle school (321 | 19.7%).
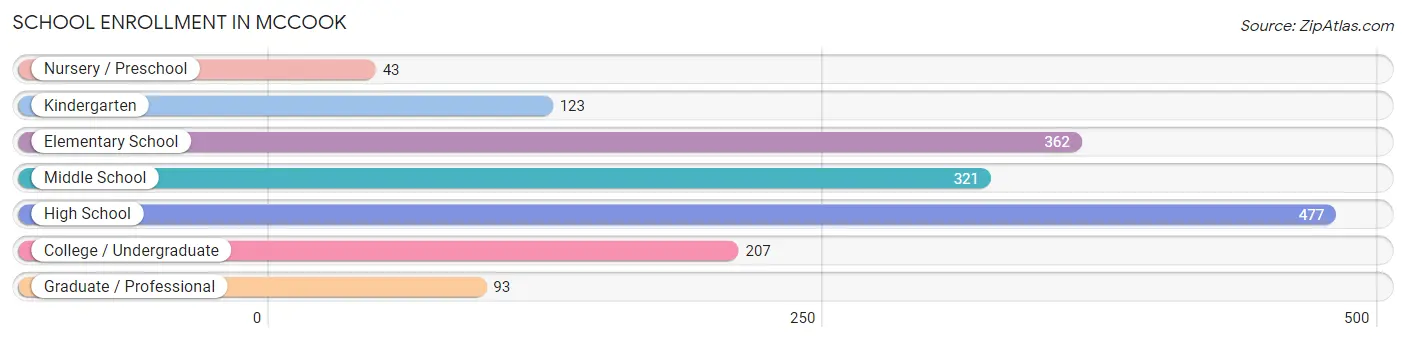
| School Level | # Students | % Students |
| Nursery / Preschool | 43 | 2.6% |
| Kindergarten | 123 | 7.6% |
| Elementary School | 362 | 22.3% |
| Middle School | 321 | 19.7% |
| High School | 477 | 29.3% |
| College / Undergraduate | 207 | 12.7% |
| Graduate / Professional | 93 | 5.7% |
| Total | 1,626 | 100.0% |
School Enrollment by Age by Funding Source in McCook
Out of a total of 1,626 students who are enrolled in schools in McCook, 39 (2.4%) attend a private institution, while the remaining 1,587 (97.6%) are enrolled in public schools. The age group of 25 to 34 year olds has the highest likelihood of being enrolled in private schools, with 17 (18.5% in the age bracket) enrolled. Conversely, the age group of 3 to 4 year olds has the lowest likelihood of being enrolled in a private school, with 43 (100.0% in the age bracket) attending a public institution.
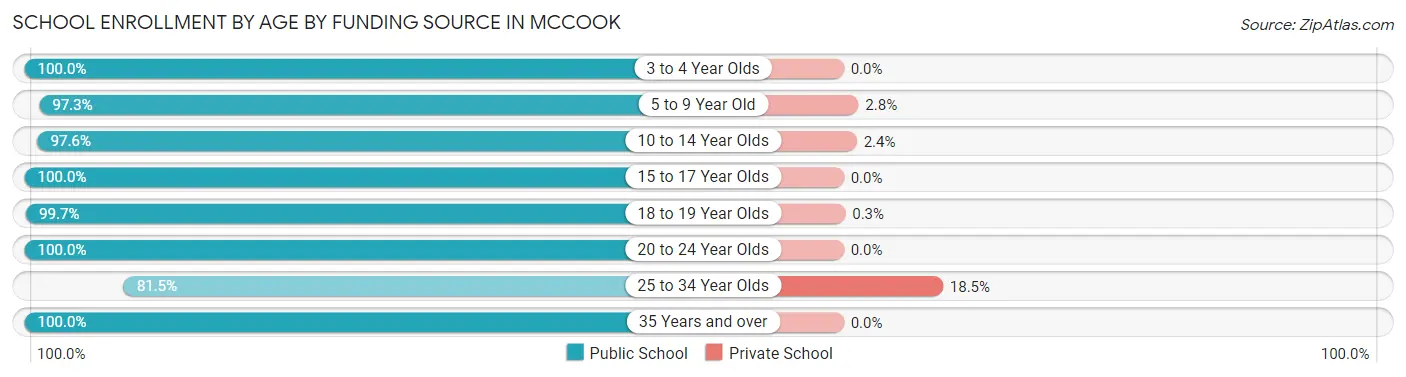
| Age Bracket | Public School | Private School |
| 3 to 4 Year Olds | 43 (100.0%) | 0 (0.0%) |
| 5 to 9 Year Old | 424 (97.3%) | 12 (2.8%) |
| 10 to 14 Year Olds | 361 (97.6%) | 9 (2.4%) |
| 15 to 17 Year Olds | 246 (100.0%) | 0 (0.0%) |
| 18 to 19 Year Olds | 327 (99.7%) | 1 (0.3%) |
| 20 to 24 Year Olds | 66 (100.0%) | 0 (0.0%) |
| 25 to 34 Year Olds | 75 (81.5%) | 17 (18.5%) |
| 35 Years and over | 45 (100.0%) | 0 (0.0%) |
| Total | 1,587 (97.6%) | 39 (2.4%) |
Educational Attainment by Field of Study in McCook
Science & technology (275 | 18.9%), education (257 | 17.7%), business (227 | 15.6%), bio, nature & agricultural (204 | 14.0%), and arts & humanities (138 | 9.5%) are the most common fields of study among 1,455 individuals in McCook who have obtained a bachelor's degree or higher.
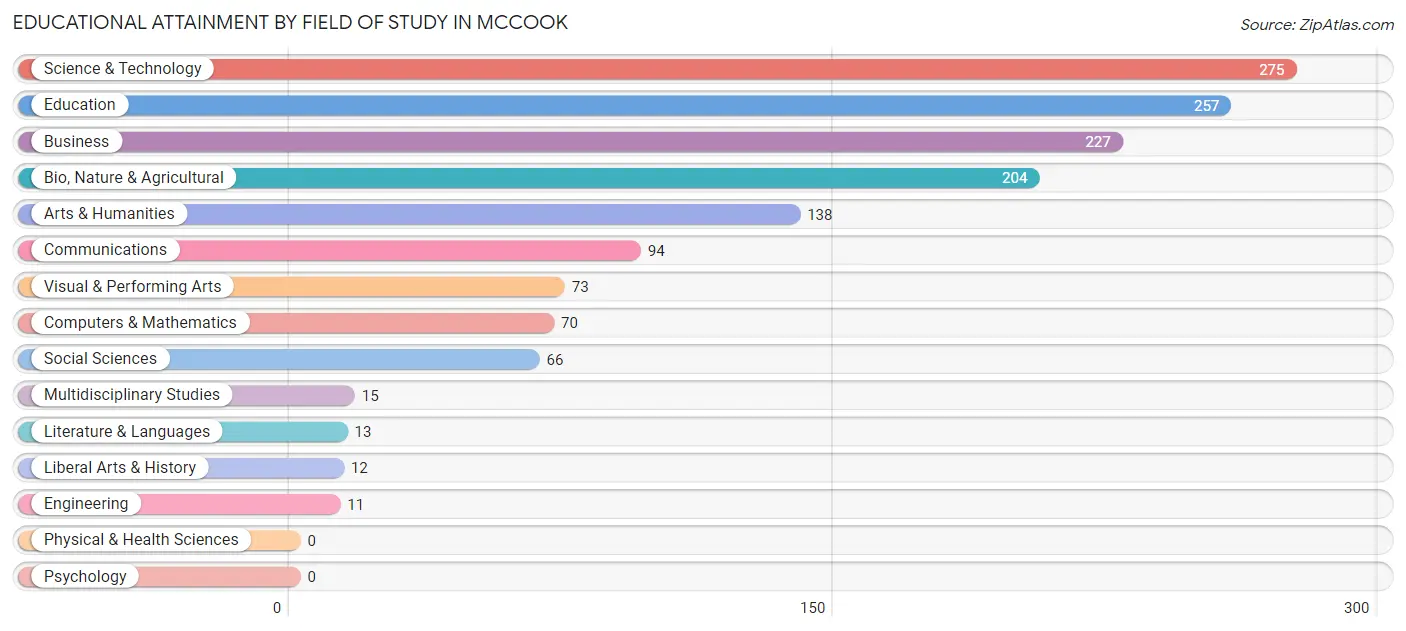
| Field of Study | # Graduates | % Graduates |
| Computers & Mathematics | 70 | 4.8% |
| Bio, Nature & Agricultural | 204 | 14.0% |
| Physical & Health Sciences | 0 | 0.0% |
| Psychology | 0 | 0.0% |
| Social Sciences | 66 | 4.5% |
| Engineering | 11 | 0.8% |
| Multidisciplinary Studies | 15 | 1.0% |
| Science & Technology | 275 | 18.9% |
| Business | 227 | 15.6% |
| Education | 257 | 17.7% |
| Literature & Languages | 13 | 0.9% |
| Liberal Arts & History | 12 | 0.8% |
| Visual & Performing Arts | 73 | 5.0% |
| Communications | 94 | 6.5% |
| Arts & Humanities | 138 | 9.5% |
| Total | 1,455 | 100.0% |
Transportation & Commute in McCook
Vehicle Availability by Sex in McCook
The most prevalent vehicle ownership categories in McCook are males with 2 vehicles (816, accounting for 43.1%) and females with 2 vehicles (882, making up 45.1%).
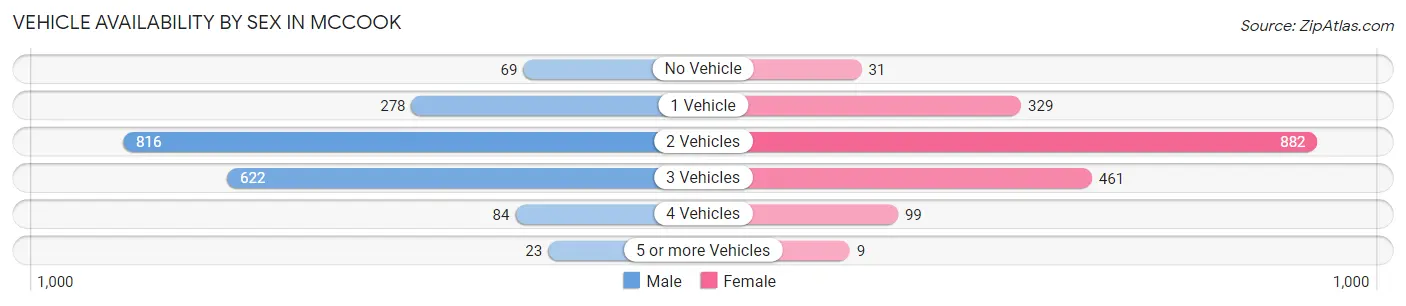
| Vehicles Available | Male | Female |
| No Vehicle | 69 (3.6%) | 31 (1.7%) |
| 1 Vehicle | 278 (14.7%) | 329 (18.2%) |
| 2 Vehicles | 816 (43.1%) | 882 (48.7%) |
| 3 Vehicles | 622 (32.9%) | 461 (25.5%) |
| 4 Vehicles | 84 (4.4%) | 99 (5.5%) |
| 5 or more Vehicles | 23 (1.2%) | 9 (0.5%) |
| Total | 1,892 (100.0%) | 1,811 (100.0%) |
Commute Time in McCook
The most frequently occuring commute durations in McCook are 5 to 9 minutes (1,564 commuters, 43.5%), 10 to 14 minutes (811 commuters, 22.6%), and less than 5 minutes (628 commuters, 17.5%).
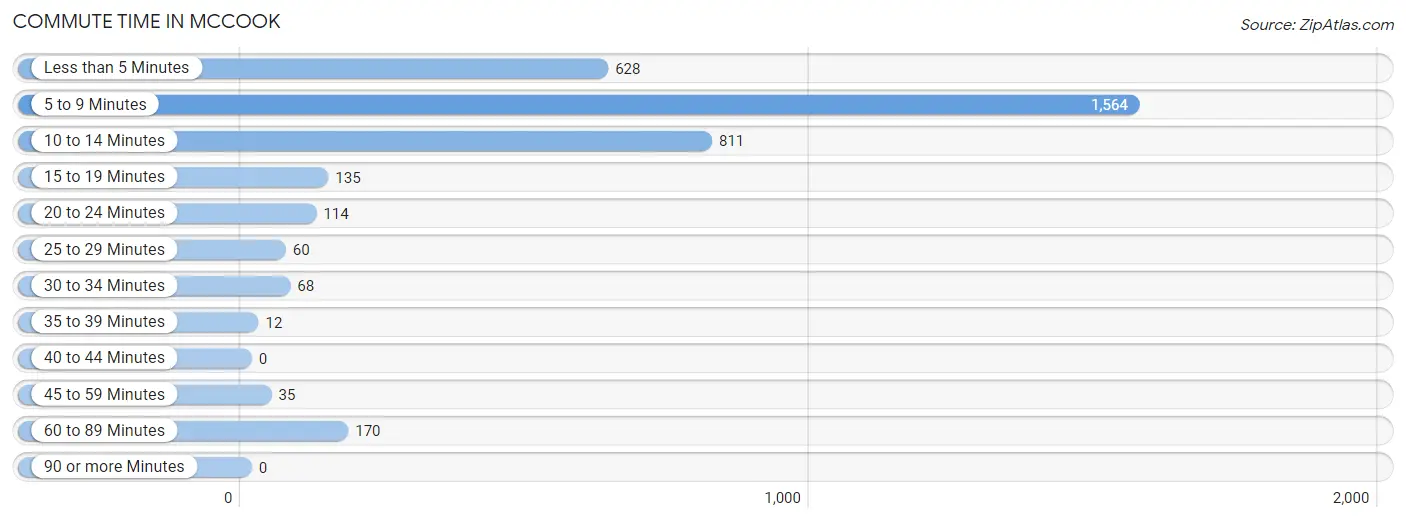
| Commute Time | # Commuters | % Commuters |
| Less than 5 Minutes | 628 | 17.5% |
| 5 to 9 Minutes | 1,564 | 43.5% |
| 10 to 14 Minutes | 811 | 22.6% |
| 15 to 19 Minutes | 135 | 3.7% |
| 20 to 24 Minutes | 114 | 3.2% |
| 25 to 29 Minutes | 60 | 1.7% |
| 30 to 34 Minutes | 68 | 1.9% |
| 35 to 39 Minutes | 12 | 0.3% |
| 40 to 44 Minutes | 0 | 0.0% |
| 45 to 59 Minutes | 35 | 1.0% |
| 60 to 89 Minutes | 170 | 4.7% |
| 90 or more Minutes | 0 | 0.0% |
Commute Time by Sex in McCook
The most common commute times in McCook are 5 to 9 minutes (766 commuters, 41.6%) for males and 5 to 9 minutes (798 commuters, 45.5%) for females.
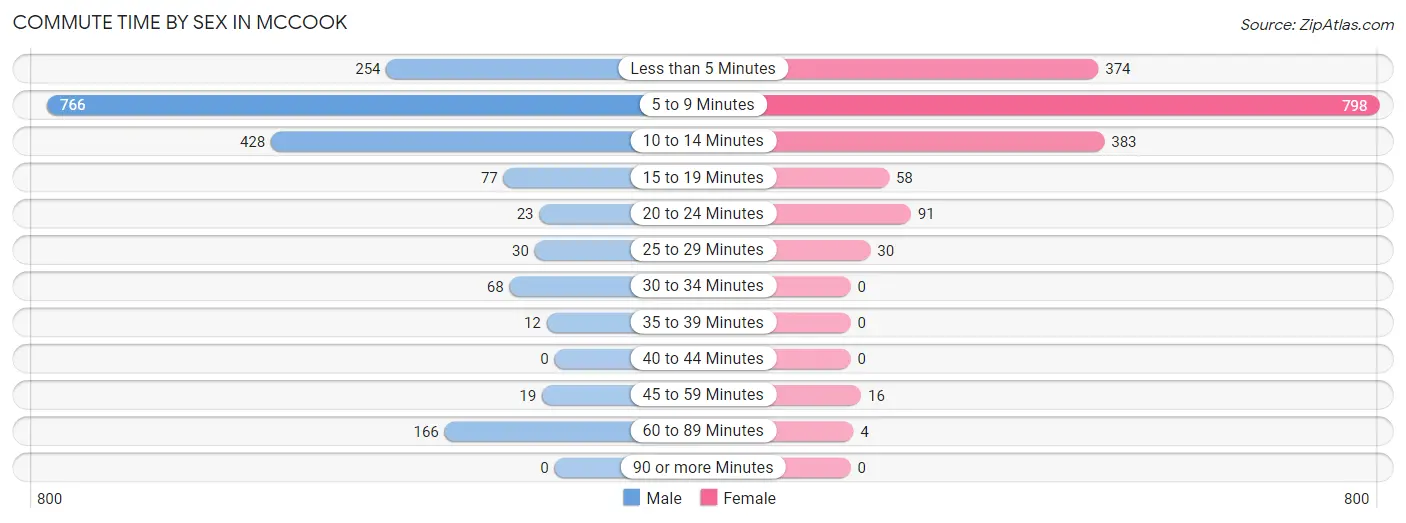
| Commute Time | Male | Female |
| Less than 5 Minutes | 254 (13.8%) | 374 (21.3%) |
| 5 to 9 Minutes | 766 (41.6%) | 798 (45.5%) |
| 10 to 14 Minutes | 428 (23.2%) | 383 (21.8%) |
| 15 to 19 Minutes | 77 (4.2%) | 58 (3.3%) |
| 20 to 24 Minutes | 23 (1.3%) | 91 (5.2%) |
| 25 to 29 Minutes | 30 (1.6%) | 30 (1.7%) |
| 30 to 34 Minutes | 68 (3.7%) | 0 (0.0%) |
| 35 to 39 Minutes | 12 (0.6%) | 0 (0.0%) |
| 40 to 44 Minutes | 0 (0.0%) | 0 (0.0%) |
| 45 to 59 Minutes | 19 (1.0%) | 16 (0.9%) |
| 60 to 89 Minutes | 166 (9.0%) | 4 (0.2%) |
| 90 or more Minutes | 0 (0.0%) | 0 (0.0%) |
Time of Departure to Work by Sex in McCook
The most frequent times of departure to work in McCook are 7:30 AM to 7:59 AM (327, 17.7%) for males and 7:30 AM to 7:59 AM (325, 18.5%) for females.
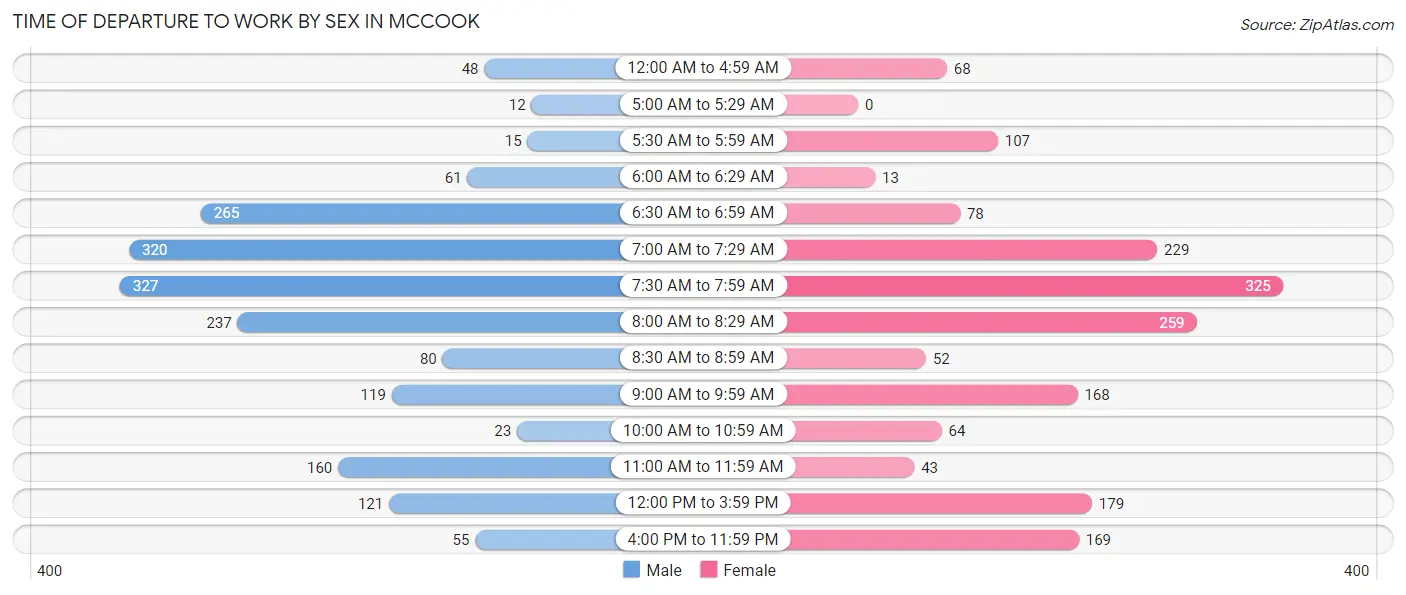
| Time of Departure | Male | Female |
| 12:00 AM to 4:59 AM | 48 (2.6%) | 68 (3.9%) |
| 5:00 AM to 5:29 AM | 12 (0.6%) | 0 (0.0%) |
| 5:30 AM to 5:59 AM | 15 (0.8%) | 107 (6.1%) |
| 6:00 AM to 6:29 AM | 61 (3.3%) | 13 (0.7%) |
| 6:30 AM to 6:59 AM | 265 (14.4%) | 78 (4.4%) |
| 7:00 AM to 7:29 AM | 320 (17.4%) | 229 (13.1%) |
| 7:30 AM to 7:59 AM | 327 (17.7%) | 325 (18.5%) |
| 8:00 AM to 8:29 AM | 237 (12.9%) | 259 (14.8%) |
| 8:30 AM to 8:59 AM | 80 (4.3%) | 52 (3.0%) |
| 9:00 AM to 9:59 AM | 119 (6.5%) | 168 (9.6%) |
| 10:00 AM to 10:59 AM | 23 (1.3%) | 64 (3.6%) |
| 11:00 AM to 11:59 AM | 160 (8.7%) | 43 (2.5%) |
| 12:00 PM to 3:59 PM | 121 (6.6%) | 179 (10.2%) |
| 4:00 PM to 11:59 PM | 55 (3.0%) | 169 (9.6%) |
| Total | 1,843 (100.0%) | 1,754 (100.0%) |
Housing Occupancy in McCook
Occupancy by Ownership in McCook
Of the total 3,168 dwellings in McCook, owner-occupied units account for 2,098 (66.2%), while renter-occupied units make up 1,070 (33.8%).
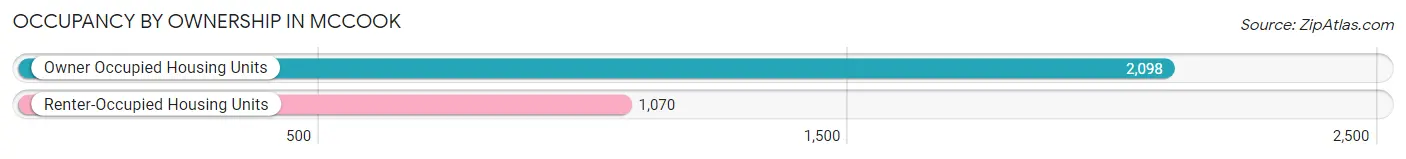
| Occupancy | # Housing Units | % Housing Units |
| Owner Occupied Housing Units | 2,098 | 66.2% |
| Renter-Occupied Housing Units | 1,070 | 33.8% |
| Total Occupied Housing Units | 3,168 | 100.0% |
Occupancy by Household Size in McCook
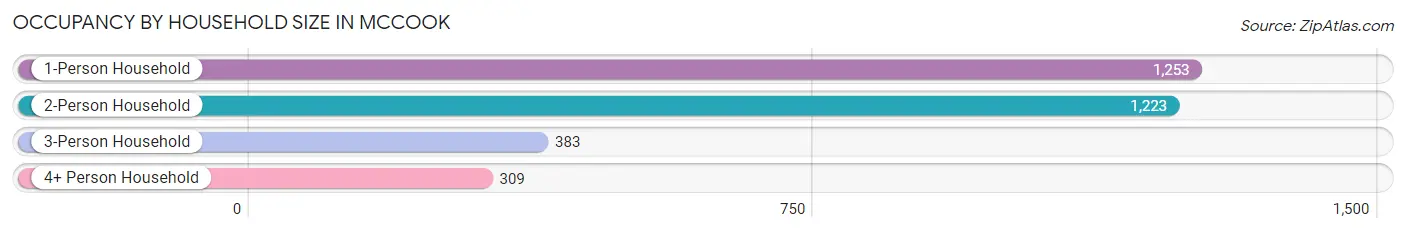
| Household Size | # Housing Units | % Housing Units |
| 1-Person Household | 1,253 | 39.6% |
| 2-Person Household | 1,223 | 38.6% |
| 3-Person Household | 383 | 12.1% |
| 4+ Person Household | 309 | 9.8% |
| Total Housing Units | 3,168 | 100.0% |
Occupancy by Ownership by Household Size in McCook
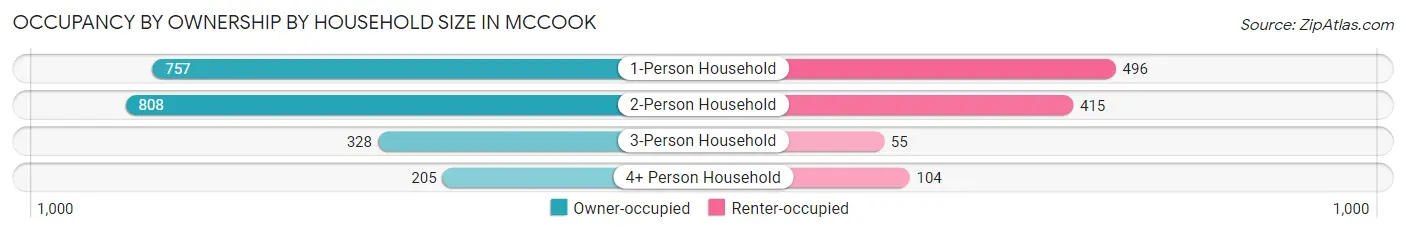
| Household Size | Owner-occupied | Renter-occupied |
| 1-Person Household | 757 (60.4%) | 496 (39.6%) |
| 2-Person Household | 808 (66.1%) | 415 (33.9%) |
| 3-Person Household | 328 (85.6%) | 55 (14.4%) |
| 4+ Person Household | 205 (66.3%) | 104 (33.7%) |
| Total Housing Units | 2,098 (66.2%) | 1,070 (33.8%) |
Occupancy by Educational Attainment in McCook
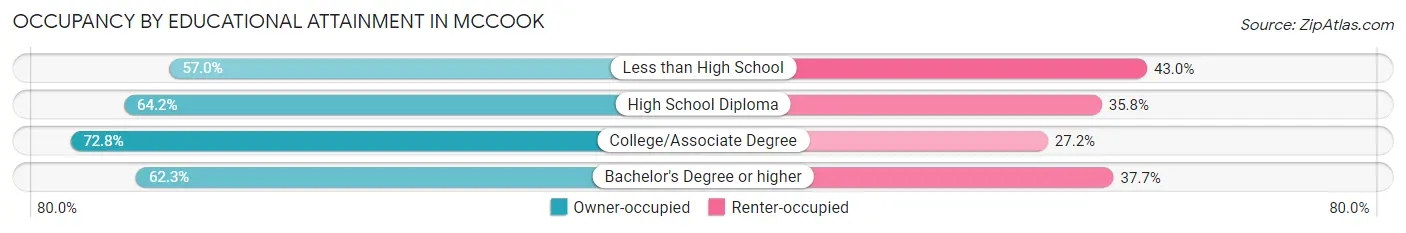
| Household Size | Owner-occupied | Renter-occupied |
| Less than High School | 77 (57.0%) | 58 (43.0%) |
| High School Diploma | 637 (64.2%) | 355 (35.8%) |
| College/Associate Degree | 780 (72.8%) | 292 (27.2%) |
| Bachelor's Degree or higher | 604 (62.3%) | 365 (37.7%) |
Occupancy by Age of Householder in McCook
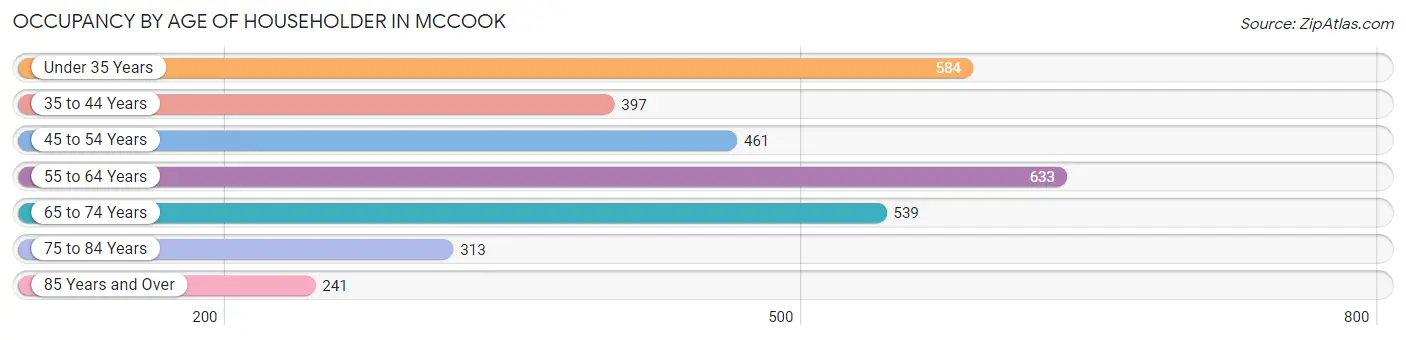
| Age Bracket | # Households | % Households |
| Under 35 Years | 584 | 18.4% |
| 35 to 44 Years | 397 | 12.5% |
| 45 to 54 Years | 461 | 14.5% |
| 55 to 64 Years | 633 | 20.0% |
| 65 to 74 Years | 539 | 17.0% |
| 75 to 84 Years | 313 | 9.9% |
| 85 Years and Over | 241 | 7.6% |
| Total | 3,168 | 100.0% |
Housing Finances in McCook
Median Income by Occupancy in McCook
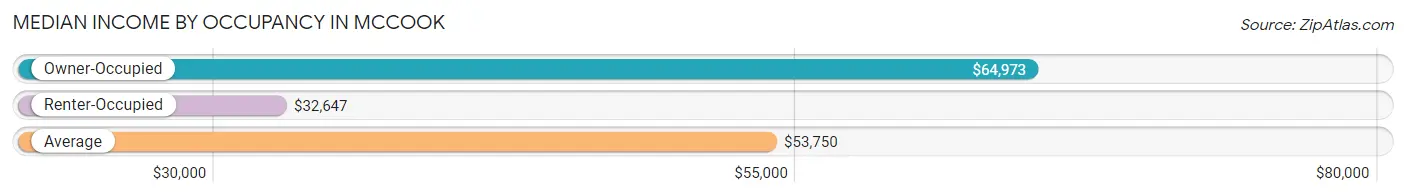
| Occupancy Type | # Households | Median Income |
| Owner-Occupied | 2,098 (66.2%) | $64,973 |
| Renter-Occupied | 1,070 (33.8%) | $32,647 |
| Average | 3,168 (100.0%) | $53,750 |
Occupancy by Householder Income Bracket in McCook
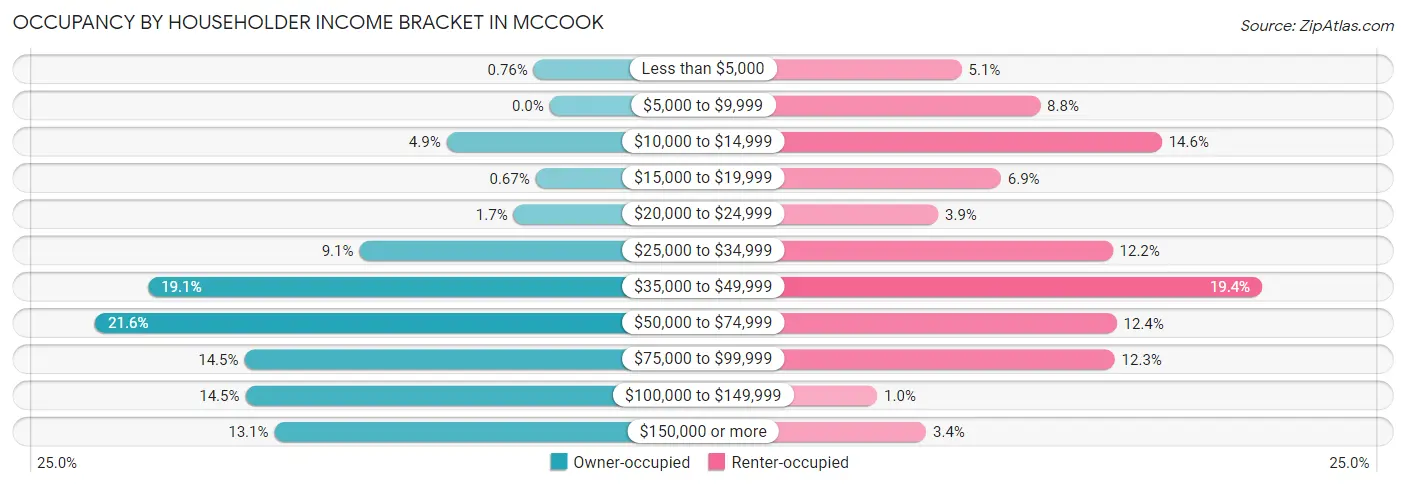
| Income Bracket | Owner-occupied | Renter-occupied |
| Less than $5,000 | 16 (0.8%) | 54 (5.1%) |
| $5,000 to $9,999 | 0 (0.0%) | 94 (8.8%) |
| $10,000 to $14,999 | 103 (4.9%) | 156 (14.6%) |
| $15,000 to $19,999 | 14 (0.7%) | 74 (6.9%) |
| $20,000 to $24,999 | 36 (1.7%) | 42 (3.9%) |
| $25,000 to $34,999 | 190 (9.1%) | 131 (12.2%) |
| $35,000 to $49,999 | 401 (19.1%) | 207 (19.4%) |
| $50,000 to $74,999 | 454 (21.6%) | 133 (12.4%) |
| $75,000 to $99,999 | 305 (14.5%) | 132 (12.3%) |
| $100,000 to $149,999 | 304 (14.5%) | 11 (1.0%) |
| $150,000 or more | 275 (13.1%) | 36 (3.4%) |
| Total | 2,098 (100.0%) | 1,070 (100.0%) |
Monthly Housing Cost Tiers in McCook
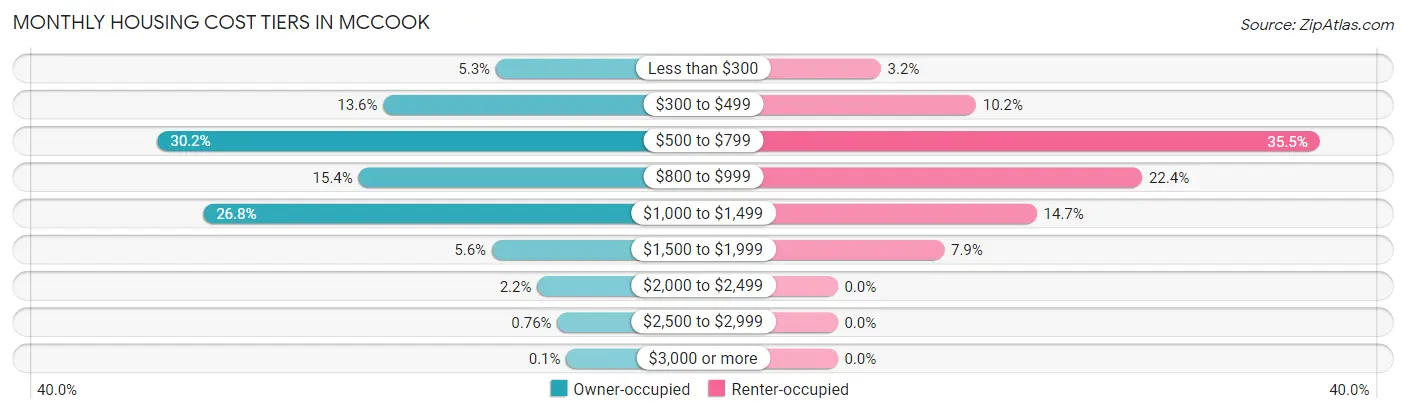
| Monthly Cost | Owner-occupied | Renter-occupied |
| Less than $300 | 111 (5.3%) | 34 (3.2%) |
| $300 to $499 | 285 (13.6%) | 109 (10.2%) |
| $500 to $799 | 634 (30.2%) | 380 (35.5%) |
| $800 to $999 | 323 (15.4%) | 240 (22.4%) |
| $1,000 to $1,499 | 563 (26.8%) | 157 (14.7%) |
| $1,500 to $1,999 | 117 (5.6%) | 84 (7.9%) |
| $2,000 to $2,499 | 47 (2.2%) | 0 (0.0%) |
| $2,500 to $2,999 | 16 (0.8%) | 0 (0.0%) |
| $3,000 or more | 2 (0.1%) | 0 (0.0%) |
| Total | 2,098 (100.0%) | 1,070 (100.0%) |
Physical Housing Characteristics in McCook
Housing Structures in McCook
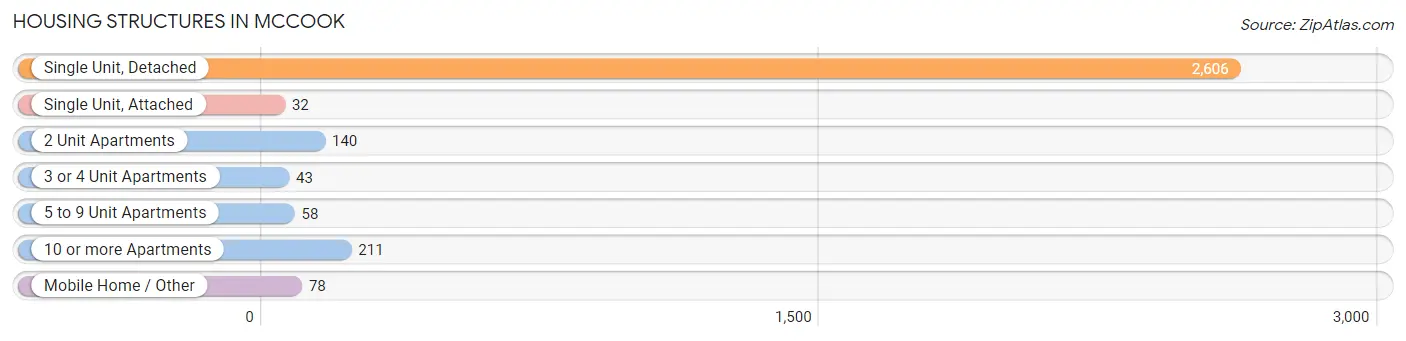
| Structure Type | # Housing Units | % Housing Units |
| Single Unit, Detached | 2,606 | 82.3% |
| Single Unit, Attached | 32 | 1.0% |
| 2 Unit Apartments | 140 | 4.4% |
| 3 or 4 Unit Apartments | 43 | 1.4% |
| 5 to 9 Unit Apartments | 58 | 1.8% |
| 10 or more Apartments | 211 | 6.7% |
| Mobile Home / Other | 78 | 2.5% |
| Total | 3,168 | 100.0% |
Housing Structures by Occupancy in McCook
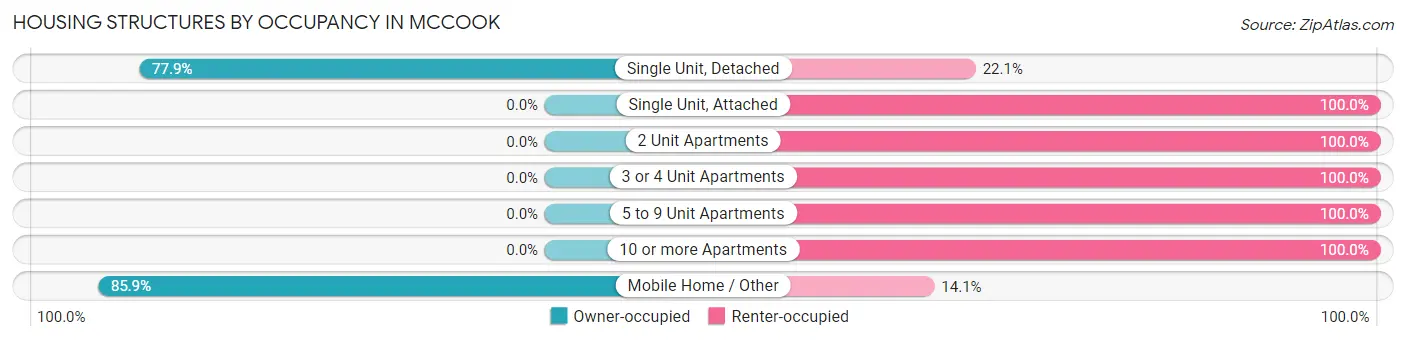
| Structure Type | Owner-occupied | Renter-occupied |
| Single Unit, Detached | 2,031 (77.9%) | 575 (22.1%) |
| Single Unit, Attached | 0 (0.0%) | 32 (100.0%) |
| 2 Unit Apartments | 0 (0.0%) | 140 (100.0%) |
| 3 or 4 Unit Apartments | 0 (0.0%) | 43 (100.0%) |
| 5 to 9 Unit Apartments | 0 (0.0%) | 58 (100.0%) |
| 10 or more Apartments | 0 (0.0%) | 211 (100.0%) |
| Mobile Home / Other | 67 (85.9%) | 11 (14.1%) |
| Total | 2,098 (66.2%) | 1,070 (33.8%) |
Housing Structures by Number of Rooms in McCook
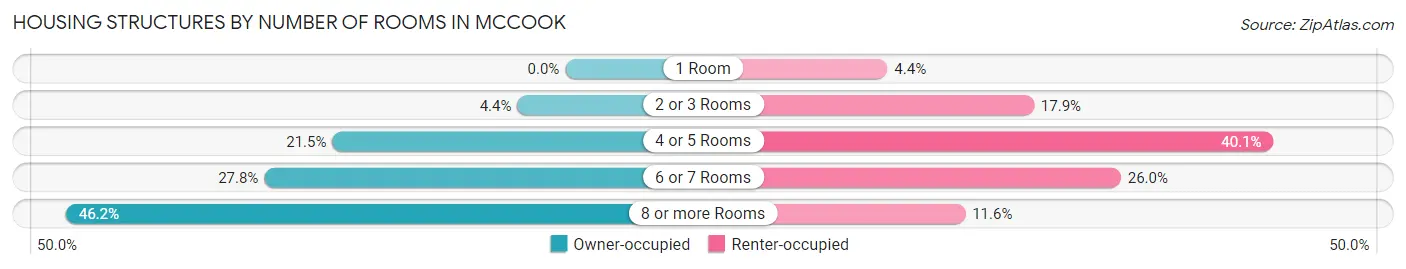
| Number of Rooms | Owner-occupied | Renter-occupied |
| 1 Room | 0 (0.0%) | 47 (4.4%) |
| 2 or 3 Rooms | 93 (4.4%) | 192 (17.9%) |
| 4 or 5 Rooms | 452 (21.5%) | 429 (40.1%) |
| 6 or 7 Rooms | 584 (27.8%) | 278 (26.0%) |
| 8 or more Rooms | 969 (46.2%) | 124 (11.6%) |
| Total | 2,098 (100.0%) | 1,070 (100.0%) |
Housing Structure by Heating Type in McCook
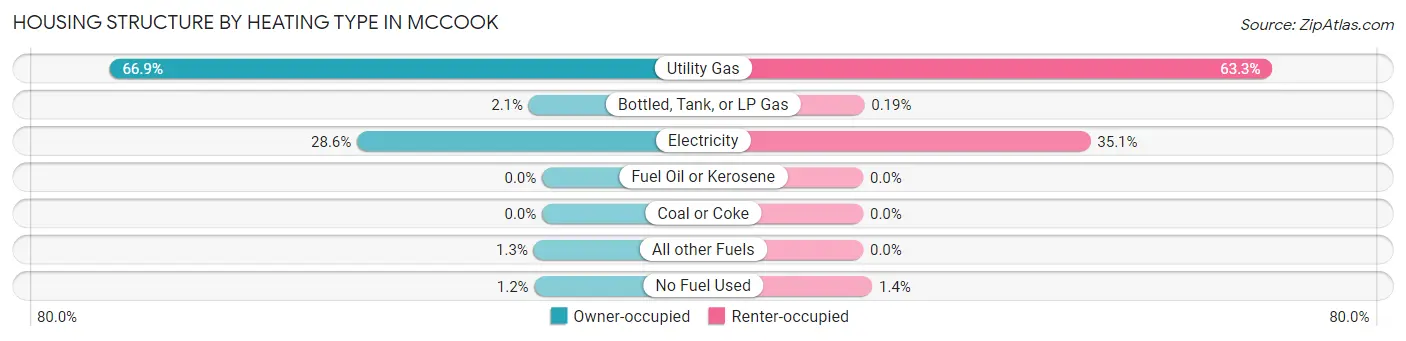
| Heating Type | Owner-occupied | Renter-occupied |
| Utility Gas | 1,403 (66.9%) | 677 (63.3%) |
| Bottled, Tank, or LP Gas | 43 (2.1%) | 2 (0.2%) |
| Electricity | 600 (28.6%) | 376 (35.1%) |
| Fuel Oil or Kerosene | 0 (0.0%) | 0 (0.0%) |
| Coal or Coke | 0 (0.0%) | 0 (0.0%) |
| All other Fuels | 27 (1.3%) | 0 (0.0%) |
| No Fuel Used | 25 (1.2%) | 15 (1.4%) |
| Total | 2,098 (100.0%) | 1,070 (100.0%) |
Household Vehicle Usage in McCook
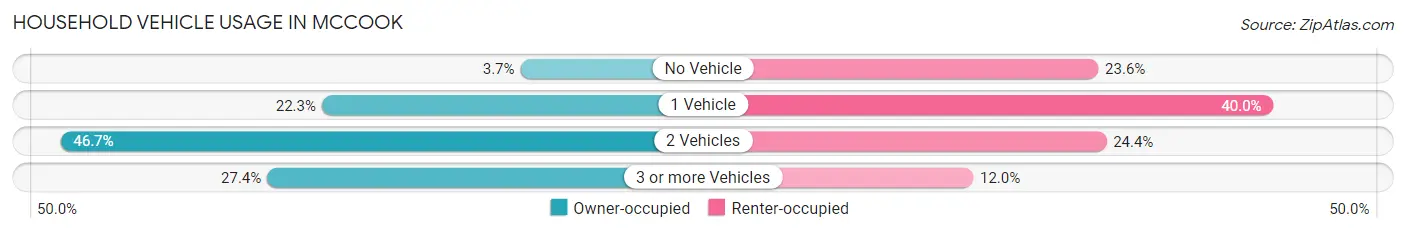
| Vehicles per Household | Owner-occupied | Renter-occupied |
| No Vehicle | 78 (3.7%) | 253 (23.6%) |
| 1 Vehicle | 467 (22.3%) | 428 (40.0%) |
| 2 Vehicles | 979 (46.7%) | 261 (24.4%) |
| 3 or more Vehicles | 574 (27.4%) | 128 (12.0%) |
| Total | 2,098 (100.0%) | 1,070 (100.0%) |
Real Estate & Mortgages in McCook
Real Estate and Mortgage Overview in McCook
| Characteristic | Without Mortgage | With Mortgage |
| Housing Units | 1,082 | 1,016 |
| Median Property Value | $134,000 | $150,400 |
| Median Household Income | $48,043 | $212 |
| Monthly Housing Costs | $564 | $2 |
| Real Estate Taxes | $1,776 | $50 |
Property Value by Mortgage Status in McCook
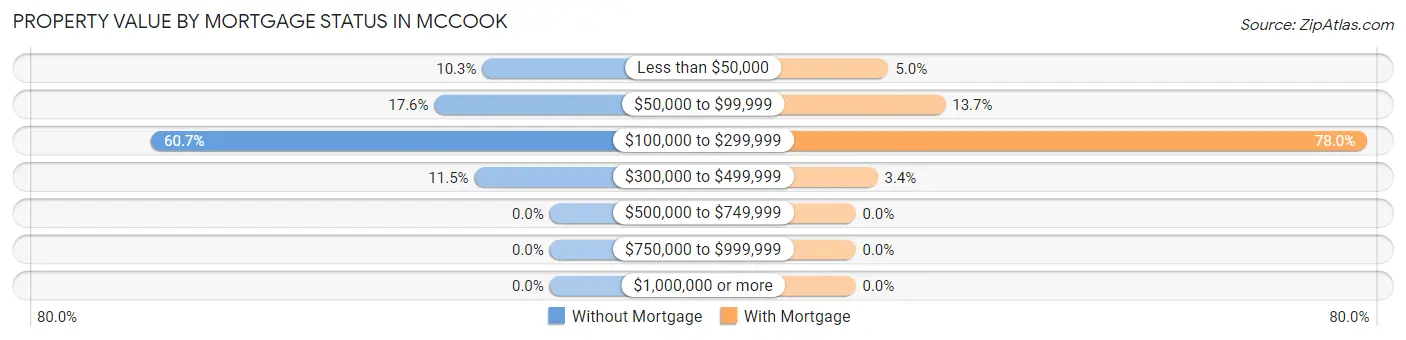
| Property Value | Without Mortgage | With Mortgage |
| Less than $50,000 | 111 (10.3%) | 51 (5.0%) |
| $50,000 to $99,999 | 190 (17.6%) | 139 (13.7%) |
| $100,000 to $299,999 | 657 (60.7%) | 792 (77.9%) |
| $300,000 to $499,999 | 124 (11.5%) | 34 (3.4%) |
| $500,000 to $749,999 | 0 (0.0%) | 0 (0.0%) |
| $750,000 to $999,999 | 0 (0.0%) | 0 (0.0%) |
| $1,000,000 or more | 0 (0.0%) | 0 (0.0%) |
| Total | 1,082 (100.0%) | 1,016 (100.0%) |
Household Income by Mortgage Status in McCook
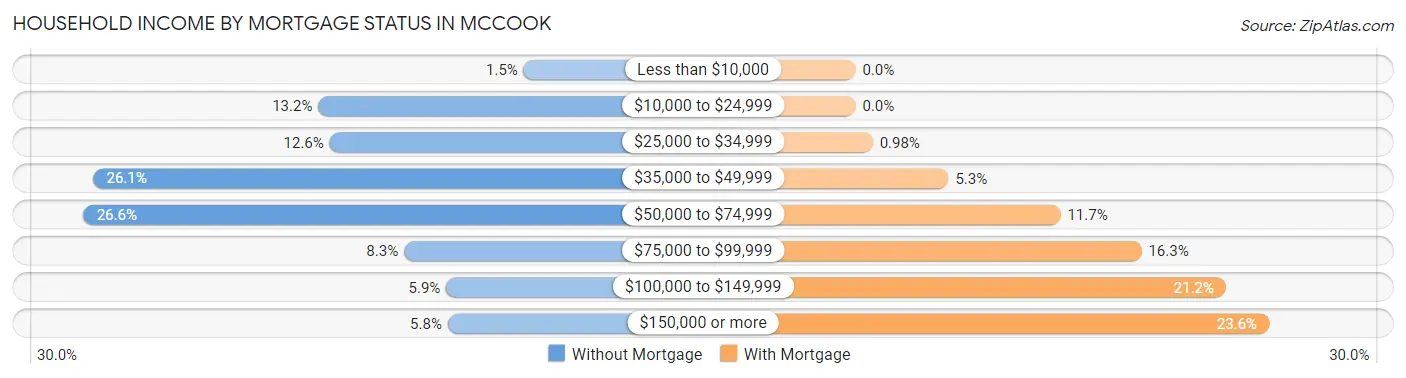
| Household Income | Without Mortgage | With Mortgage |
| Less than $10,000 | 16 (1.5%) | 0 (0.0%) |
| $10,000 to $24,999 | 143 (13.2%) | 0 (0.0%) |
| $25,000 to $34,999 | 136 (12.6%) | 10 (1.0%) |
| $35,000 to $49,999 | 282 (26.1%) | 54 (5.3%) |
| $50,000 to $74,999 | 288 (26.6%) | 119 (11.7%) |
| $75,000 to $99,999 | 90 (8.3%) | 166 (16.3%) |
| $100,000 to $149,999 | 64 (5.9%) | 215 (21.2%) |
| $150,000 or more | 63 (5.8%) | 240 (23.6%) |
| Total | 1,082 (100.0%) | 1,016 (100.0%) |
Property Value to Household Income Ratio in McCook
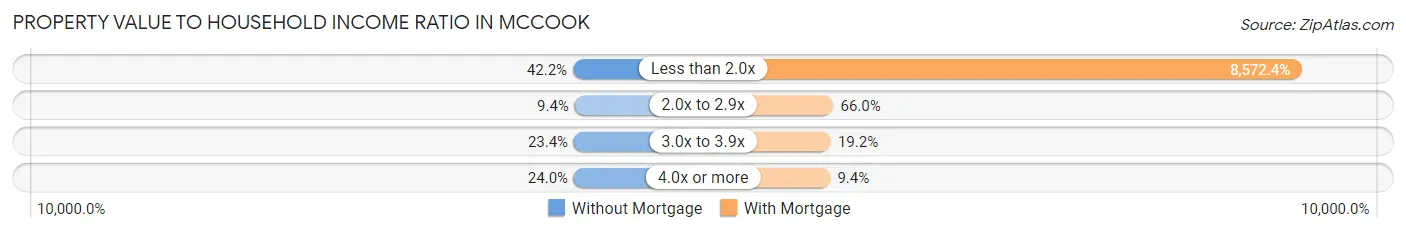
| Value-to-Income Ratio | Without Mortgage | With Mortgage |
| Less than 2.0x | 457 (42.2%) | 87,096 (8,572.4%) |
| 2.0x to 2.9x | 102 (9.4%) | 671 (66.0%) |
| 3.0x to 3.9x | 253 (23.4%) | 195 (19.2%) |
| 4.0x or more | 260 (24.0%) | 95 (9.3%) |
| Total | 1,082 (100.0%) | 1,016 (100.0%) |
Real Estate Taxes by Mortgage Status in McCook
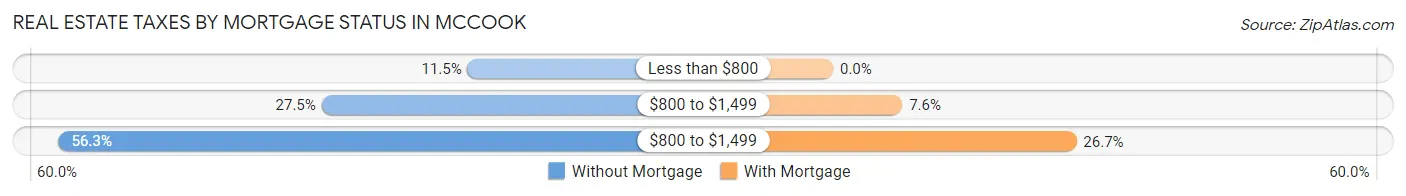
| Property Taxes | Without Mortgage | With Mortgage |
| Less than $800 | 124 (11.5%) | 0 (0.0%) |
| $800 to $1,499 | 297 (27.5%) | 77 (7.6%) |
| $800 to $1,499 | 609 (56.3%) | 271 (26.7%) |
| Total | 1,082 (100.0%) | 1,016 (100.0%) |
Health & Disability in McCook
Health Insurance Coverage by Age in McCook
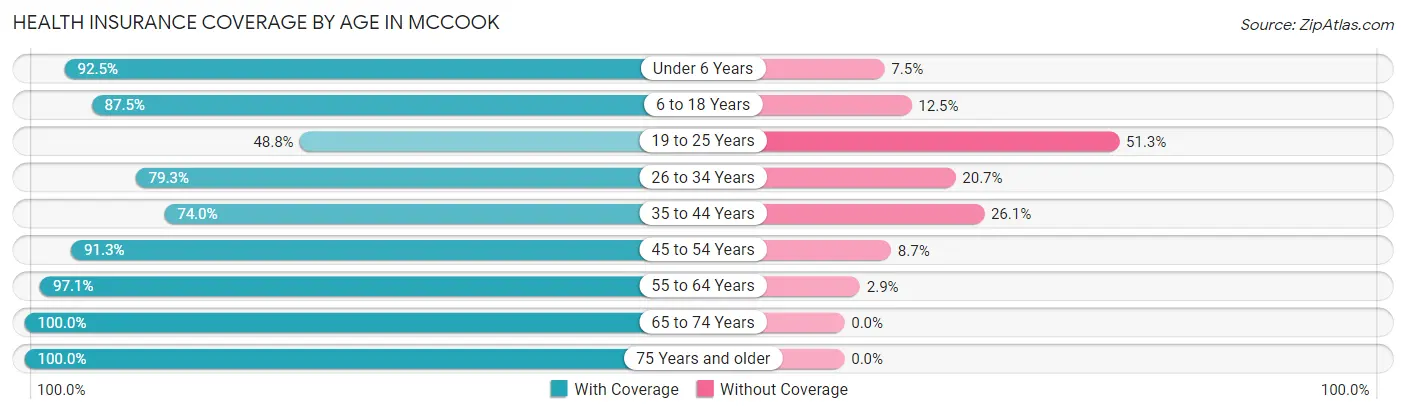
| Age Bracket | With Coverage | Without Coverage |
| Under 6 Years | 371 (92.5%) | 30 (7.5%) |
| 6 to 18 Years | 1,189 (87.5%) | 170 (12.5%) |
| 19 to 25 Years | 234 (48.7%) | 246 (51.2%) |
| 26 to 34 Years | 601 (79.3%) | 157 (20.7%) |
| 35 to 44 Years | 653 (74.0%) | 230 (26.1%) |
| 45 to 54 Years | 883 (91.3%) | 84 (8.7%) |
| 55 to 64 Years | 903 (97.1%) | 27 (2.9%) |
| 65 to 74 Years | 842 (100.0%) | 0 (0.0%) |
| 75 Years and older | 698 (100.0%) | 0 (0.0%) |
| Total | 6,374 (87.1%) | 944 (12.9%) |
Health Insurance Coverage by Citizenship Status in McCook
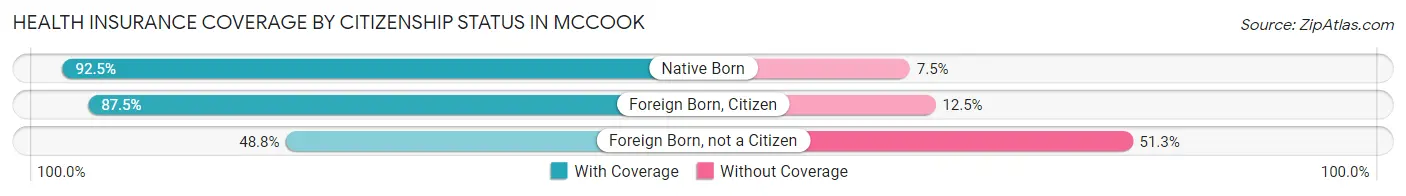
| Citizenship Status | With Coverage | Without Coverage |
| Native Born | 371 (92.5%) | 30 (7.5%) |
| Foreign Born, Citizen | 1,189 (87.5%) | 170 (12.5%) |
| Foreign Born, not a Citizen | 234 (48.7%) | 246 (51.2%) |
Health Insurance Coverage by Household Income in McCook
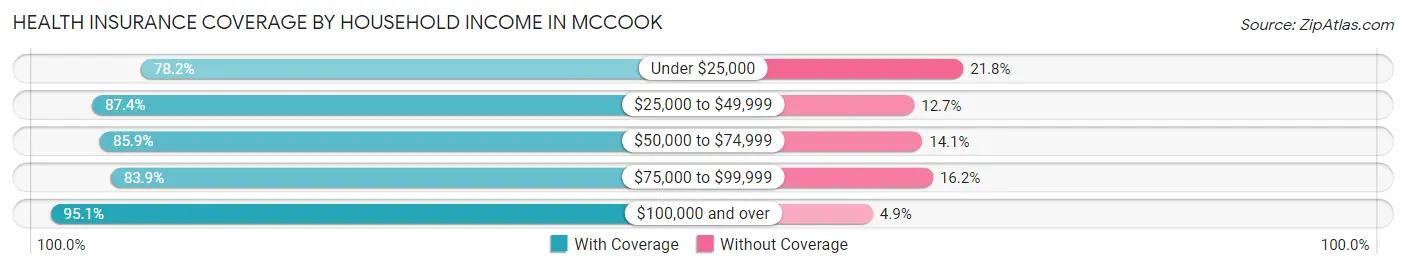
| Household Income | With Coverage | Without Coverage |
| Under $25,000 | 813 (78.2%) | 227 (21.8%) |
| $25,000 to $49,999 | 1,595 (87.4%) | 231 (12.7%) |
| $50,000 to $74,999 | 1,044 (85.9%) | 172 (14.1%) |
| $75,000 to $99,999 | 1,111 (83.9%) | 214 (16.2%) |
| $100,000 and over | 1,710 (95.1%) | 88 (4.9%) |
Public vs Private Health Insurance Coverage by Age in McCook
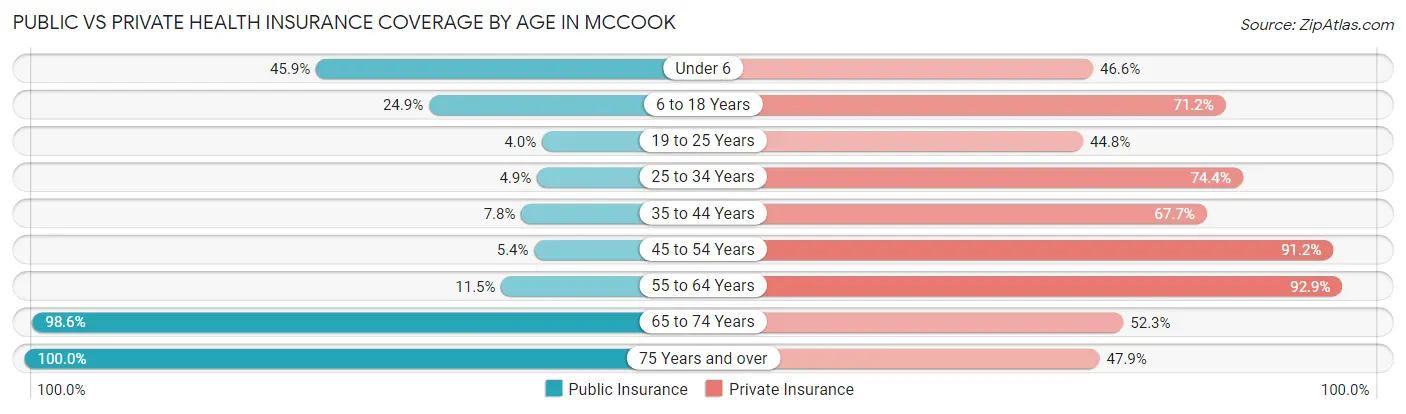
| Age Bracket | Public Insurance | Private Insurance |
| Under 6 | 184 (45.9%) | 187 (46.6%) |
| 6 to 18 Years | 339 (24.9%) | 968 (71.2%) |
| 19 to 25 Years | 19 (4.0%) | 215 (44.8%) |
| 25 to 34 Years | 37 (4.9%) | 564 (74.4%) |
| 35 to 44 Years | 69 (7.8%) | 598 (67.7%) |
| 45 to 54 Years | 52 (5.4%) | 882 (91.2%) |
| 55 to 64 Years | 107 (11.5%) | 864 (92.9%) |
| 65 to 74 Years | 830 (98.6%) | 440 (52.3%) |
| 75 Years and over | 698 (100.0%) | 334 (47.8%) |
| Total | 2,335 (31.9%) | 5,052 (69.0%) |
Disability Status by Sex by Age in McCook
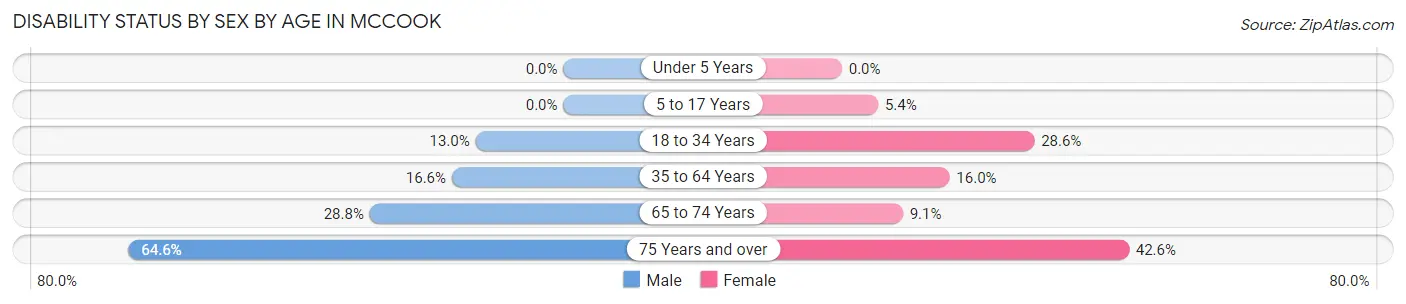
| Age Bracket | Male | Female |
| Under 5 Years | 0 (0.0%) | 0 (0.0%) |
| 5 to 17 Years | 0 (0.0%) | 31 (5.4%) |
| 18 to 34 Years | 102 (13.0%) | 212 (28.6%) |
| 35 to 64 Years | 224 (16.6%) | 228 (16.0%) |
| 65 to 74 Years | 115 (28.7%) | 40 (9.0%) |
| 75 Years and over | 175 (64.6%) | 182 (42.6%) |
Disability Class by Sex by Age in McCook
Disability Class: Hearing Difficulty
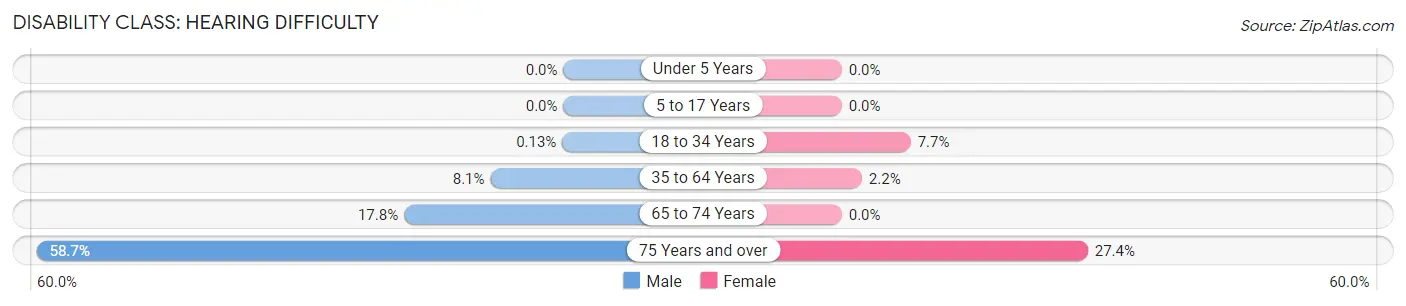
| Age Bracket | Male | Female |
| Under 5 Years | 0 (0.0%) | 0 (0.0%) |
| 5 to 17 Years | 0 (0.0%) | 0 (0.0%) |
| 18 to 34 Years | 1 (0.1%) | 57 (7.7%) |
| 35 to 64 Years | 110 (8.1%) | 32 (2.2%) |
| 65 to 74 Years | 71 (17.7%) | 0 (0.0%) |
| 75 Years and over | 159 (58.7%) | 117 (27.4%) |
Disability Class: Vision Difficulty
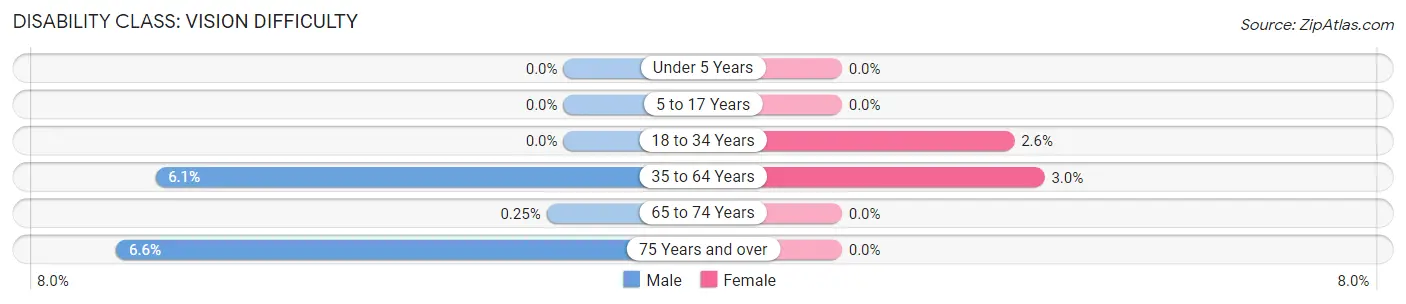
| Age Bracket | Male | Female |
| Under 5 Years | 0 (0.0%) | 0 (0.0%) |
| 5 to 17 Years | 0 (0.0%) | 0 (0.0%) |
| 18 to 34 Years | 0 (0.0%) | 19 (2.6%) |
| 35 to 64 Years | 82 (6.1%) | 43 (3.0%) |
| 65 to 74 Years | 1 (0.3%) | 0 (0.0%) |
| 75 Years and over | 18 (6.6%) | 0 (0.0%) |
Disability Class: Cognitive Difficulty
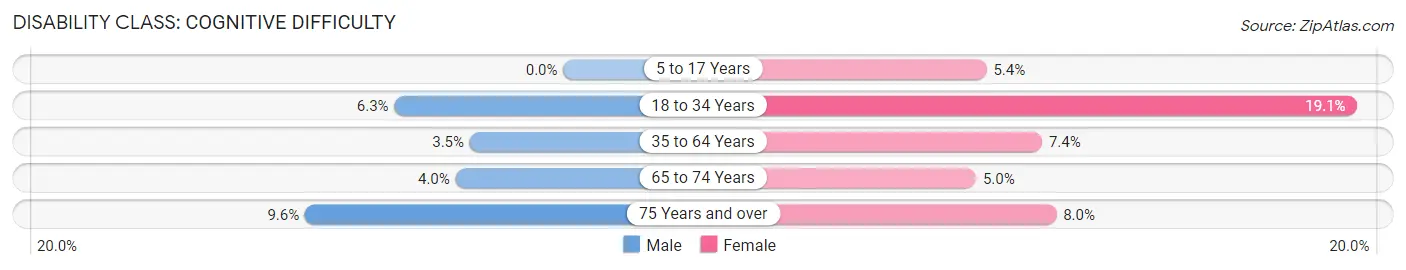
| Age Bracket | Male | Female |
| 5 to 17 Years | 0 (0.0%) | 31 (5.4%) |
| 18 to 34 Years | 49 (6.3%) | 142 (19.1%) |
| 35 to 64 Years | 47 (3.5%) | 106 (7.4%) |
| 65 to 74 Years | 16 (4.0%) | 22 (5.0%) |
| 75 Years and over | 26 (9.6%) | 34 (8.0%) |
Disability Class: Ambulatory Difficulty
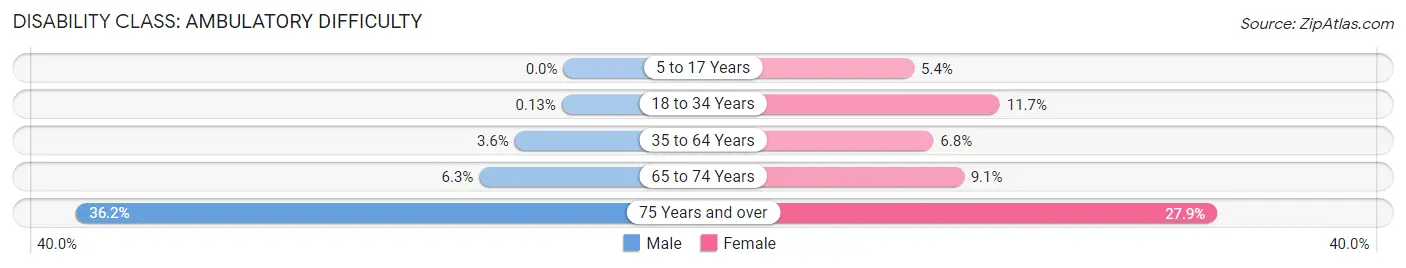
| Age Bracket | Male | Female |
| 5 to 17 Years | 0 (0.0%) | 31 (5.4%) |
| 18 to 34 Years | 1 (0.1%) | 87 (11.7%) |
| 35 to 64 Years | 49 (3.6%) | 97 (6.8%) |
| 65 to 74 Years | 25 (6.2%) | 40 (9.0%) |
| 75 Years and over | 98 (36.2%) | 119 (27.9%) |
Disability Class: Self-Care Difficulty
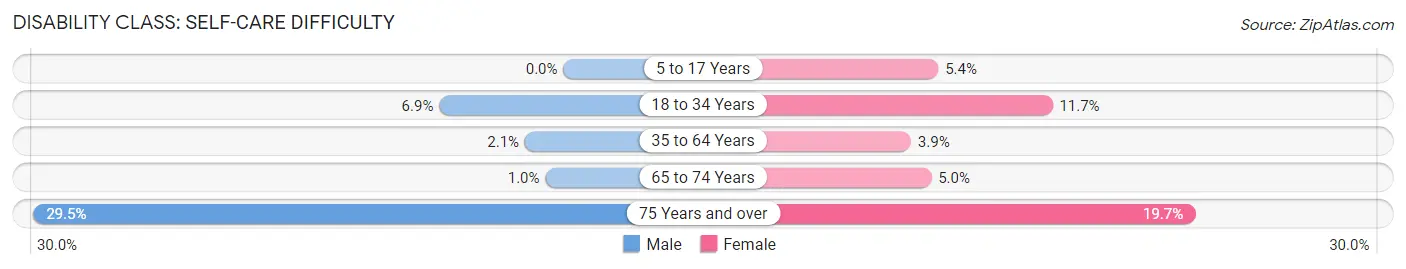
| Age Bracket | Male | Female |
| 5 to 17 Years | 0 (0.0%) | 31 (5.4%) |
| 18 to 34 Years | 54 (6.9%) | 87 (11.7%) |
| 35 to 64 Years | 29 (2.1%) | 55 (3.8%) |
| 65 to 74 Years | 4 (1.0%) | 22 (5.0%) |
| 75 Years and over | 80 (29.5%) | 84 (19.7%) |
Technology Access in McCook
Computing Device Access in McCook
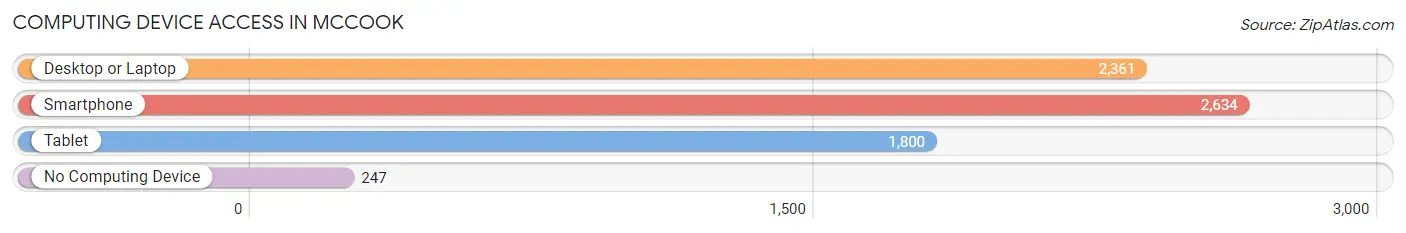
| Device Type | # Households | % Households |
| Desktop or Laptop | 2,361 | 74.5% |
| Smartphone | 2,634 | 83.1% |
| Tablet | 1,800 | 56.8% |
| No Computing Device | 247 | 7.8% |
| Total | 3,168 | 100.0% |
Internet Access in McCook
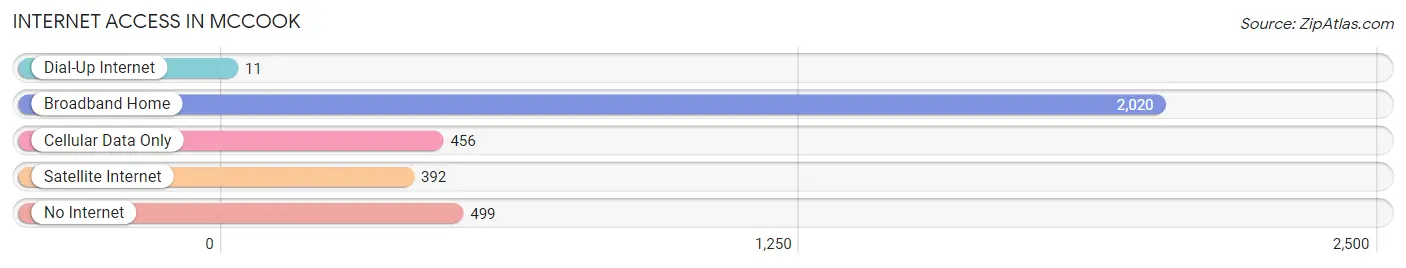
| Internet Type | # Households | % Households |
| Dial-Up Internet | 11 | 0.4% |
| Broadband Home | 2,020 | 63.8% |
| Cellular Data Only | 456 | 14.4% |
| Satellite Internet | 392 | 12.4% |
| No Internet | 499 | 15.8% |
| Total | 3,168 | 100.0% |
McCook Summary
Mccook, Nebraska is a small city located in Red Willow County in the southwestern part of the state. It is the county seat and the largest city in the county. The city is located on the Republican River, which is a tributary of the Platte River. The city is located at the intersection of U.S. Highways 6 and 83, and is about 90 miles west of Lincoln, the state capital.
History
Mccook was founded in 1882 by the Union Pacific Railroad. The city was named after Alexander McDowell McCook, a Union general in the Civil War. The city was originally a railroad town, and the railroad was the main employer in the area. The city was incorporated in 1887.
In the early 1900s, Mccook was a major center for the cattle industry. The city was also a major center for the sugar beet industry. The sugar beet industry was so important to the city that it was nicknamed the “Sugar Beet Capital of the World.”
In the 1950s, the city began to diversify its economy. The city became a major center for manufacturing, and several large companies, such as Cargill, opened plants in the city. The city also became a major center for agriculture, and the surrounding area is still a major producer of corn, soybeans, and wheat.
Geography
Mccook is located in the southwestern part of Nebraska, in Red Willow County. The city is located on the Republican River, which is a tributary of the Platte River. The city is located at the intersection of U.S. Highways 6 and 83, and is about 90 miles west of Lincoln, the state capital.
The city has a total area of 4.2 square miles, all of which is land. The city is located in the High Plains region of the Great Plains, and the elevation is 2,845 feet above sea level. The climate is semi-arid, with hot summers and cold winters.
Economy
Mccook’s economy is largely based on agriculture and manufacturing. The city is a major center for the production of corn, soybeans, and wheat. The city is also a major center for the sugar beet industry, and is nicknamed the “Sugar Beet Capital of the World.”
The city is also a major center for manufacturing. Several large companies, such as Cargill, have plants in the city. The city is also home to several small businesses, such as restaurants, retail stores, and service providers.
Demographics
As of the 2010 census, the population of Mccook was 5,919. The racial makeup of the city was 91.2% White, 0.7% African American, 0.4% Native American, 0.7% Asian, 0.1% Pacific Islander, 4.7% from other races, and 2.2% from two or more races. Hispanic or Latino of any race were 8.3% of the population.
The median household income in Mccook was $41,944, and the median family income was $50,919. The per capita income was $20,945. About 11.2% of the population was below the poverty line.
Mccook is a small city with a rich history and a diverse economy. The city is a major center for agriculture and manufacturing, and is home to several small businesses. The city has a diverse population, and is a great place to live and work.
Common Questions
What is Per Capita Income in McCook?
Per Capita income in McCook is $34,758.
What is the Median Family Income in McCook?
Median Family Income in McCook is $74,861.
What is the Median Household income in McCook?
Median Household Income in McCook is $53,750.
What is Income or Wage Gap in McCook?
Income or Wage Gap in McCook is 19.2%.
Women in McCook earn 80.8 cents for every dollar earned by a man.
What is Inequality or Gini Index in McCook?
Inequality or Gini Index in McCook is 0.48.
What is the Total Population of McCook?
Total Population of McCook is 7,412.
What is the Total Male Population of McCook?
Total Male Population of McCook is 3,520.
What is the Total Female Population of McCook?
Total Female Population of McCook is 3,892.
What is the Ratio of Males per 100 Females in McCook?
There are 90.44 Males per 100 Females in McCook.
What is the Ratio of Females per 100 Males in McCook?
There are 110.57 Females per 100 Males in McCook.
What is the Median Population Age in McCook?
Median Population Age in McCook is 41.5 Years.
What is the Average Family Size in McCook
Average Family Size in McCook is 3.2 People.
What is the Average Household Size in McCook
Average Household Size in McCook is 2.3 People.
How Large is the Labor Force in McCook?
There are 3,918 People in the Labor Forcein in McCook.
What is the Percentage of People in the Labor Force in McCook?
63.7% of People are in the Labor Force in McCook.
What is the Unemployment Rate in McCook?
Unemployment Rate in McCook is 2.6%.