Odessa, NE Map & Demographics
Odessa Map
Odessa Overview
$19,968
PER CAPITA INCOME
$52,083
AVG FAMILY INCOME
$42,656
AVG HOUSEHOLD INCOME
37.6%
WAGE / INCOME GAP [ % ]
62.4¢/ $1
WAGE / INCOME GAP [ $ ]
0.31
INEQUALITY / GINI INDEX
129
TOTAL POPULATION
68
MALE POPULATION
61
FEMALE POPULATION
111.48
MALES / 100 FEMALES
89.71
FEMALES / 100 MALES
53.4
MEDIAN AGE
3.2
AVG FAMILY SIZE
2.3
AVG HOUSEHOLD SIZE
50
LABOR FORCE [ PEOPLE ]
44.6%
PERCENT IN LABOR FORCE
Odessa Zip Codes
Income in Odessa
Income Overview in Odessa
Per Capita Income in Odessa is $19,968, while median incomes of families and households are $52,083 and $42,656 respectively.
| Characteristic | Number | Measure |
| Per Capita Income | 129 | $19,968 |
| Median Family Income | 28 | $52,083 |
| Mean Family Income | 28 | $60,843 |
| Median Household Income | 57 | $42,656 |
| Mean Household Income | 57 | $44,193 |
| Income Deficit | 28 | $0 |
| Wage / Income Gap (%) | 129 | 37.57% |
| Wage / Income Gap ($) | 129 | 62.43¢ per $1 |
| Gini / Inequality Index | 129 | 0.31 |
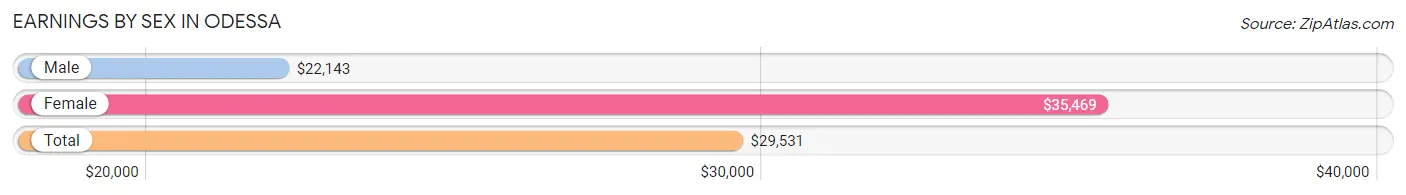
Earnings by Sex in Odessa
Average Earnings in Odessa are $29,531, $22,143 for men and $35,469 for women, a difference of 37.6%.
| Sex | Number | Average Earnings |
| Male | 30 (58.8%) | $22,143 |
| Female | 21 (41.2%) | $35,469 |
| Total | 51 (100.0%) | $29,531 |
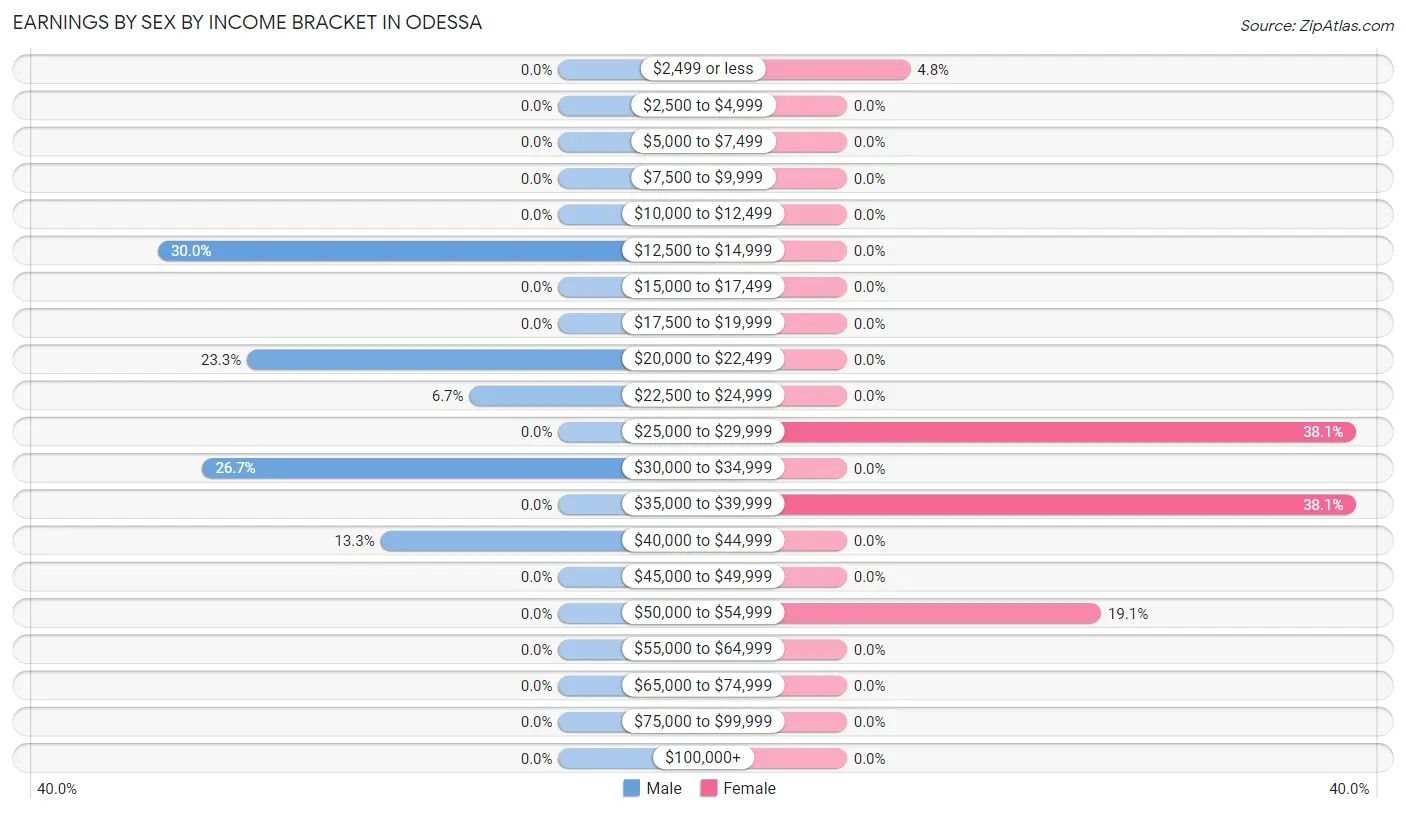
Earnings by Sex by Income Bracket in Odessa
The most common earnings brackets in Odessa are $12,500 to $14,999 for men (9 | 30.0%) and $25,000 to $29,999 for women (8 | 38.1%).
| Income | Male | Female |
| $2,499 or less | 0 (0.0%) | 1 (4.8%) |
| $2,500 to $4,999 | 0 (0.0%) | 0 (0.0%) |
| $5,000 to $7,499 | 0 (0.0%) | 0 (0.0%) |
| $7,500 to $9,999 | 0 (0.0%) | 0 (0.0%) |
| $10,000 to $12,499 | 0 (0.0%) | 0 (0.0%) |
| $12,500 to $14,999 | 9 (30.0%) | 0 (0.0%) |
| $15,000 to $17,499 | 0 (0.0%) | 0 (0.0%) |
| $17,500 to $19,999 | 0 (0.0%) | 0 (0.0%) |
| $20,000 to $22,499 | 7 (23.3%) | 0 (0.0%) |
| $22,500 to $24,999 | 2 (6.7%) | 0 (0.0%) |
| $25,000 to $29,999 | 0 (0.0%) | 8 (38.1%) |
| $30,000 to $34,999 | 8 (26.7%) | 0 (0.0%) |
| $35,000 to $39,999 | 0 (0.0%) | 8 (38.1%) |
| $40,000 to $44,999 | 4 (13.3%) | 0 (0.0%) |
| $45,000 to $49,999 | 0 (0.0%) | 0 (0.0%) |
| $50,000 to $54,999 | 0 (0.0%) | 4 (19.1%) |
| $55,000 to $64,999 | 0 (0.0%) | 0 (0.0%) |
| $65,000 to $74,999 | 0 (0.0%) | 0 (0.0%) |
| $75,000 to $99,999 | 0 (0.0%) | 0 (0.0%) |
| $100,000+ | 0 (0.0%) | 0 (0.0%) |
| Total | 30 (100.0%) | 21 (100.0%) |
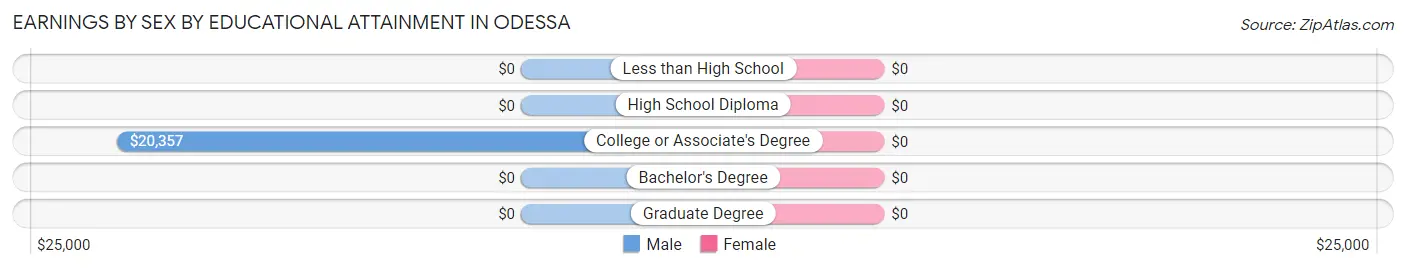
Earnings by Sex by Educational Attainment in Odessa
| Educational Attainment | Male Income | Female Income |
| Less than High School | - | - |
| High School Diploma | - | - |
| College or Associate's Degree | $20,357 | $0 |
| Bachelor's Degree | - | - |
| Graduate Degree | - | - |
| Total | $22,143 | $35,469 |
Family Income in Odessa
Family Income Brackets in Odessa
According to the Odessa family income data, there are 14 families falling into the $50,000 to $74,999 income range, which is the most common income bracket and makes up 50.0% of all families.
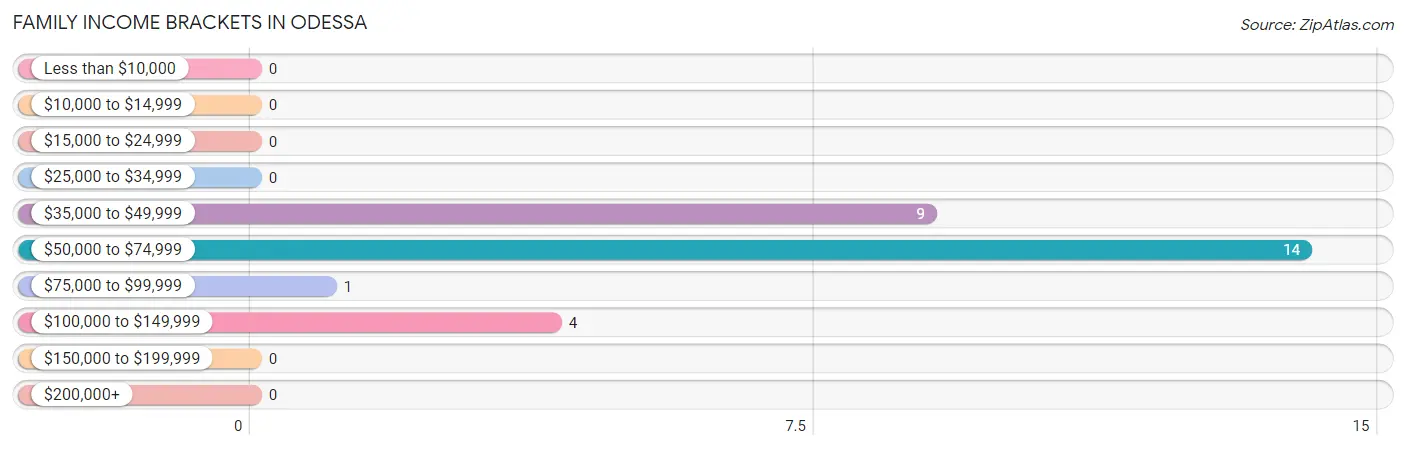
| Income Bracket | # Families | % Families |
| Less than $10,000 | 0 | 0.0% |
| $10,000 to $14,999 | 0 | 0.0% |
| $15,000 to $24,999 | 0 | 0.0% |
| $25,000 to $34,999 | 0 | 0.0% |
| $35,000 to $49,999 | 9 | 32.1% |
| $50,000 to $74,999 | 14 | 50.0% |
| $75,000 to $99,999 | 1 | 3.6% |
| $100,000 to $149,999 | 4 | 14.3% |
| $150,000 to $199,999 | 0 | 0.0% |
| $200,000+ | 0 | 0.0% |
Family Income by Famaliy Size in Odessa
2-person families (16 | 57.1%) account for the highest median family income in Odessa with $37,222 per family, while 2-person families (16 | 57.1%) have the highest median income of $18,611 per family member.
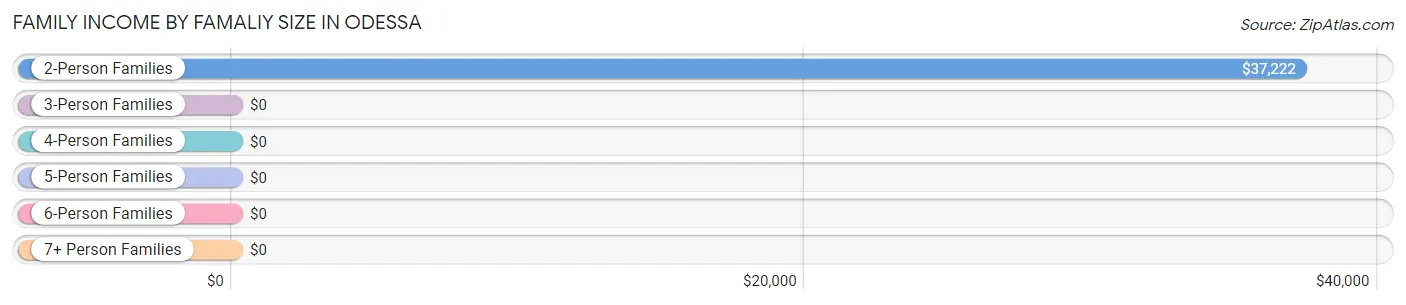
| Income Bracket | # Families | Median Income |
| 2-Person Families | 16 (57.1%) | $37,222 |
| 3-Person Families | 0 (0.0%) | $0 |
| 4-Person Families | 8 (28.6%) | $0 |
| 5-Person Families | 4 (14.3%) | $0 |
| 6-Person Families | 0 (0.0%) | $0 |
| 7+ Person Families | 0 (0.0%) | $0 |
| Total | 28 (100.0%) | $52,083 |
Family Income by Number of Earners in Odessa
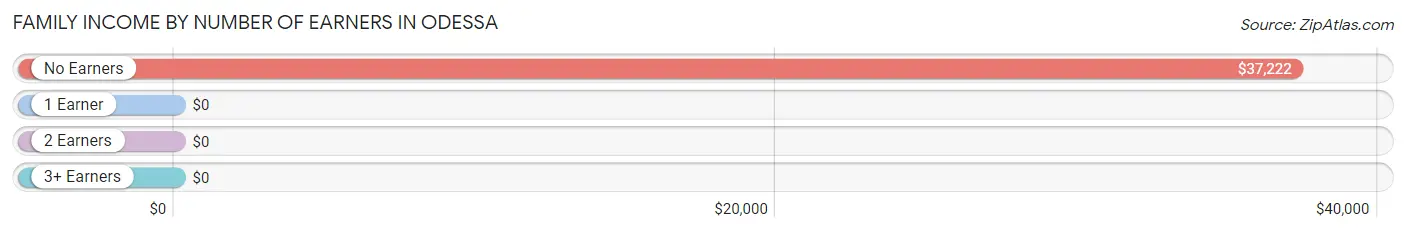
| Number of Earners | # Families | Median Income |
| No Earners | 16 (57.1%) | $37,222 |
| 1 Earner | 0 (0.0%) | $0 |
| 2 Earners | 12 (42.9%) | $0 |
| 3+ Earners | 0 (0.0%) | $0 |
| Total | 28 (100.0%) | $52,083 |
Household Income in Odessa
Household Income Brackets in Odessa
With 19 households falling in the category, the $15,000 to $24,999 income range is the most frequent in Odessa, accounting for 33.3% of all households.
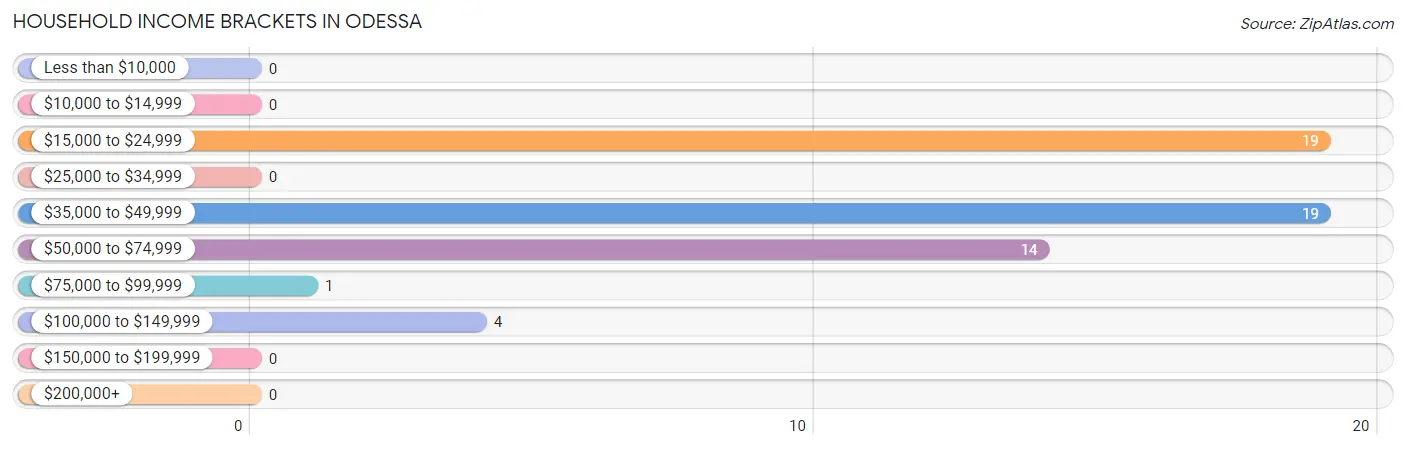
| Income Bracket | # Households | % Households |
| Less than $10,000 | 0 | 0.0% |
| $10,000 to $14,999 | 0 | 0.0% |
| $15,000 to $24,999 | 19 | 33.3% |
| $25,000 to $34,999 | 0 | 0.0% |
| $35,000 to $49,999 | 19 | 33.3% |
| $50,000 to $74,999 | 14 | 24.6% |
| $75,000 to $99,999 | 1 | 1.8% |
| $100,000 to $149,999 | 4 | 7.0% |
| $150,000 to $199,999 | 0 | 0.0% |
| $200,000+ | 0 | 0.0% |
Household Income by Householder Age in Odessa
The median household income in Odessa is $42,656, with the highest median household income of $43,281 found in the 45 to 64 years age bracket for the primary householder. A total of 23 households (40.4%) fall into this category.
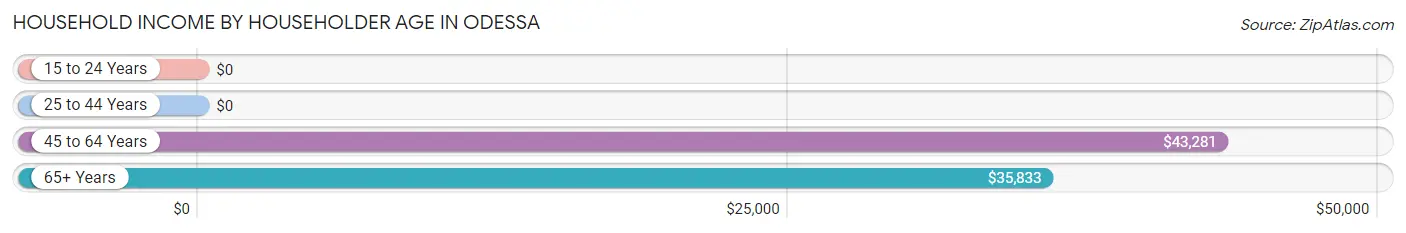
| Income Bracket | # Households | Median Income |
| 15 to 24 Years | 0 (0.0%) | $0 |
| 25 to 44 Years | 8 (14.0%) | $0 |
| 45 to 64 Years | 23 (40.4%) | $43,281 |
| 65+ Years | 26 (45.6%) | $35,833 |
| Total | 57 (100.0%) | $42,656 |
Poverty in Odessa
Income Below Poverty by Sex and Age in Odessa
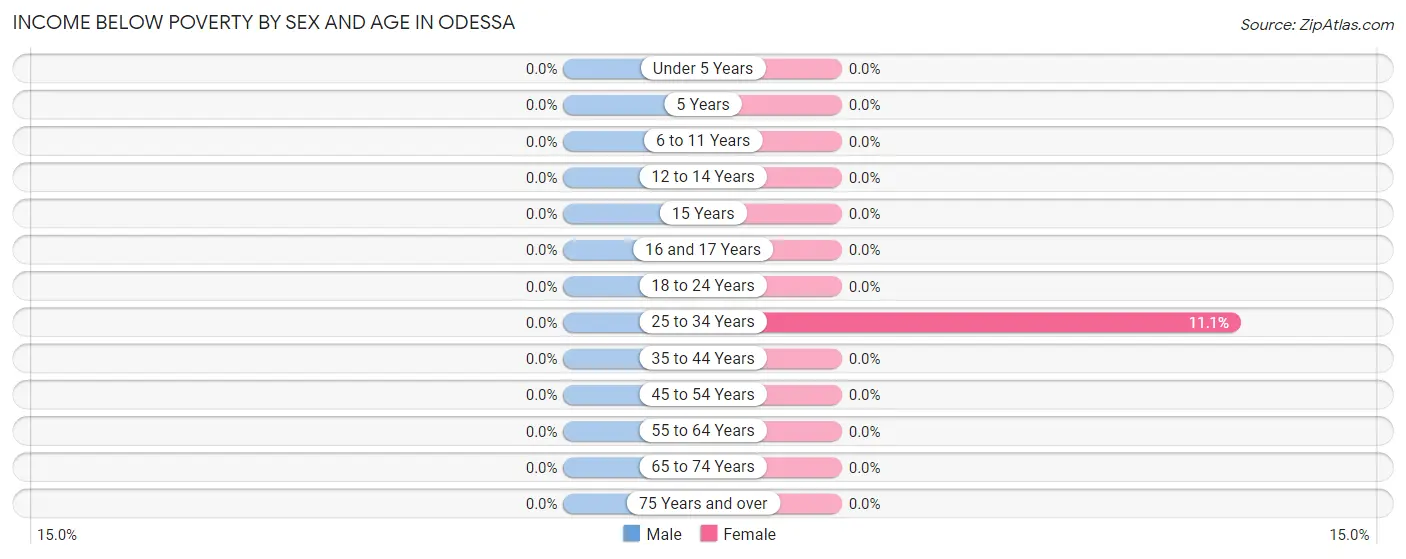
| Age Bracket | Male | Female |
| Under 5 Years | 0 (0.0%) | 0 (0.0%) |
| 5 Years | 0 (0.0%) | 0 (0.0%) |
| 6 to 11 Years | 0 (0.0%) | 0 (0.0%) |
| 12 to 14 Years | 0 (0.0%) | 0 (0.0%) |
| 15 Years | 0 (0.0%) | 0 (0.0%) |
| 16 and 17 Years | 0 (0.0%) | 0 (0.0%) |
| 18 to 24 Years | 0 (0.0%) | 0 (0.0%) |
| 25 to 34 Years | 0 (0.0%) | 1 (11.1%) |
| 35 to 44 Years | 0 (0.0%) | 0 (0.0%) |
| 45 to 54 Years | 0 (0.0%) | 0 (0.0%) |
| 55 to 64 Years | 0 (0.0%) | 0 (0.0%) |
| 65 to 74 Years | 0 (0.0%) | 0 (0.0%) |
| 75 Years and over | 0 (0.0%) | 0 (0.0%) |
| Total | 0 (0.0%) | 1 (1.6%) |
Income Above Poverty by Sex and Age in Odessa
According to the poverty statistics in Odessa, males aged 18 to 24 years and females aged under 5 years are the age groups that are most secure financially, with 100.0% of males and 100.0% of females in these age groups living above the poverty line.
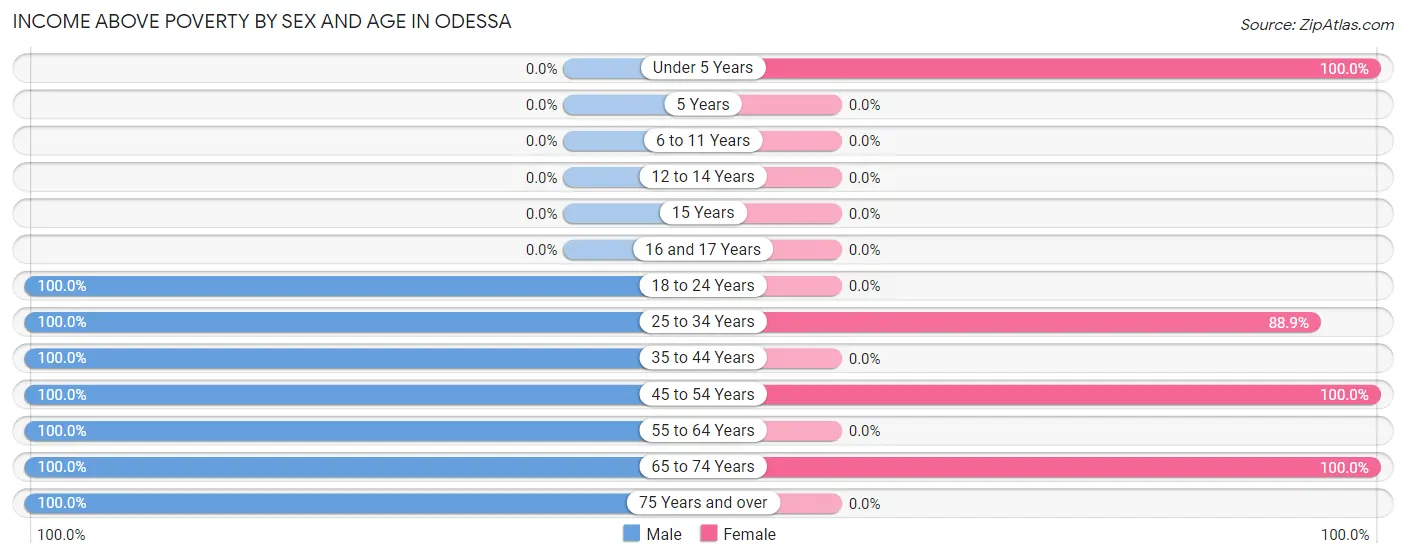
| Age Bracket | Male | Female |
| Under 5 Years | 0 (0.0%) | 17 (100.0%) |
| 5 Years | 0 (0.0%) | 0 (0.0%) |
| 6 to 11 Years | 0 (0.0%) | 0 (0.0%) |
| 12 to 14 Years | 0 (0.0%) | 0 (0.0%) |
| 15 Years | 0 (0.0%) | 0 (0.0%) |
| 16 and 17 Years | 0 (0.0%) | 0 (0.0%) |
| 18 to 24 Years | 10 (100.0%) | 0 (0.0%) |
| 25 to 34 Years | 8 (100.0%) | 8 (88.9%) |
| 35 to 44 Years | 9 (100.0%) | 0 (0.0%) |
| 45 to 54 Years | 4 (100.0%) | 12 (100.0%) |
| 55 to 64 Years | 11 (100.0%) | 0 (0.0%) |
| 65 to 74 Years | 10 (100.0%) | 23 (100.0%) |
| 75 Years and over | 16 (100.0%) | 0 (0.0%) |
| Total | 68 (100.0%) | 60 (98.4%) |
Income Below Poverty Among Married-Couple Families in Odessa
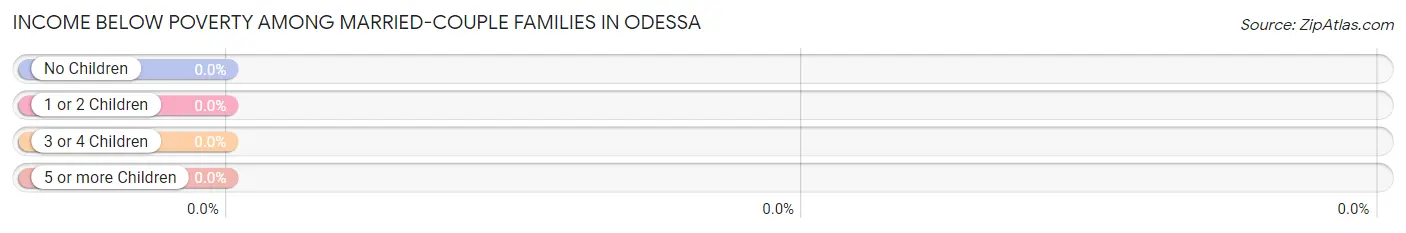
| Children | Above Poverty | Below Poverty |
| No Children | 20 (100.0%) | 0 (0.0%) |
| 1 or 2 Children | 8 (100.0%) | 0 (0.0%) |
| 3 or 4 Children | 0 (0.0%) | 0 (0.0%) |
| 5 or more Children | 0 (0.0%) | 0 (0.0%) |
| Total | 28 (100.0%) | 0 (0.0%) |
Income Below Poverty Among Single-Parent Households in Odessa
| Children | Single Father | Single Mother |
| No Children | 0 (0.0%) | 0 (0.0%) |
| 1 or 2 Children | 0 (0.0%) | 0 (0.0%) |
| 3 or 4 Children | 0 (0.0%) | 0 (0.0%) |
| 5 or more Children | 0 (0.0%) | 0 (0.0%) |
| Total | 0 (0.0%) | 0 (0.0%) |
Income Below Poverty Among Married-Couple vs Single-Parent Households in Odessa
| Children | Married-Couple Families | Single-Parent Households |
| No Children | 0 (0.0%) | 0 (0.0%) |
| 1 or 2 Children | 0 (0.0%) | 0 (0.0%) |
| 3 or 4 Children | 0 (0.0%) | 0 (0.0%) |
| 5 or more Children | 0 (0.0%) | 0 (0.0%) |
| Total | 0 (0.0%) | 0 (0.0%) |
Race in Odessa
The most populous races in Odessa are , and White / Caucasian (129 | 100.0%).
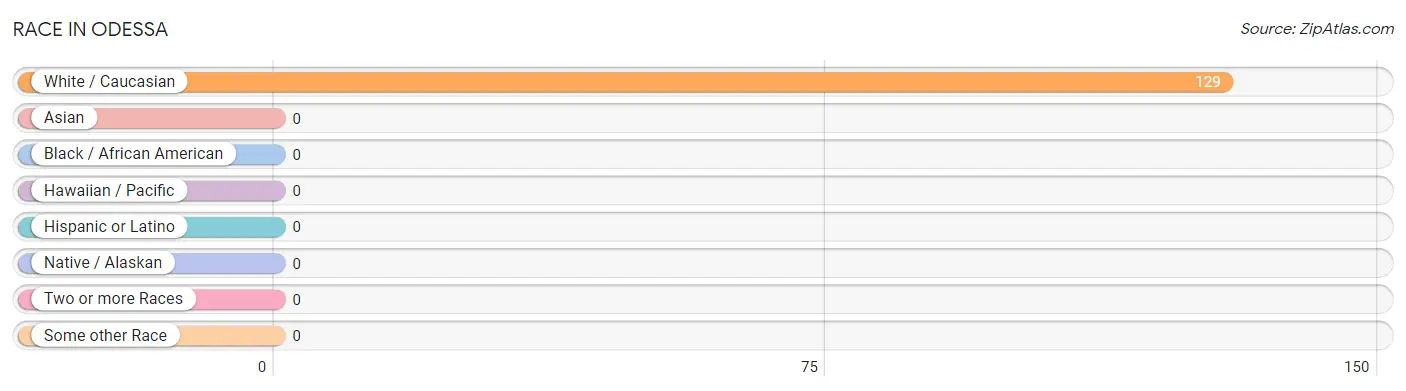
| Race | # Population | % Population |
| Asian | 0 | 0.0% |
| Black / African American | 0 | 0.0% |
| Hawaiian / Pacific | 0 | 0.0% |
| Hispanic or Latino | 0 | 0.0% |
| Native / Alaskan | 0 | 0.0% |
| White / Caucasian | 129 | 100.0% |
| Two or more Races | 0 | 0.0% |
| Some other Race | 0 | 0.0% |
| Total | 129 | 100.0% |
Ancestry in Odessa
The most populous ancestries reported in Odessa are English (37 | 28.7%), German (28 | 21.7%), Dutch (10 | 7.7%), Irish (9 | 7.0%), and Polish (9 | 7.0%), together accounting for 72.1% of all Odessa residents.
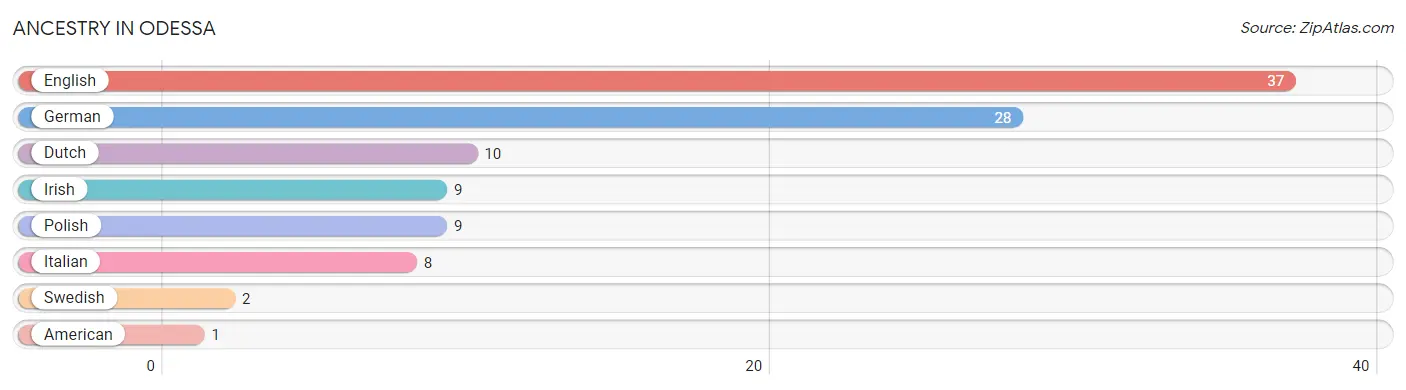
| Ancestry | # Population | % Population |
| American | 1 | 0.8% |
| Dutch | 10 | 7.7% |
| English | 37 | 28.7% |
| German | 28 | 21.7% |
| Irish | 9 | 7.0% |
| Italian | 8 | 6.2% |
| Polish | 9 | 7.0% |
| Swedish | 2 | 1.5% | View All 8 Rows |
Immigrants in Odessa

| Immigration Origin | # Population | % Population | View All 0 Rows |
Sex and Age in Odessa
Sex and Age in Odessa
The most populous age groups in Odessa are 75 to 79 Years (16 | 23.5%) for men and Under 5 Years (17 | 27.9%) for women.
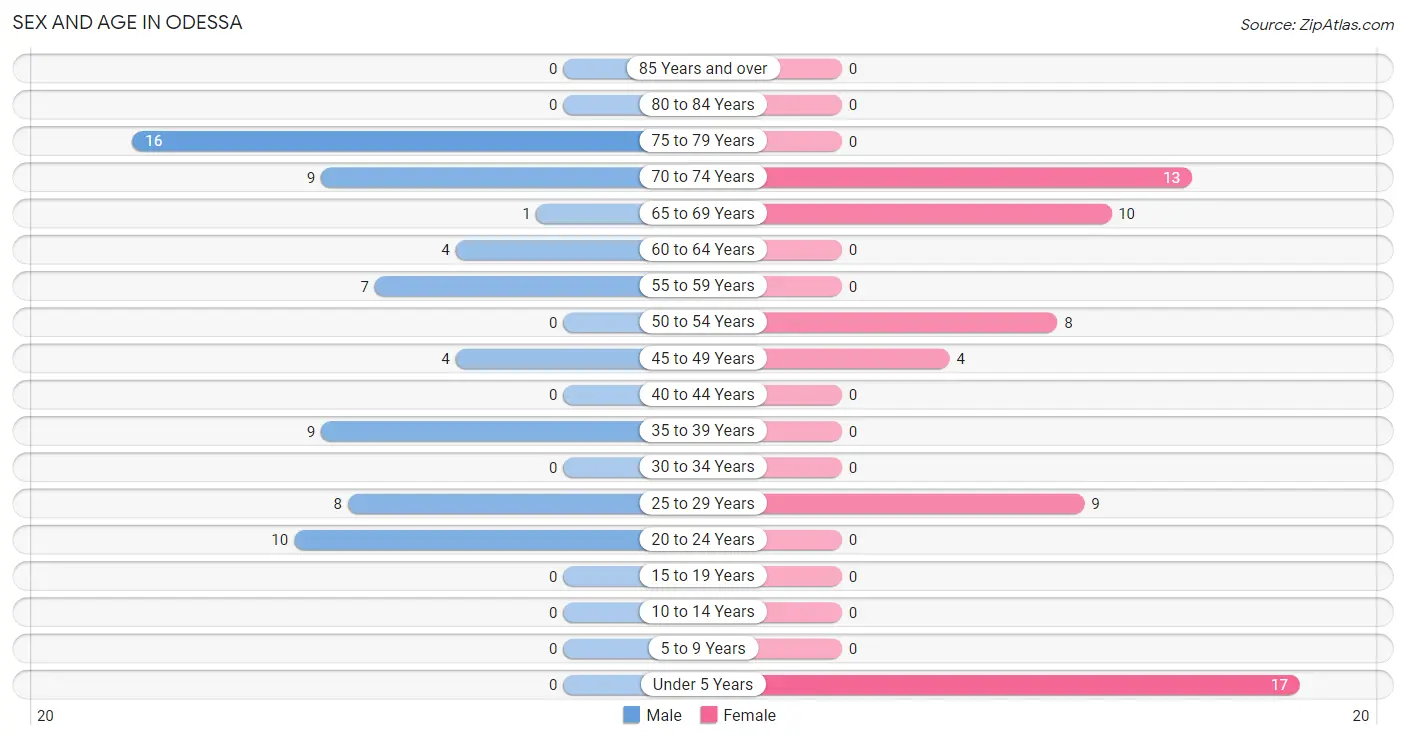
| Age Bracket | Male | Female |
| Under 5 Years | 0 (0.0%) | 17 (27.9%) |
| 5 to 9 Years | 0 (0.0%) | 0 (0.0%) |
| 10 to 14 Years | 0 (0.0%) | 0 (0.0%) |
| 15 to 19 Years | 0 (0.0%) | 0 (0.0%) |
| 20 to 24 Years | 10 (14.7%) | 0 (0.0%) |
| 25 to 29 Years | 8 (11.8%) | 9 (14.7%) |
| 30 to 34 Years | 0 (0.0%) | 0 (0.0%) |
| 35 to 39 Years | 9 (13.2%) | 0 (0.0%) |
| 40 to 44 Years | 0 (0.0%) | 0 (0.0%) |
| 45 to 49 Years | 4 (5.9%) | 4 (6.6%) |
| 50 to 54 Years | 0 (0.0%) | 8 (13.1%) |
| 55 to 59 Years | 7 (10.3%) | 0 (0.0%) |
| 60 to 64 Years | 4 (5.9%) | 0 (0.0%) |
| 65 to 69 Years | 1 (1.5%) | 10 (16.4%) |
| 70 to 74 Years | 9 (13.2%) | 13 (21.3%) |
| 75 to 79 Years | 16 (23.5%) | 0 (0.0%) |
| 80 to 84 Years | 0 (0.0%) | 0 (0.0%) |
| 85 Years and over | 0 (0.0%) | 0 (0.0%) |
| Total | 68 (100.0%) | 61 (100.0%) |
Families and Households in Odessa
Median Family Size in Odessa
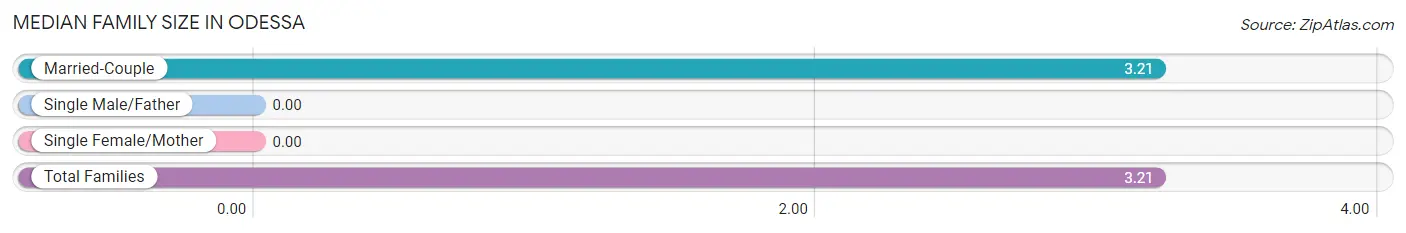
| Family Type | # Families | Family Size |
| Married-Couple | 28 (100.0%) | 3.21 |
| Single Male/Father | 0 (0.0%) | - |
| Single Female/Mother | 0 (0.0%) | - |
| Total Families | 28 (100.0%) | 3.21 |
Median Household Size in Odessa
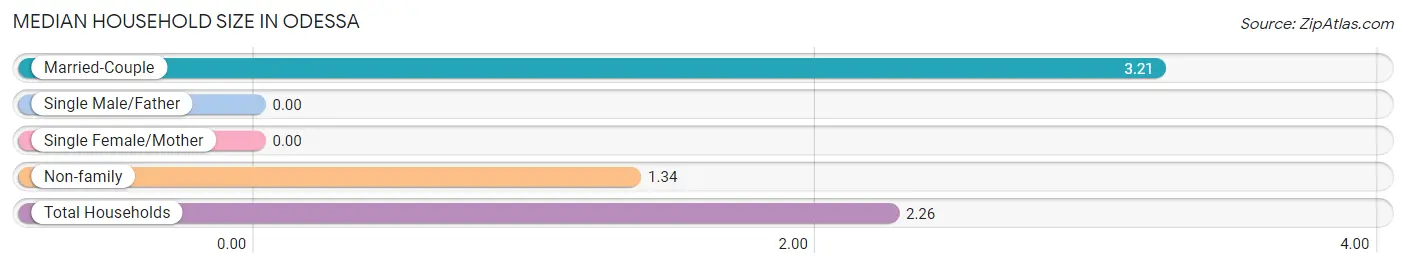
| Household Type | # Households | Household Size |
| Married-Couple | 28 (49.1%) | 3.21 |
| Single Male/Father | 0 (0.0%) | - |
| Single Female/Mother | 0 (0.0%) | - |
| Non-family | 29 (50.9%) | 1.34 |
| Total Households | 57 (100.0%) | 2.26 |
Household Size by Marriage Status in Odessa
Out of a total of 57 households in Odessa, 28 (49.1%) are family households, while 29 (50.9%) are nonfamily households. The most numerous type of family households are 2-person households, comprising 16, and the most common type of nonfamily households are 1-person households, comprising 19.
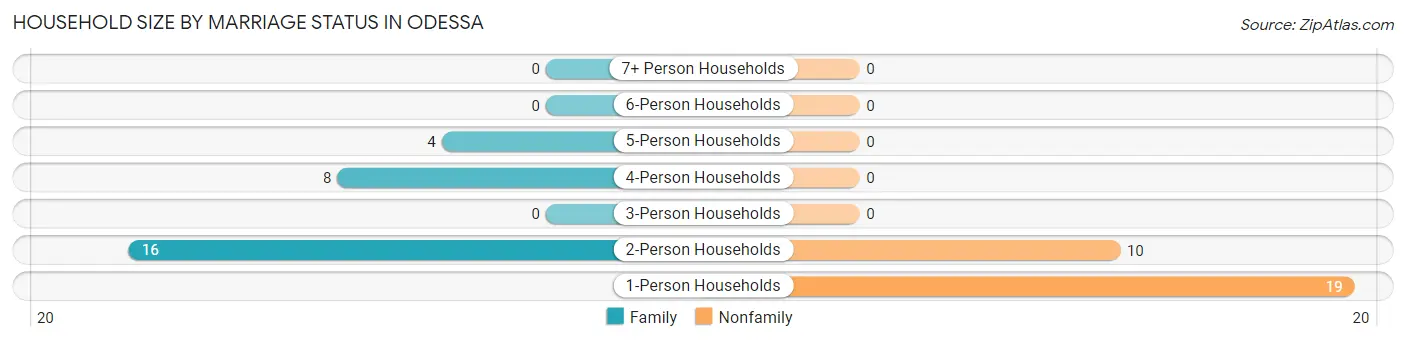
| Household Size | Family Households | Nonfamily Households |
| 1-Person Households | - | 19 (33.3%) |
| 2-Person Households | 16 (28.1%) | 10 (17.5%) |
| 3-Person Households | 0 (0.0%) | 0 (0.0%) |
| 4-Person Households | 8 (14.0%) | 0 (0.0%) |
| 5-Person Households | 4 (7.0%) | 0 (0.0%) |
| 6-Person Households | 0 (0.0%) | 0 (0.0%) |
| 7+ Person Households | 0 (0.0%) | 0 (0.0%) |
| Total | 28 (49.1%) | 29 (50.9%) |
Female Fertility in Odessa
Fertility by Age in Odessa
Average fertility rate in Odessa is 615.0 births per 1,000 women. Women in the age bracket of 20 to 34 years have the highest fertility rate with 889.0 births per 1,000 women. Women in the age bracket of 20 to 34 years acount for 100.0% of all women with births.
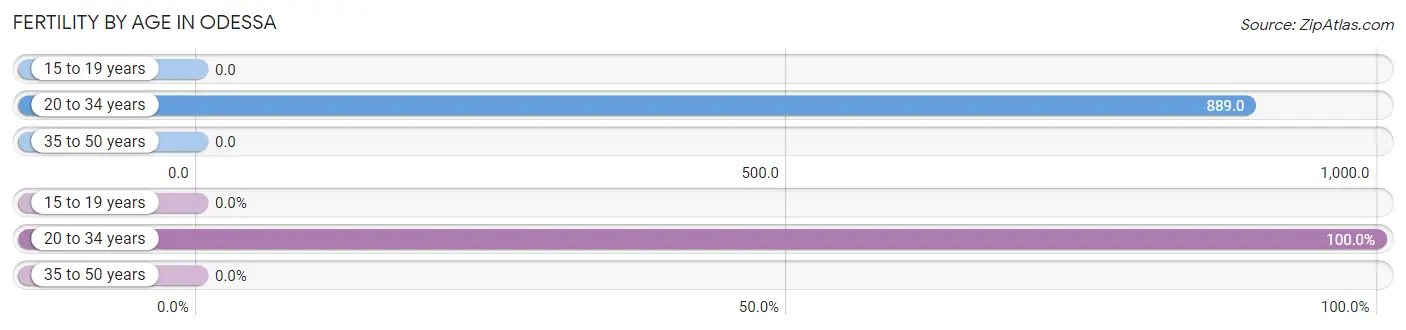
| Age Bracket | Women with Births | Births / 1,000 Women |
| 15 to 19 years | 0 (0.0%) | 0.0 |
| 20 to 34 years | 8 (100.0%) | 889.0 |
| 35 to 50 years | 0 (0.0%) | 0.0 |
| Total | 8 (100.0%) | 615.0 |
Fertility by Age by Marriage Status in Odessa
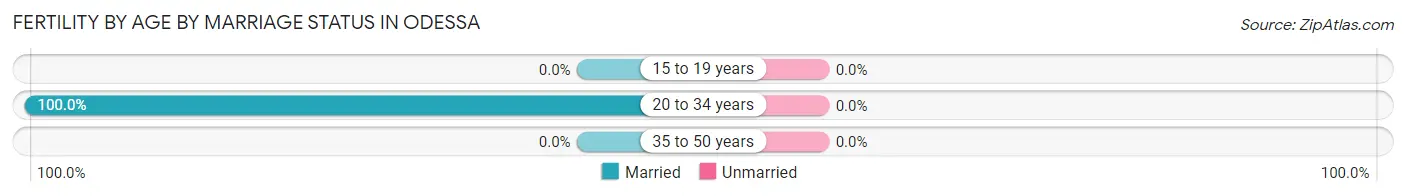
| Age Bracket | Married | Unmarried |
| 15 to 19 years | 0 (0.0%) | 0 (0.0%) |
| 20 to 34 years | 8 (100.0%) | 0 (0.0%) |
| 35 to 50 years | 0 (0.0%) | 0 (0.0%) |
| Total | 8 (100.0%) | 0 (0.0%) |
Fertility by Education in Odessa
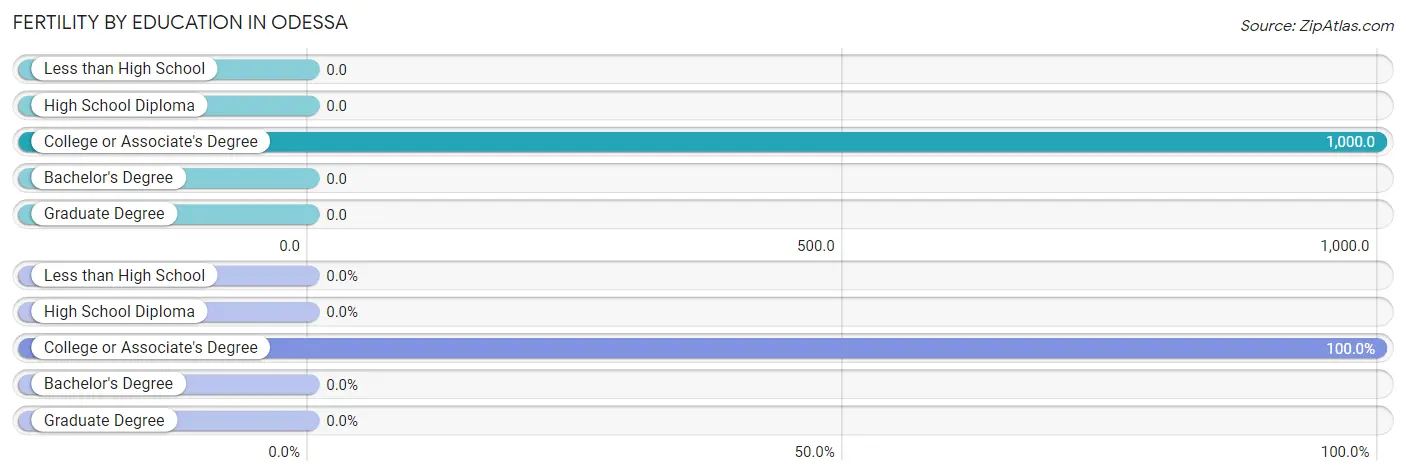
| Educational Attainment | Women with Births | Births / 1,000 Women |
| Less than High School | 0 (0.0%) | 0.0 |
| High School Diploma | 0 (0.0%) | 0.0 |
| College or Associate's Degree | 8 (100.0%) | 1,000.0 |
| Bachelor's Degree | 0 (0.0%) | 0.0 |
| Graduate Degree | 0 (0.0%) | 0.0 |
| Total | 8 (100.0%) | 615.0 |
Fertility by Education by Marriage Status in Odessa
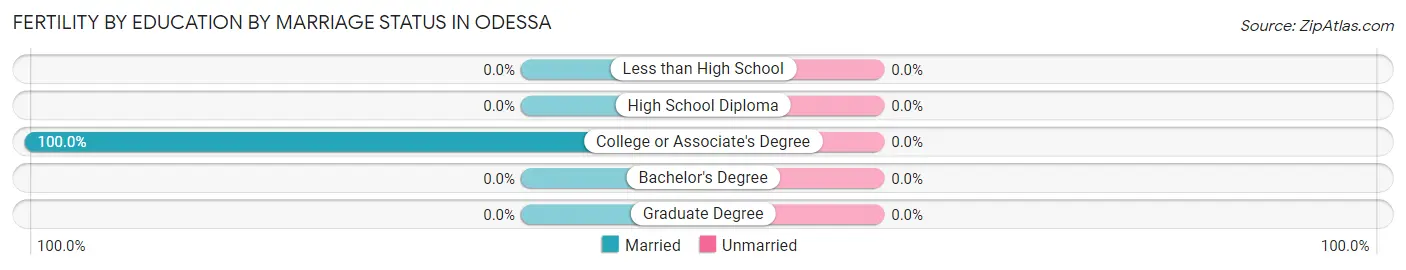
| Educational Attainment | Married | Unmarried |
| Less than High School | 0 (0.0%) | 0 (0.0%) |
| High School Diploma | 0 (0.0%) | 0 (0.0%) |
| College or Associate's Degree | 8 (100.0%) | 0 (0.0%) |
| Bachelor's Degree | 0 (0.0%) | 0 (0.0%) |
| Graduate Degree | 0 (0.0%) | 0 (0.0%) |
| Total | 8 (100.0%) | 0 (0.0%) |
Employment Characteristics in Odessa
Employment by Class of Employer in Odessa
Among the 50 employed individuals in Odessa, private company employees (40 | 80.0%), state government employees (8 | 16.0%), and local government employees (2 | 4.0%) make up the most common classes of employment.
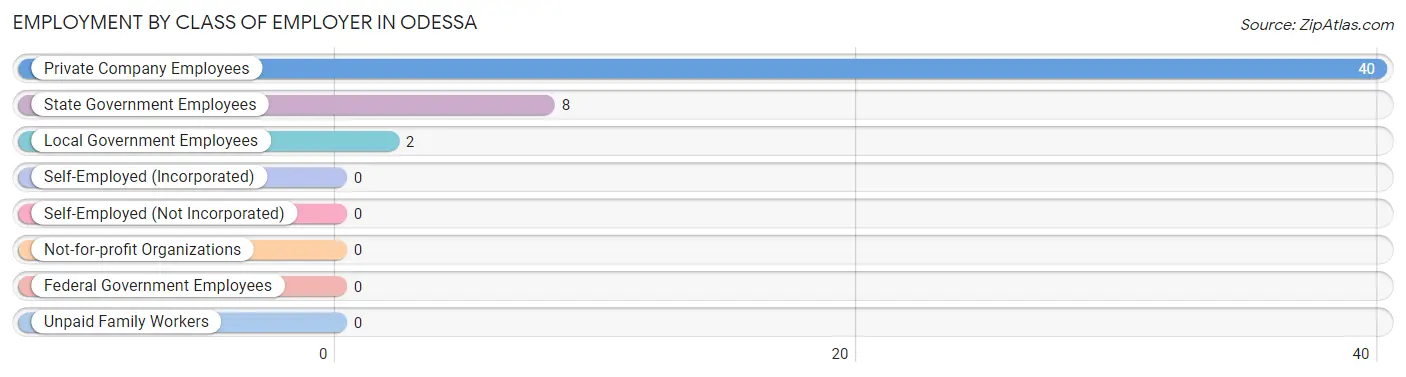
| Employer Class | # Employees | % Employees |
| Private Company Employees | 40 | 80.0% |
| Self-Employed (Incorporated) | 0 | 0.0% |
| Self-Employed (Not Incorporated) | 0 | 0.0% |
| Not-for-profit Organizations | 0 | 0.0% |
| Local Government Employees | 2 | 4.0% |
| State Government Employees | 8 | 16.0% |
| Federal Government Employees | 0 | 0.0% |
| Unpaid Family Workers | 0 | 0.0% |
| Total | 50 | 100.0% |
Employment Status by Age in Odessa
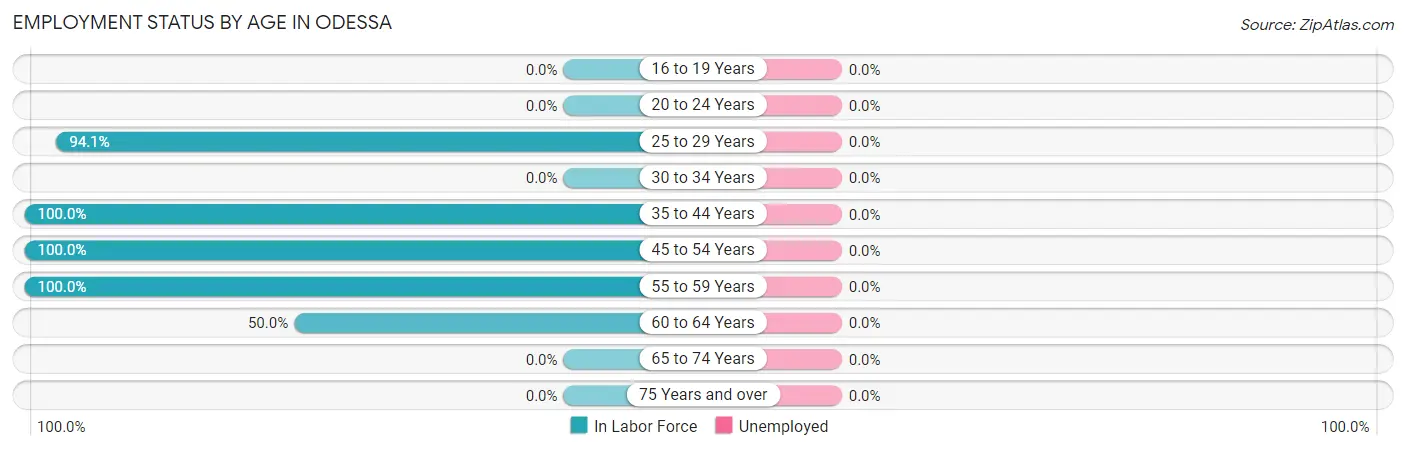
| Age Bracket | In Labor Force | Unemployed |
| 16 to 19 Years | 0 (0.0%) | 0 (0.0%) |
| 20 to 24 Years | 0 (0.0%) | 0 (0.0%) |
| 25 to 29 Years | 16 (94.1%) | 0 (0.0%) |
| 30 to 34 Years | 0 (0.0%) | 0 (0.0%) |
| 35 to 44 Years | 9 (100.0%) | 0 (0.0%) |
| 45 to 54 Years | 16 (100.0%) | 0 (0.0%) |
| 55 to 59 Years | 7 (100.0%) | 0 (0.0%) |
| 60 to 64 Years | 2 (50.0%) | 0 (0.0%) |
| 65 to 74 Years | 0 (0.0%) | 0 (0.0%) |
| 75 Years and over | 0 (0.0%) | 0 (0.0%) |
| Total | 50 (44.6%) | 0 (0.0%) |
Employment Status by Educational Attainment in Odessa
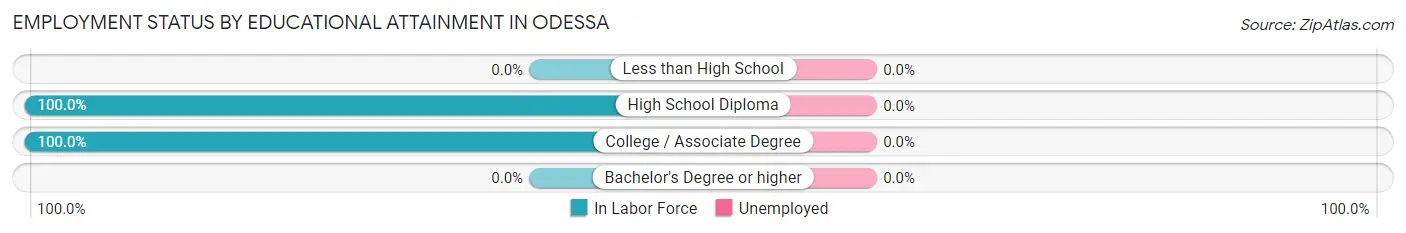
| Educational Attainment | In Labor Force | Unemployed |
| Less than High School | 0 (0.0%) | 0 (0.0%) |
| High School Diploma | 22 (100.0%) | 0 (0.0%) |
| College / Associate Degree | 28 (100.0%) | 0 (0.0%) |
| Bachelor's Degree or higher | 0 (0.0%) | 0 (0.0%) |
| Total | 50 (94.3%) | 0 (0.0%) |
Employment Occupations by Sex in Odessa
Management, Business, Science and Arts Occupations
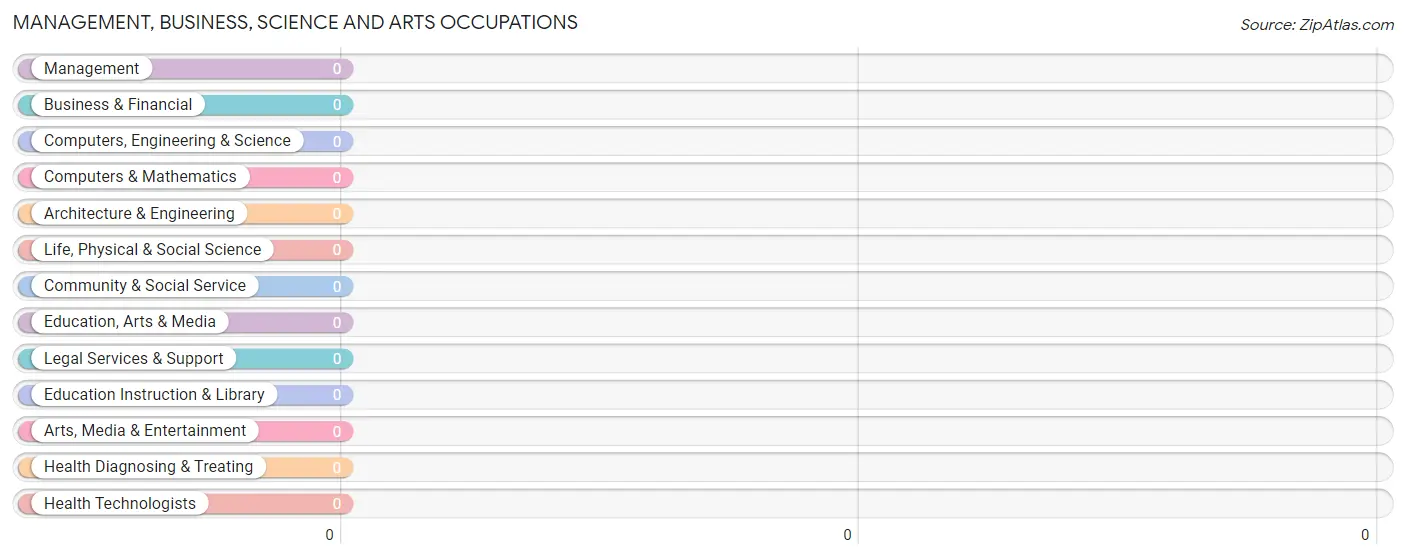
Management, Business, Science and Arts Occupations by Sex
| Occupation | Male | Female |
| Management | 0 (0.0%) | 0 (0.0%) |
| Business & Financial | 0 (0.0%) | 0 (0.0%) |
| Computers, Engineering & Science | 0 (0.0%) | 0 (0.0%) |
| Computers & Mathematics | 0 (0.0%) | 0 (0.0%) |
| Architecture & Engineering | 0 (0.0%) | 0 (0.0%) |
| Life, Physical & Social Science | 0 (0.0%) | 0 (0.0%) |
| Community & Social Service | 0 (0.0%) | 0 (0.0%) |
| Education, Arts & Media | 0 (0.0%) | 0 (0.0%) |
| Legal Services & Support | 0 (0.0%) | 0 (0.0%) |
| Education Instruction & Library | 0 (0.0%) | 0 (0.0%) |
| Arts, Media & Entertainment | 0 (0.0%) | 0 (0.0%) |
| Health Diagnosing & Treating | 0 (0.0%) | 0 (0.0%) |
| Health Technologists | 0 (0.0%) | 0 (0.0%) |
| Total (Category) | 0 (0.0%) | 0 (0.0%) |
| Total (Overall) | 30 (60.0%) | 20 (40.0%) |
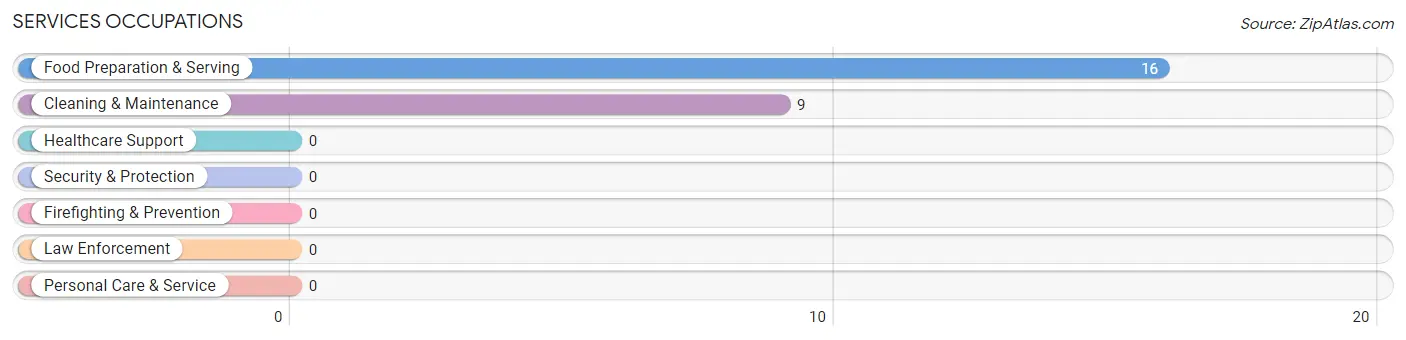
Services Occupations
The most common Services occupations in Odessa are Food Preparation & Serving (16 | 32.0%), and Cleaning & Maintenance (9 | 18.0%).
Services Occupations by Sex
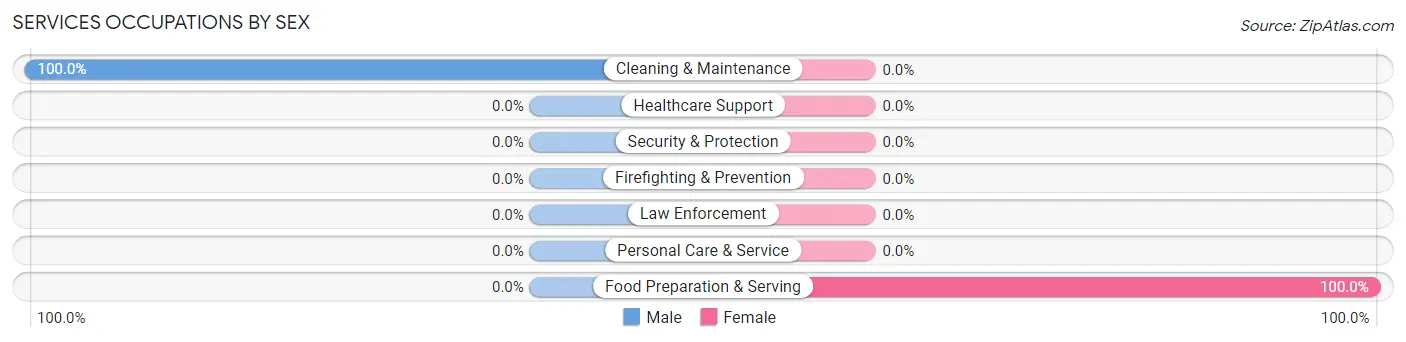
| Occupation | Male | Female |
| Healthcare Support | 0 (0.0%) | 0 (0.0%) |
| Security & Protection | 0 (0.0%) | 0 (0.0%) |
| Firefighting & Prevention | 0 (0.0%) | 0 (0.0%) |
| Law Enforcement | 0 (0.0%) | 0 (0.0%) |
| Food Preparation & Serving | 0 (0.0%) | 16 (100.0%) |
| Cleaning & Maintenance | 9 (100.0%) | 0 (0.0%) |
| Personal Care & Service | 0 (0.0%) | 0 (0.0%) |
| Total (Category) | 9 (36.0%) | 16 (64.0%) |
| Total (Overall) | 30 (60.0%) | 20 (40.0%) |
Sales and Office Occupations
Sales and Office Occupations by Sex
| Occupation | Male | Female |
| Sales & Related | 0 (0.0%) | 0 (0.0%) |
| Office & Administration | 0 (0.0%) | 0 (0.0%) |
| Total (Category) | 0 (0.0%) | 0 (0.0%) |
| Total (Overall) | 30 (60.0%) | 20 (40.0%) |
Natural Resources, Construction and Maintenance Occupations
The most common Natural Resources, Construction and Maintenance occupations in Odessa are , and Construction & Extraction (8 | 16.0%).
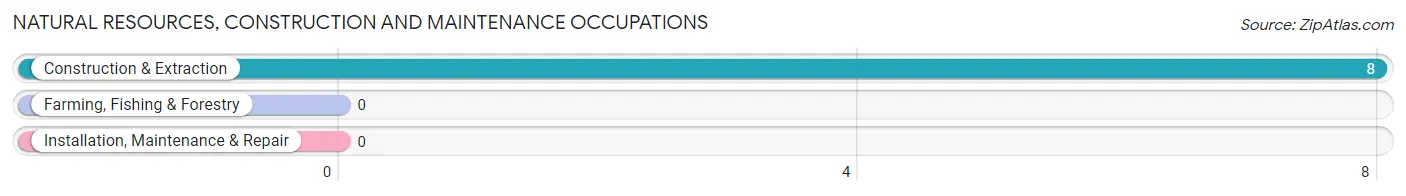
Natural Resources, Construction and Maintenance Occupations by Sex
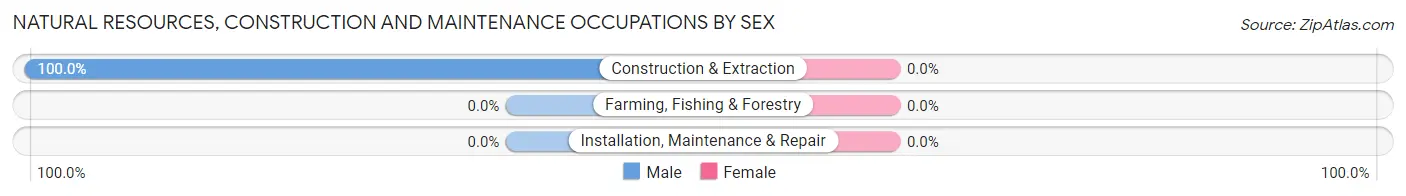
| Occupation | Male | Female |
| Farming, Fishing & Forestry | 0 (0.0%) | 0 (0.0%) |
| Construction & Extraction | 8 (100.0%) | 0 (0.0%) |
| Installation, Maintenance & Repair | 0 (0.0%) | 0 (0.0%) |
| Total (Category) | 8 (100.0%) | 0 (0.0%) |
| Total (Overall) | 30 (60.0%) | 20 (40.0%) |
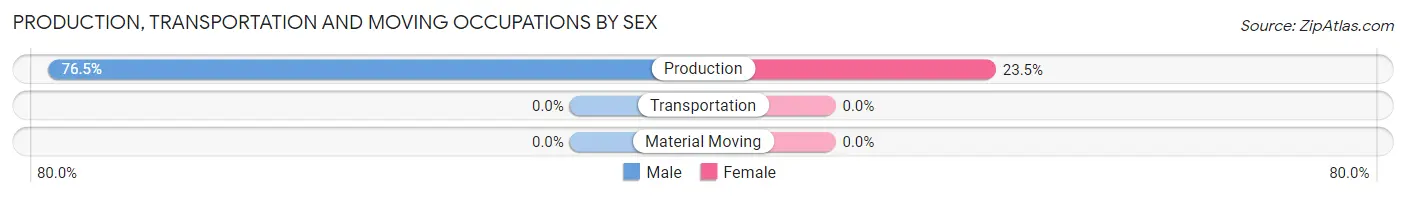
Production, Transportation and Moving Occupations
The most common Production, Transportation and Moving occupations in Odessa are , and Production (17 | 34.0%).
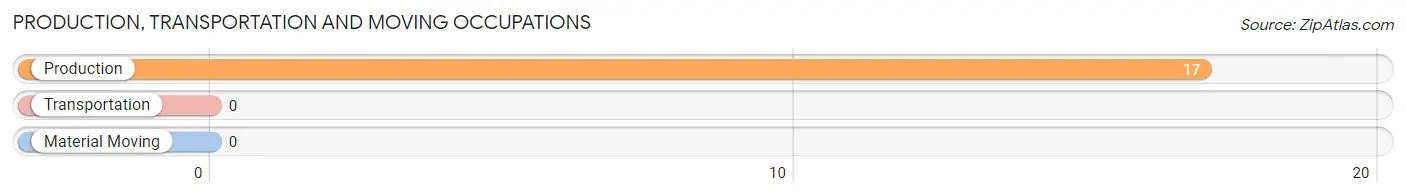
Production, Transportation and Moving Occupations by Sex
| Occupation | Male | Female |
| Production | 13 (76.5%) | 4 (23.5%) |
| Transportation | 0 (0.0%) | 0 (0.0%) |
| Material Moving | 0 (0.0%) | 0 (0.0%) |
| Total (Category) | 13 (76.5%) | 4 (23.5%) |
| Total (Overall) | 30 (60.0%) | 20 (40.0%) |
Employment Industries by Sex in Odessa
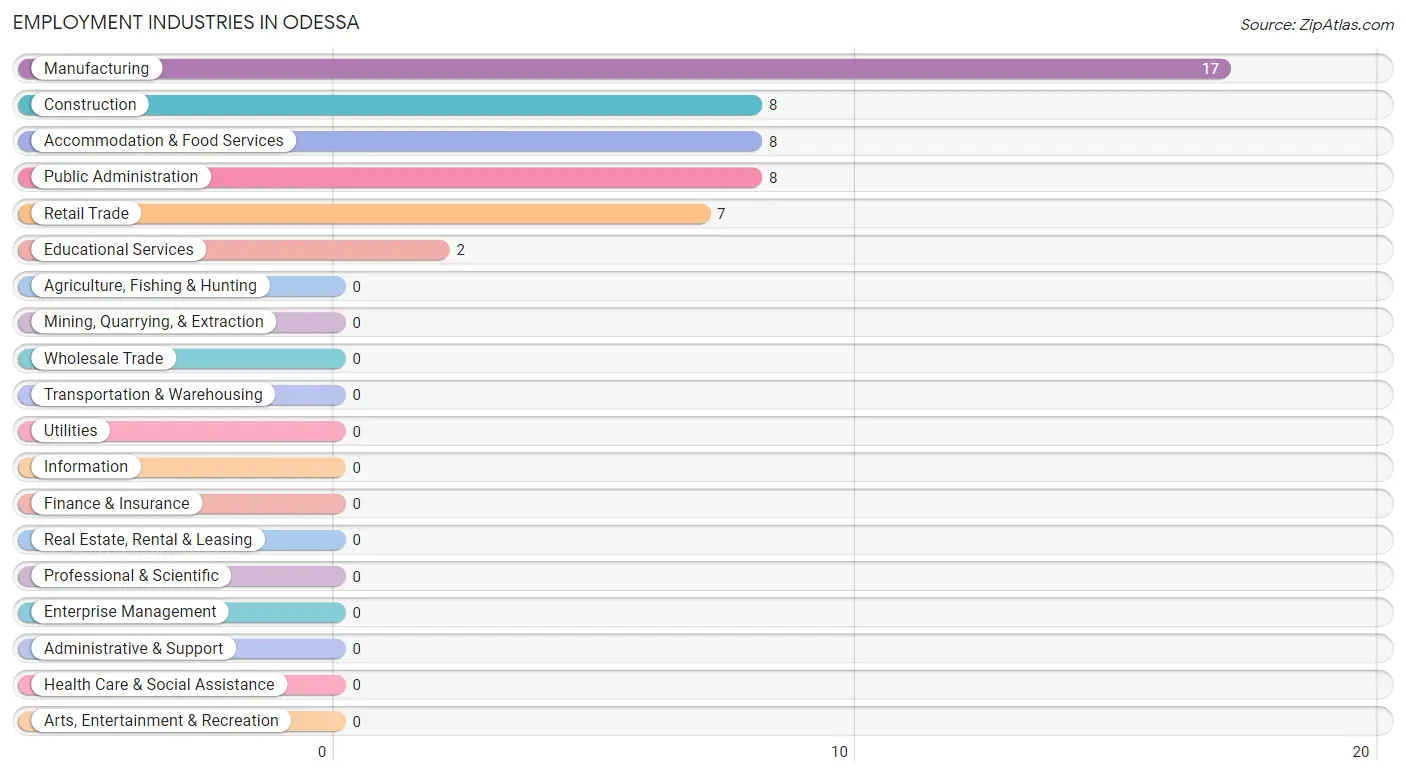
Employment Industries in Odessa
The major employment industries in Odessa include Manufacturing (17 | 34.0%), Construction (8 | 16.0%), Accommodation & Food Services (8 | 16.0%), Public Administration (8 | 16.0%), and Retail Trade (7 | 14.0%).
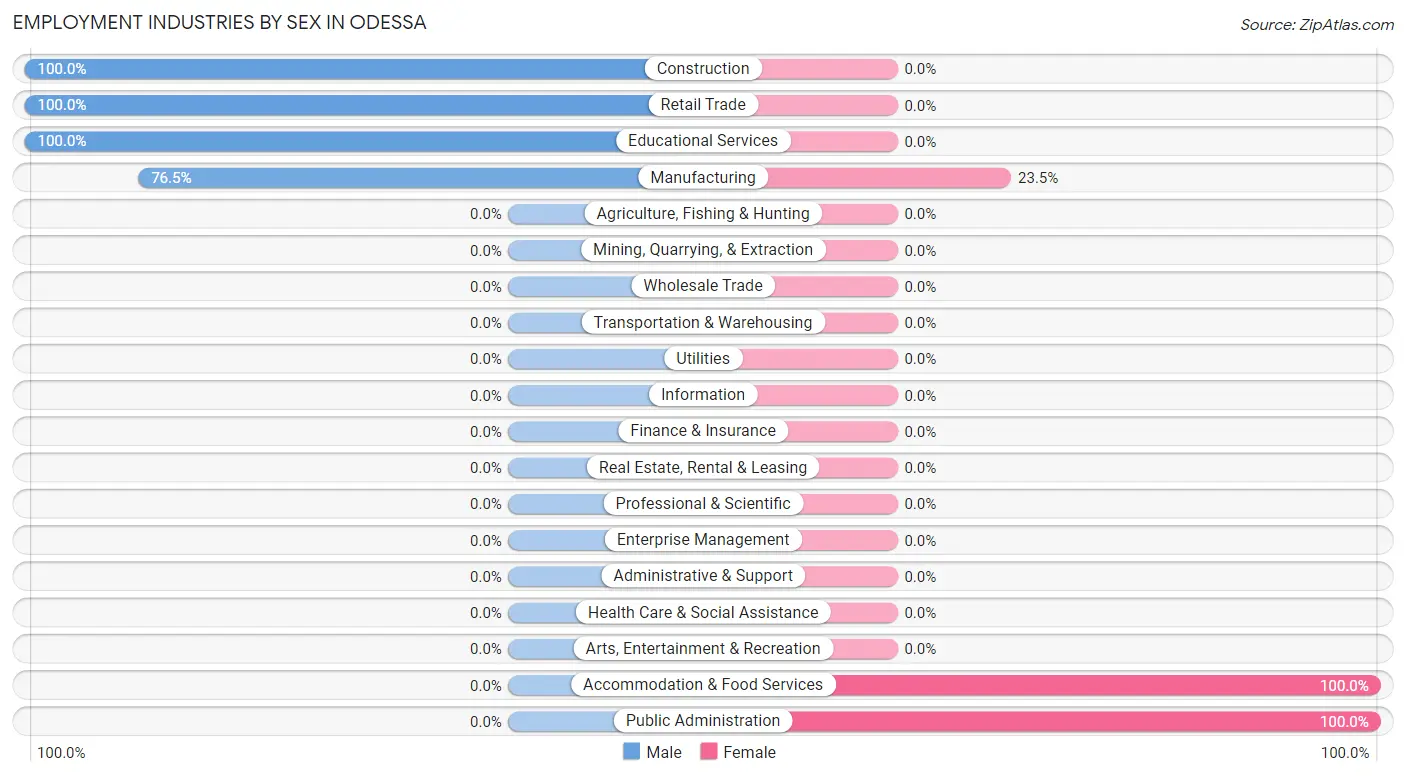
Employment Industries by Sex in Odessa
The Odessa industries that see more men than women are Construction (100.0%), Retail Trade (100.0%), and Educational Services (100.0%), whereas the industries that tend to have a higher number of women are Accommodation & Food Services (100.0%), Public Administration (100.0%), and Manufacturing (23.5%).
| Industry | Male | Female |
| Agriculture, Fishing & Hunting | 0 (0.0%) | 0 (0.0%) |
| Mining, Quarrying, & Extraction | 0 (0.0%) | 0 (0.0%) |
| Construction | 8 (100.0%) | 0 (0.0%) |
| Manufacturing | 13 (76.5%) | 4 (23.5%) |
| Wholesale Trade | 0 (0.0%) | 0 (0.0%) |
| Retail Trade | 7 (100.0%) | 0 (0.0%) |
| Transportation & Warehousing | 0 (0.0%) | 0 (0.0%) |
| Utilities | 0 (0.0%) | 0 (0.0%) |
| Information | 0 (0.0%) | 0 (0.0%) |
| Finance & Insurance | 0 (0.0%) | 0 (0.0%) |
| Real Estate, Rental & Leasing | 0 (0.0%) | 0 (0.0%) |
| Professional & Scientific | 0 (0.0%) | 0 (0.0%) |
| Enterprise Management | 0 (0.0%) | 0 (0.0%) |
| Administrative & Support | 0 (0.0%) | 0 (0.0%) |
| Educational Services | 2 (100.0%) | 0 (0.0%) |
| Health Care & Social Assistance | 0 (0.0%) | 0 (0.0%) |
| Arts, Entertainment & Recreation | 0 (0.0%) | 0 (0.0%) |
| Accommodation & Food Services | 0 (0.0%) | 8 (100.0%) |
| Public Administration | 0 (0.0%) | 8 (100.0%) |
| Total | 30 (60.0%) | 20 (40.0%) |
Education in Odessa
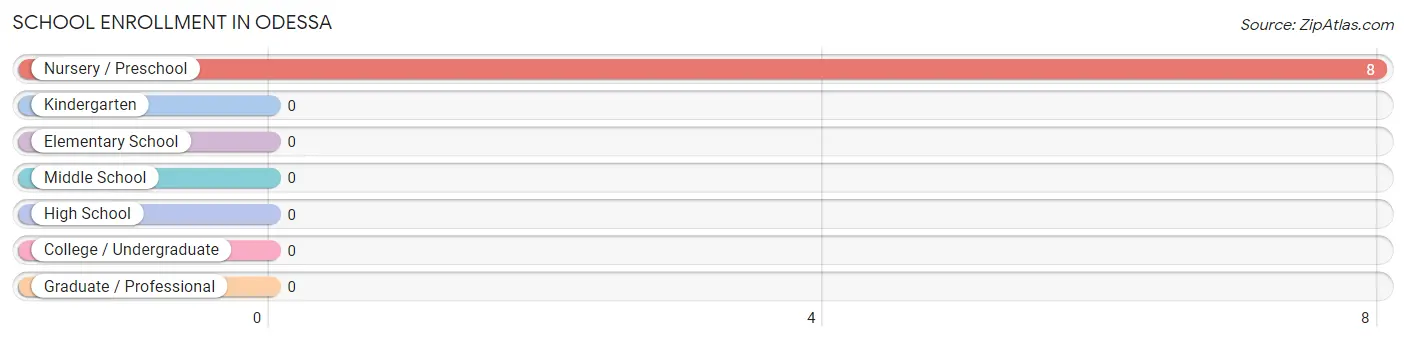
School Enrollment in Odessa
| School Level | # Students | % Students |
| Nursery / Preschool | 8 | 100.0% |
| Kindergarten | 0 | 0.0% |
| Elementary School | 0 | 0.0% |
| Middle School | 0 | 0.0% |
| High School | 0 | 0.0% |
| College / Undergraduate | 0 | 0.0% |
| Graduate / Professional | 0 | 0.0% |
| Total | 8 | 100.0% |
School Enrollment by Age by Funding Source in Odessa
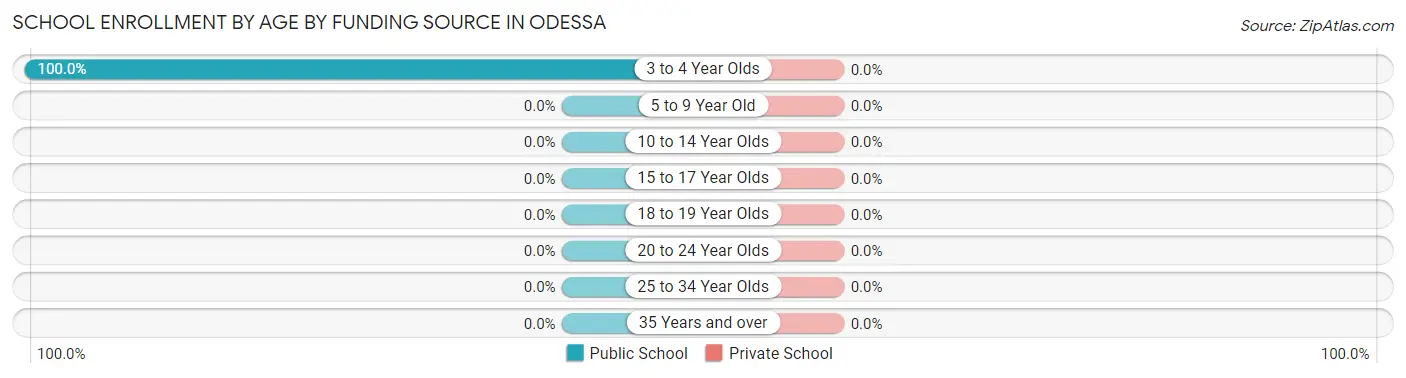
| Age Bracket | Public School | Private School |
| 3 to 4 Year Olds | 8 (100.0%) | 0 (0.0%) |
| 5 to 9 Year Old | 0 (0.0%) | 0 (0.0%) |
| 10 to 14 Year Olds | 0 (0.0%) | 0 (0.0%) |
| 15 to 17 Year Olds | 0 (0.0%) | 0 (0.0%) |
| 18 to 19 Year Olds | 0 (0.0%) | 0 (0.0%) |
| 20 to 24 Year Olds | 0 (0.0%) | 0 (0.0%) |
| 25 to 34 Year Olds | 0 (0.0%) | 0 (0.0%) |
| 35 Years and over | 0 (0.0%) | 0 (0.0%) |
| Total | 8 (100.0%) | 0 (0.0%) |
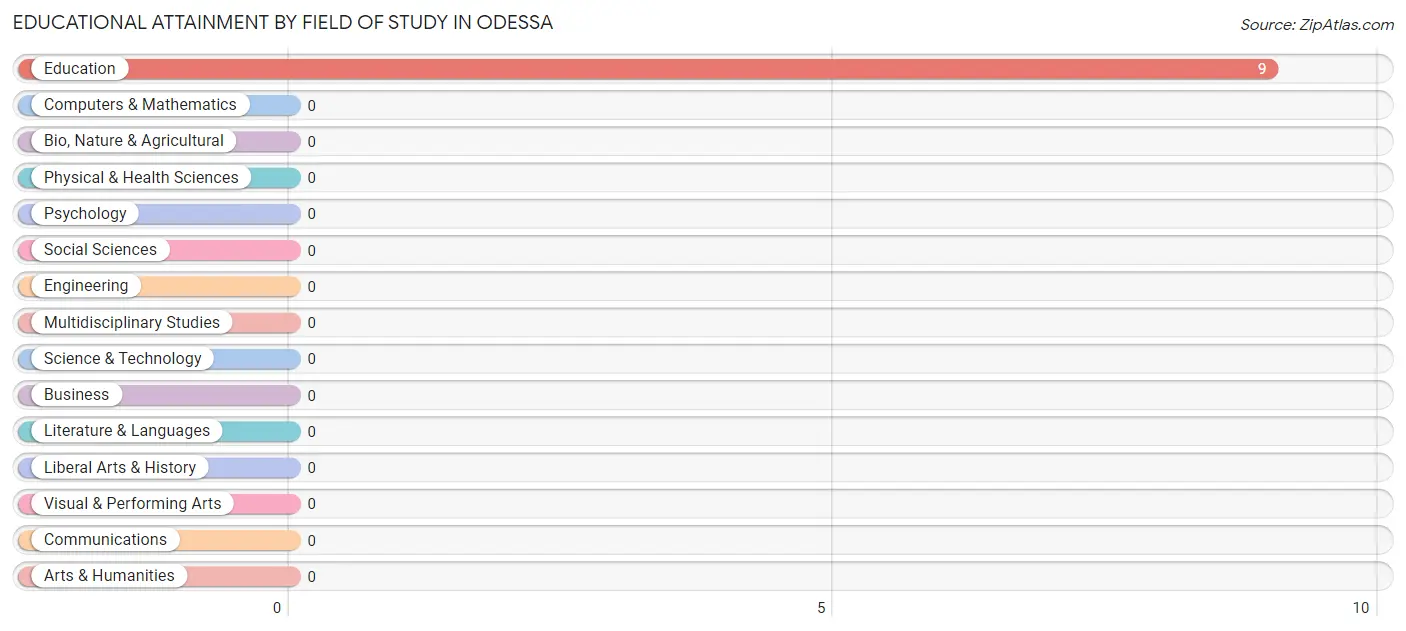
Educational Attainment by Field of Study in Odessa
, and education (9 | 100.0%) are the most common fields of study among 9 individuals in Odessa who have obtained a bachelor's degree or higher.
| Field of Study | # Graduates | % Graduates |
| Computers & Mathematics | 0 | 0.0% |
| Bio, Nature & Agricultural | 0 | 0.0% |
| Physical & Health Sciences | 0 | 0.0% |
| Psychology | 0 | 0.0% |
| Social Sciences | 0 | 0.0% |
| Engineering | 0 | 0.0% |
| Multidisciplinary Studies | 0 | 0.0% |
| Science & Technology | 0 | 0.0% |
| Business | 0 | 0.0% |
| Education | 9 | 100.0% |
| Literature & Languages | 0 | 0.0% |
| Liberal Arts & History | 0 | 0.0% |
| Visual & Performing Arts | 0 | 0.0% |
| Communications | 0 | 0.0% |
| Arts & Humanities | 0 | 0.0% |
| Total | 9 | 100.0% |
Transportation & Commute in Odessa
Vehicle Availability by Sex in Odessa
The most prevalent vehicle ownership categories in Odessa are males with 2 vehicles (14, accounting for 46.7%) and females with 2 vehicles (12, making up 70.0%).
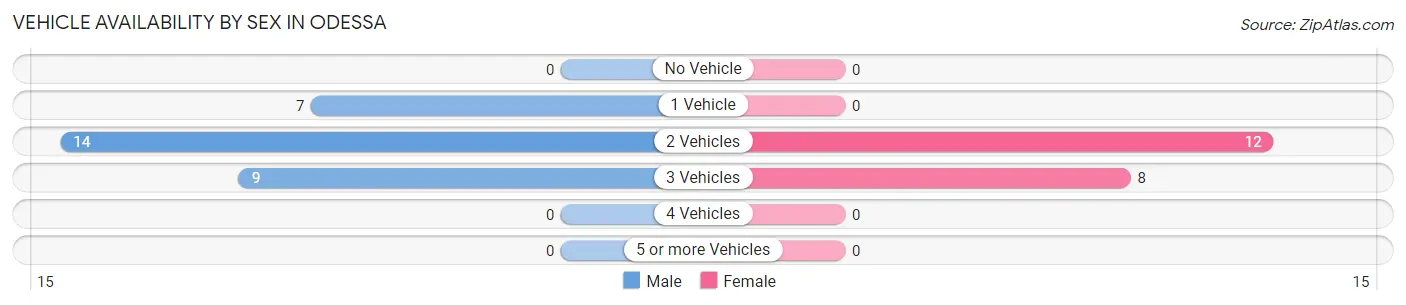
| Vehicles Available | Male | Female |
| No Vehicle | 0 (0.0%) | 0 (0.0%) |
| 1 Vehicle | 7 (23.3%) | 0 (0.0%) |
| 2 Vehicles | 14 (46.7%) | 12 (60.0%) |
| 3 Vehicles | 9 (30.0%) | 8 (40.0%) |
| 4 Vehicles | 0 (0.0%) | 0 (0.0%) |
| 5 or more Vehicles | 0 (0.0%) | 0 (0.0%) |
| Total | 30 (100.0%) | 20 (100.0%) |
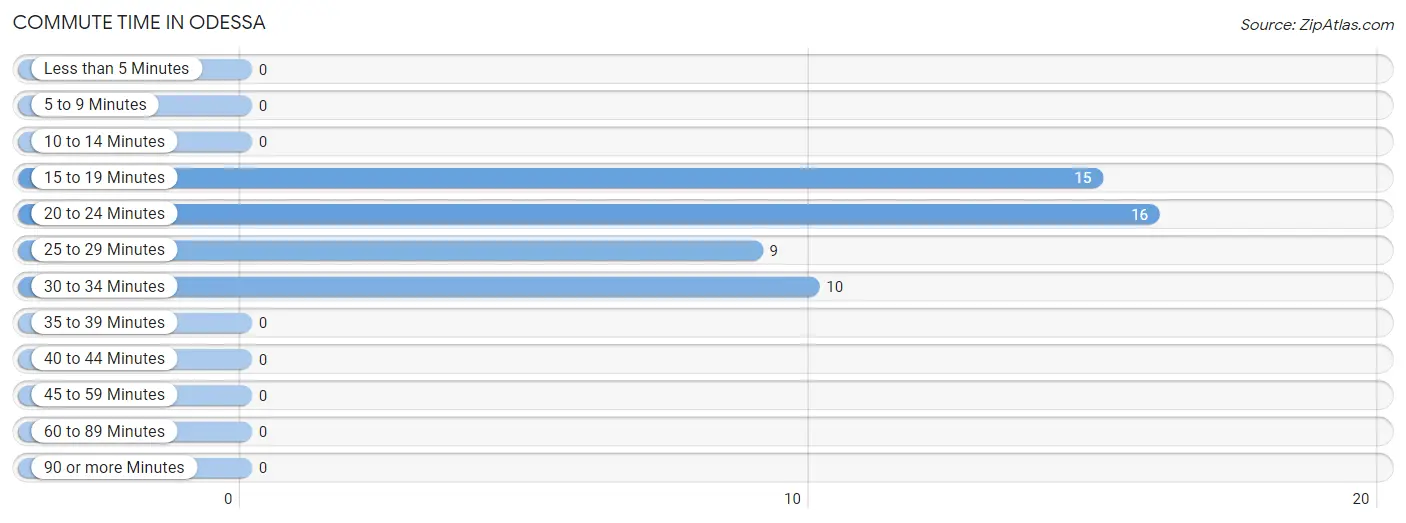
Commute Time in Odessa
The most frequently occuring commute durations in Odessa are 20 to 24 minutes (16 commuters, 32.0%), 15 to 19 minutes (15 commuters, 30.0%), and 30 to 34 minutes (10 commuters, 20.0%).
| Commute Time | # Commuters | % Commuters |
| Less than 5 Minutes | 0 | 0.0% |
| 5 to 9 Minutes | 0 | 0.0% |
| 10 to 14 Minutes | 0 | 0.0% |
| 15 to 19 Minutes | 15 | 30.0% |
| 20 to 24 Minutes | 16 | 32.0% |
| 25 to 29 Minutes | 9 | 18.0% |
| 30 to 34 Minutes | 10 | 20.0% |
| 35 to 39 Minutes | 0 | 0.0% |
| 40 to 44 Minutes | 0 | 0.0% |
| 45 to 59 Minutes | 0 | 0.0% |
| 60 to 89 Minutes | 0 | 0.0% |
| 90 or more Minutes | 0 | 0.0% |
Commute Time by Sex in Odessa
The most common commute times in Odessa are 25 to 29 minutes (9 commuters, 30.0%) for males and 15 to 19 minutes (8 commuters, 40.0%) for females.
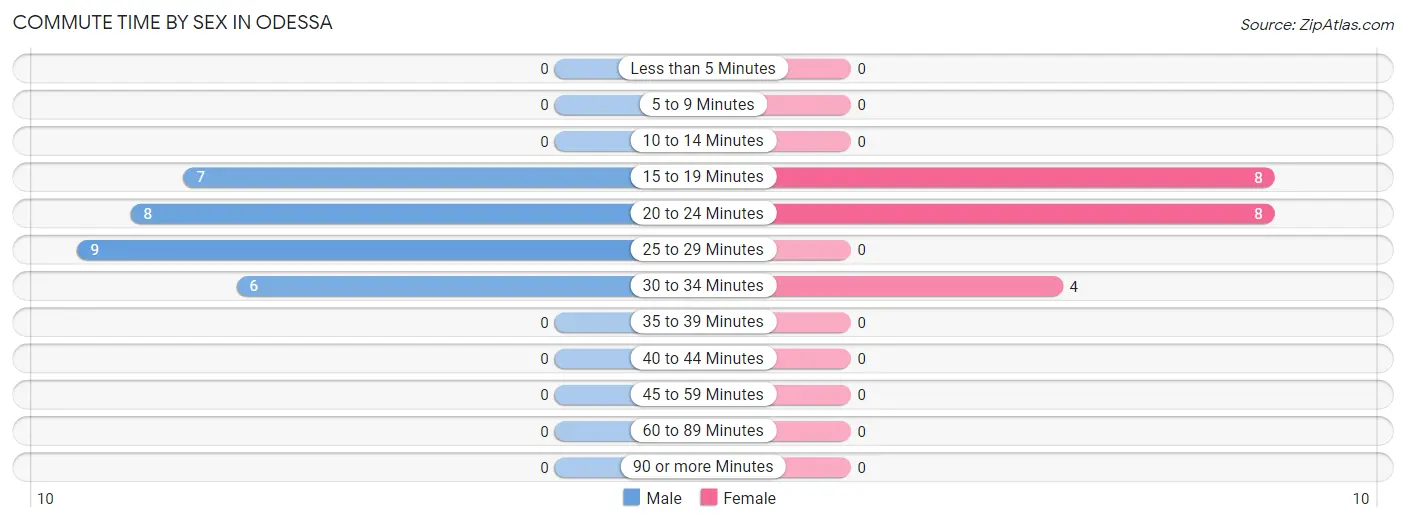
| Commute Time | Male | Female |
| Less than 5 Minutes | 0 (0.0%) | 0 (0.0%) |
| 5 to 9 Minutes | 0 (0.0%) | 0 (0.0%) |
| 10 to 14 Minutes | 0 (0.0%) | 0 (0.0%) |
| 15 to 19 Minutes | 7 (23.3%) | 8 (40.0%) |
| 20 to 24 Minutes | 8 (26.7%) | 8 (40.0%) |
| 25 to 29 Minutes | 9 (30.0%) | 0 (0.0%) |
| 30 to 34 Minutes | 6 (20.0%) | 4 (20.0%) |
| 35 to 39 Minutes | 0 (0.0%) | 0 (0.0%) |
| 40 to 44 Minutes | 0 (0.0%) | 0 (0.0%) |
| 45 to 59 Minutes | 0 (0.0%) | 0 (0.0%) |
| 60 to 89 Minutes | 0 (0.0%) | 0 (0.0%) |
| 90 or more Minutes | 0 (0.0%) | 0 (0.0%) |
Time of Departure to Work by Sex in Odessa
The most frequent times of departure to work in Odessa are 6:30 AM to 6:59 AM (16, 53.3%) for males and 4:00 PM to 11:59 PM (12, 60.0%) for females.
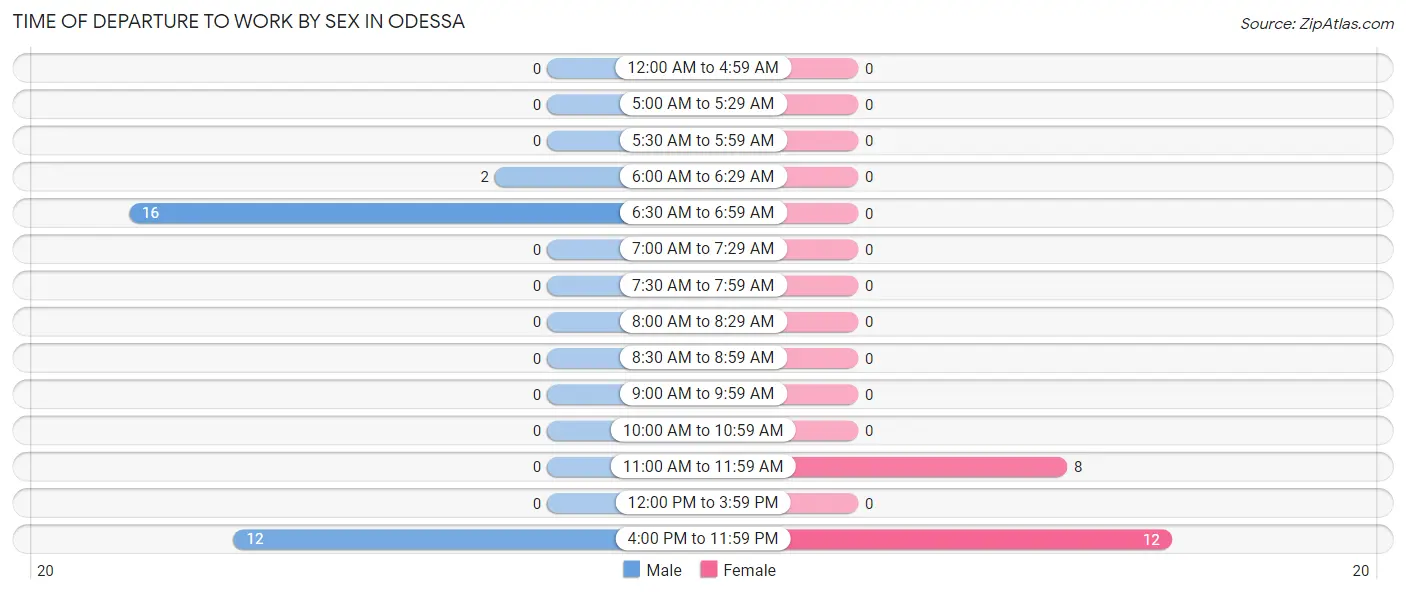
| Time of Departure | Male | Female |
| 12:00 AM to 4:59 AM | 0 (0.0%) | 0 (0.0%) |
| 5:00 AM to 5:29 AM | 0 (0.0%) | 0 (0.0%) |
| 5:30 AM to 5:59 AM | 0 (0.0%) | 0 (0.0%) |
| 6:00 AM to 6:29 AM | 2 (6.7%) | 0 (0.0%) |
| 6:30 AM to 6:59 AM | 16 (53.3%) | 0 (0.0%) |
| 7:00 AM to 7:29 AM | 0 (0.0%) | 0 (0.0%) |
| 7:30 AM to 7:59 AM | 0 (0.0%) | 0 (0.0%) |
| 8:00 AM to 8:29 AM | 0 (0.0%) | 0 (0.0%) |
| 8:30 AM to 8:59 AM | 0 (0.0%) | 0 (0.0%) |
| 9:00 AM to 9:59 AM | 0 (0.0%) | 0 (0.0%) |
| 10:00 AM to 10:59 AM | 0 (0.0%) | 0 (0.0%) |
| 11:00 AM to 11:59 AM | 0 (0.0%) | 8 (40.0%) |
| 12:00 PM to 3:59 PM | 0 (0.0%) | 0 (0.0%) |
| 4:00 PM to 11:59 PM | 12 (40.0%) | 12 (60.0%) |
| Total | 30 (100.0%) | 20 (100.0%) |
Housing Occupancy in Odessa
Occupancy by Ownership in Odessa
Of the total 57 dwellings in Odessa, owner-occupied units account for 49 (86.0%), while renter-occupied units make up 8 (14.0%).
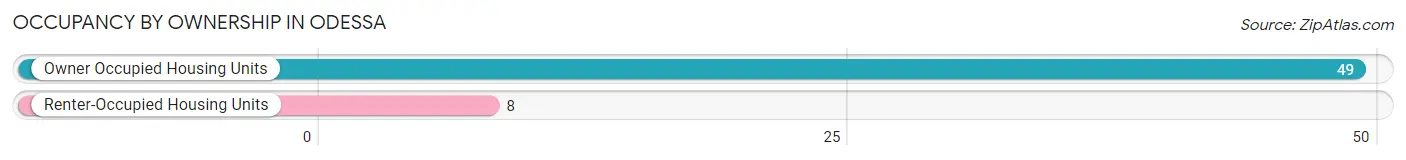
| Occupancy | # Housing Units | % Housing Units |
| Owner Occupied Housing Units | 49 | 86.0% |
| Renter-Occupied Housing Units | 8 | 14.0% |
| Total Occupied Housing Units | 57 | 100.0% |
Occupancy by Household Size in Odessa
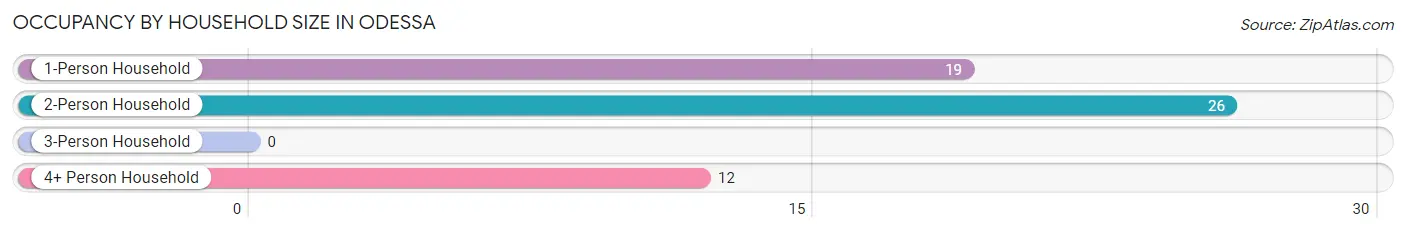
| Household Size | # Housing Units | % Housing Units |
| 1-Person Household | 19 | 33.3% |
| 2-Person Household | 26 | 45.6% |
| 3-Person Household | 0 | 0.0% |
| 4+ Person Household | 12 | 21.0% |
| Total Housing Units | 57 | 100.0% |
Occupancy by Ownership by Household Size in Odessa
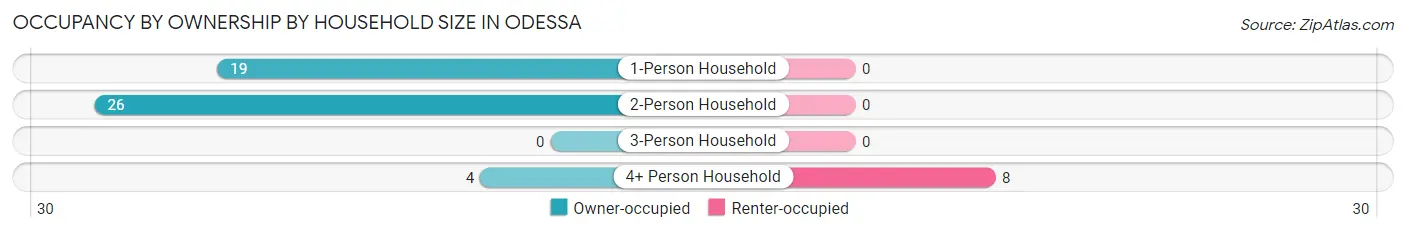
| Household Size | Owner-occupied | Renter-occupied |
| 1-Person Household | 19 (100.0%) | 0 (0.0%) |
| 2-Person Household | 26 (100.0%) | 0 (0.0%) |
| 3-Person Household | 0 (0.0%) | 0 (0.0%) |
| 4+ Person Household | 4 (33.3%) | 8 (66.7%) |
| Total Housing Units | 49 (86.0%) | 8 (14.0%) |
Occupancy by Educational Attainment in Odessa
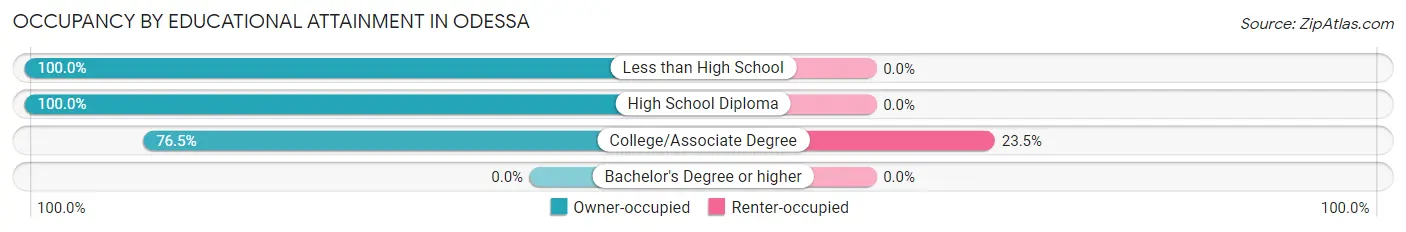
| Household Size | Owner-occupied | Renter-occupied |
| Less than High School | 2 (100.0%) | 0 (0.0%) |
| High School Diploma | 21 (100.0%) | 0 (0.0%) |
| College/Associate Degree | 26 (76.5%) | 8 (23.5%) |
| Bachelor's Degree or higher | 0 (0.0%) | 0 (0.0%) |
Occupancy by Age of Householder in Odessa
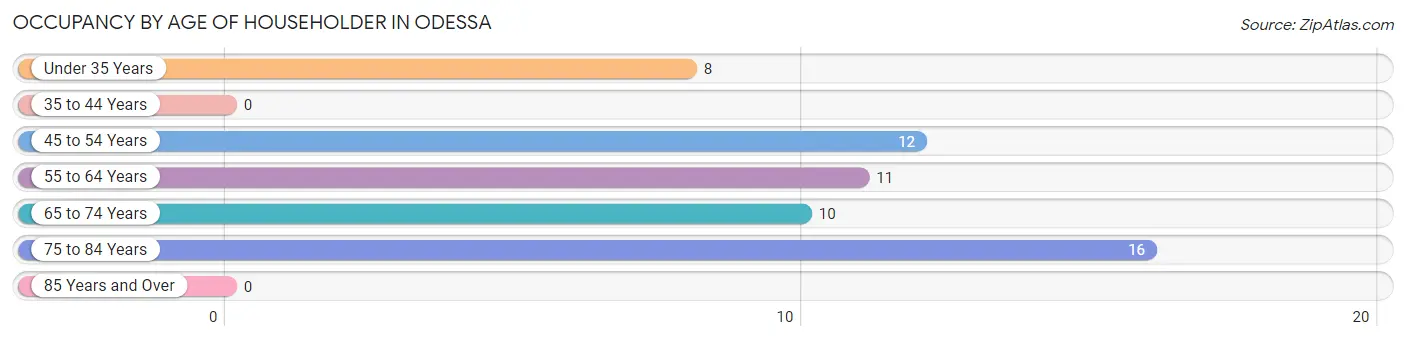
| Age Bracket | # Households | % Households |
| Under 35 Years | 8 | 14.0% |
| 35 to 44 Years | 0 | 0.0% |
| 45 to 54 Years | 12 | 21.0% |
| 55 to 64 Years | 11 | 19.3% |
| 65 to 74 Years | 10 | 17.5% |
| 75 to 84 Years | 16 | 28.1% |
| 85 Years and Over | 0 | 0.0% |
| Total | 57 | 100.0% |
Housing Finances in Odessa
Median Income by Occupancy in Odessa
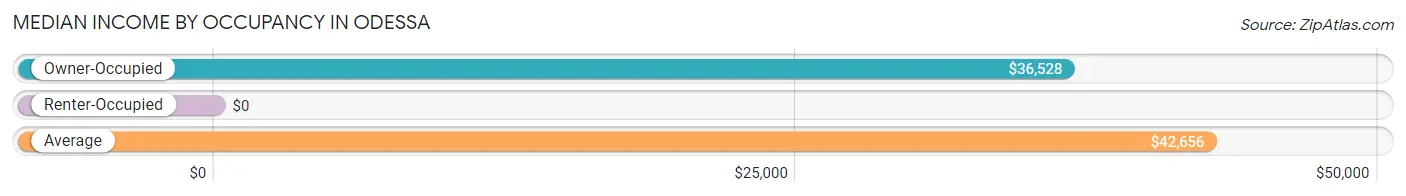
| Occupancy Type | # Households | Median Income |
| Owner-Occupied | 49 (86.0%) | $36,528 |
| Renter-Occupied | 8 (14.0%) | $0 |
| Average | 57 (100.0%) | $42,656 |
Occupancy by Householder Income Bracket in Odessa
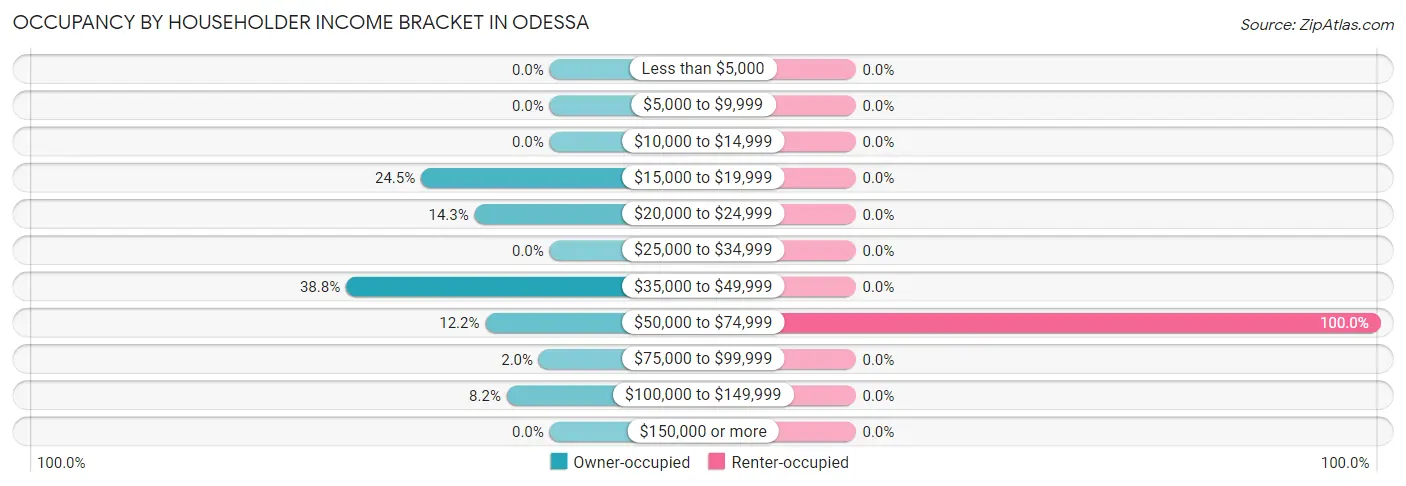
| Income Bracket | Owner-occupied | Renter-occupied |
| Less than $5,000 | 0 (0.0%) | 0 (0.0%) |
| $5,000 to $9,999 | 0 (0.0%) | 0 (0.0%) |
| $10,000 to $14,999 | 0 (0.0%) | 0 (0.0%) |
| $15,000 to $19,999 | 12 (24.5%) | 0 (0.0%) |
| $20,000 to $24,999 | 7 (14.3%) | 0 (0.0%) |
| $25,000 to $34,999 | 0 (0.0%) | 0 (0.0%) |
| $35,000 to $49,999 | 19 (38.8%) | 0 (0.0%) |
| $50,000 to $74,999 | 6 (12.2%) | 8 (100.0%) |
| $75,000 to $99,999 | 1 (2.0%) | 0 (0.0%) |
| $100,000 to $149,999 | 4 (8.2%) | 0 (0.0%) |
| $150,000 or more | 0 (0.0%) | 0 (0.0%) |
| Total | 49 (100.0%) | 8 (100.0%) |
Monthly Housing Cost Tiers in Odessa
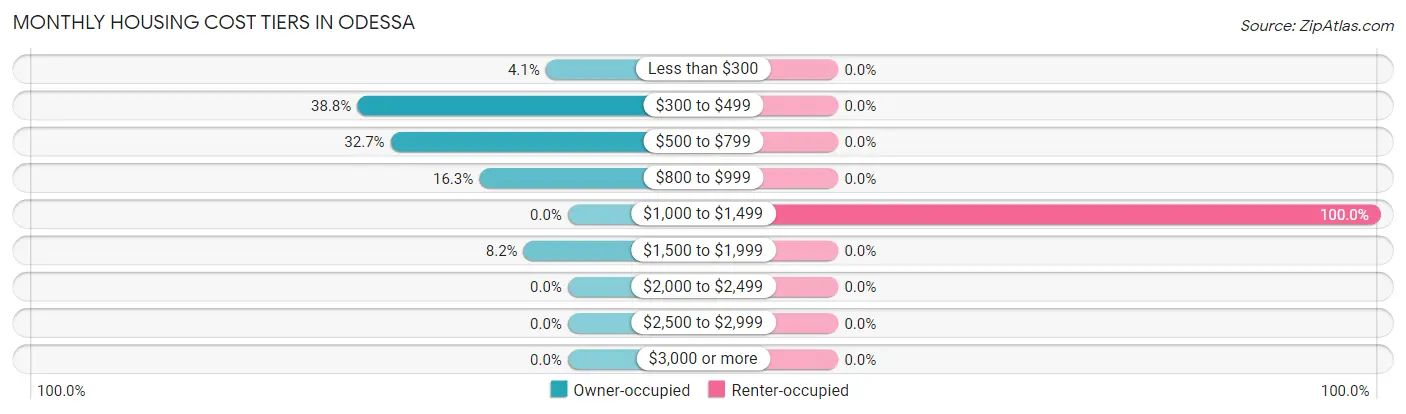
| Monthly Cost | Owner-occupied | Renter-occupied |
| Less than $300 | 2 (4.1%) | 0 (0.0%) |
| $300 to $499 | 19 (38.8%) | 0 (0.0%) |
| $500 to $799 | 16 (32.7%) | 0 (0.0%) |
| $800 to $999 | 8 (16.3%) | 0 (0.0%) |
| $1,000 to $1,499 | 0 (0.0%) | 8 (100.0%) |
| $1,500 to $1,999 | 4 (8.2%) | 0 (0.0%) |
| $2,000 to $2,499 | 0 (0.0%) | 0 (0.0%) |
| $2,500 to $2,999 | 0 (0.0%) | 0 (0.0%) |
| $3,000 or more | 0 (0.0%) | 0 (0.0%) |
| Total | 49 (100.0%) | 8 (100.0%) |
Physical Housing Characteristics in Odessa
Housing Structures in Odessa
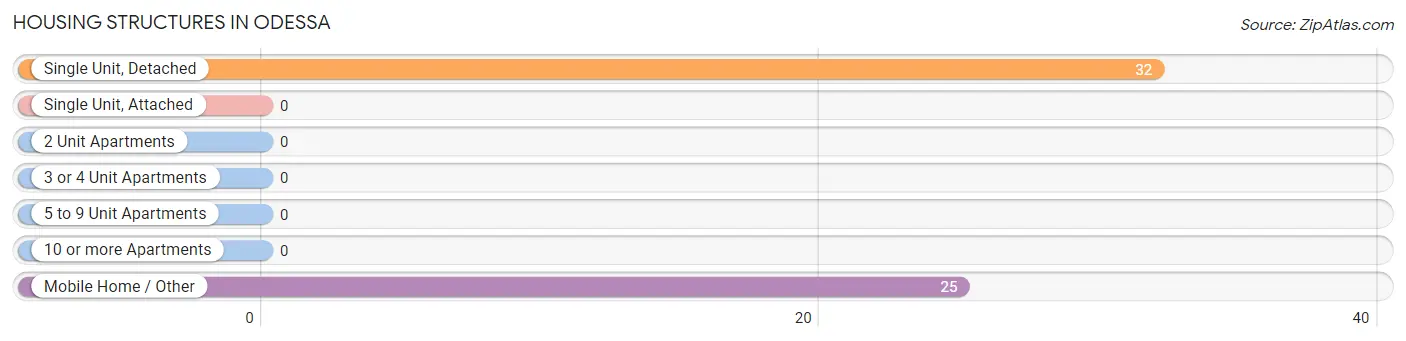
| Structure Type | # Housing Units | % Housing Units |
| Single Unit, Detached | 32 | 56.1% |
| Single Unit, Attached | 0 | 0.0% |
| 2 Unit Apartments | 0 | 0.0% |
| 3 or 4 Unit Apartments | 0 | 0.0% |
| 5 to 9 Unit Apartments | 0 | 0.0% |
| 10 or more Apartments | 0 | 0.0% |
| Mobile Home / Other | 25 | 43.9% |
| Total | 57 | 100.0% |
Housing Structures by Occupancy in Odessa
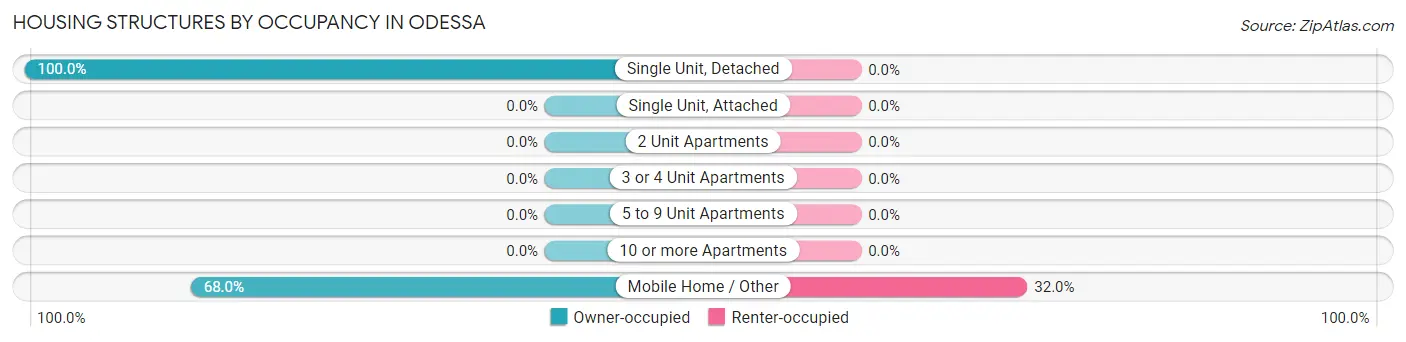
| Structure Type | Owner-occupied | Renter-occupied |
| Single Unit, Detached | 32 (100.0%) | 0 (0.0%) |
| Single Unit, Attached | 0 (0.0%) | 0 (0.0%) |
| 2 Unit Apartments | 0 (0.0%) | 0 (0.0%) |
| 3 or 4 Unit Apartments | 0 (0.0%) | 0 (0.0%) |
| 5 to 9 Unit Apartments | 0 (0.0%) | 0 (0.0%) |
| 10 or more Apartments | 0 (0.0%) | 0 (0.0%) |
| Mobile Home / Other | 17 (68.0%) | 8 (32.0%) |
| Total | 49 (86.0%) | 8 (14.0%) |
Housing Structures by Number of Rooms in Odessa
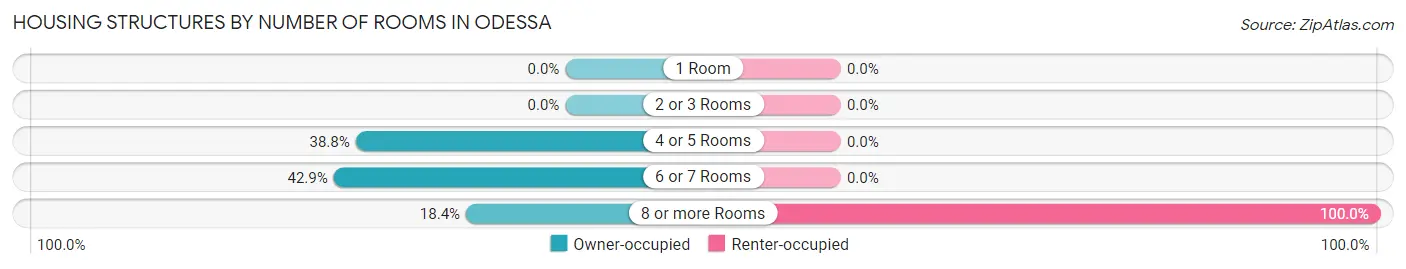
| Number of Rooms | Owner-occupied | Renter-occupied |
| 1 Room | 0 (0.0%) | 0 (0.0%) |
| 2 or 3 Rooms | 0 (0.0%) | 0 (0.0%) |
| 4 or 5 Rooms | 19 (38.8%) | 0 (0.0%) |
| 6 or 7 Rooms | 21 (42.9%) | 0 (0.0%) |
| 8 or more Rooms | 9 (18.4%) | 8 (100.0%) |
| Total | 49 (100.0%) | 8 (100.0%) |
Housing Structure by Heating Type in Odessa
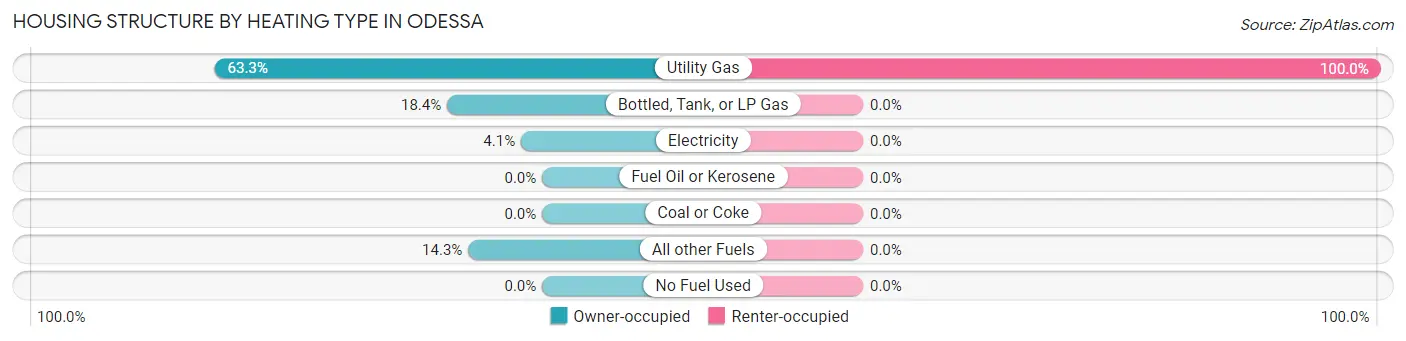
| Heating Type | Owner-occupied | Renter-occupied |
| Utility Gas | 31 (63.3%) | 8 (100.0%) |
| Bottled, Tank, or LP Gas | 9 (18.4%) | 0 (0.0%) |
| Electricity | 2 (4.1%) | 0 (0.0%) |
| Fuel Oil or Kerosene | 0 (0.0%) | 0 (0.0%) |
| Coal or Coke | 0 (0.0%) | 0 (0.0%) |
| All other Fuels | 7 (14.3%) | 0 (0.0%) |
| No Fuel Used | 0 (0.0%) | 0 (0.0%) |
| Total | 49 (100.0%) | 8 (100.0%) |
Household Vehicle Usage in Odessa
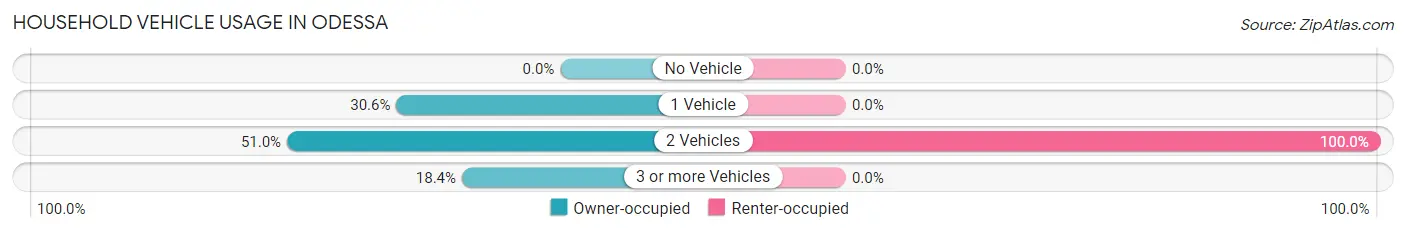
| Vehicles per Household | Owner-occupied | Renter-occupied |
| No Vehicle | 0 (0.0%) | 0 (0.0%) |
| 1 Vehicle | 15 (30.6%) | 0 (0.0%) |
| 2 Vehicles | 25 (51.0%) | 8 (100.0%) |
| 3 or more Vehicles | 9 (18.4%) | 0 (0.0%) |
| Total | 49 (100.0%) | 8 (100.0%) |
Real Estate & Mortgages in Odessa
Real Estate and Mortgage Overview in Odessa
| Characteristic | Without Mortgage | With Mortgage |
| Housing Units | 37 | 12 |
| Median Property Value | $125,700 | $0 |
| Median Household Income | - | - |
| Monthly Housing Costs | - | - |
| Real Estate Taxes | $1,656 | $0 |
Property Value by Mortgage Status in Odessa
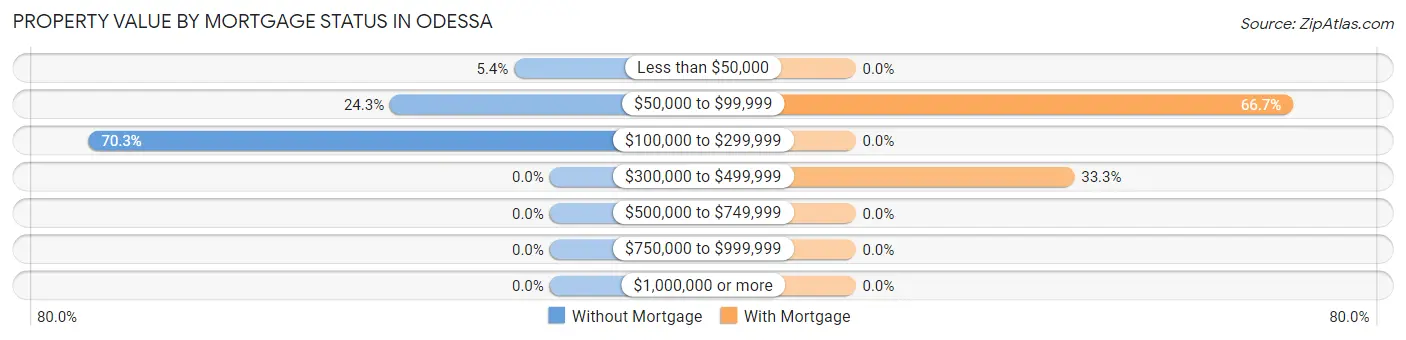
| Property Value | Without Mortgage | With Mortgage |
| Less than $50,000 | 2 (5.4%) | 0 (0.0%) |
| $50,000 to $99,999 | 9 (24.3%) | 8 (66.7%) |
| $100,000 to $299,999 | 26 (70.3%) | 0 (0.0%) |
| $300,000 to $499,999 | 0 (0.0%) | 4 (33.3%) |
| $500,000 to $749,999 | 0 (0.0%) | 0 (0.0%) |
| $750,000 to $999,999 | 0 (0.0%) | 0 (0.0%) |
| $1,000,000 or more | 0 (0.0%) | 0 (0.0%) |
| Total | 37 (100.0%) | 12 (100.0%) |
Household Income by Mortgage Status in Odessa
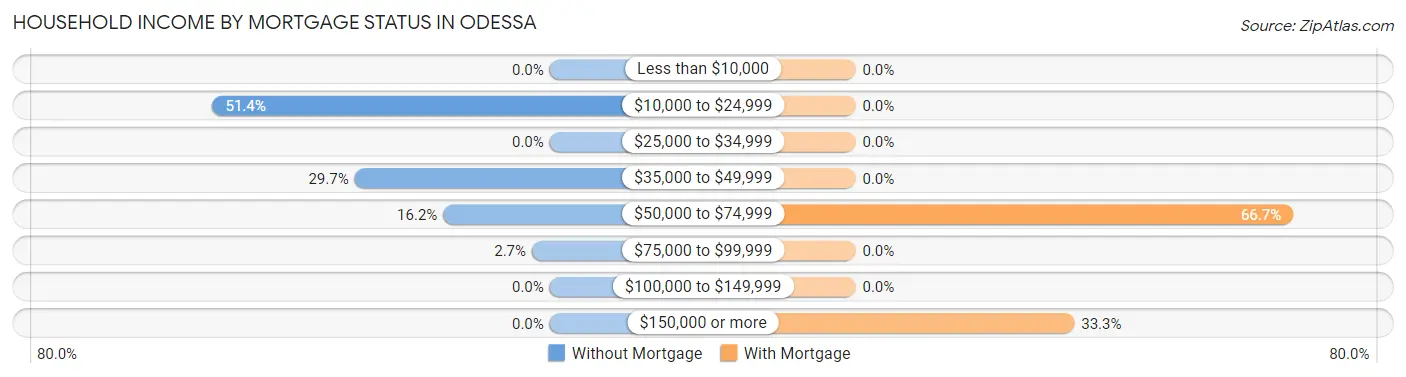
| Household Income | Without Mortgage | With Mortgage |
| Less than $10,000 | 0 (0.0%) | 0 (0.0%) |
| $10,000 to $24,999 | 19 (51.3%) | 0 (0.0%) |
| $25,000 to $34,999 | 0 (0.0%) | 0 (0.0%) |
| $35,000 to $49,999 | 11 (29.7%) | 0 (0.0%) |
| $50,000 to $74,999 | 6 (16.2%) | 8 (66.7%) |
| $75,000 to $99,999 | 1 (2.7%) | 0 (0.0%) |
| $100,000 to $149,999 | 0 (0.0%) | 0 (0.0%) |
| $150,000 or more | 0 (0.0%) | 4 (33.3%) |
| Total | 37 (100.0%) | 12 (100.0%) |
Property Value to Household Income Ratio in Odessa
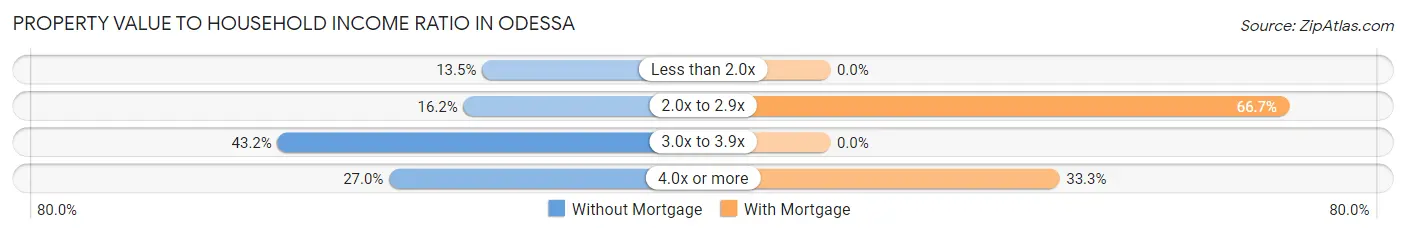
| Value-to-Income Ratio | Without Mortgage | With Mortgage |
| Less than 2.0x | 5 (13.5%) | 0 (0.0%) |
| 2.0x to 2.9x | 6 (16.2%) | 8 (66.7%) |
| 3.0x to 3.9x | 16 (43.2%) | 0 (0.0%) |
| 4.0x or more | 10 (27.0%) | 4 (33.3%) |
| Total | 37 (100.0%) | 12 (100.0%) |
Real Estate Taxes by Mortgage Status in Odessa
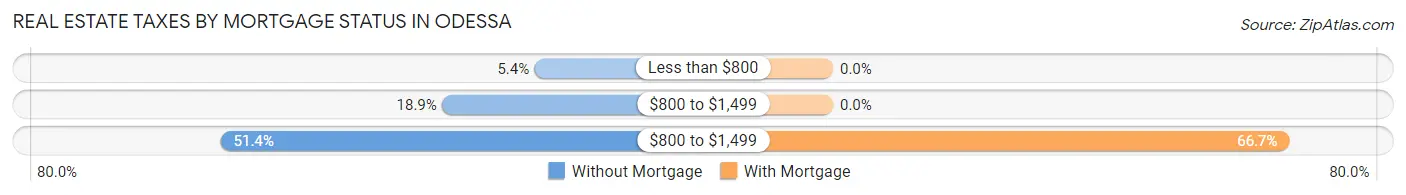
| Property Taxes | Without Mortgage | With Mortgage |
| Less than $800 | 2 (5.4%) | 0 (0.0%) |
| $800 to $1,499 | 7 (18.9%) | 0 (0.0%) |
| $800 to $1,499 | 19 (51.3%) | 8 (66.7%) |
| Total | 37 (100.0%) | 12 (100.0%) |
Health & Disability in Odessa
Health Insurance Coverage by Age in Odessa
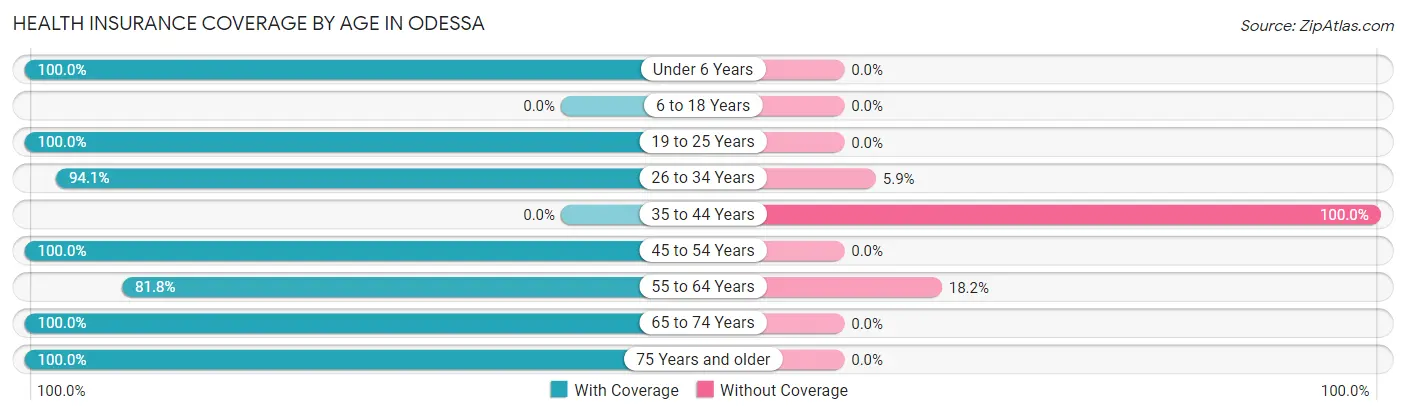
| Age Bracket | With Coverage | Without Coverage |
| Under 6 Years | 17 (100.0%) | 0 (0.0%) |
| 6 to 18 Years | 0 (0.0%) | 0 (0.0%) |
| 19 to 25 Years | 10 (100.0%) | 0 (0.0%) |
| 26 to 34 Years | 16 (94.1%) | 1 (5.9%) |
| 35 to 44 Years | 0 (0.0%) | 9 (100.0%) |
| 45 to 54 Years | 16 (100.0%) | 0 (0.0%) |
| 55 to 64 Years | 9 (81.8%) | 2 (18.2%) |
| 65 to 74 Years | 33 (100.0%) | 0 (0.0%) |
| 75 Years and older | 16 (100.0%) | 0 (0.0%) |
| Total | 117 (90.7%) | 12 (9.3%) |
Health Insurance Coverage by Citizenship Status in Odessa
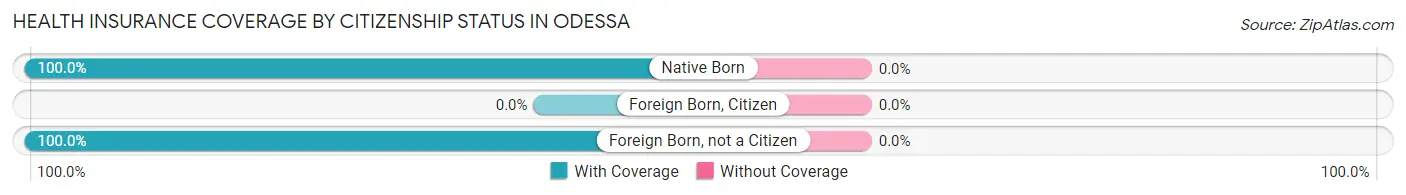
| Citizenship Status | With Coverage | Without Coverage |
| Native Born | 17 (100.0%) | 0 (0.0%) |
| Foreign Born, Citizen | 0 (0.0%) | 0 (0.0%) |
| Foreign Born, not a Citizen | 10 (100.0%) | 0 (0.0%) |
Health Insurance Coverage by Household Income in Odessa
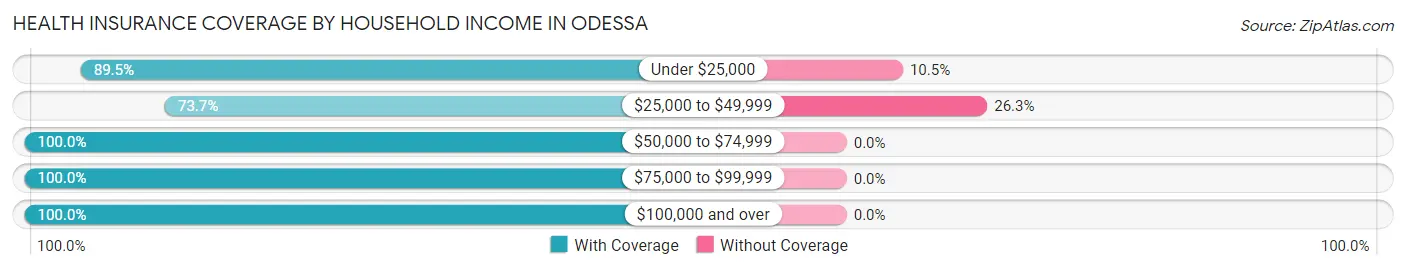
| Household Income | With Coverage | Without Coverage |
| Under $25,000 | 17 (89.5%) | 2 (10.5%) |
| $25,000 to $49,999 | 28 (73.7%) | 10 (26.3%) |
| $50,000 to $74,999 | 47 (100.0%) | 0 (0.0%) |
| $75,000 to $99,999 | 2 (100.0%) | 0 (0.0%) |
| $100,000 and over | 23 (100.0%) | 0 (0.0%) |
Public vs Private Health Insurance Coverage by Age in Odessa
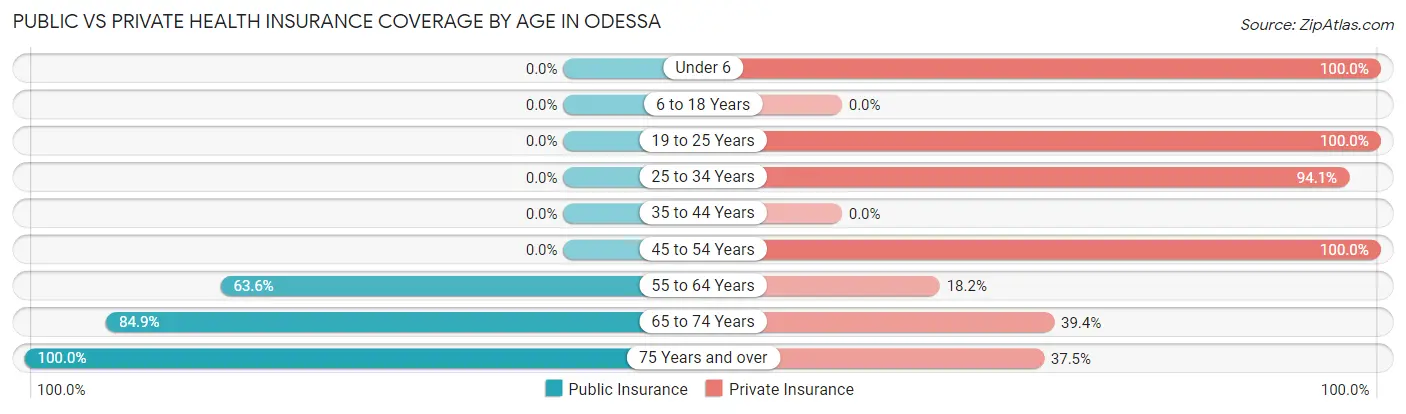
| Age Bracket | Public Insurance | Private Insurance |
| Under 6 | 0 (0.0%) | 17 (100.0%) |
| 6 to 18 Years | 0 (0.0%) | 0 (0.0%) |
| 19 to 25 Years | 0 (0.0%) | 10 (100.0%) |
| 25 to 34 Years | 0 (0.0%) | 16 (94.1%) |
| 35 to 44 Years | 0 (0.0%) | 0 (0.0%) |
| 45 to 54 Years | 0 (0.0%) | 16 (100.0%) |
| 55 to 64 Years | 7 (63.6%) | 2 (18.2%) |
| 65 to 74 Years | 28 (84.9%) | 13 (39.4%) |
| 75 Years and over | 16 (100.0%) | 6 (37.5%) |
| Total | 51 (39.5%) | 80 (62.0%) |
Disability Status by Sex by Age in Odessa
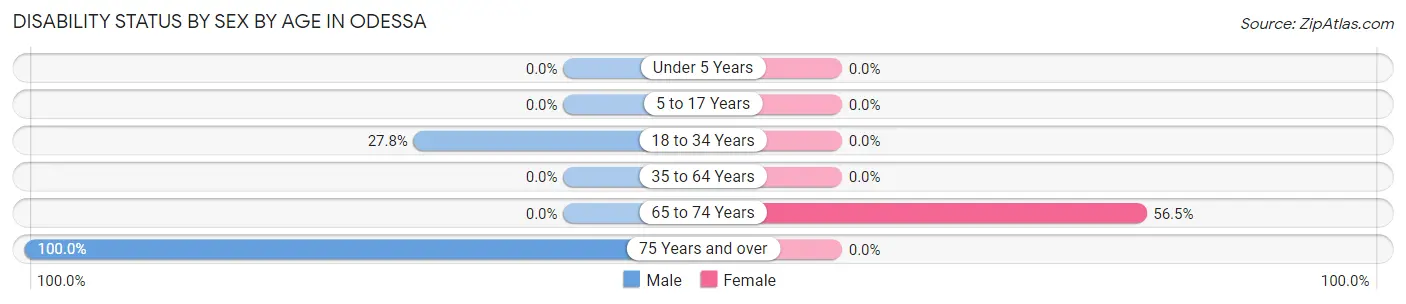
| Age Bracket | Male | Female |
| Under 5 Years | 0 (0.0%) | 0 (0.0%) |
| 5 to 17 Years | 0 (0.0%) | 0 (0.0%) |
| 18 to 34 Years | 5 (27.8%) | 0 (0.0%) |
| 35 to 64 Years | 0 (0.0%) | 0 (0.0%) |
| 65 to 74 Years | 0 (0.0%) | 13 (56.5%) |
| 75 Years and over | 16 (100.0%) | 0 (0.0%) |
Disability Class by Sex by Age in Odessa
Disability Class: Hearing Difficulty
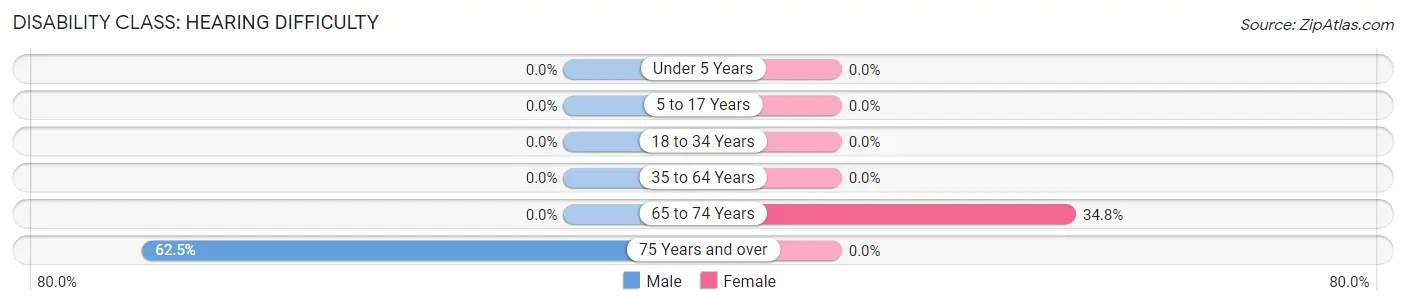
| Age Bracket | Male | Female |
| Under 5 Years | 0 (0.0%) | 0 (0.0%) |
| 5 to 17 Years | 0 (0.0%) | 0 (0.0%) |
| 18 to 34 Years | 0 (0.0%) | 0 (0.0%) |
| 35 to 64 Years | 0 (0.0%) | 0 (0.0%) |
| 65 to 74 Years | 0 (0.0%) | 8 (34.8%) |
| 75 Years and over | 10 (62.5%) | 0 (0.0%) |
Disability Class: Vision Difficulty
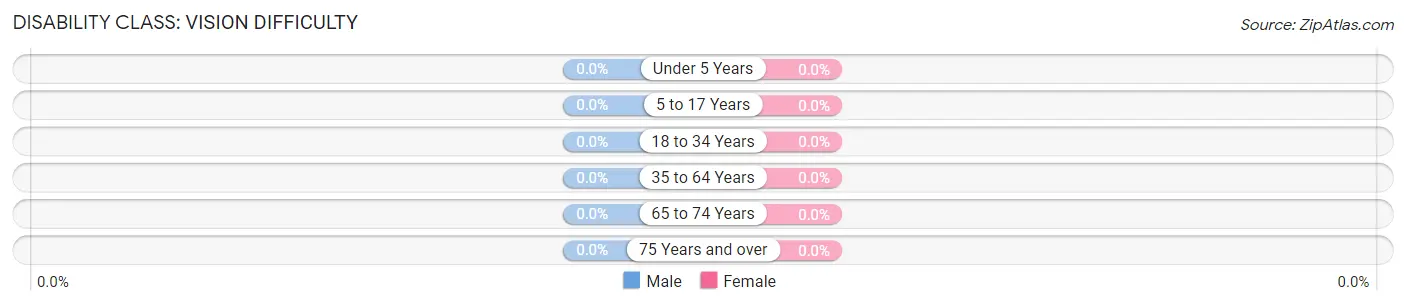
| Age Bracket | Male | Female |
| Under 5 Years | 0 (0.0%) | 0 (0.0%) |
| 5 to 17 Years | 0 (0.0%) | 0 (0.0%) |
| 18 to 34 Years | 0 (0.0%) | 0 (0.0%) |
| 35 to 64 Years | 0 (0.0%) | 0 (0.0%) |
| 65 to 74 Years | 0 (0.0%) | 0 (0.0%) |
| 75 Years and over | 0 (0.0%) | 0 (0.0%) |
Disability Class: Cognitive Difficulty
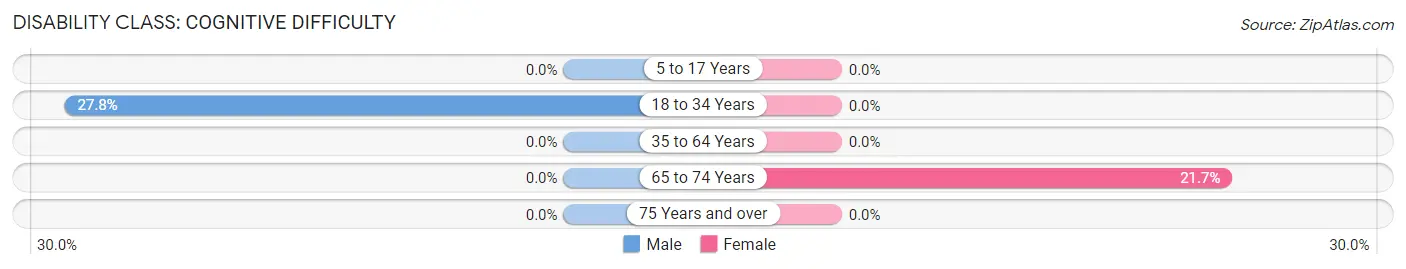
| Age Bracket | Male | Female |
| 5 to 17 Years | 0 (0.0%) | 0 (0.0%) |
| 18 to 34 Years | 5 (27.8%) | 0 (0.0%) |
| 35 to 64 Years | 0 (0.0%) | 0 (0.0%) |
| 65 to 74 Years | 0 (0.0%) | 5 (21.7%) |
| 75 Years and over | 0 (0.0%) | 0 (0.0%) |
Disability Class: Ambulatory Difficulty
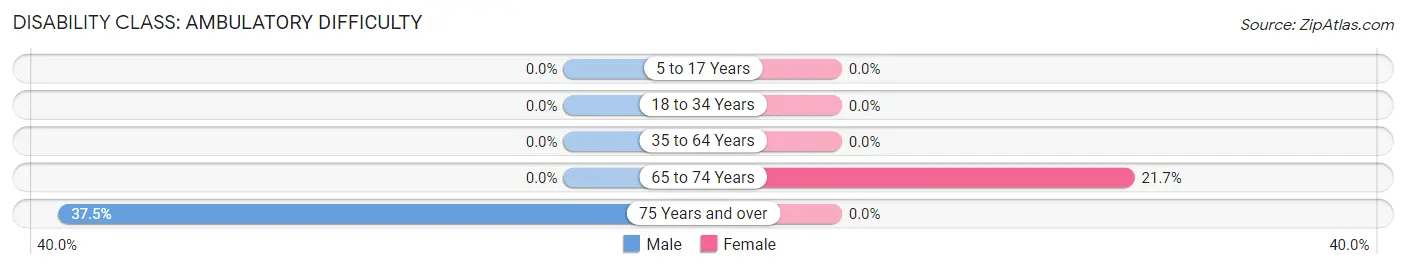
| Age Bracket | Male | Female |
| 5 to 17 Years | 0 (0.0%) | 0 (0.0%) |
| 18 to 34 Years | 0 (0.0%) | 0 (0.0%) |
| 35 to 64 Years | 0 (0.0%) | 0 (0.0%) |
| 65 to 74 Years | 0 (0.0%) | 5 (21.7%) |
| 75 Years and over | 6 (37.5%) | 0 (0.0%) |
Disability Class: Self-Care Difficulty
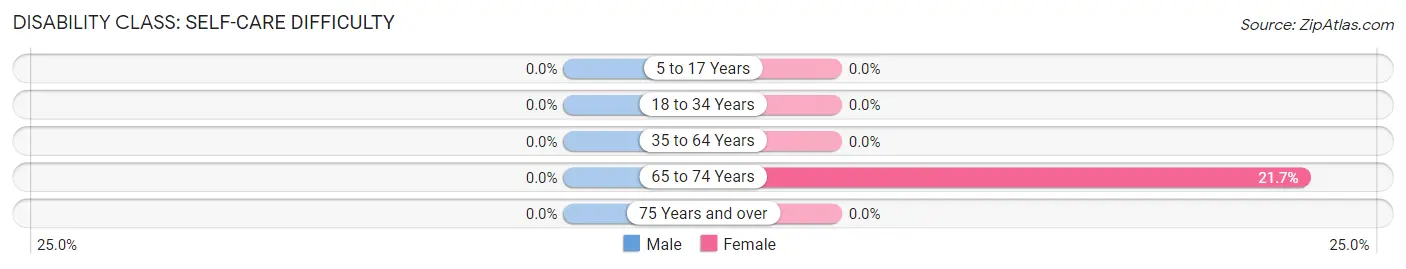
| Age Bracket | Male | Female |
| 5 to 17 Years | 0 (0.0%) | 0 (0.0%) |
| 18 to 34 Years | 0 (0.0%) | 0 (0.0%) |
| 35 to 64 Years | 0 (0.0%) | 0 (0.0%) |
| 65 to 74 Years | 0 (0.0%) | 5 (21.7%) |
| 75 Years and over | 0 (0.0%) | 0 (0.0%) |
Technology Access in Odessa
Computing Device Access in Odessa
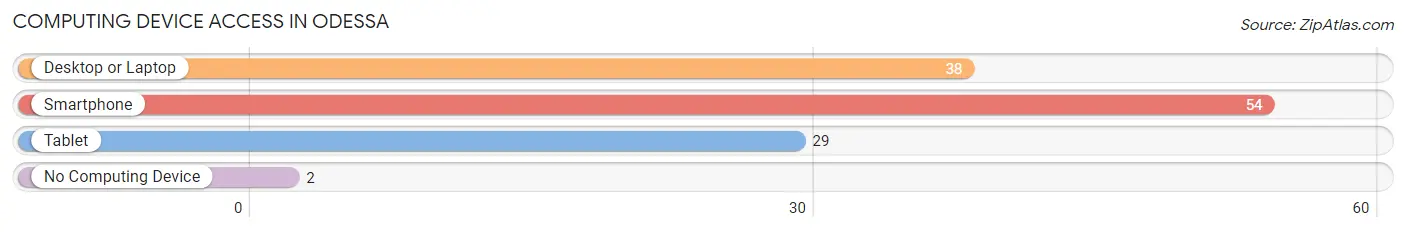
| Device Type | # Households | % Households |
| Desktop or Laptop | 38 | 66.7% |
| Smartphone | 54 | 94.7% |
| Tablet | 29 | 50.9% |
| No Computing Device | 2 | 3.5% |
| Total | 57 | 100.0% |
Internet Access in Odessa
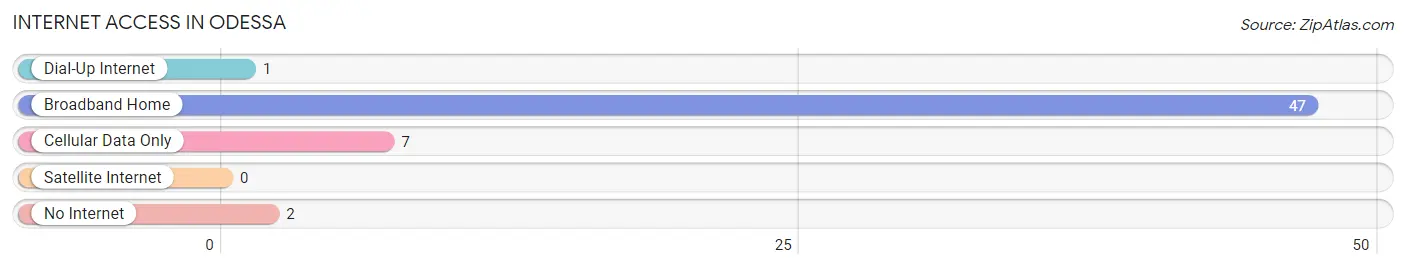
| Internet Type | # Households | % Households |
| Dial-Up Internet | 1 | 1.8% |
| Broadband Home | 47 | 82.5% |
| Cellular Data Only | 7 | 12.3% |
| Satellite Internet | 0 | 0.0% |
| No Internet | 2 | 3.5% |
| Total | 57 | 100.0% |
Odessa Summary
Odessa is a small town located in the state of Nebraska, in the United States. It is situated in the southeastern corner of the state, in the county of Saunders. The town has a population of approximately 1,000 people, and is located about 30 miles from the state capital of Lincoln.
History
Odessa was founded in 1871 by a group of German immigrants who had come to the area in search of a better life. The town was named after the city of Odessa in Ukraine, which was the birthplace of one of the original settlers. The town was originally a farming community, and the settlers quickly established a thriving agricultural economy.
In the early 1900s, the town began to grow and develop. The railroad was extended to the town, and a number of businesses were established. The town also became a popular destination for tourists, as it was located near several lakes and rivers.
Geography
Odessa is located in the southeastern corner of Nebraska, in the county of Saunders. The town is situated on the banks of the Platte River, and is surrounded by rolling hills and farmland. The town is located about 30 miles from the state capital of Lincoln.
The climate in Odessa is generally mild, with hot summers and cold winters. The average temperature in the summer is around 80 degrees Fahrenheit, and the average temperature in the winter is around 20 degrees Fahrenheit.
Economy
The economy of Odessa is largely based on agriculture. The town is home to several farms, and the surrounding area is known for its production of corn, soybeans, and other crops. The town also has a number of small businesses, including restaurants, stores, and other services.
Demographics
As of the 2010 census, the population of Odessa was 1,000 people. The racial makeup of the town was 97.2% White, 0.7% African American, 0.3% Native American, 0.2% Asian, and 1.6% from other races. The median household income in the town was $45,000, and the median age was 37 years.
Conclusion
Odessa is a small town located in the southeastern corner of Nebraska. It was founded in 1871 by a group of German immigrants, and has since grown into a thriving agricultural community. The town has a population of approximately 1,000 people, and is known for its mild climate and its production of corn, soybeans, and other crops. The town also has a number of small businesses, and the median household income is $45,000.
Common Questions
What is Per Capita Income in Odessa?
Per Capita income in Odessa is $19,968.
What is the Median Family Income in Odessa?
Median Family Income in Odessa is $52,083.
What is the Median Household income in Odessa?
Median Household Income in Odessa is $42,656.
What is Income or Wage Gap in Odessa?
Income or Wage Gap in Odessa is 37.6%.
Women in Odessa earn 62.4 cents for every dollar earned by a man.
What is Inequality or Gini Index in Odessa?
Inequality or Gini Index in Odessa is 0.31.
What is the Total Population of Odessa?
Total Population of Odessa is 129.
What is the Total Male Population of Odessa?
Total Male Population of Odessa is 68.
What is the Total Female Population of Odessa?
Total Female Population of Odessa is 61.
What is the Ratio of Males per 100 Females in Odessa?
There are 111.48 Males per 100 Females in Odessa.
What is the Ratio of Females per 100 Males in Odessa?
There are 89.71 Females per 100 Males in Odessa.
What is the Median Population Age in Odessa?
Median Population Age in Odessa is 53.4 Years.
What is the Average Family Size in Odessa
Average Family Size in Odessa is 3.2 People.
What is the Average Household Size in Odessa
Average Household Size in Odessa is 2.3 People.
How Large is the Labor Force in Odessa?
There are 50 People in the Labor Forcein in Odessa.
What is the Percentage of People in the Labor Force in Odessa?
44.6% of People are in the Labor Force in Odessa.