Woodland Hills, NE Map & Demographics
Woodland Hills Map
Woodland Hills Overview
$49,401
PER CAPITA INCOME
$170,139
AVG FAMILY INCOME
$170,139
AVG HOUSEHOLD INCOME
72.6%
WAGE / INCOME GAP [ % ]
27.4¢/ $1
WAGE / INCOME GAP [ $ ]
0.32
INEQUALITY / GINI INDEX
300
TOTAL POPULATION
180
MALE POPULATION
120
FEMALE POPULATION
150.00
MALES / 100 FEMALES
66.67
FEMALES / 100 MALES
30.0
MEDIAN AGE
3.5
AVG FAMILY SIZE
3.5
AVG HOUSEHOLD SIZE
159
LABOR FORCE [ PEOPLE ]
66.0%
PERCENT IN LABOR FORCE
Income in Woodland Hills
Income Overview in Woodland Hills
Per Capita Income in Woodland Hills is $49,401, while median incomes of families and households are $170,139 and $170,139 respectively.
| Characteristic | Number | Measure |
| Per Capita Income | 300 | $49,401 |
| Median Family Income | 85 | $170,139 |
| Mean Family Income | 85 | $163,741 |
| Median Household Income | 85 | $170,139 |
| Mean Household Income | 85 | $163,741 |
| Income Deficit | 85 | $0 |
| Wage / Income Gap (%) | 300 | 72.64% |
| Wage / Income Gap ($) | 300 | 27.36¢ per $1 |
| Gini / Inequality Index | 300 | 0.32 |
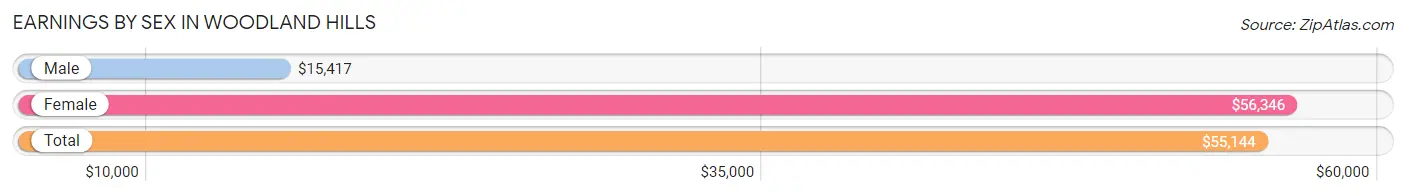
Earnings by Sex in Woodland Hills
Average Earnings in Woodland Hills are $55,144, $15,417 for men and $56,346 for women, a difference of 72.6%.
| Sex | Number | Average Earnings |
| Male | 115 (62.2%) | $15,417 |
| Female | 70 (37.8%) | $56,346 |
| Total | 185 (100.0%) | $55,144 |
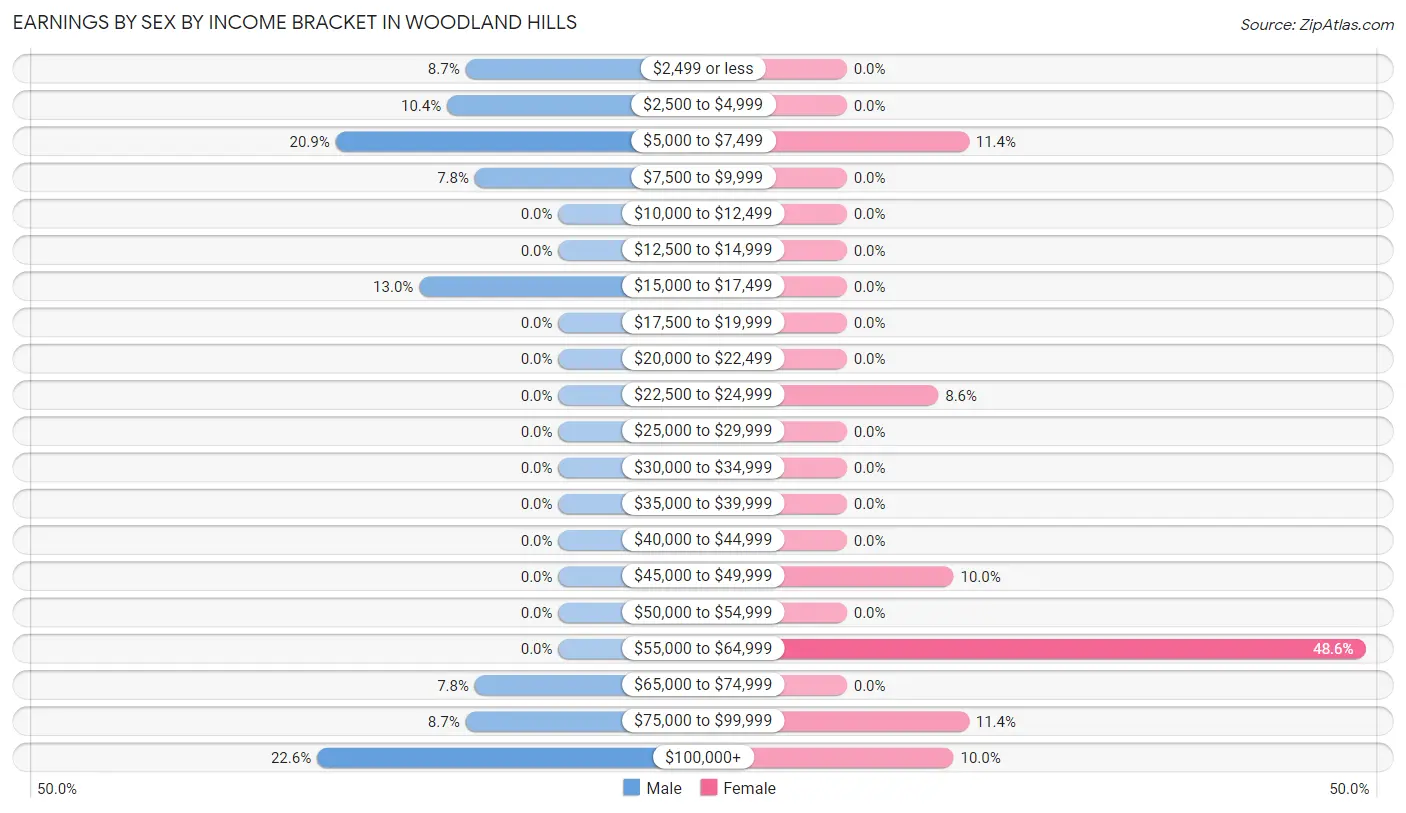
Earnings by Sex by Income Bracket in Woodland Hills
The most common earnings brackets in Woodland Hills are $100,000+ for men (26 | 22.6%) and $55,000 to $64,999 for women (34 | 48.6%).
| Income | Male | Female |
| $2,499 or less | 10 (8.7%) | 0 (0.0%) |
| $2,500 to $4,999 | 12 (10.4%) | 0 (0.0%) |
| $5,000 to $7,499 | 24 (20.9%) | 8 (11.4%) |
| $7,500 to $9,999 | 9 (7.8%) | 0 (0.0%) |
| $10,000 to $12,499 | 0 (0.0%) | 0 (0.0%) |
| $12,500 to $14,999 | 0 (0.0%) | 0 (0.0%) |
| $15,000 to $17,499 | 15 (13.0%) | 0 (0.0%) |
| $17,500 to $19,999 | 0 (0.0%) | 0 (0.0%) |
| $20,000 to $22,499 | 0 (0.0%) | 0 (0.0%) |
| $22,500 to $24,999 | 0 (0.0%) | 6 (8.6%) |
| $25,000 to $29,999 | 0 (0.0%) | 0 (0.0%) |
| $30,000 to $34,999 | 0 (0.0%) | 0 (0.0%) |
| $35,000 to $39,999 | 0 (0.0%) | 0 (0.0%) |
| $40,000 to $44,999 | 0 (0.0%) | 0 (0.0%) |
| $45,000 to $49,999 | 0 (0.0%) | 7 (10.0%) |
| $50,000 to $54,999 | 0 (0.0%) | 0 (0.0%) |
| $55,000 to $64,999 | 0 (0.0%) | 34 (48.6%) |
| $65,000 to $74,999 | 9 (7.8%) | 0 (0.0%) |
| $75,000 to $99,999 | 10 (8.7%) | 8 (11.4%) |
| $100,000+ | 26 (22.6%) | 7 (10.0%) |
| Total | 115 (100.0%) | 70 (100.0%) |
Earnings by Sex by Educational Attainment in Woodland Hills
| Educational Attainment | Male Income | Female Income |
| Less than High School | - | - |
| High School Diploma | - | - |
| College or Associate's Degree | - | - |
| Bachelor's Degree | - | - |
| Graduate Degree | - | - |
| Total | $87,750 | $57,813 |
Family Income in Woodland Hills
Family Income Brackets in Woodland Hills
According to the Woodland Hills family income data, there are 26 families falling into the $200,000+ income range, which is the most common income bracket and makes up 30.6% of all families.
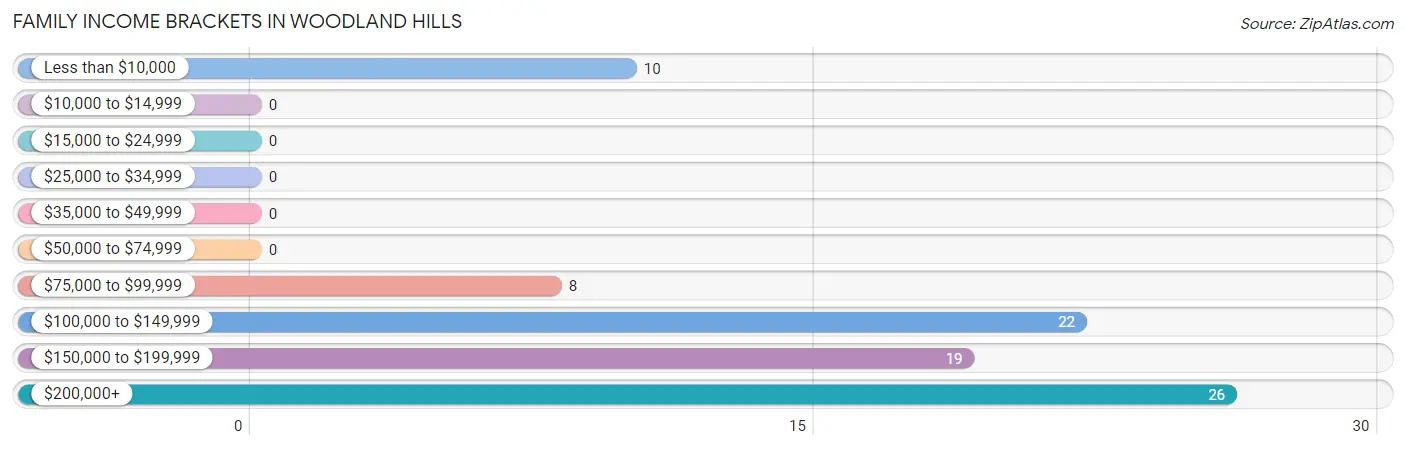
| Income Bracket | # Families | % Families |
| Less than $10,000 | 10 | 11.8% |
| $10,000 to $14,999 | 0 | 0.0% |
| $15,000 to $24,999 | 0 | 0.0% |
| $25,000 to $34,999 | 0 | 0.0% |
| $35,000 to $49,999 | 0 | 0.0% |
| $50,000 to $74,999 | 0 | 0.0% |
| $75,000 to $99,999 | 8 | 9.4% |
| $100,000 to $149,999 | 22 | 25.9% |
| $150,000 to $199,999 | 19 | 22.4% |
| $200,000+ | 26 | 30.6% |
Family Income by Famaliy Size in Woodland Hills
2-person families (53 | 62.4%) account for the highest median family income in Woodland Hills with $138,036 per family, while 2-person families (53 | 62.4%) have the highest median income of $69,018 per family member.
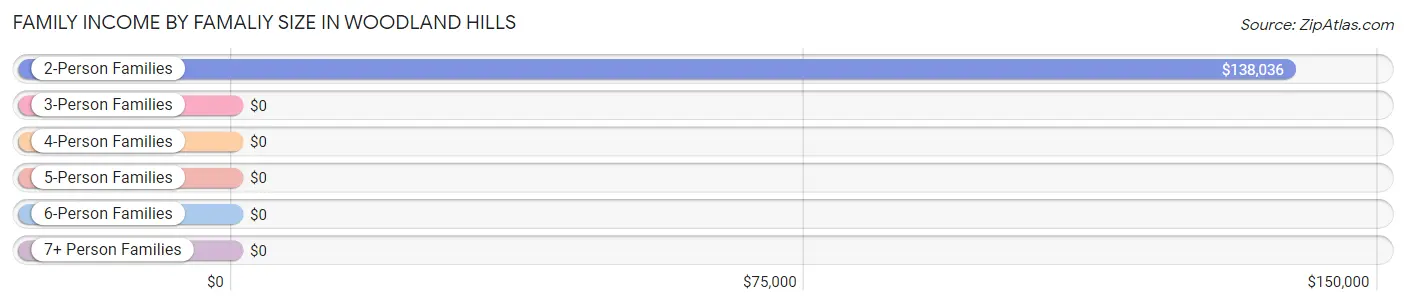
| Income Bracket | # Families | Median Income |
| 2-Person Families | 53 (62.4%) | $138,036 |
| 3-Person Families | 15 (17.6%) | $0 |
| 4-Person Families | 0 (0.0%) | $0 |
| 5-Person Families | 17 (20.0%) | $0 |
| 6-Person Families | 0 (0.0%) | $0 |
| 7+ Person Families | 0 (0.0%) | $0 |
| Total | 85 (100.0%) | $170,139 |
Family Income by Number of Earners in Woodland Hills
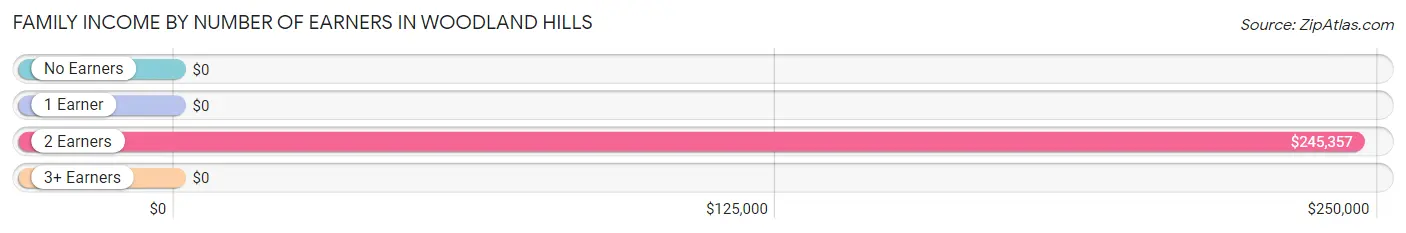
| Number of Earners | # Families | Median Income |
| No Earners | 9 (10.6%) | $0 |
| 1 Earner | 28 (32.9%) | $0 |
| 2 Earners | 32 (37.7%) | $245,357 |
| 3+ Earners | 16 (18.8%) | $0 |
| Total | 85 (100.0%) | $170,139 |
Household Income in Woodland Hills
Household Income Brackets in Woodland Hills
With 26 households falling in the category, the $200,000+ income range is the most frequent in Woodland Hills, accounting for 30.6% of all households.
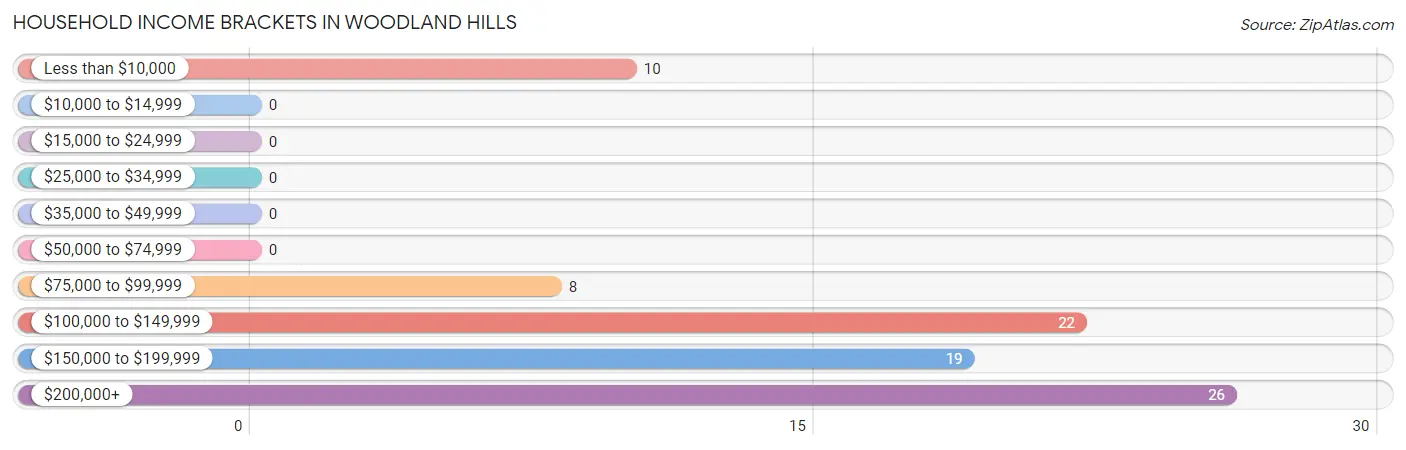
| Income Bracket | # Households | % Households |
| Less than $10,000 | 10 | 11.8% |
| $10,000 to $14,999 | 0 | 0.0% |
| $15,000 to $24,999 | 0 | 0.0% |
| $25,000 to $34,999 | 0 | 0.0% |
| $35,000 to $49,999 | 0 | 0.0% |
| $50,000 to $74,999 | 0 | 0.0% |
| $75,000 to $99,999 | 8 | 9.4% |
| $100,000 to $149,999 | 22 | 25.9% |
| $150,000 to $199,999 | 19 | 22.4% |
| $200,000+ | 26 | 30.6% |
Household Income by Householder Age in Woodland Hills
The median household income in Woodland Hills is $170,139, with the highest median household income of $118,958 found in the 65+ years age bracket for the primary householder. A total of 41 households (48.2%) fall into this category.
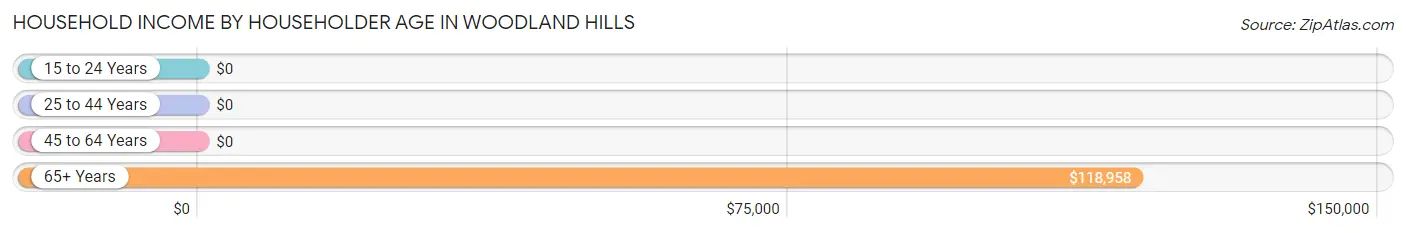
| Income Bracket | # Households | Median Income |
| 15 to 24 Years | 0 (0.0%) | $0 |
| 25 to 44 Years | 9 (10.6%) | $0 |
| 45 to 64 Years | 35 (41.2%) | $0 |
| 65+ Years | 41 (48.2%) | $118,958 |
| Total | 85 (100.0%) | $170,139 |
Poverty in Woodland Hills
Income Below Poverty by Sex and Age in Woodland Hills
With 5.6% poverty level for males and 6.7% for females among the residents of Woodland Hills, 45 to 54 year old males and 16 and 17 year old females are the most vulnerable to poverty, with 10 males (58.8%) and 8 females (100.0%) in their respective age groups living below the poverty level.
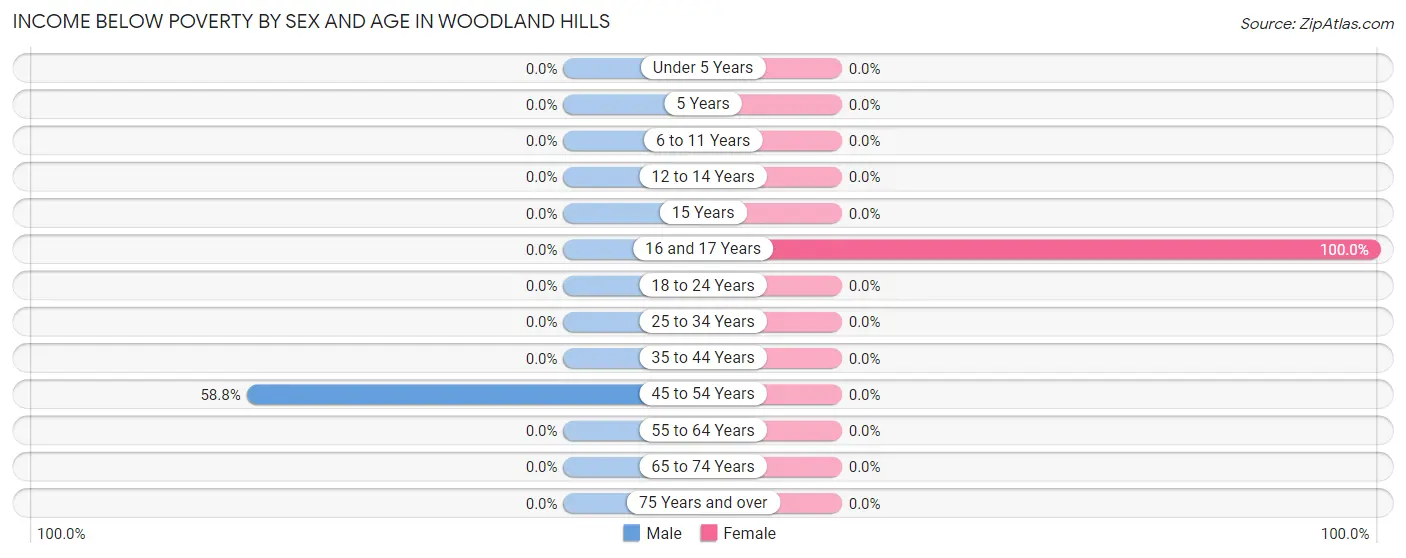
| Age Bracket | Male | Female |
| Under 5 Years | 0 (0.0%) | 0 (0.0%) |
| 5 Years | 0 (0.0%) | 0 (0.0%) |
| 6 to 11 Years | 0 (0.0%) | 0 (0.0%) |
| 12 to 14 Years | 0 (0.0%) | 0 (0.0%) |
| 15 Years | 0 (0.0%) | 0 (0.0%) |
| 16 and 17 Years | 0 (0.0%) | 8 (100.0%) |
| 18 to 24 Years | 0 (0.0%) | 0 (0.0%) |
| 25 to 34 Years | 0 (0.0%) | 0 (0.0%) |
| 35 to 44 Years | 0 (0.0%) | 0 (0.0%) |
| 45 to 54 Years | 10 (58.8%) | 0 (0.0%) |
| 55 to 64 Years | 0 (0.0%) | 0 (0.0%) |
| 65 to 74 Years | 0 (0.0%) | 0 (0.0%) |
| 75 Years and over | 0 (0.0%) | 0 (0.0%) |
| Total | 10 (5.6%) | 8 (6.7%) |
Income Above Poverty by Sex and Age in Woodland Hills
According to the poverty statistics in Woodland Hills, males aged under 5 years and females aged 6 to 11 years are the age groups that are most secure financially, with 100.0% of males and 100.0% of females in these age groups living above the poverty line.
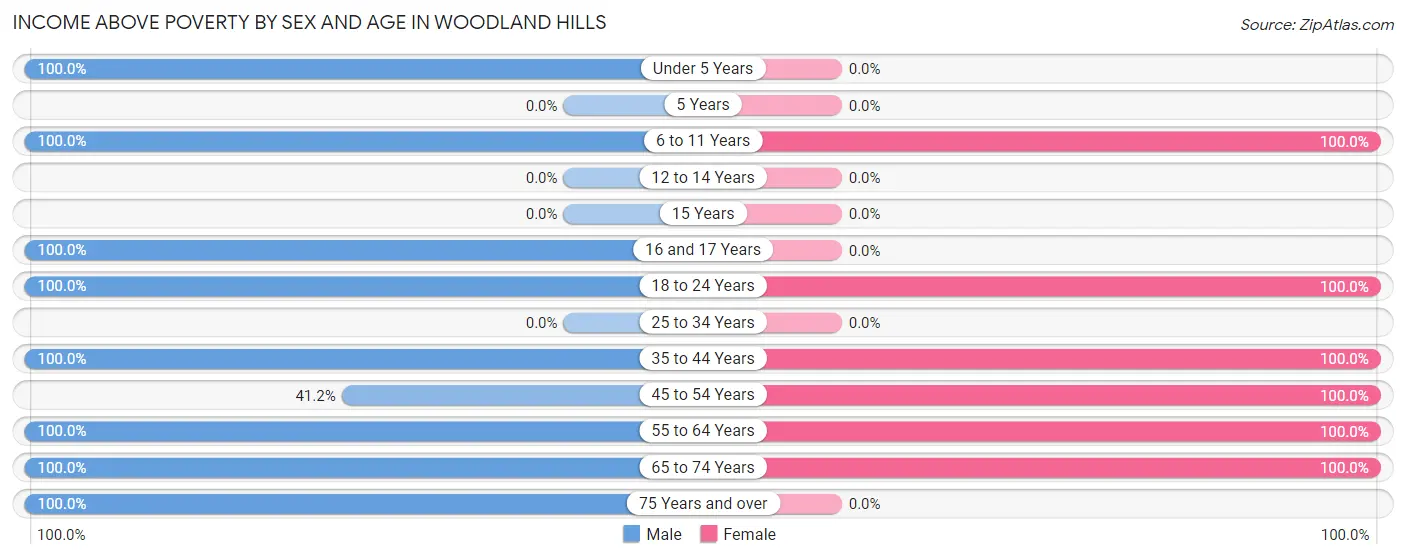
| Age Bracket | Male | Female |
| Under 5 Years | 37 (100.0%) | 0 (0.0%) |
| 5 Years | 0 (0.0%) | 0 (0.0%) |
| 6 to 11 Years | 7 (100.0%) | 15 (100.0%) |
| 12 to 14 Years | 0 (0.0%) | 0 (0.0%) |
| 15 Years | 0 (0.0%) | 0 (0.0%) |
| 16 and 17 Years | 24 (100.0%) | 0 (0.0%) |
| 18 to 24 Years | 33 (100.0%) | 26 (100.0%) |
| 25 to 34 Years | 0 (0.0%) | 0 (0.0%) |
| 35 to 44 Years | 9 (100.0%) | 7 (100.0%) |
| 45 to 54 Years | 7 (41.2%) | 7 (100.0%) |
| 55 to 64 Years | 20 (100.0%) | 24 (100.0%) |
| 65 to 74 Years | 31 (100.0%) | 33 (100.0%) |
| 75 Years and over | 2 (100.0%) | 0 (0.0%) |
| Total | 170 (94.4%) | 112 (93.3%) |
Income Below Poverty Among Married-Couple Families in Woodland Hills
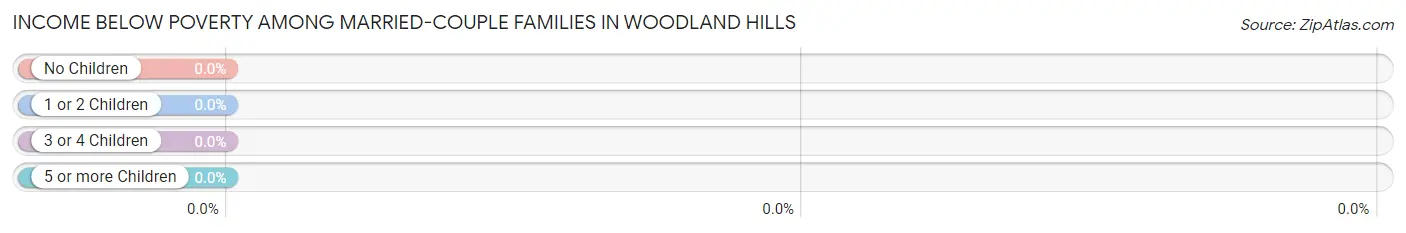
| Children | Above Poverty | Below Poverty |
| No Children | 43 (100.0%) | 0 (0.0%) |
| 1 or 2 Children | 15 (100.0%) | 0 (0.0%) |
| 3 or 4 Children | 9 (100.0%) | 0 (0.0%) |
| 5 or more Children | 0 (0.0%) | 0 (0.0%) |
| Total | 67 (100.0%) | 0 (0.0%) |
Income Below Poverty Among Single-Parent Households in Woodland Hills
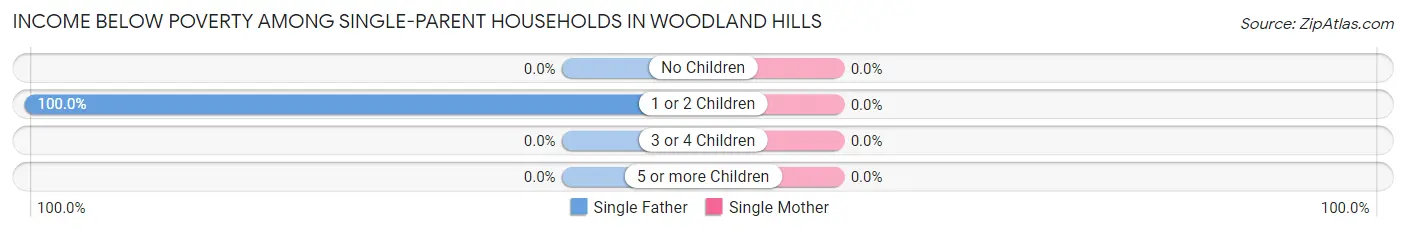
| Children | Single Father | Single Mother |
| No Children | 0 (0.0%) | 0 (0.0%) |
| 1 or 2 Children | 10 (100.0%) | 0 (0.0%) |
| 3 or 4 Children | 0 (0.0%) | 0 (0.0%) |
| 5 or more Children | 0 (0.0%) | 0 (0.0%) |
| Total | 10 (100.0%) | 0 (0.0%) |
Income Below Poverty Among Married-Couple vs Single-Parent Households in Woodland Hills
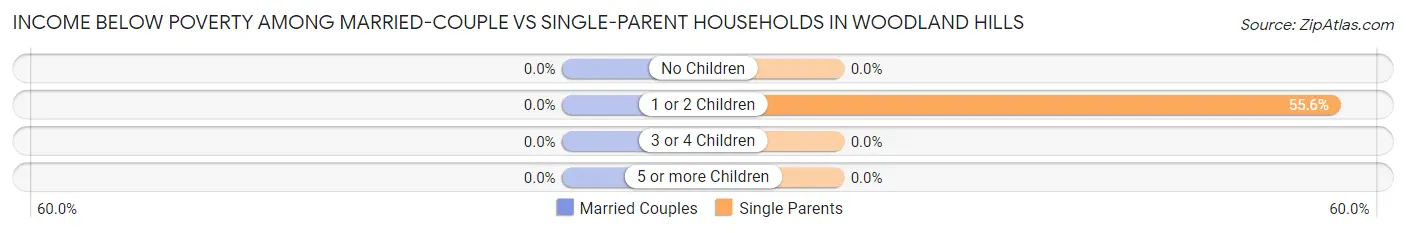
| Children | Married-Couple Families | Single-Parent Households |
| No Children | 0 (0.0%) | 0 (0.0%) |
| 1 or 2 Children | 0 (0.0%) | 10 (55.6%) |
| 3 or 4 Children | 0 (0.0%) | 0 (0.0%) |
| 5 or more Children | 0 (0.0%) | 0 (0.0%) |
| Total | 0 (0.0%) | 10 (55.6%) |
Race in Woodland Hills
The most populous races in Woodland Hills are White / Caucasian (282 | 94.0%), Hispanic or Latino (81 | 27.0%), and Two or more Races (18 | 6.0%).
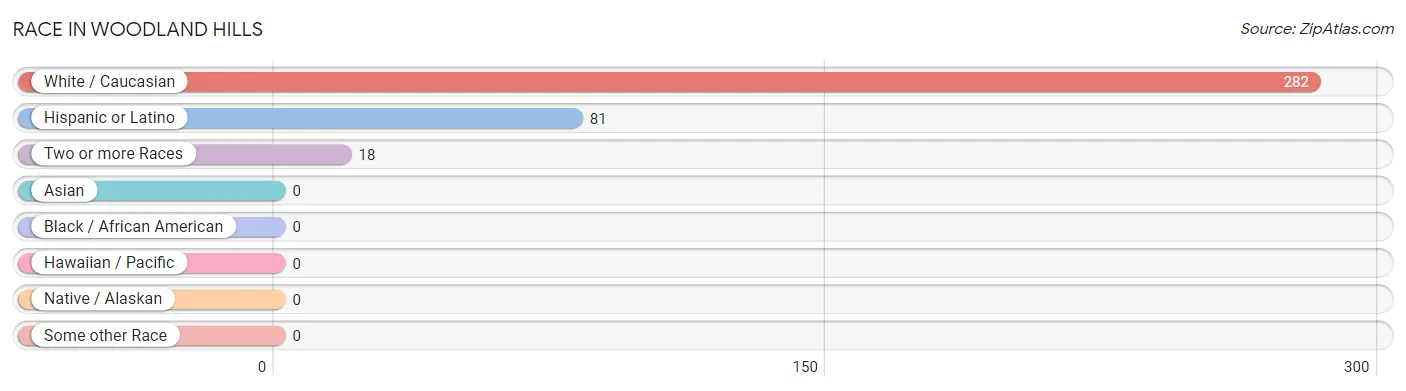
| Race | # Population | % Population |
| Asian | 0 | 0.0% |
| Black / African American | 0 | 0.0% |
| Hawaiian / Pacific | 0 | 0.0% |
| Hispanic or Latino | 81 | 27.0% |
| Native / Alaskan | 0 | 0.0% |
| White / Caucasian | 282 | 94.0% |
| Two or more Races | 18 | 6.0% |
| Some other Race | 0 | 0.0% |
| Total | 300 | 100.0% |
Ancestry in Woodland Hills
The most populous ancestries reported in Woodland Hills are Mexican (81 | 27.0%), German (61 | 20.3%), European (44 | 14.7%), Swedish (31 | 10.3%), and Czech (29 | 9.7%), together accounting for 82.0% of all Woodland Hills residents.
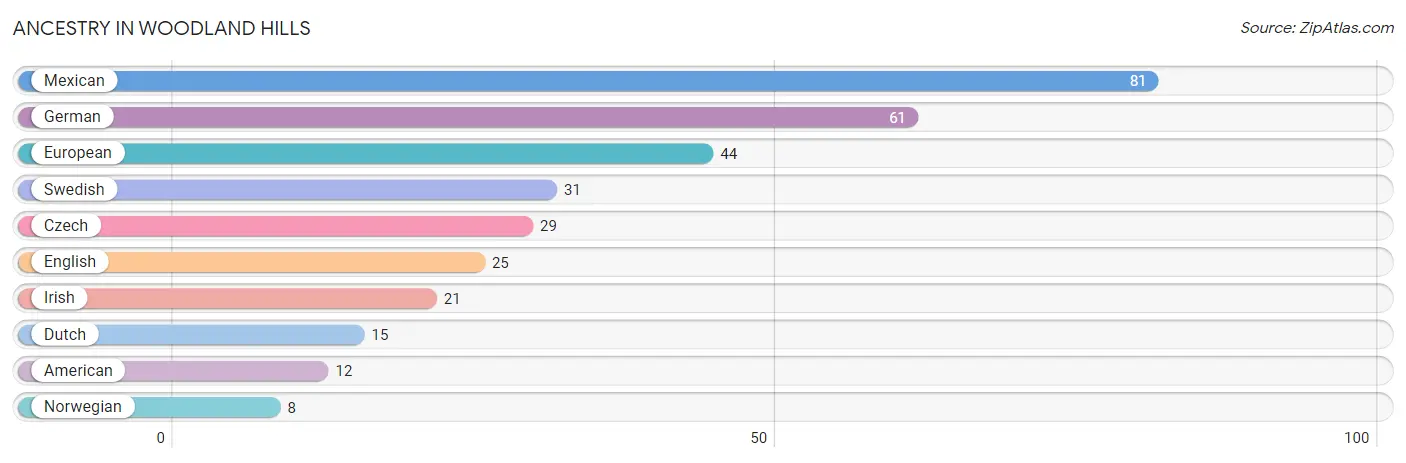
| Ancestry | # Population | % Population |
| American | 12 | 4.0% |
| Czech | 29 | 9.7% |
| Dutch | 15 | 5.0% |
| English | 25 | 8.3% |
| European | 44 | 14.7% |
| German | 61 | 20.3% |
| Irish | 21 | 7.0% |
| Mexican | 81 | 27.0% |
| Norwegian | 8 | 2.7% |
| Swedish | 31 | 10.3% | View All 10 Rows |
Immigrants in Woodland Hills

| Immigration Origin | # Population | % Population | View All 0 Rows |
Sex and Age in Woodland Hills
Sex and Age in Woodland Hills
The most populous age groups in Woodland Hills are Under 5 Years (37 | 20.6%) for men and 70 to 74 Years (27 | 22.5%) for women.
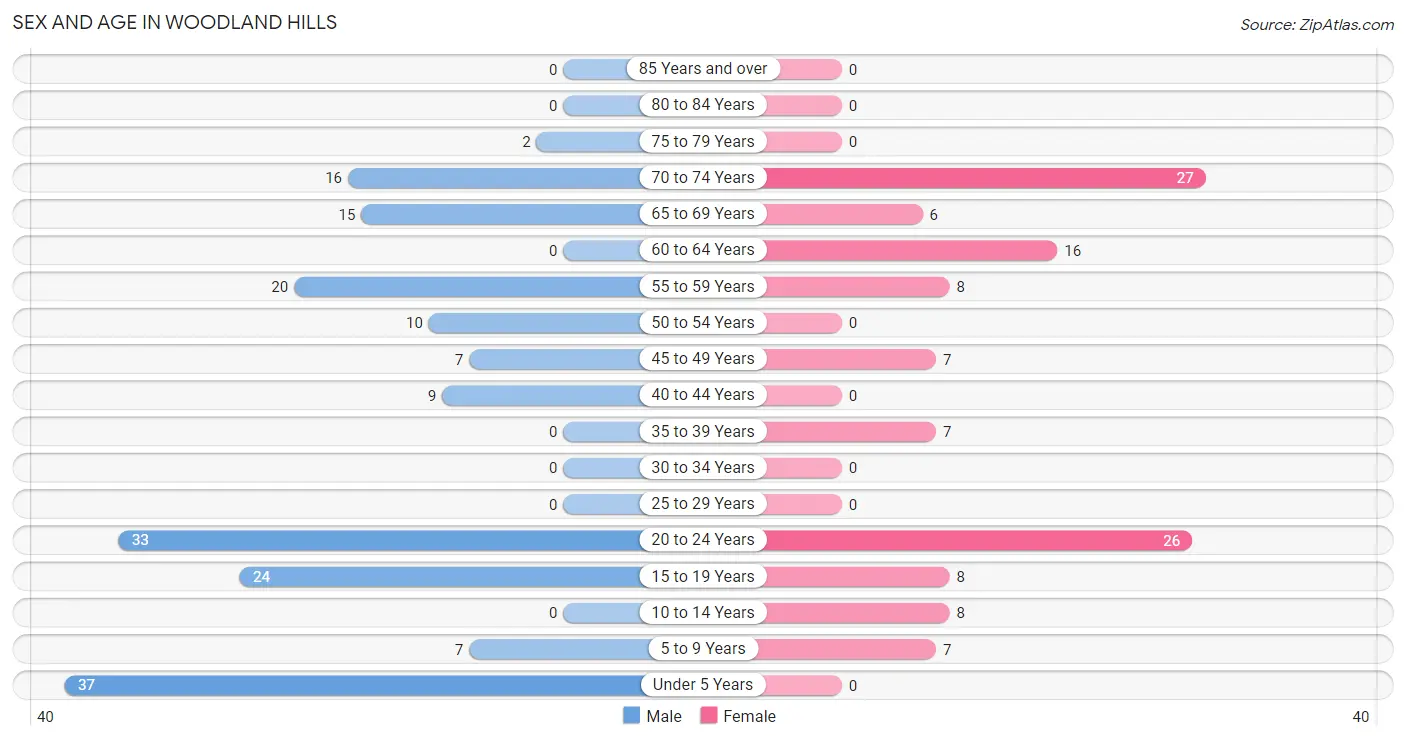
| Age Bracket | Male | Female |
| Under 5 Years | 37 (20.6%) | 0 (0.0%) |
| 5 to 9 Years | 7 (3.9%) | 7 (5.8%) |
| 10 to 14 Years | 0 (0.0%) | 8 (6.7%) |
| 15 to 19 Years | 24 (13.3%) | 8 (6.7%) |
| 20 to 24 Years | 33 (18.3%) | 26 (21.7%) |
| 25 to 29 Years | 0 (0.0%) | 0 (0.0%) |
| 30 to 34 Years | 0 (0.0%) | 0 (0.0%) |
| 35 to 39 Years | 0 (0.0%) | 7 (5.8%) |
| 40 to 44 Years | 9 (5.0%) | 0 (0.0%) |
| 45 to 49 Years | 7 (3.9%) | 7 (5.8%) |
| 50 to 54 Years | 10 (5.6%) | 0 (0.0%) |
| 55 to 59 Years | 20 (11.1%) | 8 (6.7%) |
| 60 to 64 Years | 0 (0.0%) | 16 (13.3%) |
| 65 to 69 Years | 15 (8.3%) | 6 (5.0%) |
| 70 to 74 Years | 16 (8.9%) | 27 (22.5%) |
| 75 to 79 Years | 2 (1.1%) | 0 (0.0%) |
| 80 to 84 Years | 0 (0.0%) | 0 (0.0%) |
| 85 Years and over | 0 (0.0%) | 0 (0.0%) |
| Total | 180 (100.0%) | 120 (100.0%) |
Families and Households in Woodland Hills
Median Family Size in Woodland Hills
The median family size in Woodland Hills is 3.53 persons per family, with single female/mother families (8 | 9.4%) accounting for the largest median family size of 13 persons per family. On the other hand, single male/father families (10 | 11.8%) represent the smallest median family size with 1.80 persons per family.
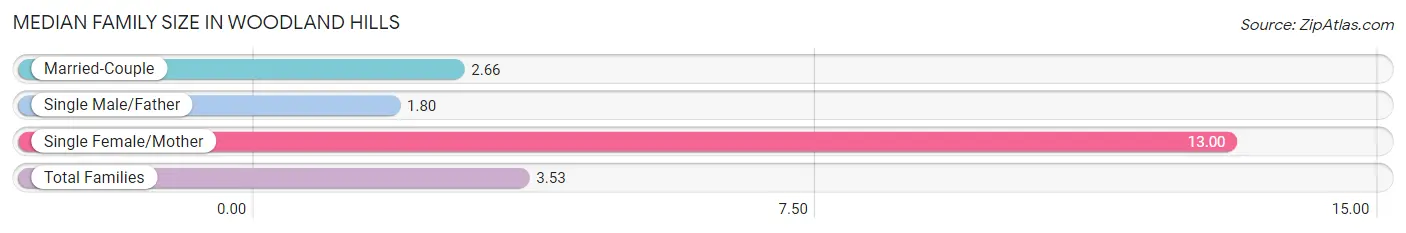
| Family Type | # Families | Family Size |
| Married-Couple | 67 (78.8%) | 2.66 |
| Single Male/Father | 10 (11.8%) | 1.80 |
| Single Female/Mother | 8 (9.4%) | 13.00 |
| Total Families | 85 (100.0%) | 3.53 |
Median Household Size in Woodland Hills
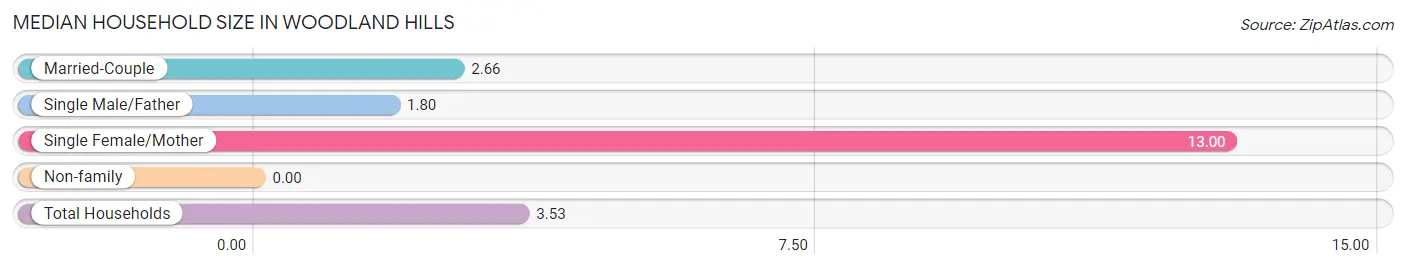
| Household Type | # Households | Household Size |
| Married-Couple | 67 (78.8%) | 2.66 |
| Single Male/Father | 10 (11.8%) | 1.80 |
| Single Female/Mother | 8 (9.4%) | 13.00 |
| Non-family | 0 (0.0%) | - |
| Total Households | 85 (100.0%) | 3.53 |
Household Size by Marriage Status in Woodland Hills
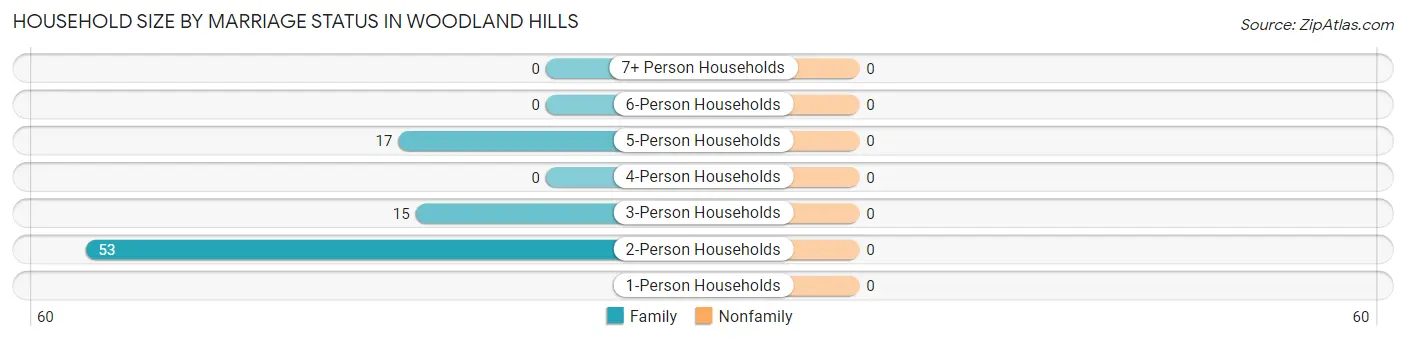
| Household Size | Family Households | Nonfamily Households |
| 1-Person Households | - | 0 (0.0%) |
| 2-Person Households | 53 (62.4%) | 0 (0.0%) |
| 3-Person Households | 15 (17.6%) | 0 (0.0%) |
| 4-Person Households | 0 (0.0%) | 0 (0.0%) |
| 5-Person Households | 17 (20.0%) | 0 (0.0%) |
| 6-Person Households | 0 (0.0%) | 0 (0.0%) |
| 7+ Person Households | 0 (0.0%) | 0 (0.0%) |
| Total | 85 (100.0%) | 0 (0.0%) |
Female Fertility in Woodland Hills
Fertility by Age in Woodland Hills
| Age Bracket | Women with Births | Births / 1,000 Women |
| 15 to 19 years | 0 (0.0%) | 0.0 |
| 20 to 34 years | 0 (0.0%) | 0.0 |
| 35 to 50 years | 0 (0.0%) | 0.0 |
| Total | 0 (0.0%) | 0.0 |
Fertility by Age by Marriage Status in Woodland Hills
| Age Bracket | Married | Unmarried |
| 15 to 19 years | 0 (0.0%) | 0 (0.0%) |
| 20 to 34 years | 0 (0.0%) | 0 (0.0%) |
| 35 to 50 years | 0 (0.0%) | 0 (0.0%) |
| Total | 0 (0.0%) | 0 (0.0%) |
Fertility by Education in Woodland Hills
| Educational Attainment | Women with Births | Births / 1,000 Women |
| Less than High School | 0 (0.0%) | 0.0 |
| High School Diploma | 0 (0.0%) | 0.0 |
| College or Associate's Degree | 0 (0.0%) | 0.0 |
| Bachelor's Degree | 0 (0.0%) | 0.0 |
| Graduate Degree | 0 (0.0%) | 0.0 |
| Total | 0 (0.0%) | 0.0 |
Fertility by Education by Marriage Status in Woodland Hills
| Educational Attainment | Married | Unmarried |
| Less than High School | 0 (0.0%) | 0 (0.0%) |
| High School Diploma | 0 (0.0%) | 0 (0.0%) |
| College or Associate's Degree | 0 (0.0%) | 0 (0.0%) |
| Bachelor's Degree | 0 (0.0%) | 0 (0.0%) |
| Graduate Degree | 0 (0.0%) | 0 (0.0%) |
| Total | 0 (0.0%) | 0 (0.0%) |
Employment Characteristics in Woodland Hills
Employment by Class of Employer in Woodland Hills
Among the 149 employed individuals in Woodland Hills, private company employees (132 | 88.6%), state government employees (9 | 6.0%), and not-for-profit organizations (8 | 5.4%) make up the most common classes of employment.
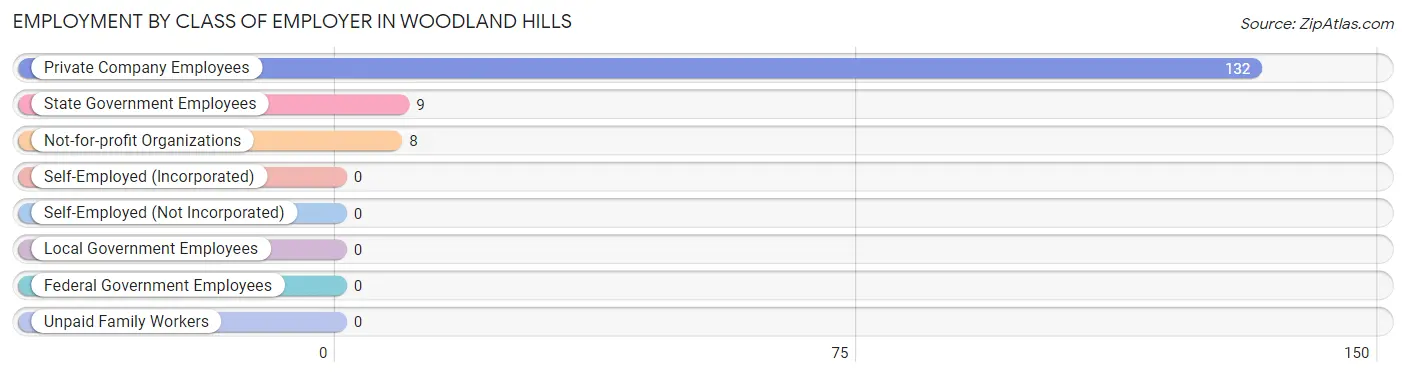
| Employer Class | # Employees | % Employees |
| Private Company Employees | 132 | 88.6% |
| Self-Employed (Incorporated) | 0 | 0.0% |
| Self-Employed (Not Incorporated) | 0 | 0.0% |
| Not-for-profit Organizations | 8 | 5.4% |
| Local Government Employees | 0 | 0.0% |
| State Government Employees | 9 | 6.0% |
| Federal Government Employees | 0 | 0.0% |
| Unpaid Family Workers | 0 | 0.0% |
| Total | 149 | 100.0% |
Employment Status by Age in Woodland Hills
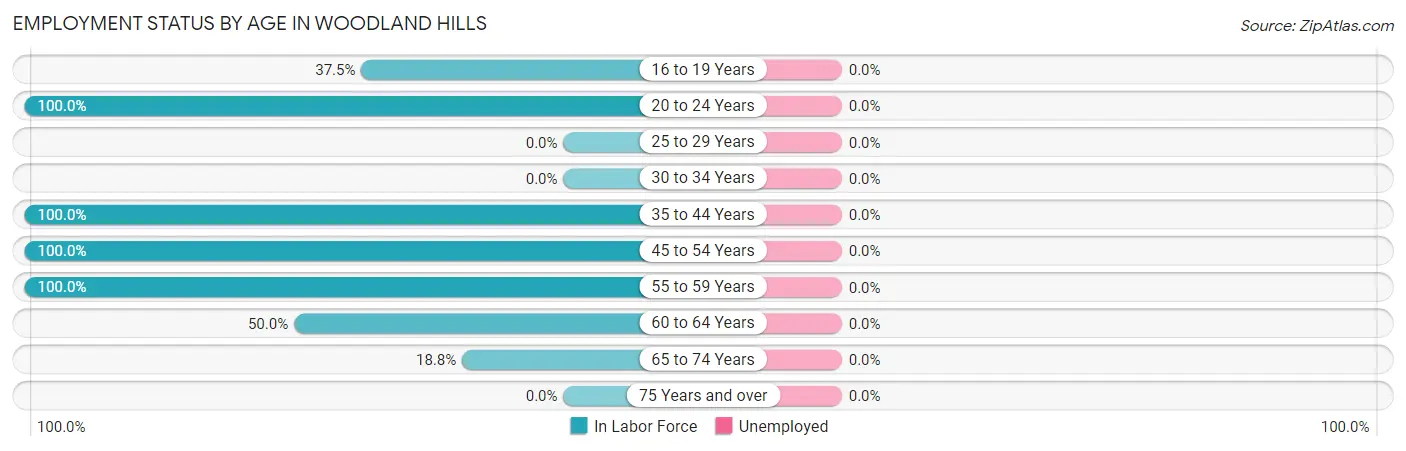
| Age Bracket | In Labor Force | Unemployed |
| 16 to 19 Years | 12 (37.5%) | 0 (0.0%) |
| 20 to 24 Years | 59 (100.0%) | 0 (0.0%) |
| 25 to 29 Years | 0 (0.0%) | 0 (0.0%) |
| 30 to 34 Years | 0 (0.0%) | 0 (0.0%) |
| 35 to 44 Years | 16 (100.0%) | 0 (0.0%) |
| 45 to 54 Years | 24 (100.0%) | 0 (0.0%) |
| 55 to 59 Years | 28 (100.0%) | 0 (0.0%) |
| 60 to 64 Years | 8 (50.0%) | 0 (0.0%) |
| 65 to 74 Years | 12 (18.8%) | 0 (0.0%) |
| 75 Years and over | 0 (0.0%) | 0 (0.0%) |
| Total | 159 (66.0%) | 0 (0.0%) |
Employment Status by Educational Attainment in Woodland Hills
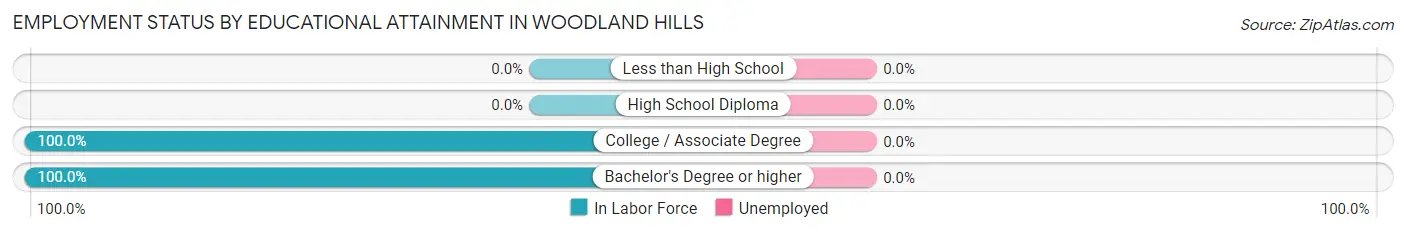
| Educational Attainment | In Labor Force | Unemployed |
| Less than High School | 0 (0.0%) | 0 (0.0%) |
| High School Diploma | 0 (0.0%) | 0 (0.0%) |
| College / Associate Degree | 34 (100.0%) | 0 (0.0%) |
| Bachelor's Degree or higher | 42 (100.0%) | 0 (0.0%) |
| Total | 76 (90.5%) | 0 (0.0%) |
Employment Occupations by Sex in Woodland Hills
Management, Business, Science and Arts Occupations
The most common Management, Business, Science and Arts occupations in Woodland Hills are Management (40 | 25.2%), Health Diagnosing & Treating (13 | 8.2%), Business & Financial (8 | 5.0%), and Health Technologists (7 | 4.4%).
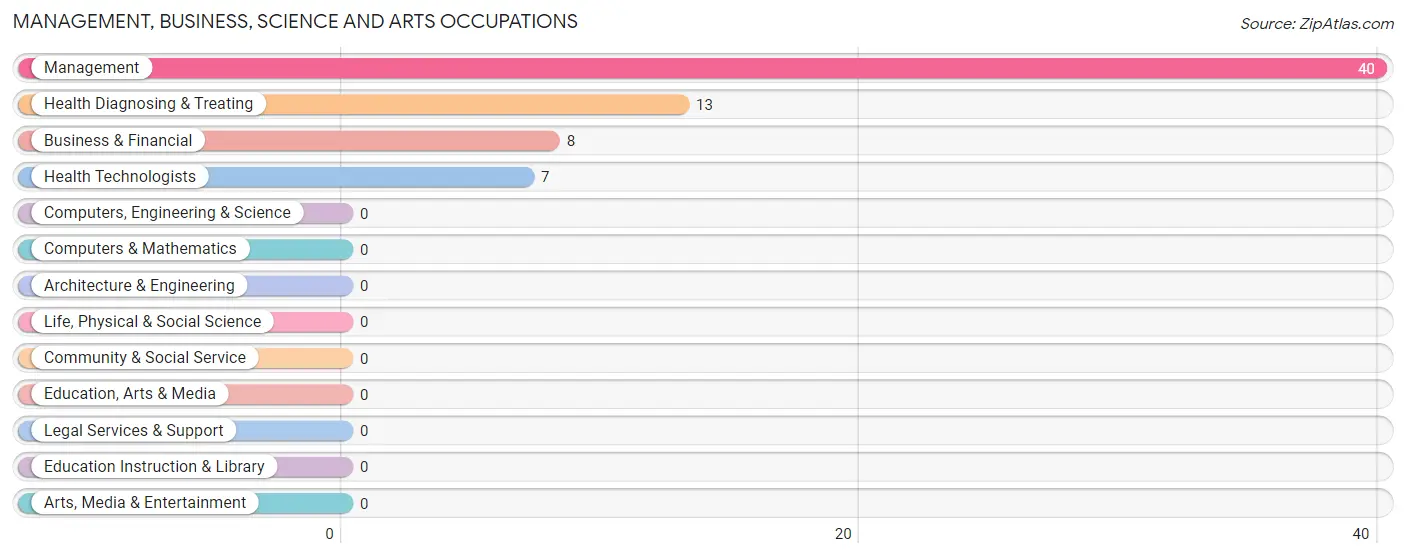
Management, Business, Science and Arts Occupations by Sex
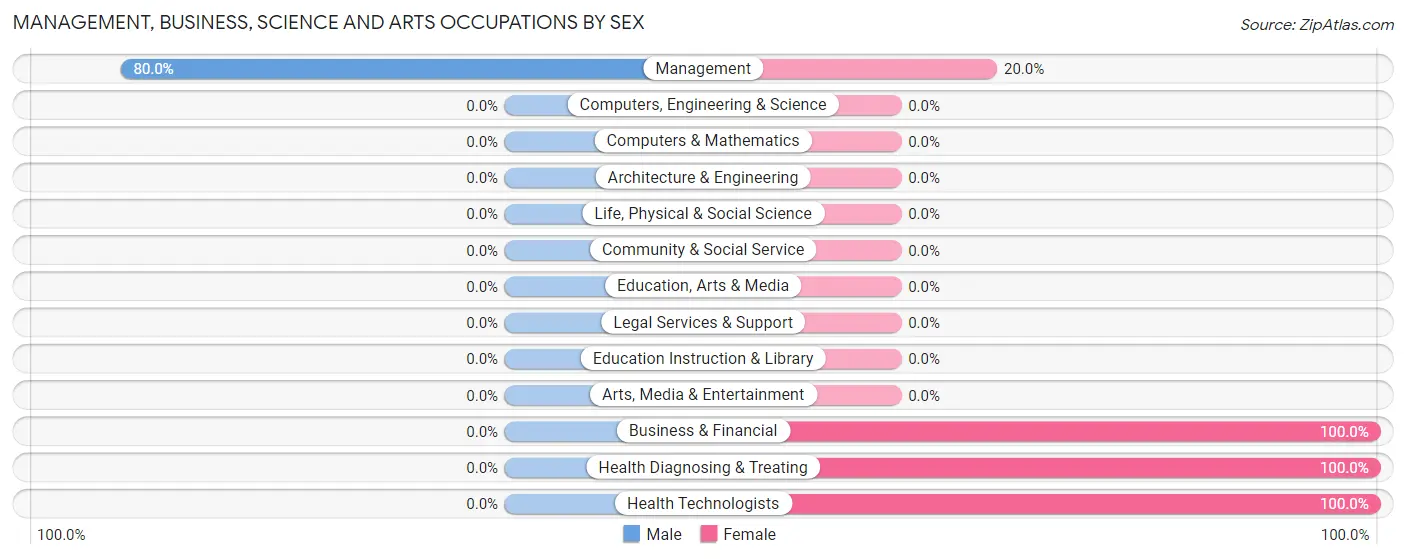
| Occupation | Male | Female |
| Management | 32 (80.0%) | 8 (20.0%) |
| Business & Financial | 0 (0.0%) | 8 (100.0%) |
| Computers, Engineering & Science | 0 (0.0%) | 0 (0.0%) |
| Computers & Mathematics | 0 (0.0%) | 0 (0.0%) |
| Architecture & Engineering | 0 (0.0%) | 0 (0.0%) |
| Life, Physical & Social Science | 0 (0.0%) | 0 (0.0%) |
| Community & Social Service | 0 (0.0%) | 0 (0.0%) |
| Education, Arts & Media | 0 (0.0%) | 0 (0.0%) |
| Legal Services & Support | 0 (0.0%) | 0 (0.0%) |
| Education Instruction & Library | 0 (0.0%) | 0 (0.0%) |
| Arts, Media & Entertainment | 0 (0.0%) | 0 (0.0%) |
| Health Diagnosing & Treating | 0 (0.0%) | 13 (100.0%) |
| Health Technologists | 0 (0.0%) | 7 (100.0%) |
| Total (Category) | 32 (52.5%) | 29 (47.5%) |
| Total (Overall) | 97 (61.0%) | 62 (39.0%) |
Services Occupations
The most common Services occupations in Woodland Hills are Cleaning & Maintenance (22 | 13.8%), and Food Preparation & Serving (18 | 11.3%).
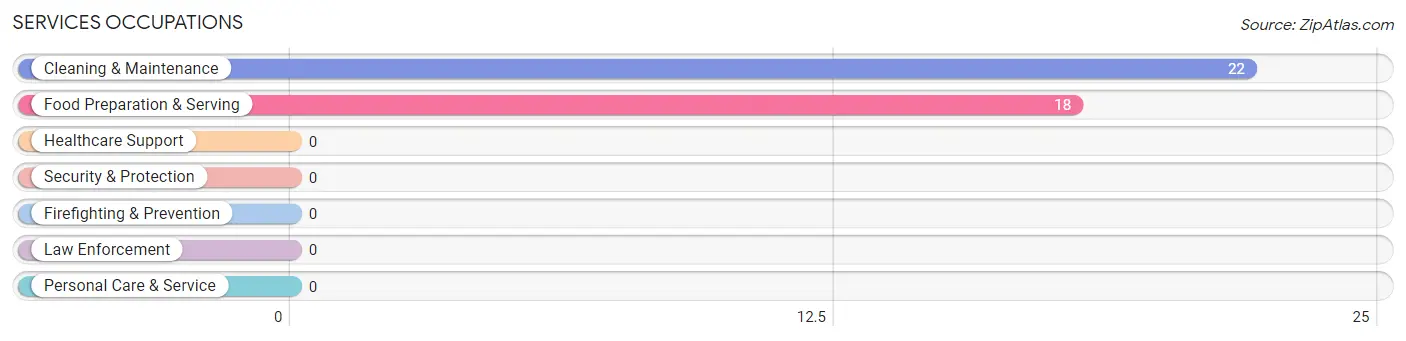
Services Occupations by Sex
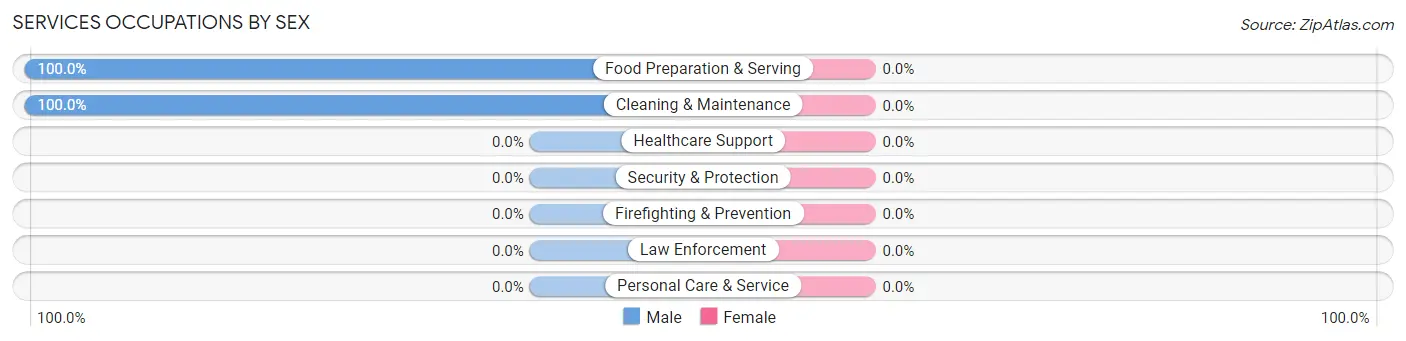
| Occupation | Male | Female |
| Healthcare Support | 0 (0.0%) | 0 (0.0%) |
| Security & Protection | 0 (0.0%) | 0 (0.0%) |
| Firefighting & Prevention | 0 (0.0%) | 0 (0.0%) |
| Law Enforcement | 0 (0.0%) | 0 (0.0%) |
| Food Preparation & Serving | 18 (100.0%) | 0 (0.0%) |
| Cleaning & Maintenance | 22 (100.0%) | 0 (0.0%) |
| Personal Care & Service | 0 (0.0%) | 0 (0.0%) |
| Total (Category) | 40 (100.0%) | 0 (0.0%) |
| Total (Overall) | 97 (61.0%) | 62 (39.0%) |
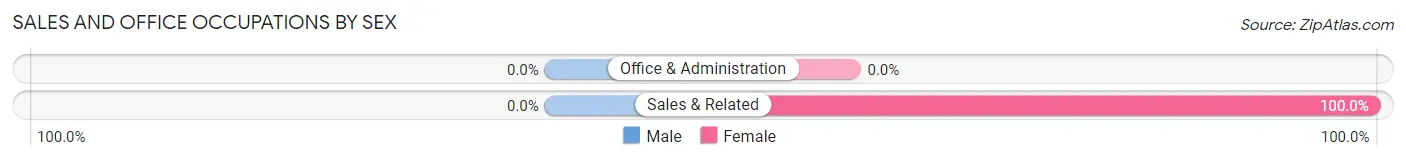
Sales and Office Occupations
The most common Sales and Office occupations in Woodland Hills are , and Sales & Related (33 | 20.7%).
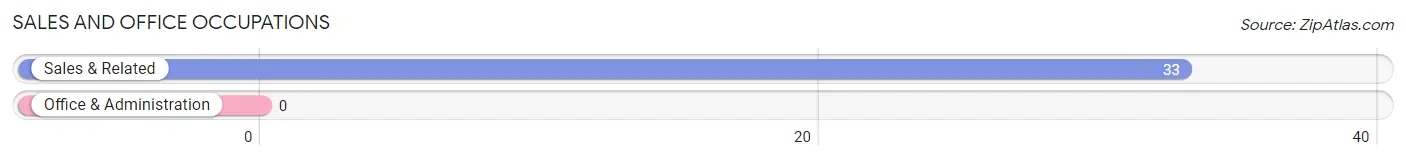
Sales and Office Occupations by Sex
| Occupation | Male | Female |
| Sales & Related | 0 (0.0%) | 33 (100.0%) |
| Office & Administration | 0 (0.0%) | 0 (0.0%) |
| Total (Category) | 0 (0.0%) | 33 (100.0%) |
| Total (Overall) | 97 (61.0%) | 62 (39.0%) |
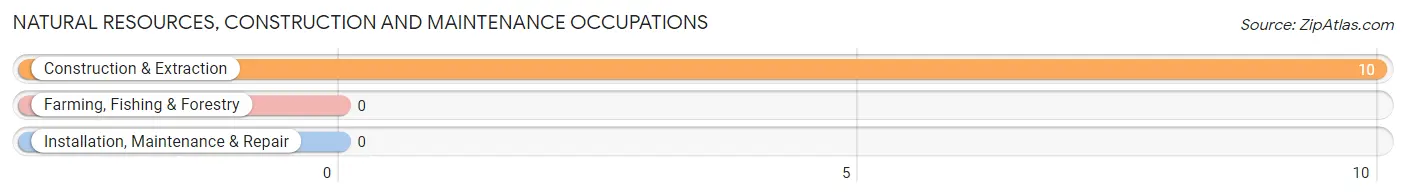
Natural Resources, Construction and Maintenance Occupations
The most common Natural Resources, Construction and Maintenance occupations in Woodland Hills are , and Construction & Extraction (10 | 6.3%).
Natural Resources, Construction and Maintenance Occupations by Sex
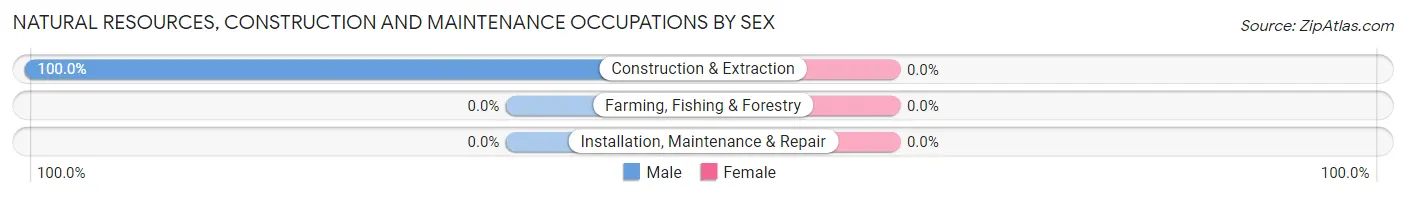
| Occupation | Male | Female |
| Farming, Fishing & Forestry | 0 (0.0%) | 0 (0.0%) |
| Construction & Extraction | 10 (100.0%) | 0 (0.0%) |
| Installation, Maintenance & Repair | 0 (0.0%) | 0 (0.0%) |
| Total (Category) | 10 (100.0%) | 0 (0.0%) |
| Total (Overall) | 97 (61.0%) | 62 (39.0%) |
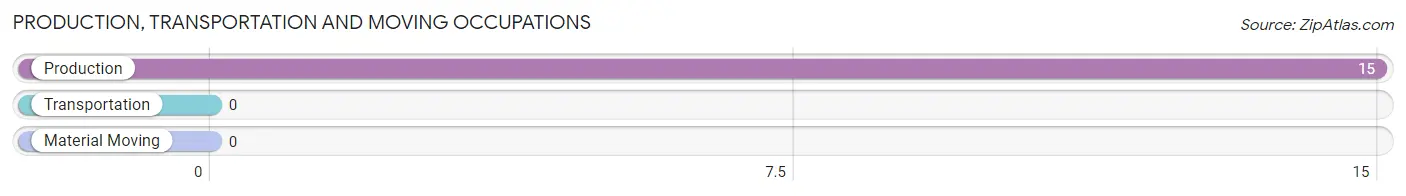
Production, Transportation and Moving Occupations
The most common Production, Transportation and Moving occupations in Woodland Hills are , and Production (15 | 9.4%).
Production, Transportation and Moving Occupations by Sex
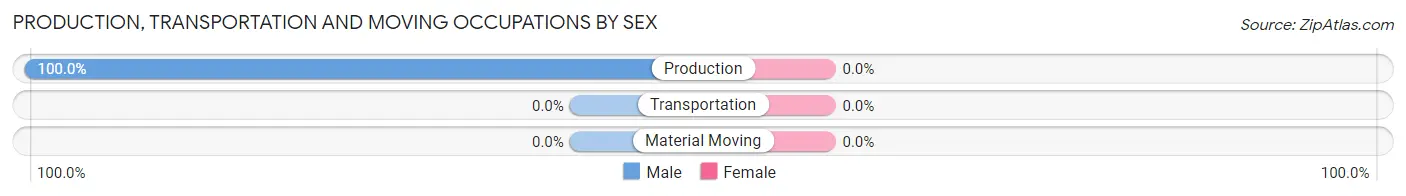
| Occupation | Male | Female |
| Production | 15 (100.0%) | 0 (0.0%) |
| Transportation | 0 (0.0%) | 0 (0.0%) |
| Material Moving | 0 (0.0%) | 0 (0.0%) |
| Total (Category) | 15 (100.0%) | 0 (0.0%) |
| Total (Overall) | 97 (61.0%) | 62 (39.0%) |
Employment Industries by Sex in Woodland Hills
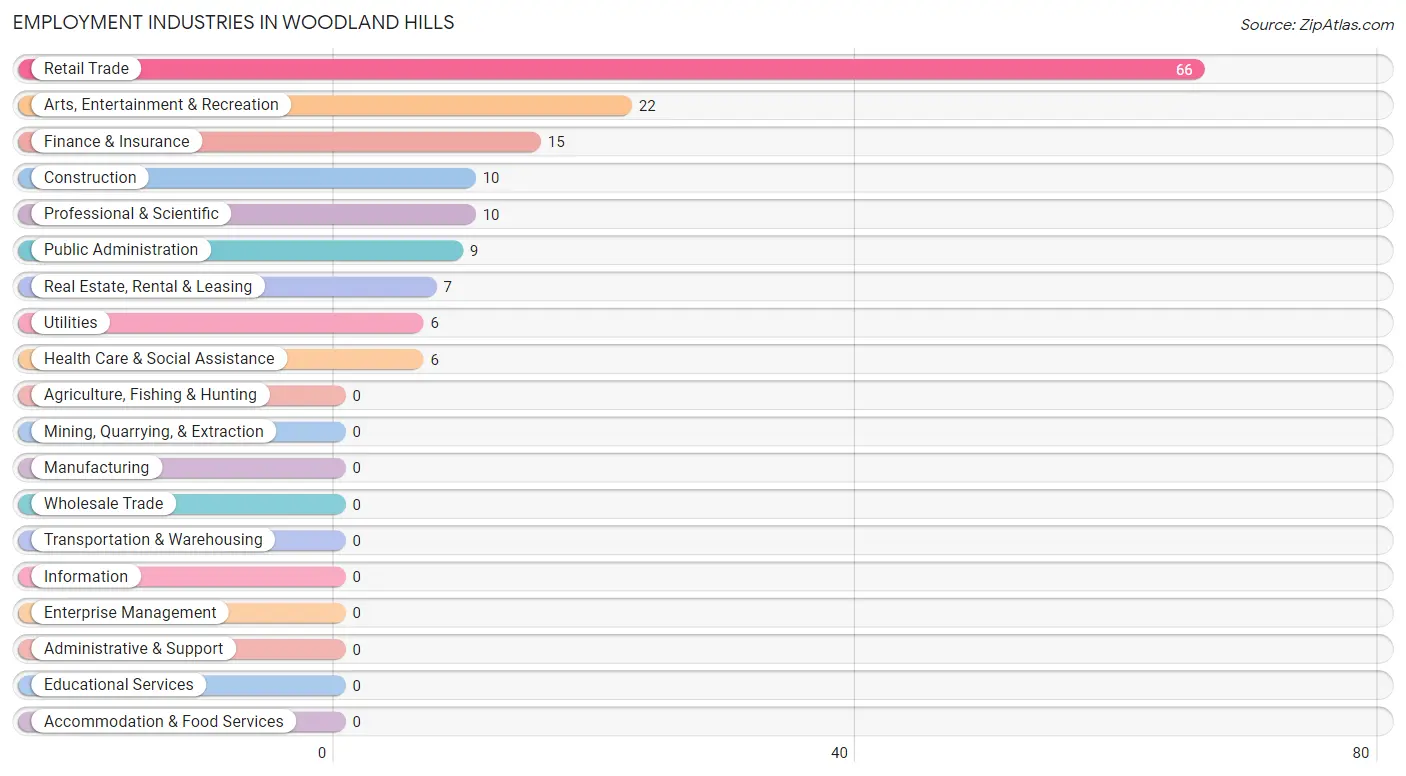
Employment Industries in Woodland Hills
The major employment industries in Woodland Hills include Retail Trade (66 | 41.5%), Arts, Entertainment & Recreation (22 | 13.8%), Finance & Insurance (15 | 9.4%), Construction (10 | 6.3%), and Professional & Scientific (10 | 6.3%).
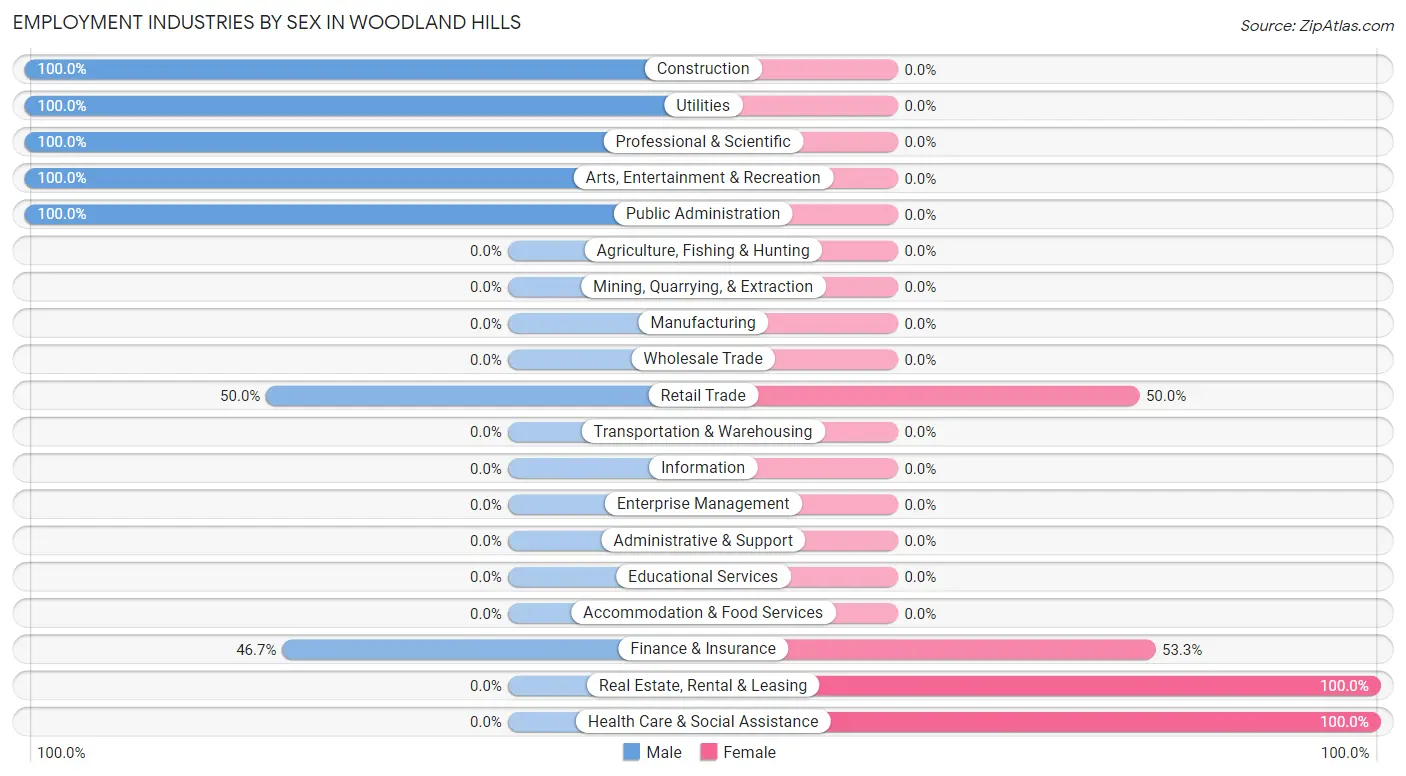
Employment Industries by Sex in Woodland Hills
The Woodland Hills industries that see more men than women are Construction (100.0%), Utilities (100.0%), and Professional & Scientific (100.0%), whereas the industries that tend to have a higher number of women are Real Estate, Rental & Leasing (100.0%), Health Care & Social Assistance (100.0%), and Finance & Insurance (53.3%).
| Industry | Male | Female |
| Agriculture, Fishing & Hunting | 0 (0.0%) | 0 (0.0%) |
| Mining, Quarrying, & Extraction | 0 (0.0%) | 0 (0.0%) |
| Construction | 10 (100.0%) | 0 (0.0%) |
| Manufacturing | 0 (0.0%) | 0 (0.0%) |
| Wholesale Trade | 0 (0.0%) | 0 (0.0%) |
| Retail Trade | 33 (50.0%) | 33 (50.0%) |
| Transportation & Warehousing | 0 (0.0%) | 0 (0.0%) |
| Utilities | 6 (100.0%) | 0 (0.0%) |
| Information | 0 (0.0%) | 0 (0.0%) |
| Finance & Insurance | 7 (46.7%) | 8 (53.3%) |
| Real Estate, Rental & Leasing | 0 (0.0%) | 7 (100.0%) |
| Professional & Scientific | 10 (100.0%) | 0 (0.0%) |
| Enterprise Management | 0 (0.0%) | 0 (0.0%) |
| Administrative & Support | 0 (0.0%) | 0 (0.0%) |
| Educational Services | 0 (0.0%) | 0 (0.0%) |
| Health Care & Social Assistance | 0 (0.0%) | 6 (100.0%) |
| Arts, Entertainment & Recreation | 22 (100.0%) | 0 (0.0%) |
| Accommodation & Food Services | 0 (0.0%) | 0 (0.0%) |
| Public Administration | 9 (100.0%) | 0 (0.0%) |
| Total | 97 (61.0%) | 62 (39.0%) |
Education in Woodland Hills
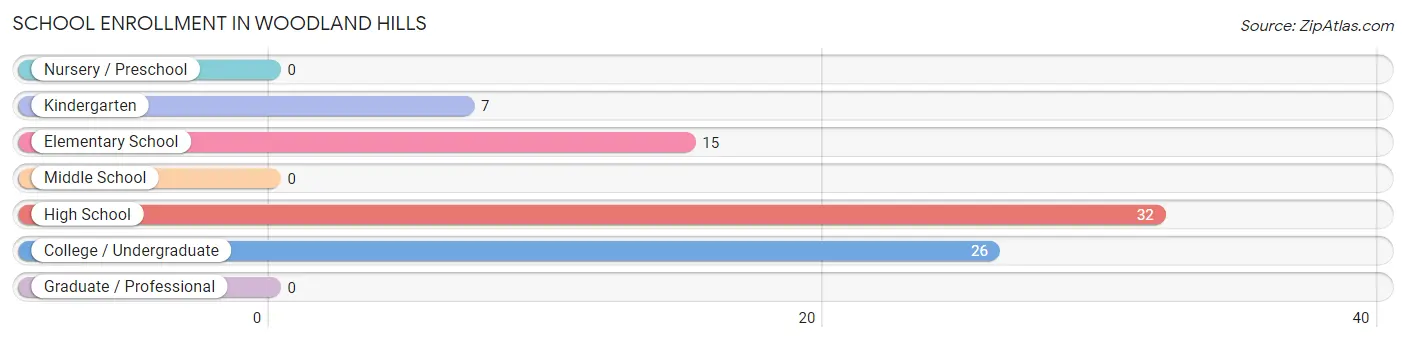
School Enrollment in Woodland Hills
The most common levels of schooling among the 80 students in Woodland Hills are high school (32 | 40.0%), college / undergraduate (26 | 32.5%), and elementary school (15 | 18.8%).
| School Level | # Students | % Students |
| Nursery / Preschool | 0 | 0.0% |
| Kindergarten | 7 | 8.7% |
| Elementary School | 15 | 18.8% |
| Middle School | 0 | 0.0% |
| High School | 32 | 40.0% |
| College / Undergraduate | 26 | 32.5% |
| Graduate / Professional | 0 | 0.0% |
| Total | 80 | 100.0% |
School Enrollment by Age by Funding Source in Woodland Hills
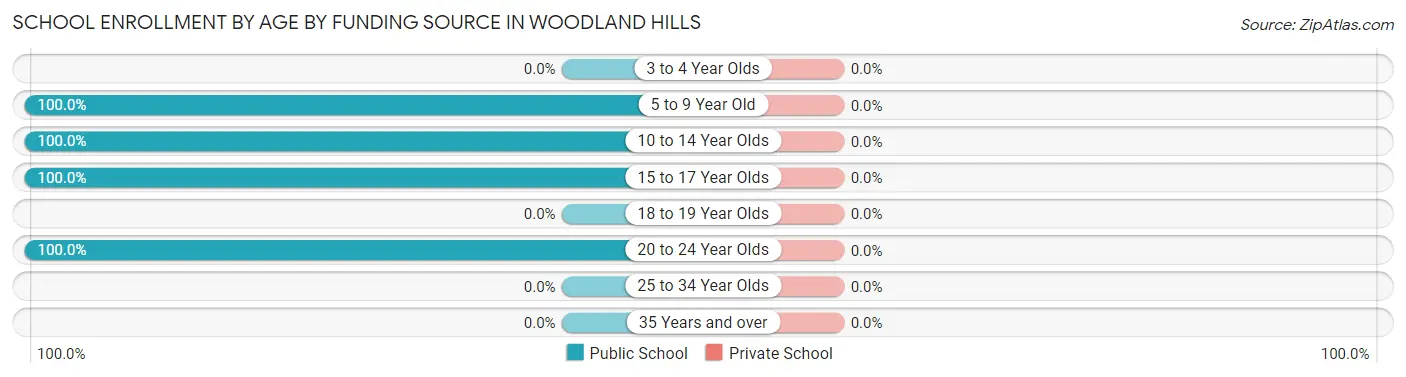
| Age Bracket | Public School | Private School |
| 3 to 4 Year Olds | 0 (0.0%) | 0 (0.0%) |
| 5 to 9 Year Old | 14 (100.0%) | 0 (0.0%) |
| 10 to 14 Year Olds | 8 (100.0%) | 0 (0.0%) |
| 15 to 17 Year Olds | 32 (100.0%) | 0 (0.0%) |
| 18 to 19 Year Olds | 0 (0.0%) | 0 (0.0%) |
| 20 to 24 Year Olds | 26 (100.0%) | 0 (0.0%) |
| 25 to 34 Year Olds | 0 (0.0%) | 0 (0.0%) |
| 35 Years and over | 0 (0.0%) | 0 (0.0%) |
| Total | 80 (100.0%) | 0 (0.0%) |
Educational Attainment by Field of Study in Woodland Hills
Business (25 | 42.4%), education (18 | 30.5%), bio, nature & agricultural (9 | 15.2%), and arts & humanities (7 | 11.9%) are the most common fields of study among 59 individuals in Woodland Hills who have obtained a bachelor's degree or higher.
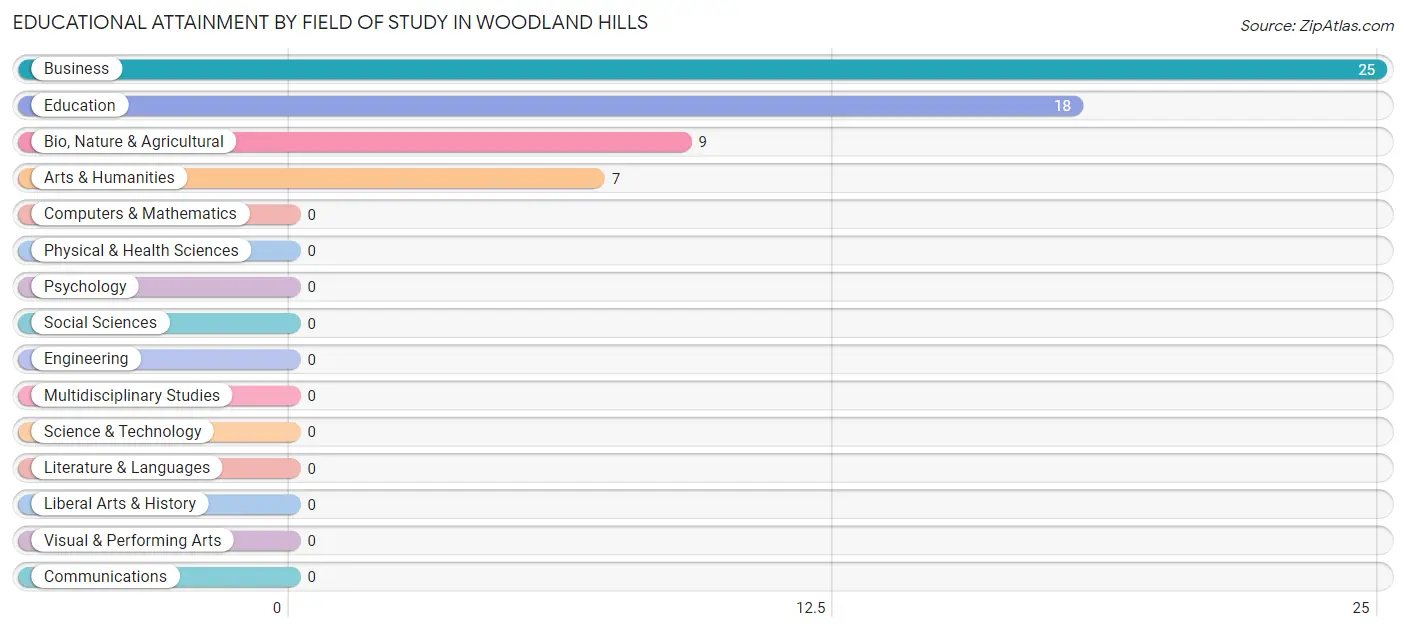
| Field of Study | # Graduates | % Graduates |
| Computers & Mathematics | 0 | 0.0% |
| Bio, Nature & Agricultural | 9 | 15.2% |
| Physical & Health Sciences | 0 | 0.0% |
| Psychology | 0 | 0.0% |
| Social Sciences | 0 | 0.0% |
| Engineering | 0 | 0.0% |
| Multidisciplinary Studies | 0 | 0.0% |
| Science & Technology | 0 | 0.0% |
| Business | 25 | 42.4% |
| Education | 18 | 30.5% |
| Literature & Languages | 0 | 0.0% |
| Liberal Arts & History | 0 | 0.0% |
| Visual & Performing Arts | 0 | 0.0% |
| Communications | 0 | 0.0% |
| Arts & Humanities | 7 | 11.9% |
| Total | 59 | 100.0% |
Transportation & Commute in Woodland Hills
Vehicle Availability by Sex in Woodland Hills
The most prevalent vehicle ownership categories in Woodland Hills are males with 4 vehicles (55, accounting for 63.2%) and females with 4 vehicles (34, making up 88.7%).
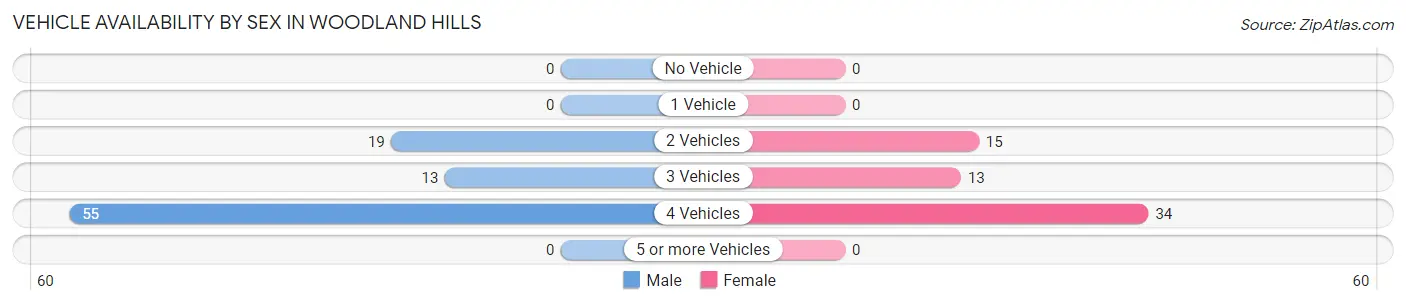
| Vehicles Available | Male | Female |
| No Vehicle | 0 (0.0%) | 0 (0.0%) |
| 1 Vehicle | 0 (0.0%) | 0 (0.0%) |
| 2 Vehicles | 19 (21.8%) | 15 (24.2%) |
| 3 Vehicles | 13 (14.9%) | 13 (21.0%) |
| 4 Vehicles | 55 (63.2%) | 34 (54.8%) |
| 5 or more Vehicles | 0 (0.0%) | 0 (0.0%) |
| Total | 87 (100.0%) | 62 (100.0%) |
Commute Time in Woodland Hills
The most frequently occuring commute durations in Woodland Hills are 30 to 34 minutes (49 commuters, 35.2%), 40 to 44 minutes (26 commuters, 18.7%), and 25 to 29 minutes (17 commuters, 12.2%).
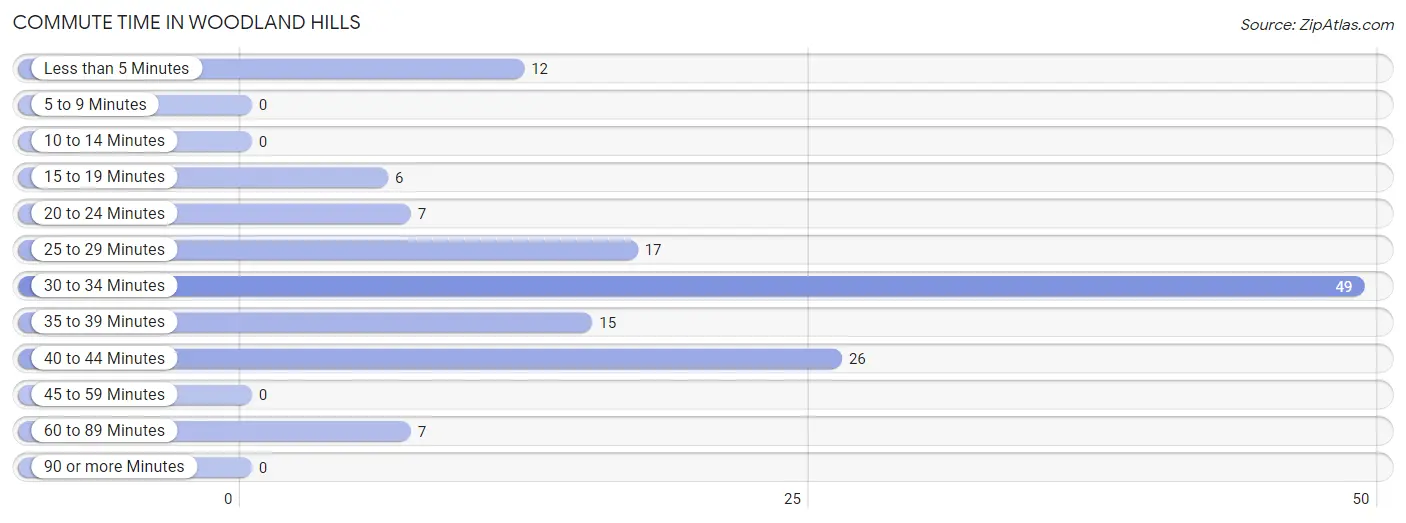
| Commute Time | # Commuters | % Commuters |
| Less than 5 Minutes | 12 | 8.6% |
| 5 to 9 Minutes | 0 | 0.0% |
| 10 to 14 Minutes | 0 | 0.0% |
| 15 to 19 Minutes | 6 | 4.3% |
| 20 to 24 Minutes | 7 | 5.0% |
| 25 to 29 Minutes | 17 | 12.2% |
| 30 to 34 Minutes | 49 | 35.2% |
| 35 to 39 Minutes | 15 | 10.8% |
| 40 to 44 Minutes | 26 | 18.7% |
| 45 to 59 Minutes | 0 | 0.0% |
| 60 to 89 Minutes | 7 | 5.0% |
| 90 or more Minutes | 0 | 0.0% |
Commute Time by Sex in Woodland Hills
The most common commute times in Woodland Hills are 30 to 34 minutes (35 commuters, 45.5%) for males and 40 to 44 minutes (26 commuters, 41.9%) for females.
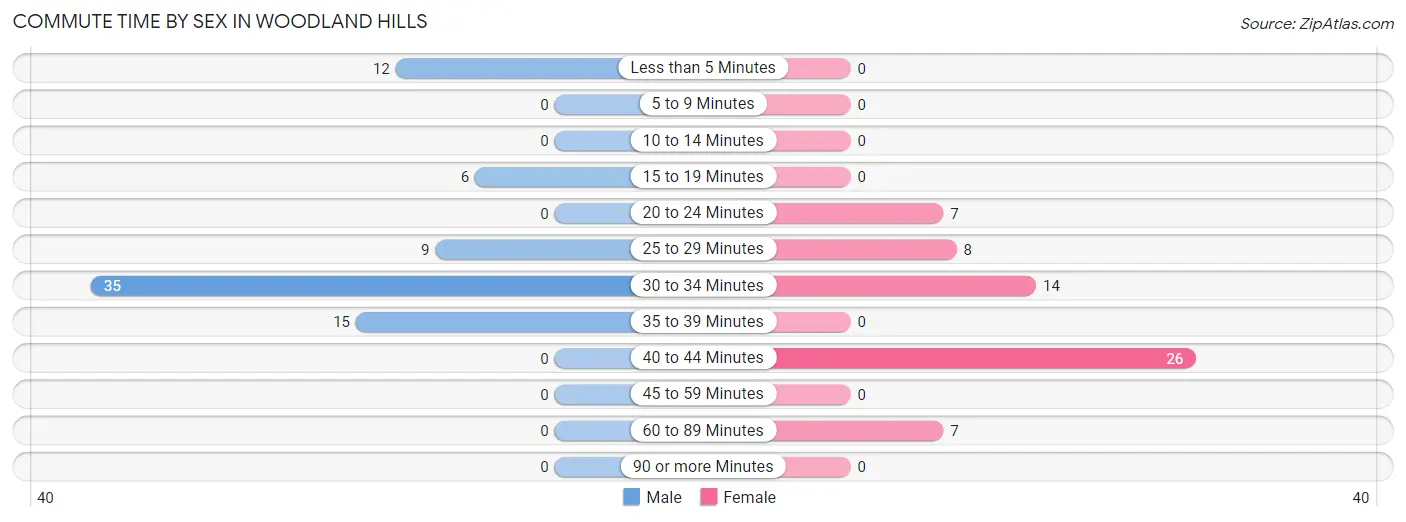
| Commute Time | Male | Female |
| Less than 5 Minutes | 12 (15.6%) | 0 (0.0%) |
| 5 to 9 Minutes | 0 (0.0%) | 0 (0.0%) |
| 10 to 14 Minutes | 0 (0.0%) | 0 (0.0%) |
| 15 to 19 Minutes | 6 (7.8%) | 0 (0.0%) |
| 20 to 24 Minutes | 0 (0.0%) | 7 (11.3%) |
| 25 to 29 Minutes | 9 (11.7%) | 8 (12.9%) |
| 30 to 34 Minutes | 35 (45.5%) | 14 (22.6%) |
| 35 to 39 Minutes | 15 (19.5%) | 0 (0.0%) |
| 40 to 44 Minutes | 0 (0.0%) | 26 (41.9%) |
| 45 to 59 Minutes | 0 (0.0%) | 0 (0.0%) |
| 60 to 89 Minutes | 0 (0.0%) | 7 (11.3%) |
| 90 or more Minutes | 0 (0.0%) | 0 (0.0%) |
Time of Departure to Work by Sex in Woodland Hills
The most frequent times of departure to work in Woodland Hills are 7:00 AM to 7:29 AM (32, 41.6%) for males and 7:30 AM to 7:59 AM (29, 46.8%) for females.
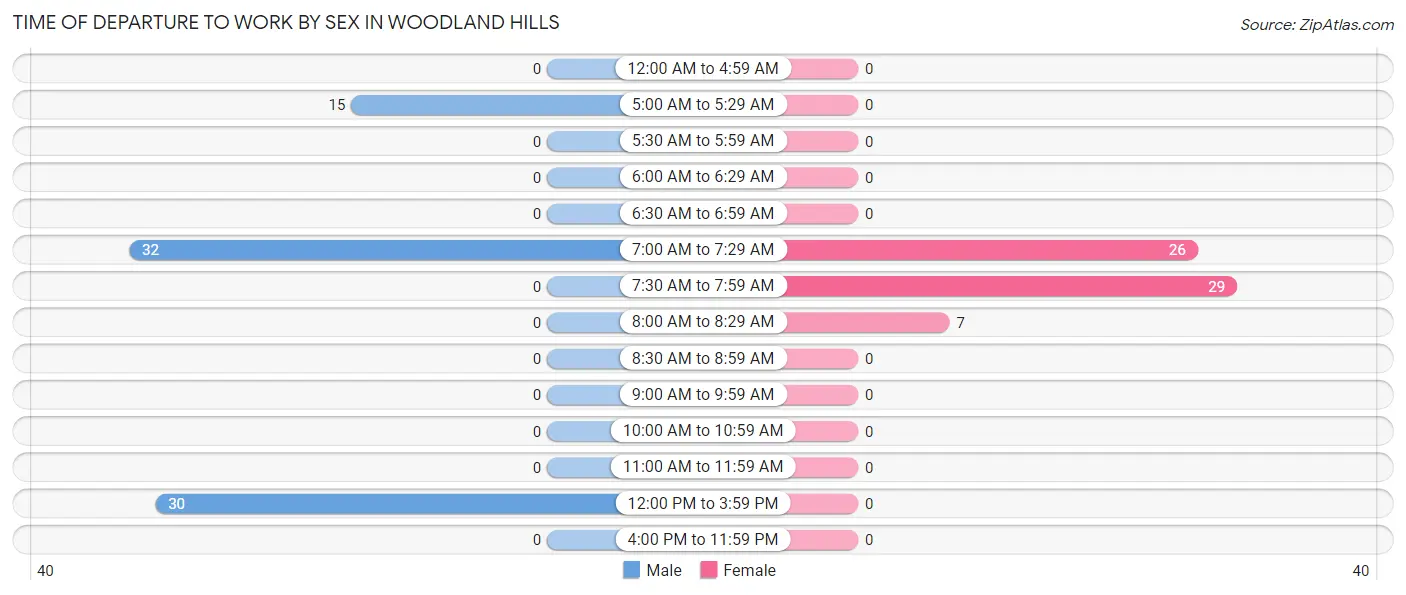
| Time of Departure | Male | Female |
| 12:00 AM to 4:59 AM | 0 (0.0%) | 0 (0.0%) |
| 5:00 AM to 5:29 AM | 15 (19.5%) | 0 (0.0%) |
| 5:30 AM to 5:59 AM | 0 (0.0%) | 0 (0.0%) |
| 6:00 AM to 6:29 AM | 0 (0.0%) | 0 (0.0%) |
| 6:30 AM to 6:59 AM | 0 (0.0%) | 0 (0.0%) |
| 7:00 AM to 7:29 AM | 32 (41.6%) | 26 (41.9%) |
| 7:30 AM to 7:59 AM | 0 (0.0%) | 29 (46.8%) |
| 8:00 AM to 8:29 AM | 0 (0.0%) | 7 (11.3%) |
| 8:30 AM to 8:59 AM | 0 (0.0%) | 0 (0.0%) |
| 9:00 AM to 9:59 AM | 0 (0.0%) | 0 (0.0%) |
| 10:00 AM to 10:59 AM | 0 (0.0%) | 0 (0.0%) |
| 11:00 AM to 11:59 AM | 0 (0.0%) | 0 (0.0%) |
| 12:00 PM to 3:59 PM | 30 (39.0%) | 0 (0.0%) |
| 4:00 PM to 11:59 PM | 0 (0.0%) | 0 (0.0%) |
| Total | 77 (100.0%) | 62 (100.0%) |
Housing Occupancy in Woodland Hills
Occupancy by Ownership in Woodland Hills
Of the total 85 dwellings in Woodland Hills, owner-occupied units account for 85 (100.0%), while renter-occupied units make up 0 (0.0%).
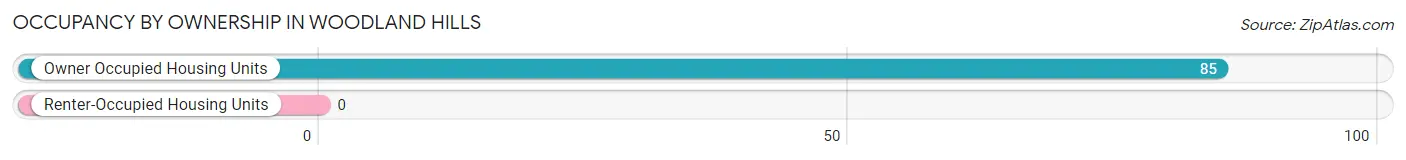
| Occupancy | # Housing Units | % Housing Units |
| Owner Occupied Housing Units | 85 | 100.0% |
| Renter-Occupied Housing Units | 0 | 0.0% |
| Total Occupied Housing Units | 85 | 100.0% |
Occupancy by Household Size in Woodland Hills
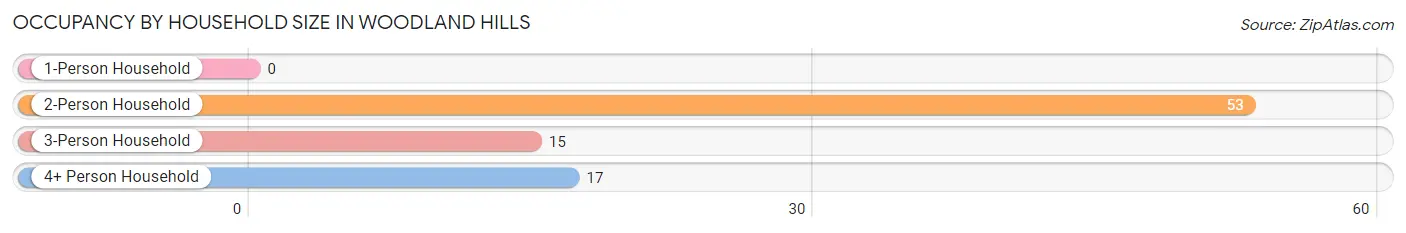
| Household Size | # Housing Units | % Housing Units |
| 1-Person Household | 0 | 0.0% |
| 2-Person Household | 53 | 62.4% |
| 3-Person Household | 15 | 17.6% |
| 4+ Person Household | 17 | 20.0% |
| Total Housing Units | 85 | 100.0% |
Occupancy by Ownership by Household Size in Woodland Hills
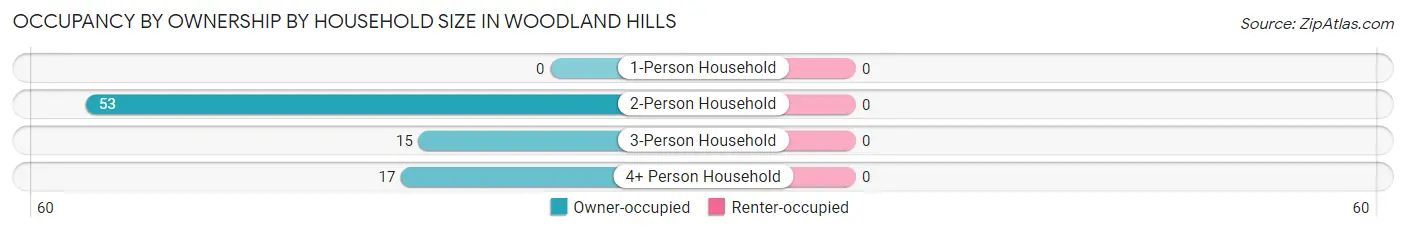
| Household Size | Owner-occupied | Renter-occupied |
| 1-Person Household | 0 (0.0%) | 0 (0.0%) |
| 2-Person Household | 53 (100.0%) | 0 (0.0%) |
| 3-Person Household | 15 (100.0%) | 0 (0.0%) |
| 4+ Person Household | 17 (100.0%) | 0 (0.0%) |
| Total Housing Units | 85 (100.0%) | 0 (0.0%) |
Occupancy by Educational Attainment in Woodland Hills
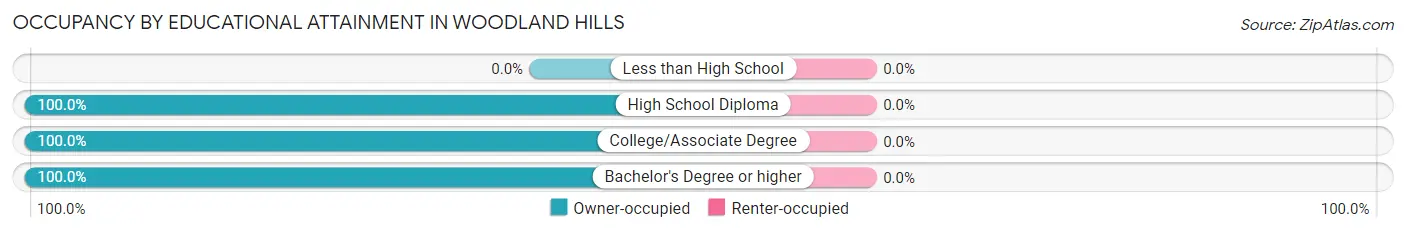
| Household Size | Owner-occupied | Renter-occupied |
| Less than High School | 0 (0.0%) | 0 (0.0%) |
| High School Diploma | 2 (100.0%) | 0 (0.0%) |
| College/Associate Degree | 47 (100.0%) | 0 (0.0%) |
| Bachelor's Degree or higher | 36 (100.0%) | 0 (0.0%) |
Occupancy by Age of Householder in Woodland Hills
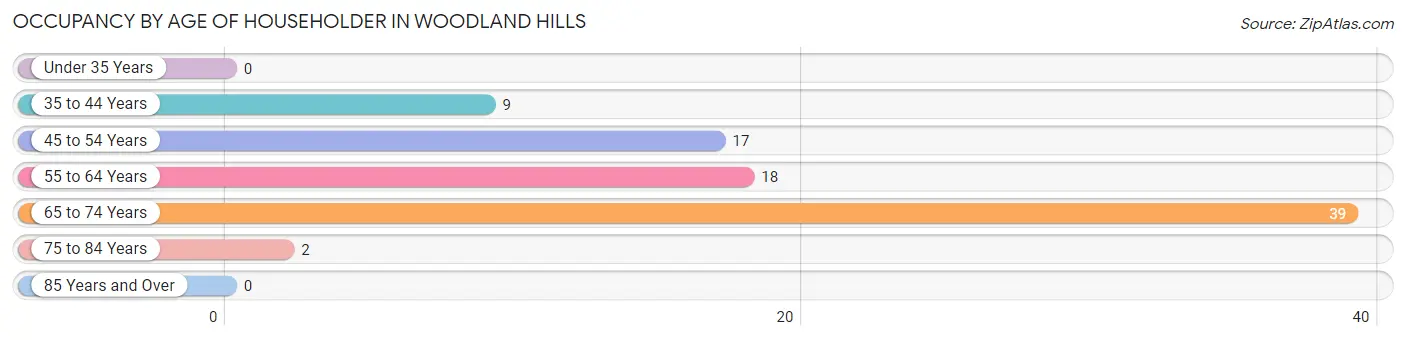
| Age Bracket | # Households | % Households |
| Under 35 Years | 0 | 0.0% |
| 35 to 44 Years | 9 | 10.6% |
| 45 to 54 Years | 17 | 20.0% |
| 55 to 64 Years | 18 | 21.2% |
| 65 to 74 Years | 39 | 45.9% |
| 75 to 84 Years | 2 | 2.4% |
| 85 Years and Over | 0 | 0.0% |
| Total | 85 | 100.0% |
Housing Finances in Woodland Hills
Median Income by Occupancy in Woodland Hills
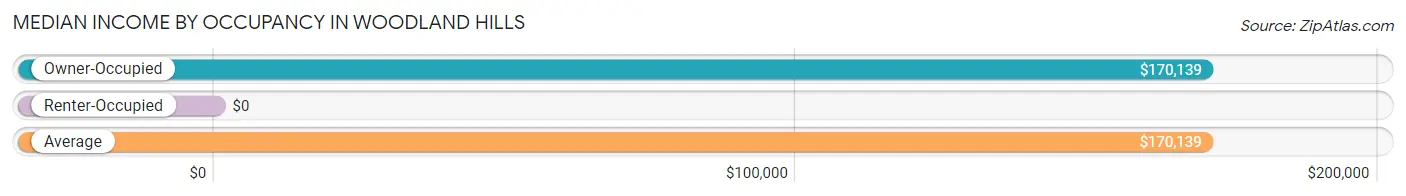
| Occupancy Type | # Households | Median Income |
| Owner-Occupied | 85 (100.0%) | $170,139 |
| Renter-Occupied | 0 (0.0%) | $0 |
| Average | 85 (100.0%) | $170,139 |
Occupancy by Householder Income Bracket in Woodland Hills
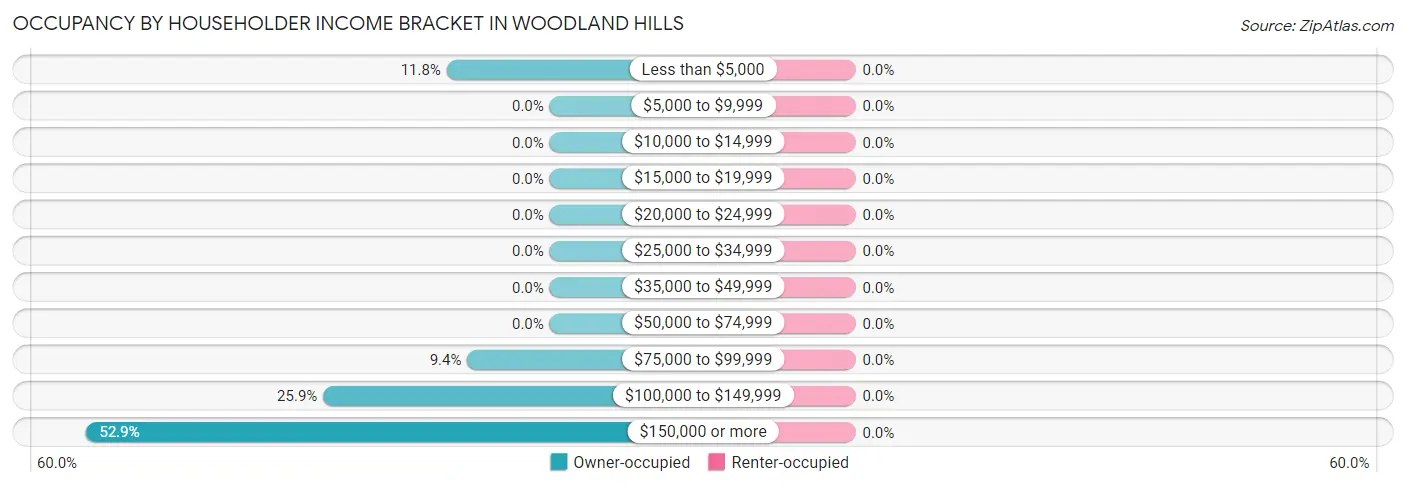
| Income Bracket | Owner-occupied | Renter-occupied |
| Less than $5,000 | 10 (11.8%) | 0 (0.0%) |
| $5,000 to $9,999 | 0 (0.0%) | 0 (0.0%) |
| $10,000 to $14,999 | 0 (0.0%) | 0 (0.0%) |
| $15,000 to $19,999 | 0 (0.0%) | 0 (0.0%) |
| $20,000 to $24,999 | 0 (0.0%) | 0 (0.0%) |
| $25,000 to $34,999 | 0 (0.0%) | 0 (0.0%) |
| $35,000 to $49,999 | 0 (0.0%) | 0 (0.0%) |
| $50,000 to $74,999 | 0 (0.0%) | 0 (0.0%) |
| $75,000 to $99,999 | 8 (9.4%) | 0 (0.0%) |
| $100,000 to $149,999 | 22 (25.9%) | 0 (0.0%) |
| $150,000 or more | 45 (52.9%) | 0 (0.0%) |
| Total | 85 (100.0%) | 0 (0.0%) |
Monthly Housing Cost Tiers in Woodland Hills
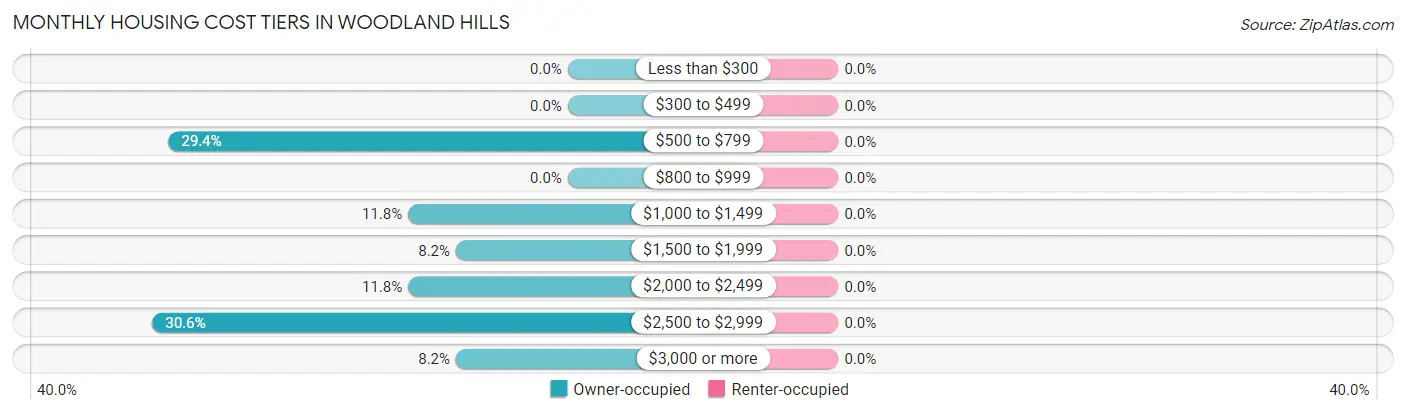
| Monthly Cost | Owner-occupied | Renter-occupied |
| Less than $300 | 0 (0.0%) | 0 (0.0%) |
| $300 to $499 | 0 (0.0%) | 0 (0.0%) |
| $500 to $799 | 25 (29.4%) | 0 (0.0%) |
| $800 to $999 | 0 (0.0%) | 0 (0.0%) |
| $1,000 to $1,499 | 10 (11.8%) | 0 (0.0%) |
| $1,500 to $1,999 | 7 (8.2%) | 0 (0.0%) |
| $2,000 to $2,499 | 10 (11.8%) | 0 (0.0%) |
| $2,500 to $2,999 | 26 (30.6%) | 0 (0.0%) |
| $3,000 or more | 7 (8.2%) | 0 (0.0%) |
| Total | 85 (100.0%) | 0 (0.0%) |
Physical Housing Characteristics in Woodland Hills
Housing Structures in Woodland Hills
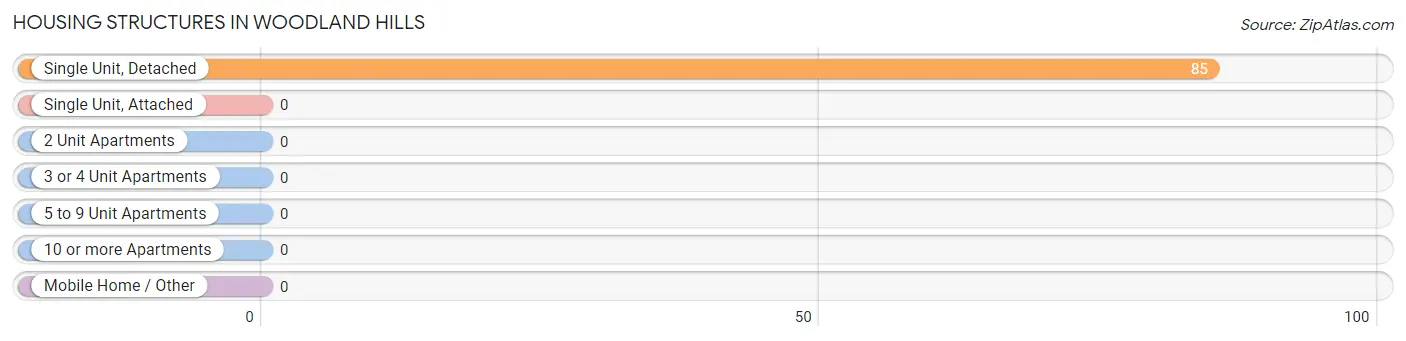
| Structure Type | # Housing Units | % Housing Units |
| Single Unit, Detached | 85 | 100.0% |
| Single Unit, Attached | 0 | 0.0% |
| 2 Unit Apartments | 0 | 0.0% |
| 3 or 4 Unit Apartments | 0 | 0.0% |
| 5 to 9 Unit Apartments | 0 | 0.0% |
| 10 or more Apartments | 0 | 0.0% |
| Mobile Home / Other | 0 | 0.0% |
| Total | 85 | 100.0% |
Housing Structures by Occupancy in Woodland Hills
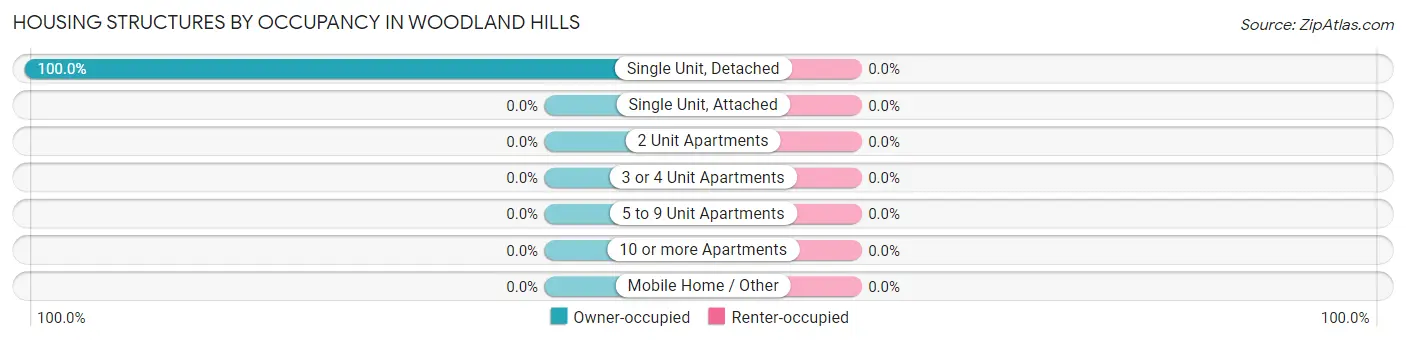
| Structure Type | Owner-occupied | Renter-occupied |
| Single Unit, Detached | 85 (100.0%) | 0 (0.0%) |
| Single Unit, Attached | 0 (0.0%) | 0 (0.0%) |
| 2 Unit Apartments | 0 (0.0%) | 0 (0.0%) |
| 3 or 4 Unit Apartments | 0 (0.0%) | 0 (0.0%) |
| 5 to 9 Unit Apartments | 0 (0.0%) | 0 (0.0%) |
| 10 or more Apartments | 0 (0.0%) | 0 (0.0%) |
| Mobile Home / Other | 0 (0.0%) | 0 (0.0%) |
| Total | 85 (100.0%) | 0 (0.0%) |
Housing Structures by Number of Rooms in Woodland Hills
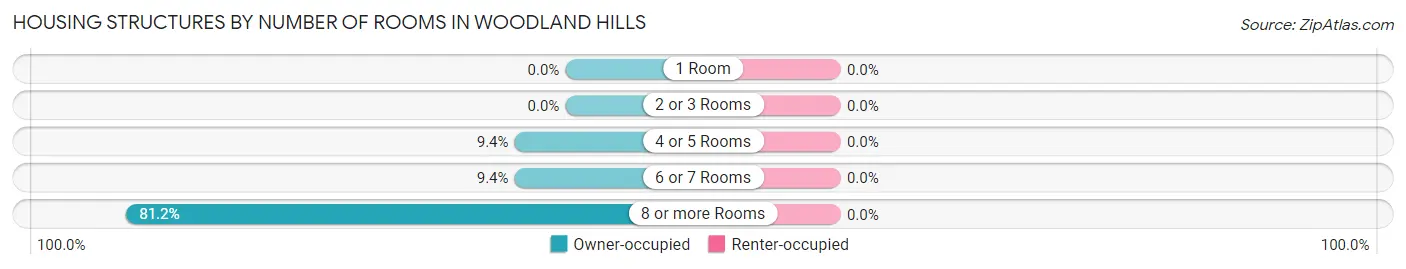
| Number of Rooms | Owner-occupied | Renter-occupied |
| 1 Room | 0 (0.0%) | 0 (0.0%) |
| 2 or 3 Rooms | 0 (0.0%) | 0 (0.0%) |
| 4 or 5 Rooms | 8 (9.4%) | 0 (0.0%) |
| 6 or 7 Rooms | 8 (9.4%) | 0 (0.0%) |
| 8 or more Rooms | 69 (81.2%) | 0 (0.0%) |
| Total | 85 (100.0%) | 0 (0.0%) |
Housing Structure by Heating Type in Woodland Hills
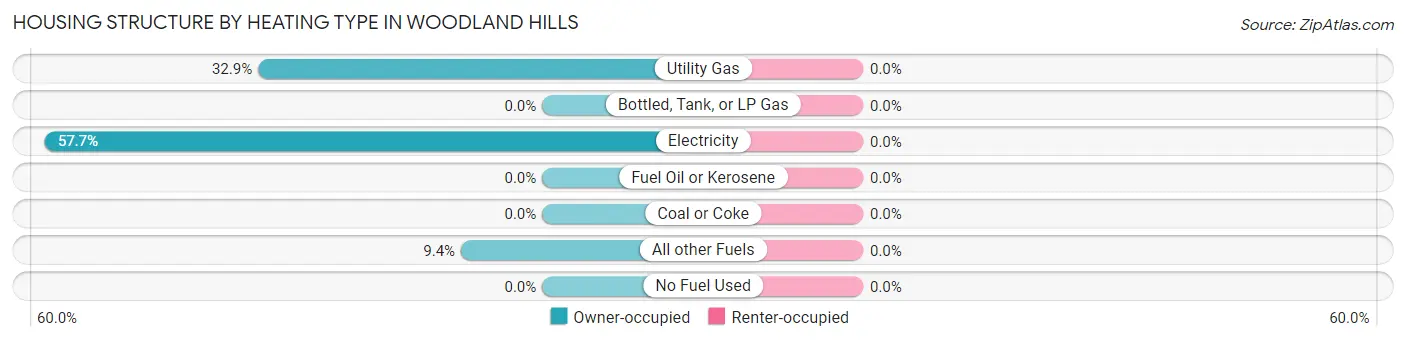
| Heating Type | Owner-occupied | Renter-occupied |
| Utility Gas | 28 (32.9%) | 0 (0.0%) |
| Bottled, Tank, or LP Gas | 0 (0.0%) | 0 (0.0%) |
| Electricity | 49 (57.7%) | 0 (0.0%) |
| Fuel Oil or Kerosene | 0 (0.0%) | 0 (0.0%) |
| Coal or Coke | 0 (0.0%) | 0 (0.0%) |
| All other Fuels | 8 (9.4%) | 0 (0.0%) |
| No Fuel Used | 0 (0.0%) | 0 (0.0%) |
| Total | 85 (100.0%) | 0 (0.0%) |
Household Vehicle Usage in Woodland Hills
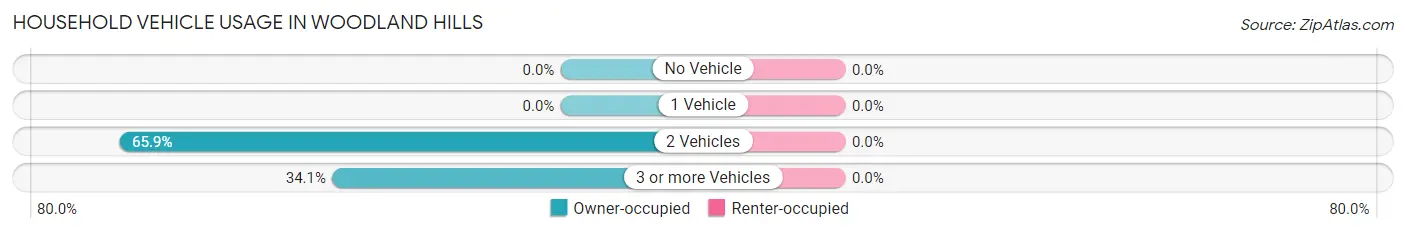
| Vehicles per Household | Owner-occupied | Renter-occupied |
| No Vehicle | 0 (0.0%) | 0 (0.0%) |
| 1 Vehicle | 0 (0.0%) | 0 (0.0%) |
| 2 Vehicles | 56 (65.9%) | 0 (0.0%) |
| 3 or more Vehicles | 29 (34.1%) | 0 (0.0%) |
| Total | 85 (100.0%) | 0 (0.0%) |
Real Estate & Mortgages in Woodland Hills
Real Estate and Mortgage Overview in Woodland Hills
| Characteristic | Without Mortgage | With Mortgage |
| Housing Units | 27 | 58 |
| Median Property Value | $285,500 | $418,800 |
| Median Household Income | - | - |
| Monthly Housing Costs | $739 | $7 |
| Real Estate Taxes | $3,750 | $0 |
Property Value by Mortgage Status in Woodland Hills
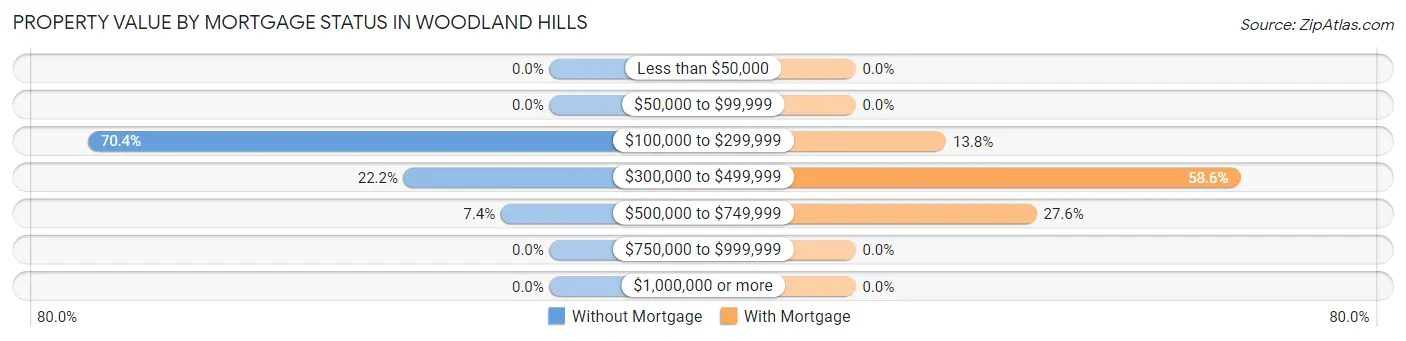
| Property Value | Without Mortgage | With Mortgage |
| Less than $50,000 | 0 (0.0%) | 0 (0.0%) |
| $50,000 to $99,999 | 0 (0.0%) | 0 (0.0%) |
| $100,000 to $299,999 | 19 (70.4%) | 8 (13.8%) |
| $300,000 to $499,999 | 6 (22.2%) | 34 (58.6%) |
| $500,000 to $749,999 | 2 (7.4%) | 16 (27.6%) |
| $750,000 to $999,999 | 0 (0.0%) | 0 (0.0%) |
| $1,000,000 or more | 0 (0.0%) | 0 (0.0%) |
| Total | 27 (100.0%) | 58 (100.0%) |
Household Income by Mortgage Status in Woodland Hills
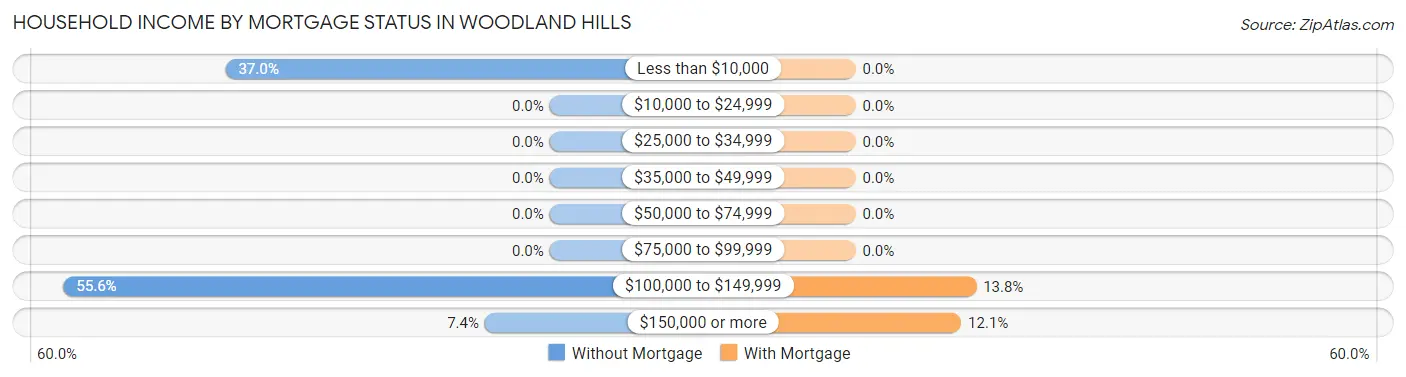
| Household Income | Without Mortgage | With Mortgage |
| Less than $10,000 | 10 (37.0%) | 0 (0.0%) |
| $10,000 to $24,999 | 0 (0.0%) | 0 (0.0%) |
| $25,000 to $34,999 | 0 (0.0%) | 0 (0.0%) |
| $35,000 to $49,999 | 0 (0.0%) | 0 (0.0%) |
| $50,000 to $74,999 | 0 (0.0%) | 0 (0.0%) |
| $75,000 to $99,999 | 0 (0.0%) | 0 (0.0%) |
| $100,000 to $149,999 | 15 (55.6%) | 8 (13.8%) |
| $150,000 or more | 2 (7.4%) | 7 (12.1%) |
| Total | 27 (100.0%) | 58 (100.0%) |
Property Value to Household Income Ratio in Woodland Hills
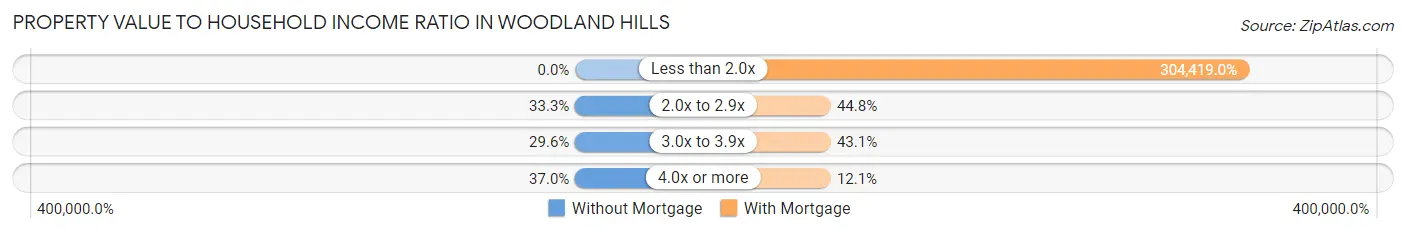
| Value-to-Income Ratio | Without Mortgage | With Mortgage |
| Less than 2.0x | 0 (0.0%) | 176,563 (304,419.0%) |
| 2.0x to 2.9x | 9 (33.3%) | 26 (44.8%) |
| 3.0x to 3.9x | 8 (29.6%) | 25 (43.1%) |
| 4.0x or more | 10 (37.0%) | 7 (12.1%) |
| Total | 27 (100.0%) | 58 (100.0%) |
Real Estate Taxes by Mortgage Status in Woodland Hills
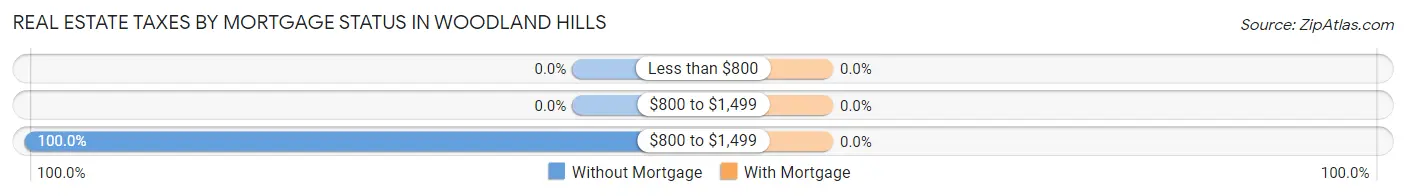
| Property Taxes | Without Mortgage | With Mortgage |
| Less than $800 | 0 (0.0%) | 0 (0.0%) |
| $800 to $1,499 | 0 (0.0%) | 0 (0.0%) |
| $800 to $1,499 | 27 (100.0%) | 0 (0.0%) |
| Total | 27 (100.0%) | 58 (100.0%) |
Health & Disability in Woodland Hills
Health Insurance Coverage by Age in Woodland Hills
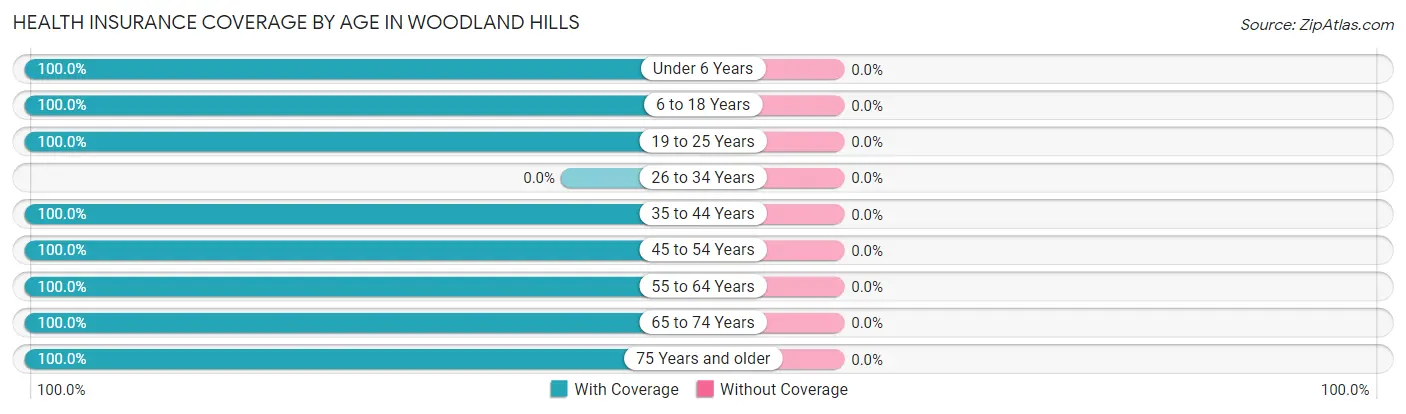
| Age Bracket | With Coverage | Without Coverage |
| Under 6 Years | 37 (100.0%) | 0 (0.0%) |
| 6 to 18 Years | 54 (100.0%) | 0 (0.0%) |
| 19 to 25 Years | 59 (100.0%) | 0 (0.0%) |
| 26 to 34 Years | 0 (0.0%) | 0 (0.0%) |
| 35 to 44 Years | 16 (100.0%) | 0 (0.0%) |
| 45 to 54 Years | 24 (100.0%) | 0 (0.0%) |
| 55 to 64 Years | 44 (100.0%) | 0 (0.0%) |
| 65 to 74 Years | 64 (100.0%) | 0 (0.0%) |
| 75 Years and older | 2 (100.0%) | 0 (0.0%) |
| Total | 300 (100.0%) | 0 (0.0%) |
Health Insurance Coverage by Citizenship Status in Woodland Hills
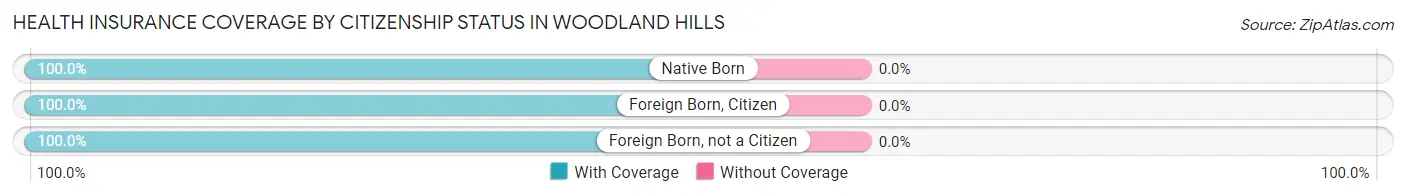
| Citizenship Status | With Coverage | Without Coverage |
| Native Born | 37 (100.0%) | 0 (0.0%) |
| Foreign Born, Citizen | 54 (100.0%) | 0 (0.0%) |
| Foreign Born, not a Citizen | 59 (100.0%) | 0 (0.0%) |
Health Insurance Coverage by Household Income in Woodland Hills
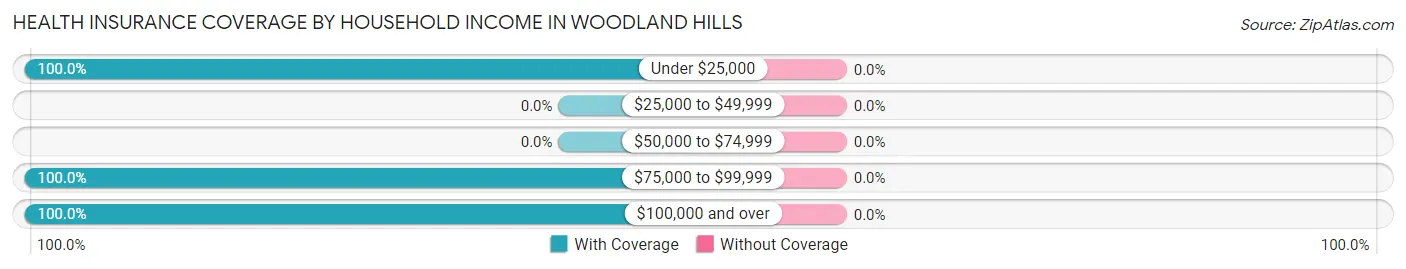
| Household Income | With Coverage | Without Coverage |
| Under $25,000 | 18 (100.0%) | 0 (0.0%) |
| $25,000 to $49,999 | 0 (0.0%) | 0 (0.0%) |
| $50,000 to $74,999 | 0 (0.0%) | 0 (0.0%) |
| $75,000 to $99,999 | 104 (100.0%) | 0 (0.0%) |
| $100,000 and over | 178 (100.0%) | 0 (0.0%) |
Public vs Private Health Insurance Coverage by Age in Woodland Hills
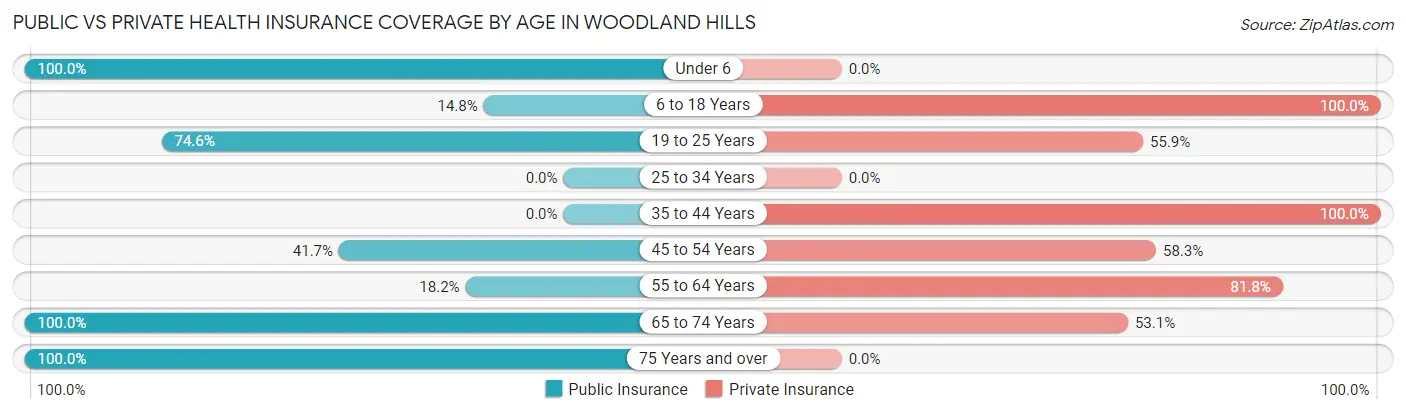
| Age Bracket | Public Insurance | Private Insurance |
| Under 6 | 37 (100.0%) | 0 (0.0%) |
| 6 to 18 Years | 8 (14.8%) | 54 (100.0%) |
| 19 to 25 Years | 44 (74.6%) | 33 (55.9%) |
| 25 to 34 Years | 0 (0.0%) | 0 (0.0%) |
| 35 to 44 Years | 0 (0.0%) | 16 (100.0%) |
| 45 to 54 Years | 10 (41.7%) | 14 (58.3%) |
| 55 to 64 Years | 8 (18.2%) | 36 (81.8%) |
| 65 to 74 Years | 64 (100.0%) | 34 (53.1%) |
| 75 Years and over | 2 (100.0%) | 0 (0.0%) |
| Total | 173 (57.7%) | 187 (62.3%) |
Disability Status by Sex by Age in Woodland Hills
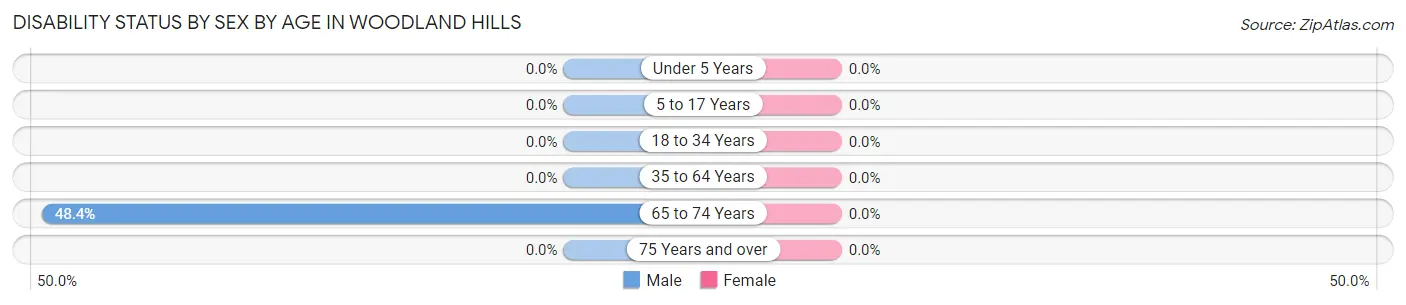
| Age Bracket | Male | Female |
| Under 5 Years | 0 (0.0%) | 0 (0.0%) |
| 5 to 17 Years | 0 (0.0%) | 0 (0.0%) |
| 18 to 34 Years | 0 (0.0%) | 0 (0.0%) |
| 35 to 64 Years | 0 (0.0%) | 0 (0.0%) |
| 65 to 74 Years | 15 (48.4%) | 0 (0.0%) |
| 75 Years and over | 0 (0.0%) | 0 (0.0%) |
Disability Class by Sex by Age in Woodland Hills
Disability Class: Hearing Difficulty
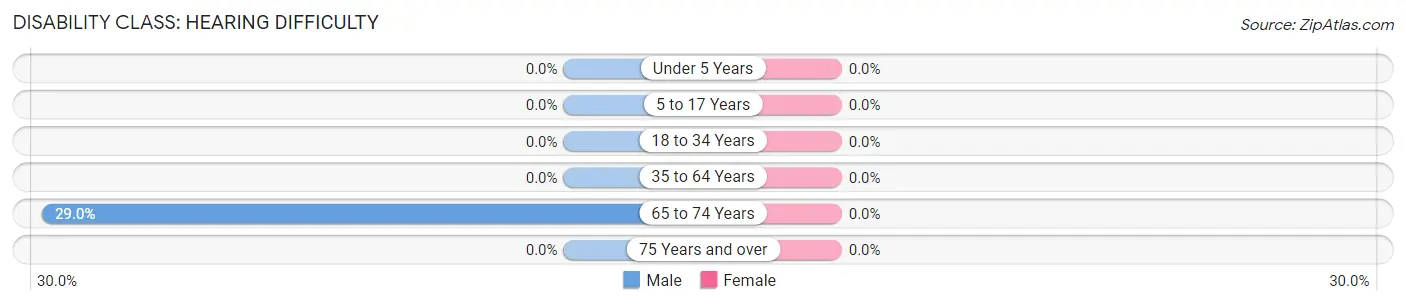
| Age Bracket | Male | Female |
| Under 5 Years | 0 (0.0%) | 0 (0.0%) |
| 5 to 17 Years | 0 (0.0%) | 0 (0.0%) |
| 18 to 34 Years | 0 (0.0%) | 0 (0.0%) |
| 35 to 64 Years | 0 (0.0%) | 0 (0.0%) |
| 65 to 74 Years | 9 (29.0%) | 0 (0.0%) |
| 75 Years and over | 0 (0.0%) | 0 (0.0%) |
Disability Class: Vision Difficulty
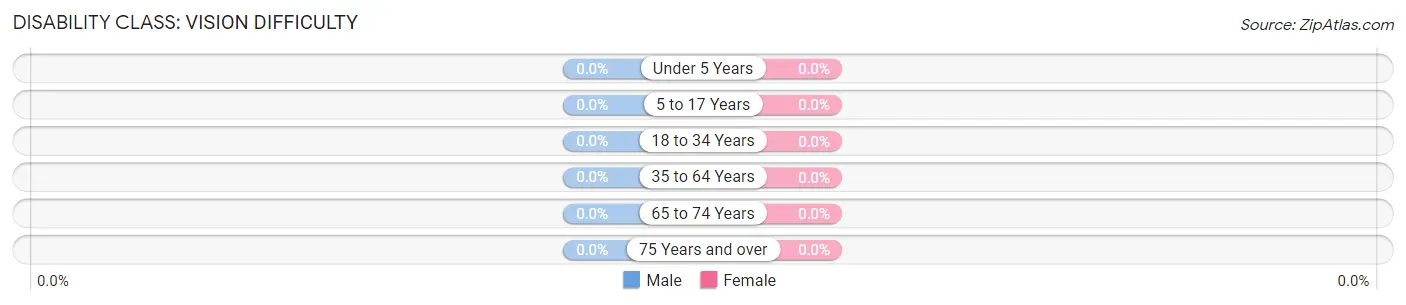
| Age Bracket | Male | Female |
| Under 5 Years | 0 (0.0%) | 0 (0.0%) |
| 5 to 17 Years | 0 (0.0%) | 0 (0.0%) |
| 18 to 34 Years | 0 (0.0%) | 0 (0.0%) |
| 35 to 64 Years | 0 (0.0%) | 0 (0.0%) |
| 65 to 74 Years | 0 (0.0%) | 0 (0.0%) |
| 75 Years and over | 0 (0.0%) | 0 (0.0%) |
Disability Class: Cognitive Difficulty
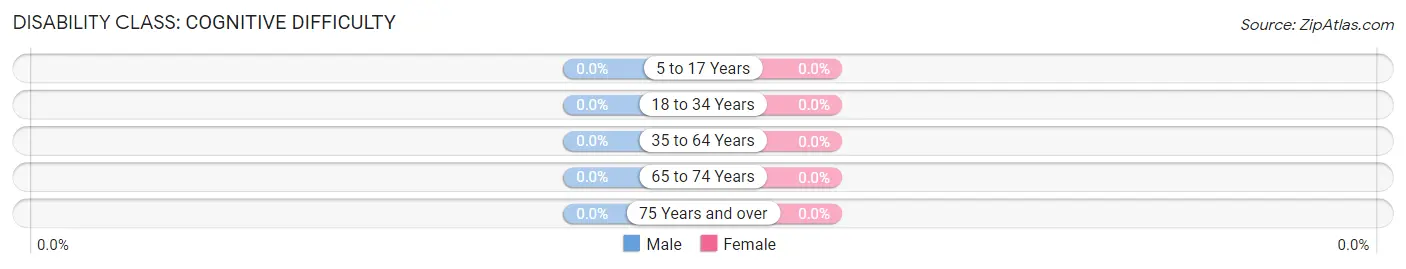
| Age Bracket | Male | Female |
| 5 to 17 Years | 0 (0.0%) | 0 (0.0%) |
| 18 to 34 Years | 0 (0.0%) | 0 (0.0%) |
| 35 to 64 Years | 0 (0.0%) | 0 (0.0%) |
| 65 to 74 Years | 0 (0.0%) | 0 (0.0%) |
| 75 Years and over | 0 (0.0%) | 0 (0.0%) |
Disability Class: Ambulatory Difficulty
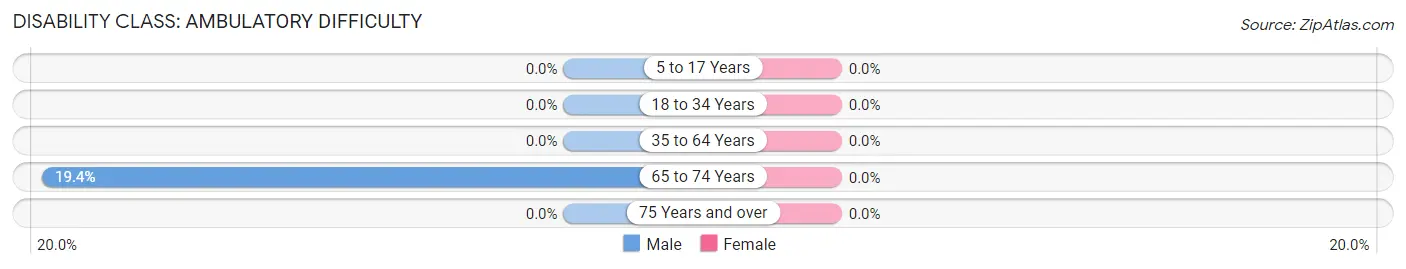
| Age Bracket | Male | Female |
| 5 to 17 Years | 0 (0.0%) | 0 (0.0%) |
| 18 to 34 Years | 0 (0.0%) | 0 (0.0%) |
| 35 to 64 Years | 0 (0.0%) | 0 (0.0%) |
| 65 to 74 Years | 6 (19.4%) | 0 (0.0%) |
| 75 Years and over | 0 (0.0%) | 0 (0.0%) |
Disability Class: Self-Care Difficulty
| Age Bracket | Male | Female |
| 5 to 17 Years | 0 (0.0%) | 0 (0.0%) |
| 18 to 34 Years | 0 (0.0%) | 0 (0.0%) |
| 35 to 64 Years | 0 (0.0%) | 0 (0.0%) |
| 65 to 74 Years | 0 (0.0%) | 0 (0.0%) |
| 75 Years and over | 0 (0.0%) | 0 (0.0%) |
Technology Access in Woodland Hills
Computing Device Access in Woodland Hills
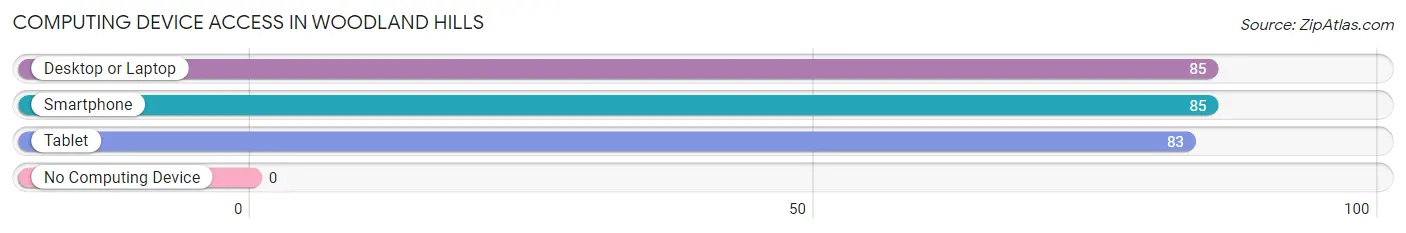
| Device Type | # Households | % Households |
| Desktop or Laptop | 85 | 100.0% |
| Smartphone | 85 | 100.0% |
| Tablet | 83 | 97.7% |
| No Computing Device | 0 | 0.0% |
| Total | 85 | 100.0% |
Internet Access in Woodland Hills
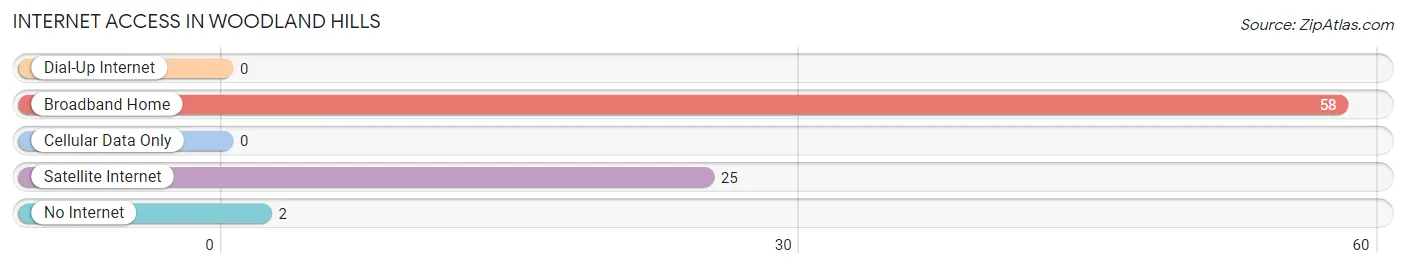
| Internet Type | # Households | % Households |
| Dial-Up Internet | 0 | 0.0% |
| Broadband Home | 58 | 68.2% |
| Cellular Data Only | 0 | 0.0% |
| Satellite Internet | 25 | 29.4% |
| No Internet | 2 | 2.4% |
| Total | 85 | 100.0% |
Woodland Hills Summary
Woodland Hills is a neighborhood located in the northeast corner of Los Angeles, California. It is bordered by the San Fernando Valley to the east, the Santa Monica Mountains to the north, and the city of Calabasas to the west. The neighborhood is home to a diverse population of over 60,000 people, and is known for its affluent lifestyle and high quality of life.
History
Woodland Hills was originally part of the Rancho El Escorpión land grant, which was granted to Francisco Reyes in 1845. The area was later developed by the Los Angeles Suburban Homes Company in the 1920s, and was initially marketed as a rural retreat for wealthy Angelenos. The area was annexed by the City of Los Angeles in 1923, and the first homes were built in the area in the late 1920s.
The area experienced rapid growth in the 1950s and 1960s, and by the 1970s, Woodland Hills had become one of the most affluent neighborhoods in Los Angeles. The area is now home to a variety of businesses, including retail stores, restaurants, and entertainment venues.
Geography
Woodland Hills is located in the northeast corner of Los Angeles, and is bordered by the San Fernando Valley to the east, the Santa Monica Mountains to the north, and the city of Calabasas to the west. The neighborhood is situated at an elevation of approximately 500 feet above sea level, and is located approximately 20 miles from downtown Los Angeles.
The area is characterized by rolling hills and valleys, and is home to a variety of wildlife, including coyotes, bobcats, and mountain lions. The area is also home to a variety of plant life, including oak and sycamore trees, as well as chaparral and sagebrush.
Economy
Woodland Hills is home to a variety of businesses, including retail stores, restaurants, and entertainment venues. The area is also home to a number of corporate offices, including those of the Los Angeles Times, Warner Bros. Records, and the Los Angeles County Department of Health Services.
The area is also home to a number of educational institutions, including Pierce College, California State University Northridge, and the Los Angeles Valley College.
Demographics
As of the 2010 census, the population of Woodland Hills was 60,373. The racial makeup of the area was 57.2% White, 16.3% African American, 0.7% Native American, 16.3% Asian, 0.2% Pacific Islander, and 8.5% from other races. The median household income in the area was $76,843, and the median age was 40.
Woodland Hills is home to a diverse population, and is known for its affluent lifestyle and high quality of life. The area is also home to a variety of cultural attractions, including the Woodland Hills Country Club, the Woodland Hills Recreation Center, and the Woodland Hills Library.
Common Questions
What is Per Capita Income in Woodland Hills?
Per Capita income in Woodland Hills is $49,401.
What is the Median Family Income in Woodland Hills?
Median Family Income in Woodland Hills is $170,139.
What is the Median Household income in Woodland Hills?
Median Household Income in Woodland Hills is $170,139.
What is Income or Wage Gap in Woodland Hills?
Income or Wage Gap in Woodland Hills is 72.6%.
Women in Woodland Hills earn 27.4 cents for every dollar earned by a man.
What is Inequality or Gini Index in Woodland Hills?
Inequality or Gini Index in Woodland Hills is 0.32.
What is the Total Population of Woodland Hills?
Total Population of Woodland Hills is 300.
What is the Total Male Population of Woodland Hills?
Total Male Population of Woodland Hills is 180.
What is the Total Female Population of Woodland Hills?
Total Female Population of Woodland Hills is 120.
What is the Ratio of Males per 100 Females in Woodland Hills?
There are 150.00 Males per 100 Females in Woodland Hills.
What is the Ratio of Females per 100 Males in Woodland Hills?
There are 66.67 Females per 100 Males in Woodland Hills.
What is the Median Population Age in Woodland Hills?
Median Population Age in Woodland Hills is 30.0 Years.
What is the Average Family Size in Woodland Hills
Average Family Size in Woodland Hills is 3.5 People.
What is the Average Household Size in Woodland Hills
Average Household Size in Woodland Hills is 3.5 People.
How Large is the Labor Force in Woodland Hills?
There are 159 People in the Labor Forcein in Woodland Hills.
What is the Percentage of People in the Labor Force in Woodland Hills?
66.0% of People are in the Labor Force in Woodland Hills.