Zip Codes with the Highest Percentage of Population Employed in Food Preparation & Serving in Lincoln, NE
RELATED REPORTS & OPTIONS
Food Preparation & Serving
Lincoln
Compare Zip Codes
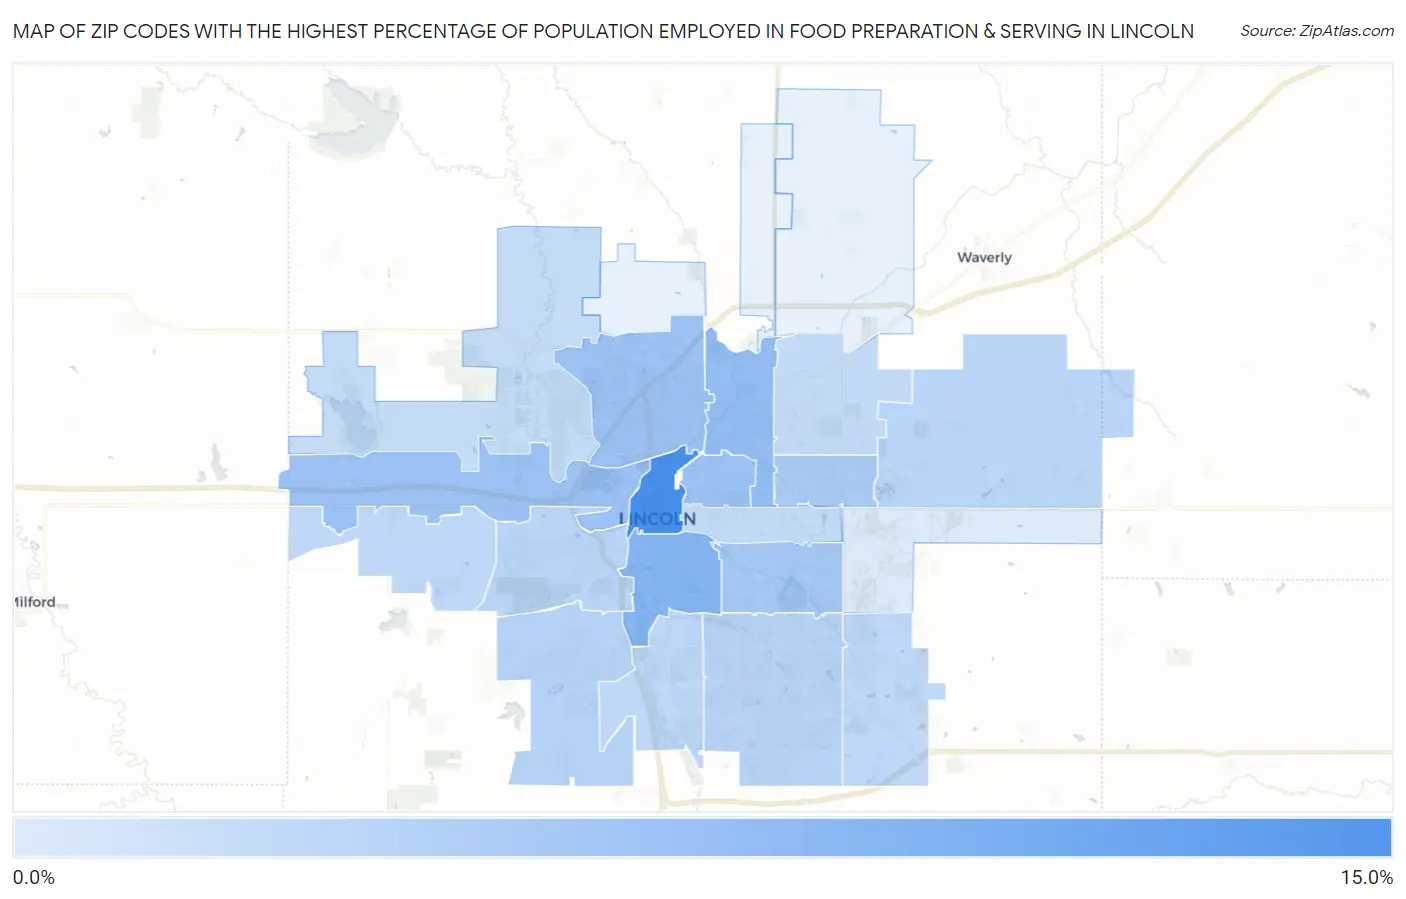
Map of Zip Codes with the Highest Percentage of Population Employed in Food Preparation & Serving in Lincoln
0.73%
13.7%
Zip Codes with the Highest Percentage of Population Employed in Food Preparation & Serving in Lincoln, NE
| Zip Code | % Employed | vs State | vs National | |
| 1. | 68508 | 13.7% | 5.1%(+8.65)#12 | 5.3%(+8.44)#1,228 |
| 2. | 68502 | 8.2% | 5.1%(+3.10)#60 | 5.3%(+2.89)#4,474 |
| 3. | 68504 | 6.9% | 5.1%(+1.78)#98 | 5.3%(+1.57)#6,933 |
| 4. | 68503 | 6.4% | 5.1%(+1.29)#112 | 5.3%(+1.08)#8,237 |
| 5. | 68521 | 6.3% | 5.1%(+1.24)#115 | 5.3%(+1.03)#8,402 |
| 6. | 68528 | 6.1% | 5.1%(+0.988)#122 | 5.3%(+0.779)#9,124 |
| 7. | 68506 | 5.3% | 5.1%(+0.248)#153 | 5.3%(+0.039)#11,670 |
| 8. | 68505 | 4.9% | 5.1%(-0.136)#171 | 5.3%(-0.346)#13,183 |
| 9. | 68523 | 4.0% | 5.1%(-1.06)#221 | 5.3%(-1.27)#17,051 |
| 10. | 68516 | 3.8% | 5.1%(-1.26)#243 | 5.3%(-1.47)#17,879 |
| 11. | 68527 | 3.7% | 5.1%(-1.40)#255 | 5.3%(-1.61)#18,454 |
| 12. | 68522 | 3.5% | 5.1%(-1.55)#268 | 5.3%(-1.76)#19,104 |
| 13. | 68526 | 3.3% | 5.1%(-1.78)#287 | 5.3%(-1.99)#20,107 |
| 14. | 68532 | 3.2% | 5.1%(-1.84)#296 | 5.3%(-2.05)#20,350 |
| 15. | 68512 | 3.2% | 5.1%(-1.85)#298 | 5.3%(-2.06)#20,370 |
| 16. | 68507 | 2.9% | 5.1%(-2.18)#323 | 5.3%(-2.39)#21,671 |
| 17. | 68510 | 2.7% | 5.1%(-2.38)#344 | 5.3%(-2.59)#22,438 |
| 18. | 68524 | 2.6% | 5.1%(-2.47)#352 | 5.3%(-2.67)#22,737 |
| 19. | 68520 | 0.73% | 5.1%(-4.34)#478 | 5.3%(-4.55)#27,408 |
1
Common Questions
What are the Top 10 Zip Codes with the Highest Percentage of Population Employed in Food Preparation & Serving in Lincoln, NE?
Top 10 Zip Codes with the Highest Percentage of Population Employed in Food Preparation & Serving in Lincoln, NE are:
What zip code has the Highest Percentage of Population Employed in Food Preparation & Serving in Lincoln, NE?
68508 has the Highest Percentage of Population Employed in Food Preparation & Serving in Lincoln, NE with 13.7%.
What is the Percentage of Population Employed in Food Preparation & Serving in Lincoln, NE?
Percentage of Population Employed in Food Preparation & Serving in Lincoln is 5.6%.
What is the Percentage of Population Employed in Food Preparation & Serving in Nebraska?
Percentage of Population Employed in Food Preparation & Serving in Nebraska is 5.1%.
What is the Percentage of Population Employed in Food Preparation & Serving in the United States?
Percentage of Population Employed in Food Preparation & Serving in the United States is 5.3%.