Salem, NE Map & Demographics
Salem Map
Salem Overview
$35,448
PER CAPITA INCOME
$53,500
AVG FAMILY INCOME
$44,688
AVG HOUSEHOLD INCOME
50.9%
WAGE / INCOME GAP [ % ]
49.1¢/ $1
WAGE / INCOME GAP [ $ ]
0.43
INEQUALITY / GINI INDEX
88
TOTAL POPULATION
48
MALE POPULATION
40
FEMALE POPULATION
120.00
MALES / 100 FEMALES
83.33
FEMALES / 100 MALES
63.2
MEDIAN AGE
2.6
AVG FAMILY SIZE
2.0
AVG HOUSEHOLD SIZE
21
LABOR FORCE [ PEOPLE ]
26.6%
PERCENT IN LABOR FORCE
Salem Zip Codes
Salem Area Codes
Income in Salem
Income Overview in Salem
Per Capita Income in Salem is $35,448, while median incomes of families and households are $53,500 and $44,688 respectively.
| Characteristic | Number | Measure |
| Per Capita Income | 88 | $35,448 |
| Median Family Income | 26 | $53,500 |
| Mean Family Income | 26 | $67,154 |
| Median Household Income | 44 | $44,688 |
| Mean Household Income | 44 | $64,655 |
| Income Deficit | 26 | $0 |
| Wage / Income Gap (%) | 88 | 50.94% |
| Wage / Income Gap ($) | 88 | 49.06¢ per $1 |
| Gini / Inequality Index | 88 | 0.43 |
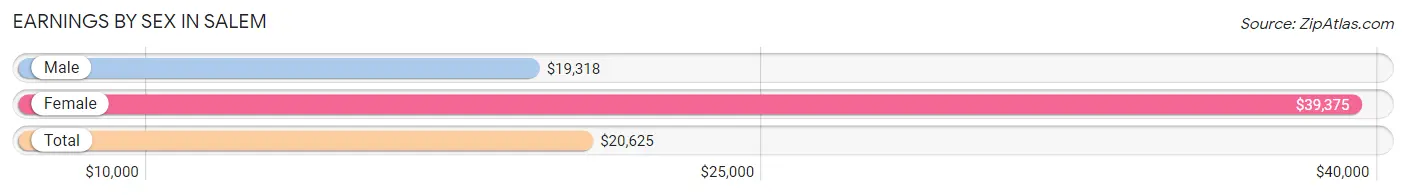
Earnings by Sex in Salem
Average Earnings in Salem are $20,625, $19,318 for men and $39,375 for women, a difference of 50.9%.
| Sex | Number | Average Earnings |
| Male | 32 (74.4%) | $19,318 |
| Female | 11 (25.6%) | $39,375 |
| Total | 43 (100.0%) | $20,625 |
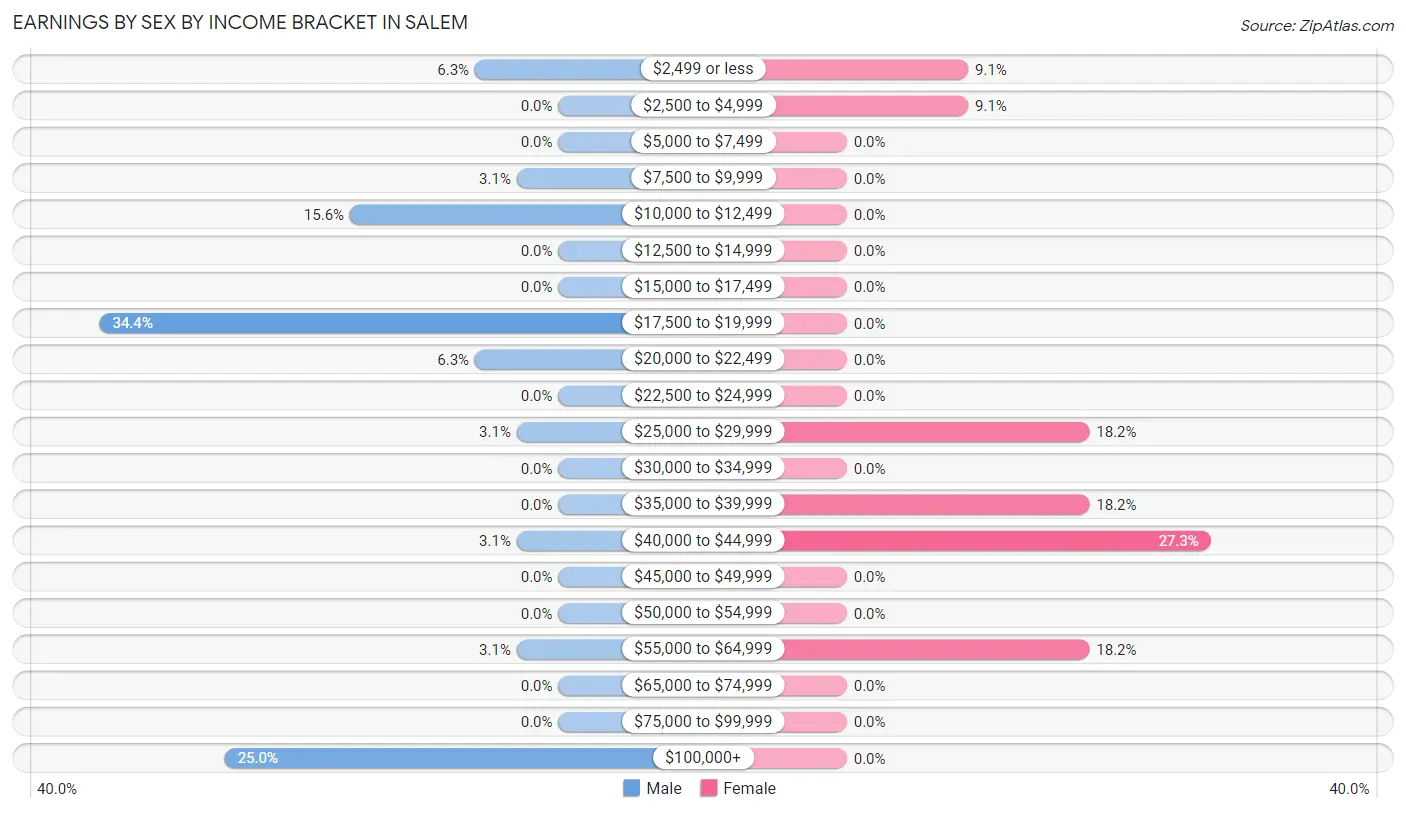
Earnings by Sex by Income Bracket in Salem
The most common earnings brackets in Salem are $17,500 to $19,999 for men (11 | 34.4%) and $40,000 to $44,999 for women (3 | 27.3%).
| Income | Male | Female |
| $2,499 or less | 2 (6.2%) | 1 (9.1%) |
| $2,500 to $4,999 | 0 (0.0%) | 1 (9.1%) |
| $5,000 to $7,499 | 0 (0.0%) | 0 (0.0%) |
| $7,500 to $9,999 | 1 (3.1%) | 0 (0.0%) |
| $10,000 to $12,499 | 5 (15.6%) | 0 (0.0%) |
| $12,500 to $14,999 | 0 (0.0%) | 0 (0.0%) |
| $15,000 to $17,499 | 0 (0.0%) | 0 (0.0%) |
| $17,500 to $19,999 | 11 (34.4%) | 0 (0.0%) |
| $20,000 to $22,499 | 2 (6.2%) | 0 (0.0%) |
| $22,500 to $24,999 | 0 (0.0%) | 0 (0.0%) |
| $25,000 to $29,999 | 1 (3.1%) | 2 (18.2%) |
| $30,000 to $34,999 | 0 (0.0%) | 0 (0.0%) |
| $35,000 to $39,999 | 0 (0.0%) | 2 (18.2%) |
| $40,000 to $44,999 | 1 (3.1%) | 3 (27.3%) |
| $45,000 to $49,999 | 0 (0.0%) | 0 (0.0%) |
| $50,000 to $54,999 | 0 (0.0%) | 0 (0.0%) |
| $55,000 to $64,999 | 1 (3.1%) | 2 (18.2%) |
| $65,000 to $74,999 | 0 (0.0%) | 0 (0.0%) |
| $75,000 to $99,999 | 0 (0.0%) | 0 (0.0%) |
| $100,000+ | 8 (25.0%) | 0 (0.0%) |
| Total | 32 (100.0%) | 11 (100.0%) |
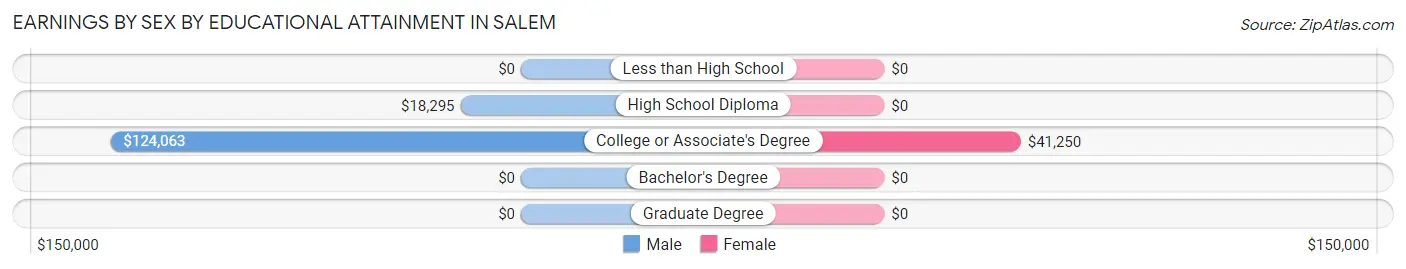
Earnings by Sex by Educational Attainment in Salem
Average earnings in Salem are $19,318 for men and $39,375 for women, a difference of 50.9%. Men with an educational attainment of college or associate's degree enjoy the highest average annual earnings of $124,063, while those with high school diploma education earn the least with $18,295. Women with an educational attainment of college or associate's degree earn the most with the average annual earnings of $41,250, while those with college or associate's degree education have the smallest earnings of $41,250.
| Educational Attainment | Male Income | Female Income |
| Less than High School | - | - |
| High School Diploma | $18,295 | $0 |
| College or Associate's Degree | $124,063 | $41,250 |
| Bachelor's Degree | - | - |
| Graduate Degree | - | - |
| Total | $19,318 | $39,375 |
Family Income in Salem
Family Income Brackets in Salem
According to the Salem family income data, there are 9 families falling into the $35,000 to $49,999 income range, which is the most common income bracket and makes up 34.6% of all families.
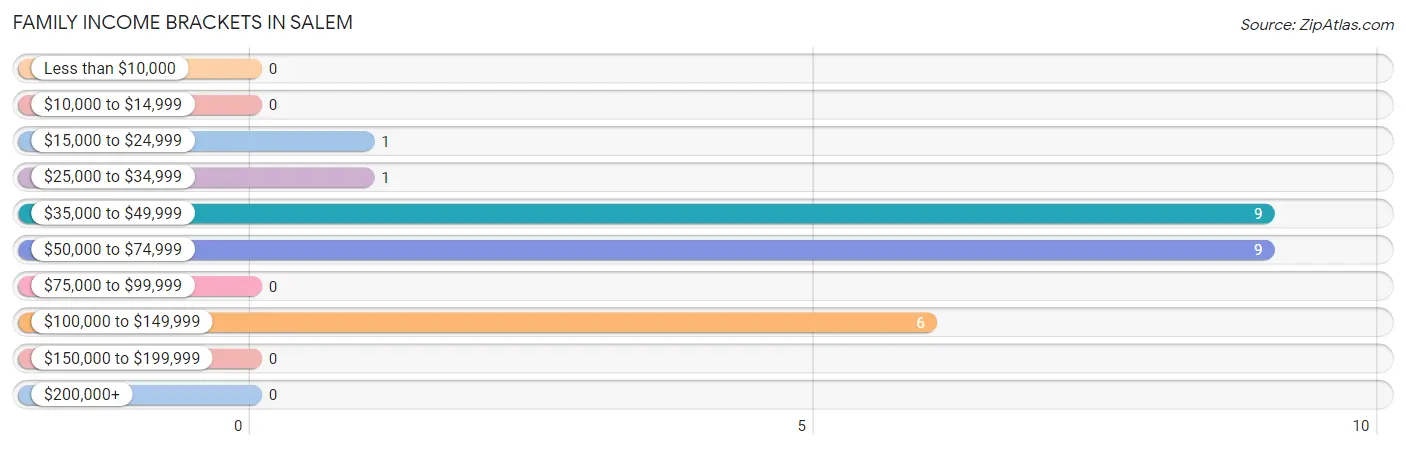
| Income Bracket | # Families | % Families |
| Less than $10,000 | 0 | 0.0% |
| $10,000 to $14,999 | 0 | 0.0% |
| $15,000 to $24,999 | 1 | 3.8% |
| $25,000 to $34,999 | 1 | 3.8% |
| $35,000 to $49,999 | 9 | 34.6% |
| $50,000 to $74,999 | 9 | 34.6% |
| $75,000 to $99,999 | 0 | 0.0% |
| $100,000 to $149,999 | 6 | 23.1% |
| $150,000 to $199,999 | 0 | 0.0% |
| $200,000+ | 0 | 0.0% |
Family Income by Famaliy Size in Salem
2-person families (20 | 76.9%) account for the highest median family income in Salem with $53,000 per family, while 2-person families (20 | 76.9%) have the highest median income of $26,500 per family member.
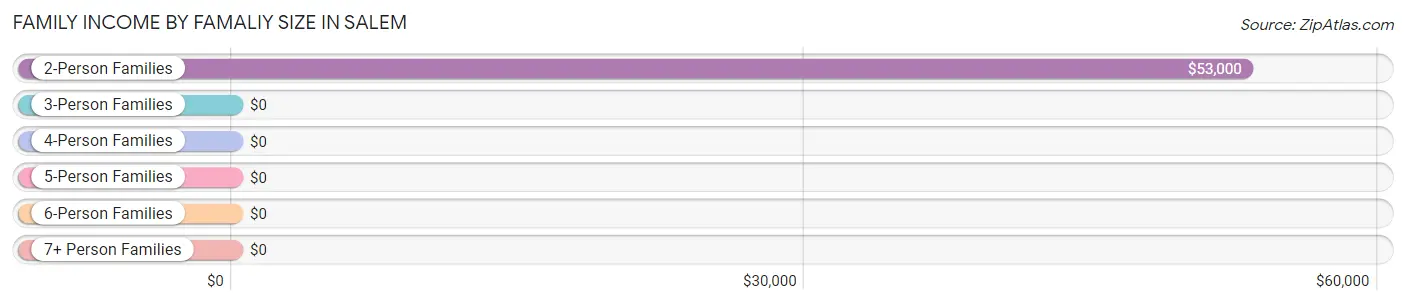
| Income Bracket | # Families | Median Income |
| 2-Person Families | 20 (76.9%) | $53,000 |
| 3-Person Families | 4 (15.4%) | $0 |
| 4-Person Families | 2 (7.7%) | $0 |
| 5-Person Families | 0 (0.0%) | $0 |
| 6-Person Families | 0 (0.0%) | $0 |
| 7+ Person Families | 0 (0.0%) | $0 |
| Total | 26 (100.0%) | $53,500 |
Family Income by Number of Earners in Salem
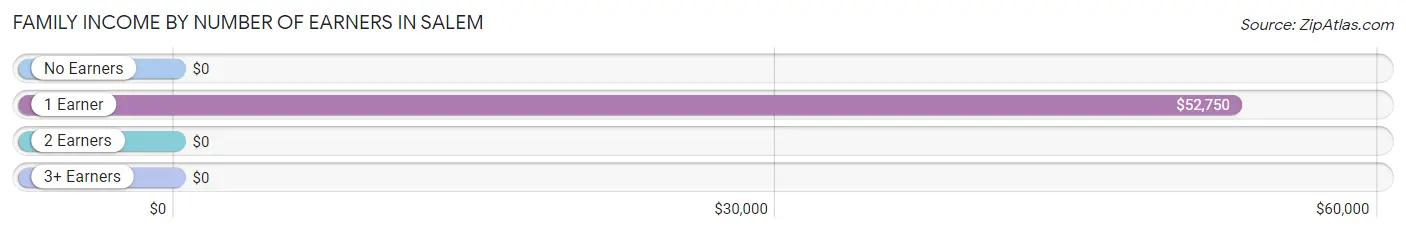
| Number of Earners | # Families | Median Income |
| No Earners | 2 (7.7%) | $0 |
| 1 Earner | 17 (65.4%) | $52,750 |
| 2 Earners | 7 (26.9%) | $0 |
| 3+ Earners | 0 (0.0%) | $0 |
| Total | 26 (100.0%) | $53,500 |
Household Income in Salem
Household Income Brackets in Salem
With 12 households falling in the category, the $35,000 to $49,999 income range is the most frequent in Salem, accounting for 27.3% of all households.
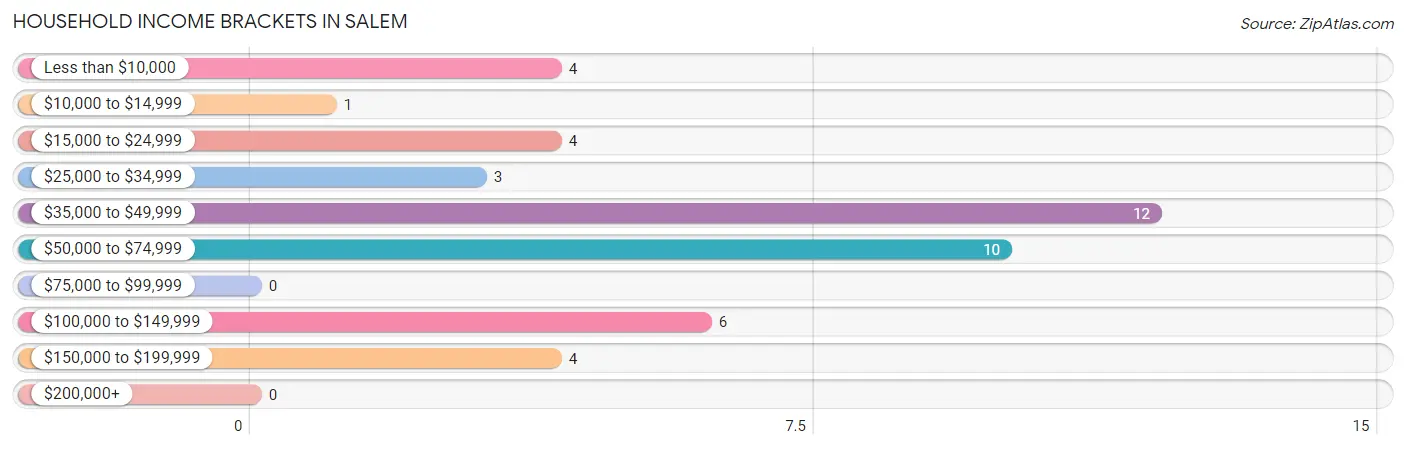
| Income Bracket | # Households | % Households |
| Less than $10,000 | 4 | 9.1% |
| $10,000 to $14,999 | 1 | 2.3% |
| $15,000 to $24,999 | 4 | 9.1% |
| $25,000 to $34,999 | 3 | 6.8% |
| $35,000 to $49,999 | 12 | 27.3% |
| $50,000 to $74,999 | 10 | 22.7% |
| $75,000 to $99,999 | 0 | 0.0% |
| $100,000 to $149,999 | 6 | 13.6% |
| $150,000 to $199,999 | 4 | 9.1% |
| $200,000+ | 0 | 0.0% |
Household Income by Householder Age in Salem
The median household income in Salem is $44,688, with the highest median household income of $35,833 found in the 65+ years age bracket for the primary householder. A total of 24 households (54.5%) fall into this category.
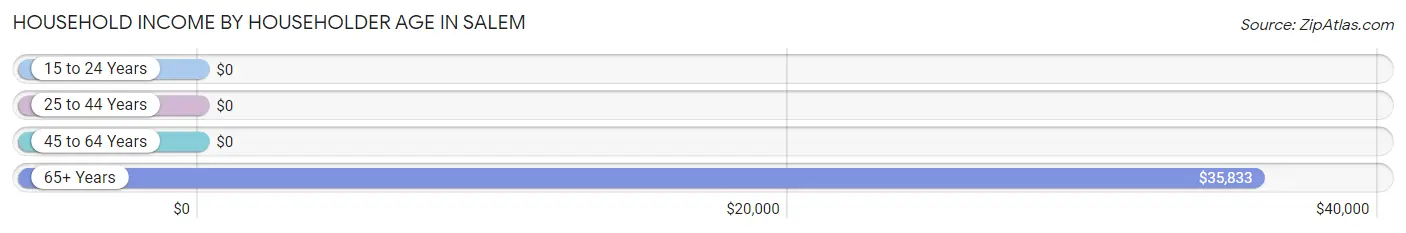
| Income Bracket | # Households | Median Income |
| 15 to 24 Years | 0 (0.0%) | $0 |
| 25 to 44 Years | 4 (9.1%) | $0 |
| 45 to 64 Years | 16 (36.4%) | $0 |
| 65+ Years | 24 (54.5%) | $35,833 |
| Total | 44 (100.0%) | $44,688 |
Poverty in Salem
Income Below Poverty by Sex and Age in Salem
With 6.7% poverty level for males and 15.0% for females among the residents of Salem, 12 to 14 year old males and 65 to 74 year old females are the most vulnerable to poverty, with 1 males (100.0%) and 5 females (33.3%) in their respective age groups living below the poverty level.
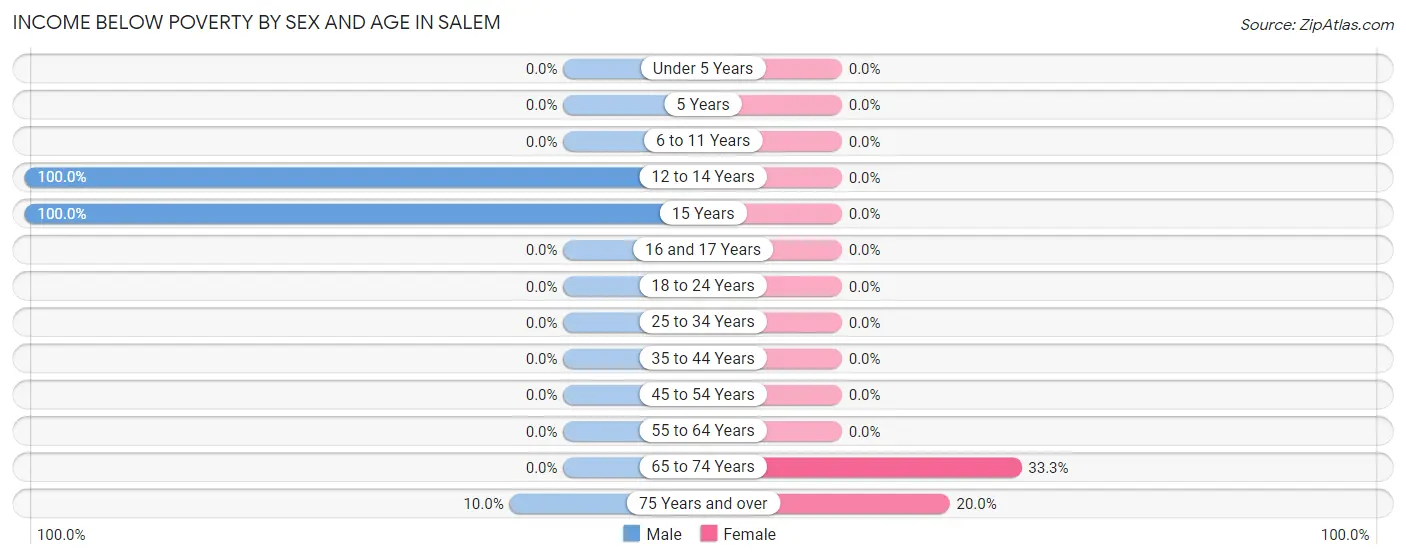
| Age Bracket | Male | Female |
| Under 5 Years | 0 (0.0%) | 0 (0.0%) |
| 5 Years | 0 (0.0%) | 0 (0.0%) |
| 6 to 11 Years | 0 (0.0%) | 0 (0.0%) |
| 12 to 14 Years | 1 (100.0%) | 0 (0.0%) |
| 15 Years | 1 (100.0%) | 0 (0.0%) |
| 16 and 17 Years | 0 (0.0%) | 0 (0.0%) |
| 18 to 24 Years | 0 (0.0%) | 0 (0.0%) |
| 25 to 34 Years | 0 (0.0%) | 0 (0.0%) |
| 35 to 44 Years | 0 (0.0%) | 0 (0.0%) |
| 45 to 54 Years | 0 (0.0%) | 0 (0.0%) |
| 55 to 64 Years | 0 (0.0%) | 0 (0.0%) |
| 65 to 74 Years | 0 (0.0%) | 5 (33.3%) |
| 75 Years and over | 1 (10.0%) | 1 (20.0%) |
| Total | 3 (6.7%) | 6 (15.0%) |
Income Above Poverty by Sex and Age in Salem
According to the poverty statistics in Salem, males aged 6 to 11 years and females aged under 5 years are the age groups that are most secure financially, with 100.0% of males and 100.0% of females in these age groups living above the poverty line.
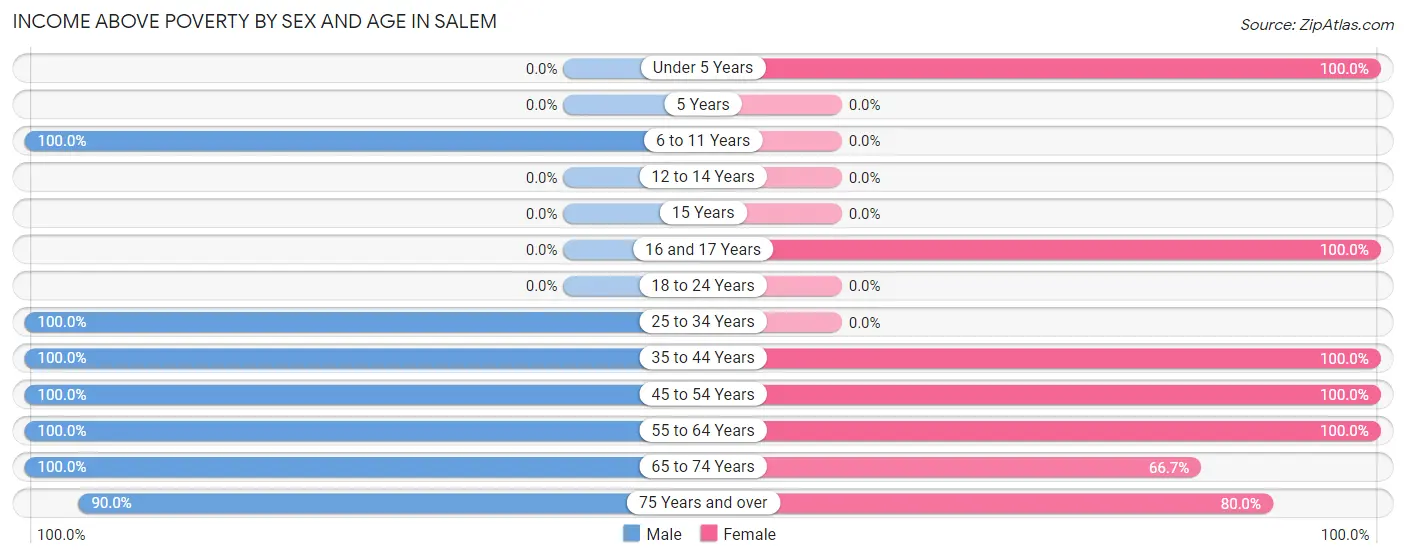
| Age Bracket | Male | Female |
| Under 5 Years | 0 (0.0%) | 1 (100.0%) |
| 5 Years | 0 (0.0%) | 0 (0.0%) |
| 6 to 11 Years | 3 (100.0%) | 0 (0.0%) |
| 12 to 14 Years | 0 (0.0%) | 0 (0.0%) |
| 15 Years | 0 (0.0%) | 0 (0.0%) |
| 16 and 17 Years | 0 (0.0%) | 1 (100.0%) |
| 18 to 24 Years | 0 (0.0%) | 0 (0.0%) |
| 25 to 34 Years | 1 (100.0%) | 0 (0.0%) |
| 35 to 44 Years | 1 (100.0%) | 4 (100.0%) |
| 45 to 54 Years | 9 (100.0%) | 4 (100.0%) |
| 55 to 64 Years | 14 (100.0%) | 10 (100.0%) |
| 65 to 74 Years | 5 (100.0%) | 10 (66.7%) |
| 75 Years and over | 9 (90.0%) | 4 (80.0%) |
| Total | 42 (93.3%) | 34 (85.0%) |
Income Below Poverty Among Married-Couple Families in Salem
The poverty statistics for married-couple families in Salem show that 3.8% or 1 of the total 26 families live below the poverty line. Families with 1 or 2 children have the highest poverty rate of 25.0%, comprising of 1 families. On the other hand, families with no children have the lowest poverty rate of 0.0%, which includes 0 families.
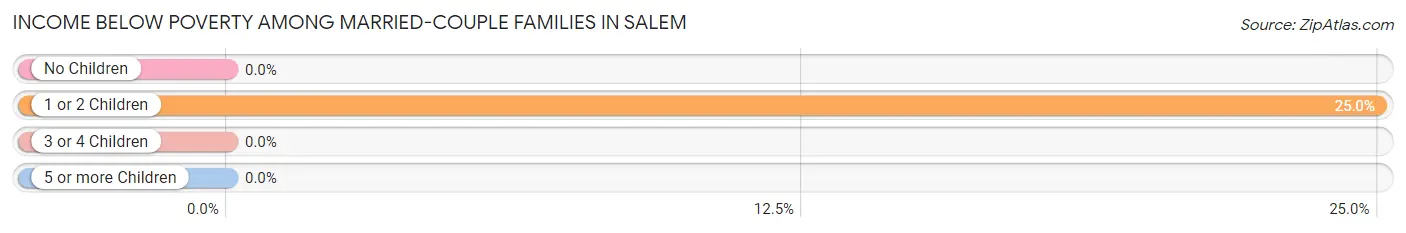
| Children | Above Poverty | Below Poverty |
| No Children | 22 (100.0%) | 0 (0.0%) |
| 1 or 2 Children | 3 (75.0%) | 1 (25.0%) |
| 3 or 4 Children | 0 (0.0%) | 0 (0.0%) |
| 5 or more Children | 0 (0.0%) | 0 (0.0%) |
| Total | 25 (96.2%) | 1 (3.8%) |
Income Below Poverty Among Single-Parent Households in Salem
| Children | Single Father | Single Mother |
| No Children | 0 (0.0%) | 0 (0.0%) |
| 1 or 2 Children | 0 (0.0%) | 0 (0.0%) |
| 3 or 4 Children | 0 (0.0%) | 0 (0.0%) |
| 5 or more Children | 0 (0.0%) | 0 (0.0%) |
| Total | 0 (0.0%) | 0 (0.0%) |
Income Below Poverty Among Married-Couple vs Single-Parent Households in Salem
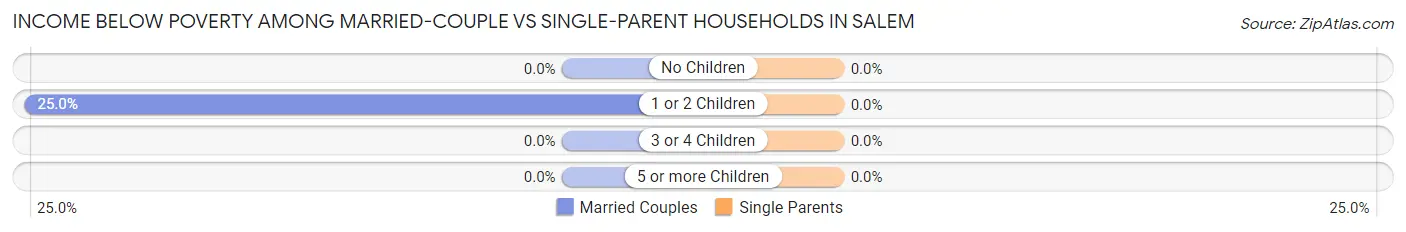
| Children | Married-Couple Families | Single-Parent Households |
| No Children | 0 (0.0%) | 0 (0.0%) |
| 1 or 2 Children | 1 (25.0%) | 0 (0.0%) |
| 3 or 4 Children | 0 (0.0%) | 0 (0.0%) |
| 5 or more Children | 0 (0.0%) | 0 (0.0%) |
| Total | 1 (3.8%) | 0 (0.0%) |
Race in Salem
The most populous races in Salem are White / Caucasian (88 | 100.0%), and Hispanic or Latino (2 | 2.3%).
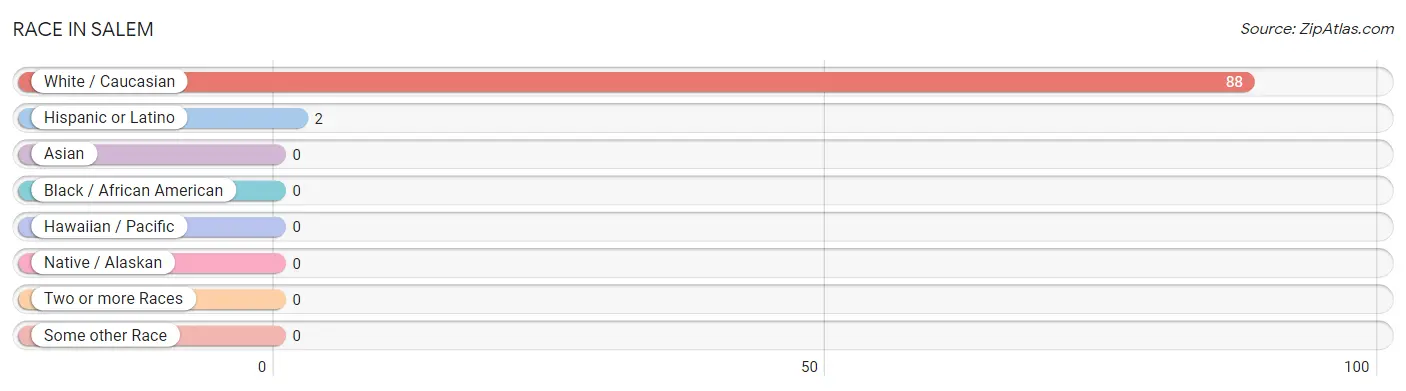
| Race | # Population | % Population |
| Asian | 0 | 0.0% |
| Black / African American | 0 | 0.0% |
| Hawaiian / Pacific | 0 | 0.0% |
| Hispanic or Latino | 2 | 2.3% |
| Native / Alaskan | 0 | 0.0% |
| White / Caucasian | 88 | 100.0% |
| Two or more Races | 0 | 0.0% |
| Some other Race | 0 | 0.0% |
| Total | 88 | 100.0% |
Ancestry in Salem
The most populous ancestries reported in Salem are German (33 | 37.5%), Irish (11 | 12.5%), American (6 | 6.8%), English (4 | 4.5%), and French (4 | 4.5%), together accounting for 65.9% of all Salem residents.
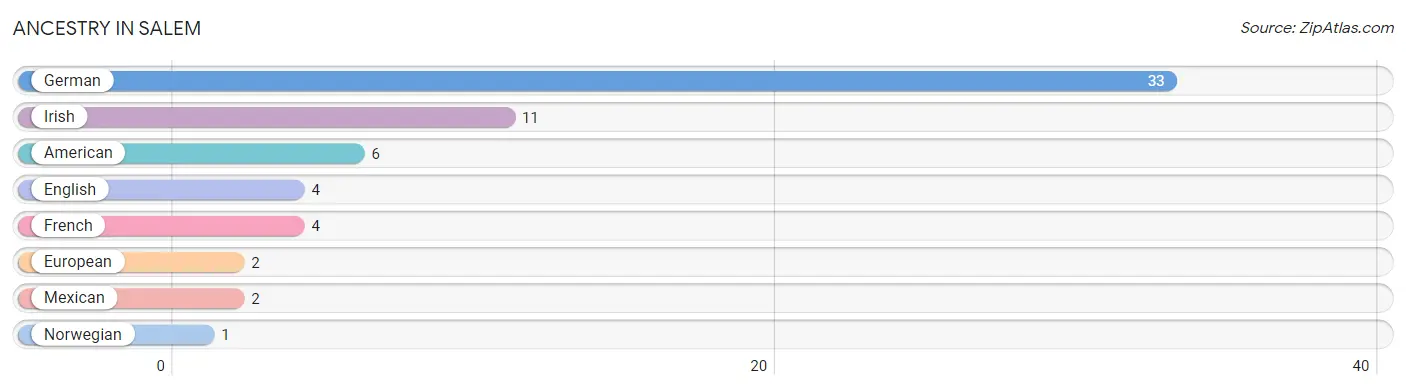
| Ancestry | # Population | % Population |
| American | 6 | 6.8% |
| English | 4 | 4.5% |
| European | 2 | 2.3% |
| French | 4 | 4.5% |
| German | 33 | 37.5% |
| Irish | 11 | 12.5% |
| Mexican | 2 | 2.3% |
| Norwegian | 1 | 1.1% | View All 8 Rows |
Immigrants in Salem

| Immigration Origin | # Population | % Population | View All 0 Rows |
Sex and Age in Salem
Sex and Age in Salem
The most populous age groups in Salem are 60 to 64 Years (11 | 22.9%) for men and 60 to 64 Years (10 | 25.0%) for women.
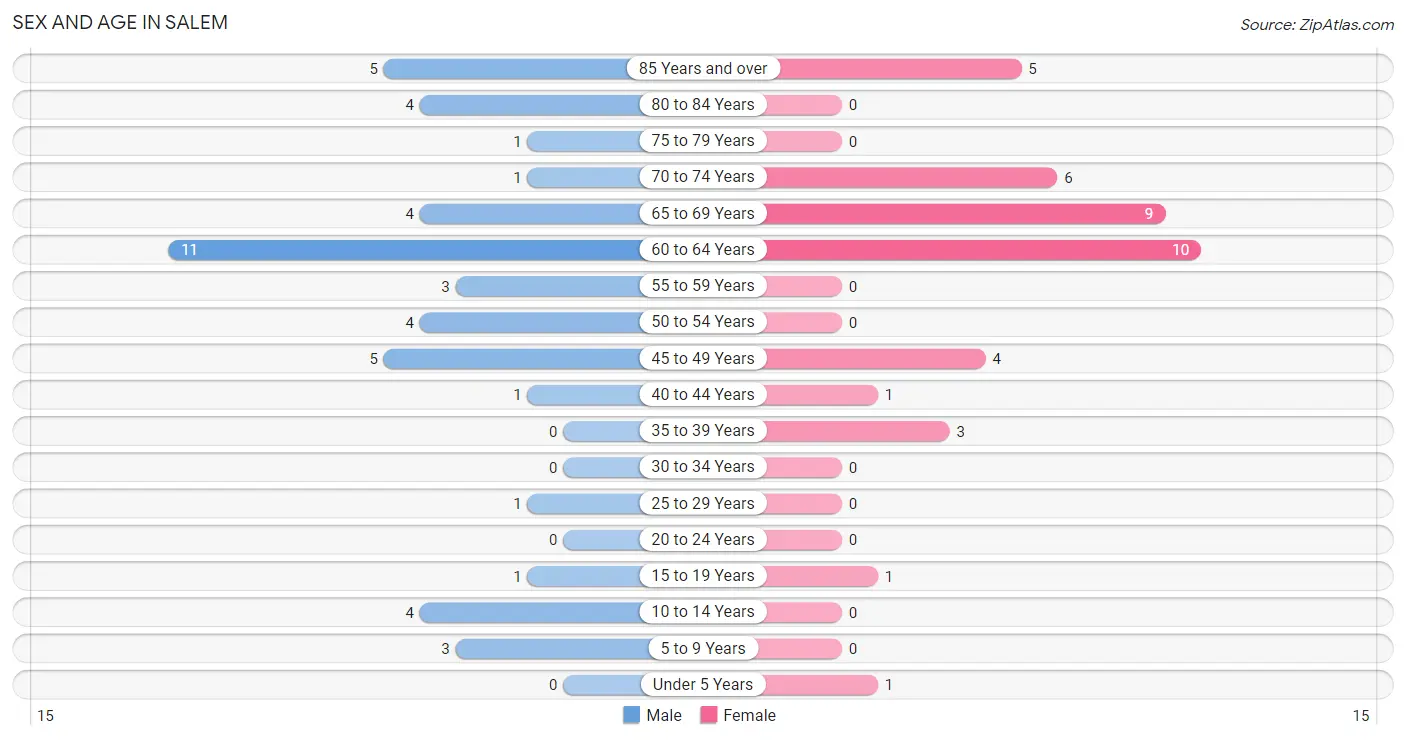
| Age Bracket | Male | Female |
| Under 5 Years | 0 (0.0%) | 1 (2.5%) |
| 5 to 9 Years | 3 (6.2%) | 0 (0.0%) |
| 10 to 14 Years | 4 (8.3%) | 0 (0.0%) |
| 15 to 19 Years | 1 (2.1%) | 1 (2.5%) |
| 20 to 24 Years | 0 (0.0%) | 0 (0.0%) |
| 25 to 29 Years | 1 (2.1%) | 0 (0.0%) |
| 30 to 34 Years | 0 (0.0%) | 0 (0.0%) |
| 35 to 39 Years | 0 (0.0%) | 3 (7.5%) |
| 40 to 44 Years | 1 (2.1%) | 1 (2.5%) |
| 45 to 49 Years | 5 (10.4%) | 4 (10.0%) |
| 50 to 54 Years | 4 (8.3%) | 0 (0.0%) |
| 55 to 59 Years | 3 (6.2%) | 0 (0.0%) |
| 60 to 64 Years | 11 (22.9%) | 10 (25.0%) |
| 65 to 69 Years | 4 (8.3%) | 9 (22.5%) |
| 70 to 74 Years | 1 (2.1%) | 6 (15.0%) |
| 75 to 79 Years | 1 (2.1%) | 0 (0.0%) |
| 80 to 84 Years | 4 (8.3%) | 0 (0.0%) |
| 85 Years and over | 5 (10.4%) | 5 (12.5%) |
| Total | 48 (100.0%) | 40 (100.0%) |
Families and Households in Salem
Median Family Size in Salem
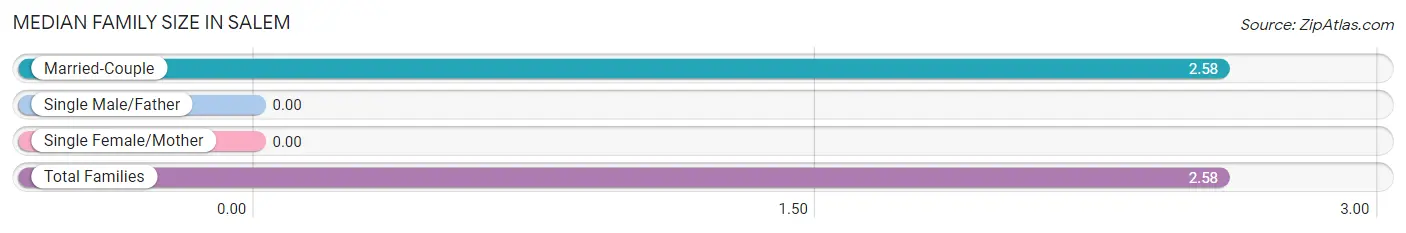
| Family Type | # Families | Family Size |
| Married-Couple | 26 (100.0%) | 2.58 |
| Single Male/Father | 0 (0.0%) | - |
| Single Female/Mother | 0 (0.0%) | - |
| Total Families | 26 (100.0%) | 2.58 |
Median Household Size in Salem
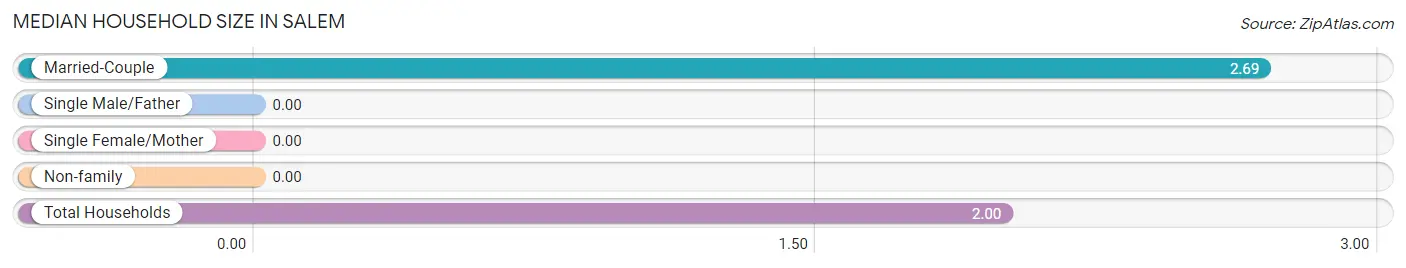
| Household Type | # Households | Household Size |
| Married-Couple | 26 (59.1%) | 2.69 |
| Single Male/Father | 0 (0.0%) | - |
| Single Female/Mother | 0 (0.0%) | - |
| Non-family | 18 (40.9%) | - |
| Total Households | 44 (100.0%) | 2.00 |
Household Size by Marriage Status in Salem
Out of a total of 44 households in Salem, 26 (59.1%) are family households, while 18 (40.9%) are nonfamily households. The most numerous type of family households are 2-person households, comprising 17, and the most common type of nonfamily households are 1-person households, comprising 18.
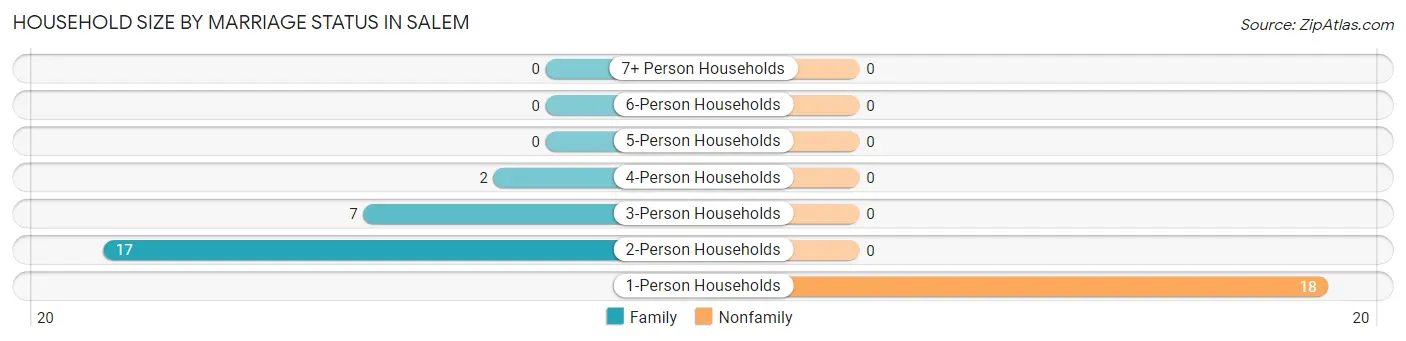
| Household Size | Family Households | Nonfamily Households |
| 1-Person Households | - | 18 (40.9%) |
| 2-Person Households | 17 (38.6%) | 0 (0.0%) |
| 3-Person Households | 7 (15.9%) | 0 (0.0%) |
| 4-Person Households | 2 (4.5%) | 0 (0.0%) |
| 5-Person Households | 0 (0.0%) | 0 (0.0%) |
| 6-Person Households | 0 (0.0%) | 0 (0.0%) |
| 7+ Person Households | 0 (0.0%) | 0 (0.0%) |
| Total | 26 (59.1%) | 18 (40.9%) |
Female Fertility in Salem
Fertility by Age in Salem
| Age Bracket | Women with Births | Births / 1,000 Women |
| 15 to 19 years | 0 (0.0%) | 0.0 |
| 20 to 34 years | 0 (0.0%) | 0.0 |
| 35 to 50 years | 0 (0.0%) | 0.0 |
| Total | 0 (0.0%) | 0.0 |
Fertility by Age by Marriage Status in Salem
| Age Bracket | Married | Unmarried |
| 15 to 19 years | 0 (0.0%) | 0 (0.0%) |
| 20 to 34 years | 0 (0.0%) | 0 (0.0%) |
| 35 to 50 years | 0 (0.0%) | 0 (0.0%) |
| Total | 0 (0.0%) | 0 (0.0%) |
Fertility by Education in Salem
| Educational Attainment | Women with Births | Births / 1,000 Women |
| Less than High School | 0 (0.0%) | 0.0 |
| High School Diploma | 0 (0.0%) | 0.0 |
| College or Associate's Degree | 0 (0.0%) | 0.0 |
| Bachelor's Degree | 0 (0.0%) | 0.0 |
| Graduate Degree | 0 (0.0%) | 0.0 |
| Total | 0 (0.0%) | 0.0 |
Fertility by Education by Marriage Status in Salem
| Educational Attainment | Married | Unmarried |
| Less than High School | 0 (0.0%) | 0 (0.0%) |
| High School Diploma | 0 (0.0%) | 0 (0.0%) |
| College or Associate's Degree | 0 (0.0%) | 0 (0.0%) |
| Bachelor's Degree | 0 (0.0%) | 0 (0.0%) |
| Graduate Degree | 0 (0.0%) | 0 (0.0%) |
| Total | 0 (0.0%) | 0 (0.0%) |
Employment Characteristics in Salem
Employment by Class of Employer in Salem
Among the 19 employed individuals in Salem, private company employees (14 | 73.7%), self-employed (incorporated) (4 | 21.0%), and local government employees (1 | 5.3%) make up the most common classes of employment.
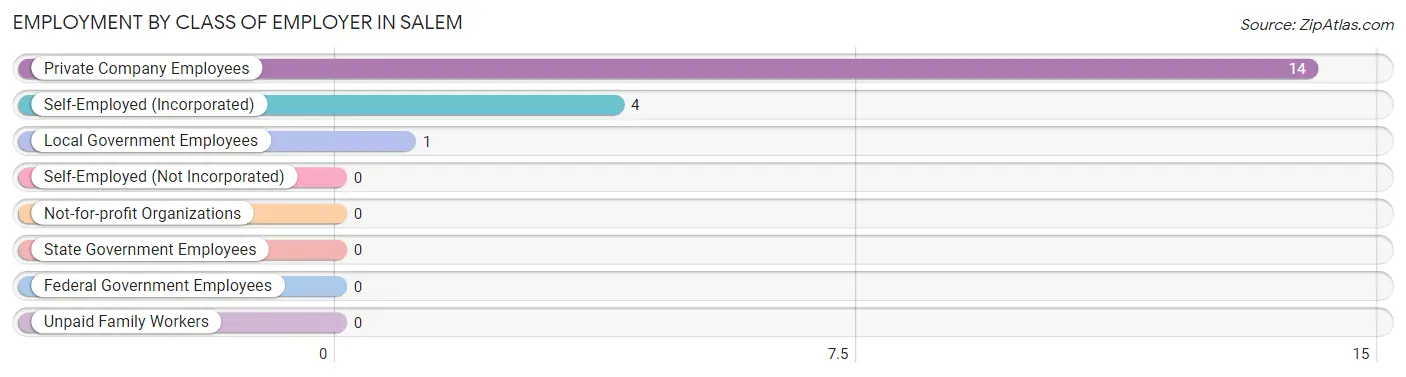
| Employer Class | # Employees | % Employees |
| Private Company Employees | 14 | 73.7% |
| Self-Employed (Incorporated) | 4 | 21.0% |
| Self-Employed (Not Incorporated) | 0 | 0.0% |
| Not-for-profit Organizations | 0 | 0.0% |
| Local Government Employees | 1 | 5.3% |
| State Government Employees | 0 | 0.0% |
| Federal Government Employees | 0 | 0.0% |
| Unpaid Family Workers | 0 | 0.0% |
| Total | 19 | 100.0% |
Employment Status by Age in Salem
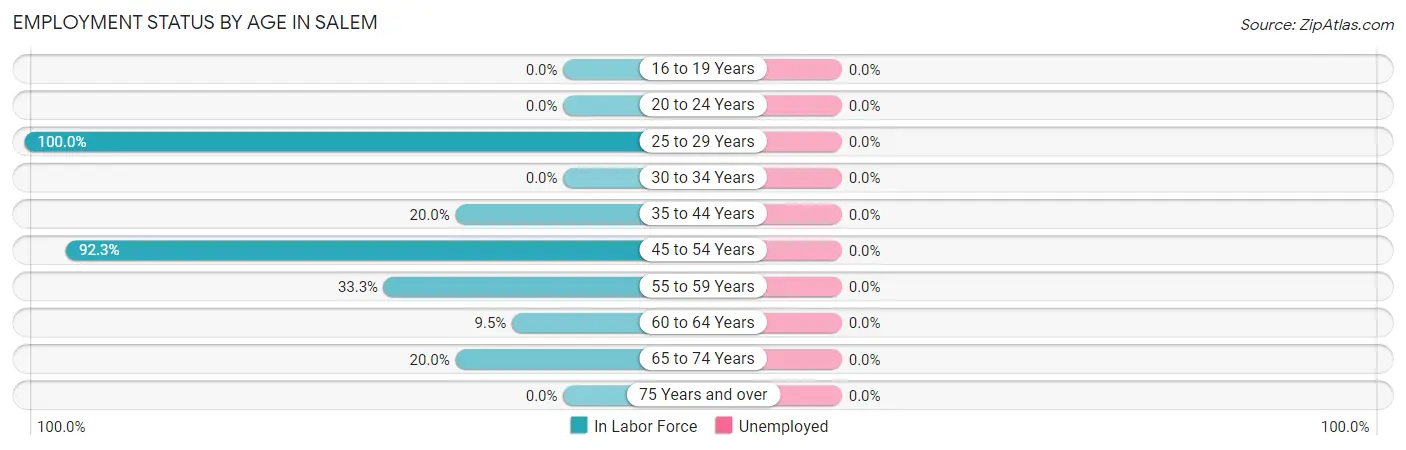
| Age Bracket | In Labor Force | Unemployed |
| 16 to 19 Years | 0 (0.0%) | 0 (0.0%) |
| 20 to 24 Years | 0 (0.0%) | 0 (0.0%) |
| 25 to 29 Years | 1 (100.0%) | 0 (0.0%) |
| 30 to 34 Years | 0 (0.0%) | 0 (0.0%) |
| 35 to 44 Years | 1 (20.0%) | 0 (0.0%) |
| 45 to 54 Years | 12 (92.3%) | 0 (0.0%) |
| 55 to 59 Years | 1 (33.3%) | 0 (0.0%) |
| 60 to 64 Years | 2 (9.5%) | 0 (0.0%) |
| 65 to 74 Years | 4 (20.0%) | 0 (0.0%) |
| 75 Years and over | 0 (0.0%) | 0 (0.0%) |
| Total | 21 (26.6%) | 0 (0.0%) |
Employment Status by Educational Attainment in Salem
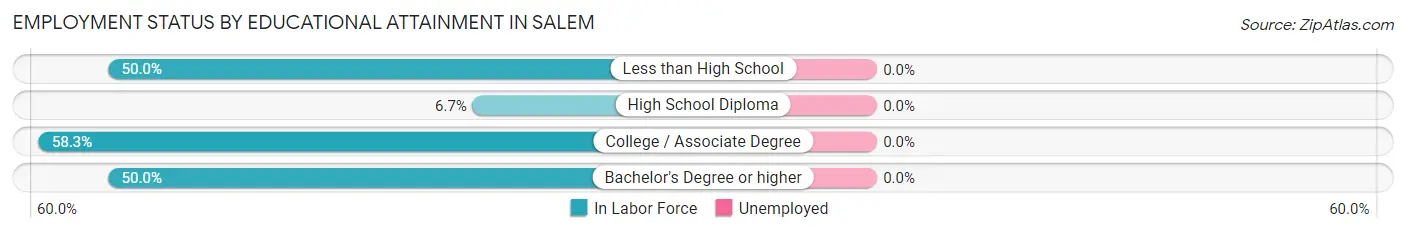
| Educational Attainment | In Labor Force | Unemployed |
| Less than High School | 1 (50.0%) | 0 (0.0%) |
| High School Diploma | 1 (6.7%) | 0 (0.0%) |
| College / Associate Degree | 14 (58.3%) | 0 (0.0%) |
| Bachelor's Degree or higher | 1 (50.0%) | 0 (0.0%) |
| Total | 17 (39.5%) | 0 (0.0%) |
Employment Occupations by Sex in Salem
Management, Business, Science and Arts Occupations
The most common Management, Business, Science and Arts occupations in Salem are Health Diagnosing & Treating (2 | 9.5%), Community & Social Service (1 | 4.8%), and Education Instruction & Library (1 | 4.8%).
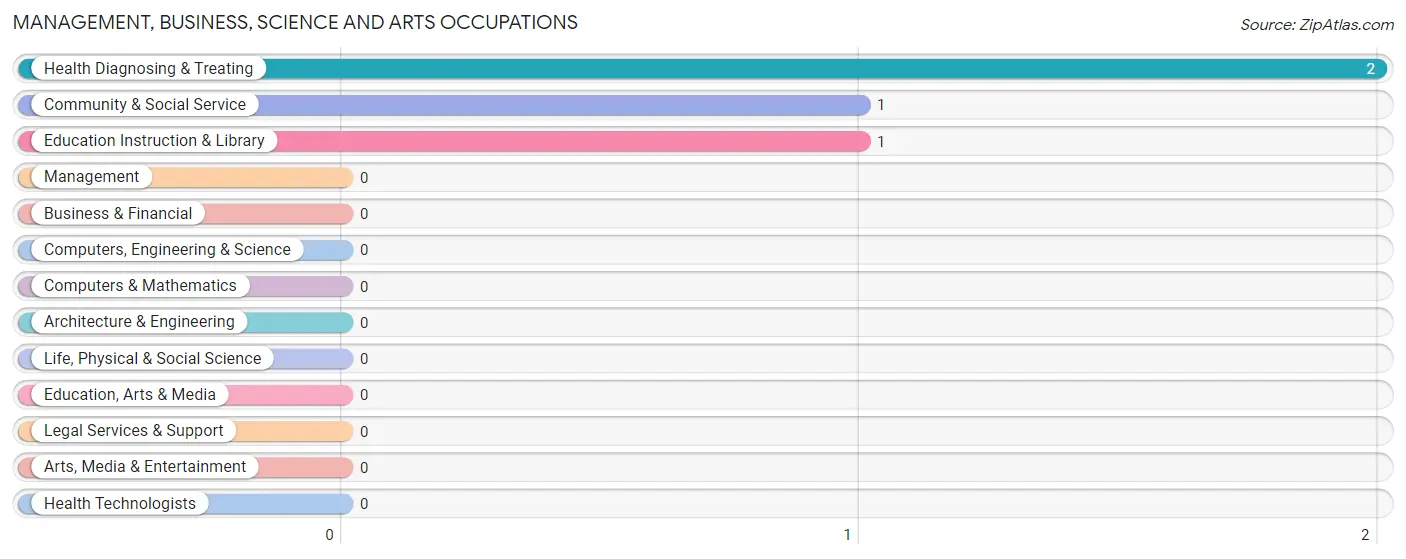
Management, Business, Science and Arts Occupations by Sex
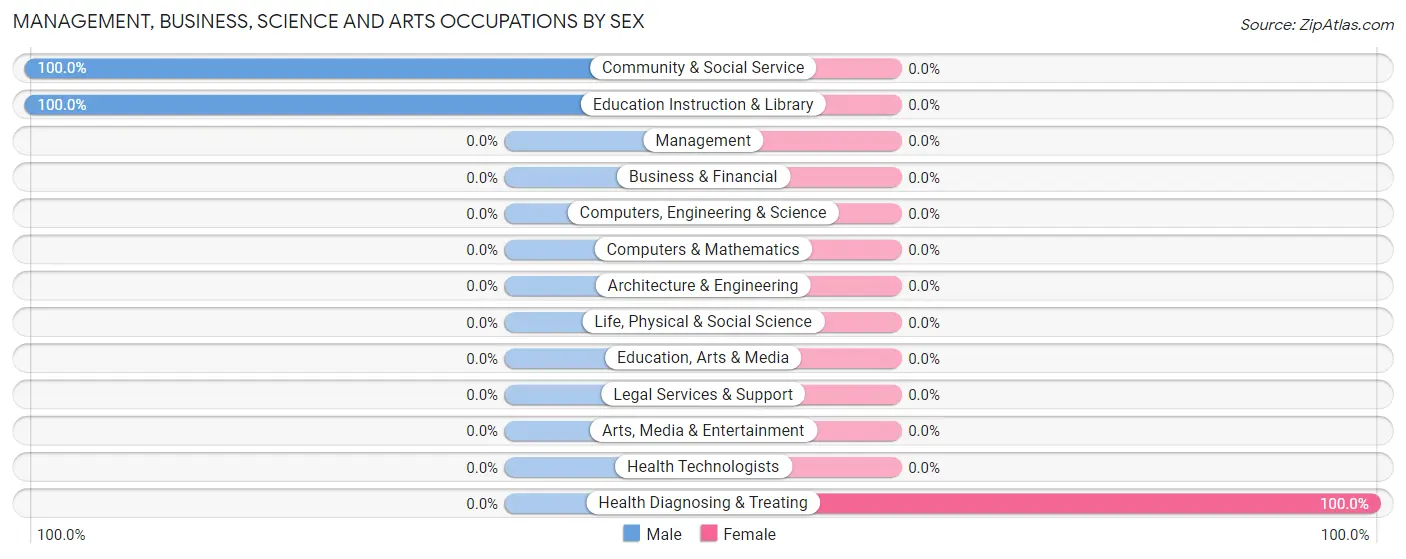
| Occupation | Male | Female |
| Management | 0 (0.0%) | 0 (0.0%) |
| Business & Financial | 0 (0.0%) | 0 (0.0%) |
| Computers, Engineering & Science | 0 (0.0%) | 0 (0.0%) |
| Computers & Mathematics | 0 (0.0%) | 0 (0.0%) |
| Architecture & Engineering | 0 (0.0%) | 0 (0.0%) |
| Life, Physical & Social Science | 0 (0.0%) | 0 (0.0%) |
| Community & Social Service | 1 (100.0%) | 0 (0.0%) |
| Education, Arts & Media | 0 (0.0%) | 0 (0.0%) |
| Legal Services & Support | 0 (0.0%) | 0 (0.0%) |
| Education Instruction & Library | 1 (100.0%) | 0 (0.0%) |
| Arts, Media & Entertainment | 0 (0.0%) | 0 (0.0%) |
| Health Diagnosing & Treating | 0 (0.0%) | 2 (100.0%) |
| Health Technologists | 0 (0.0%) | 0 (0.0%) |
| Total (Category) | 1 (33.3%) | 2 (66.7%) |
| Total (Overall) | 12 (57.1%) | 9 (42.9%) |
Services Occupations
The most common Services occupations in Salem are Food Preparation & Serving (2 | 9.5%), and Cleaning & Maintenance (2 | 9.5%).
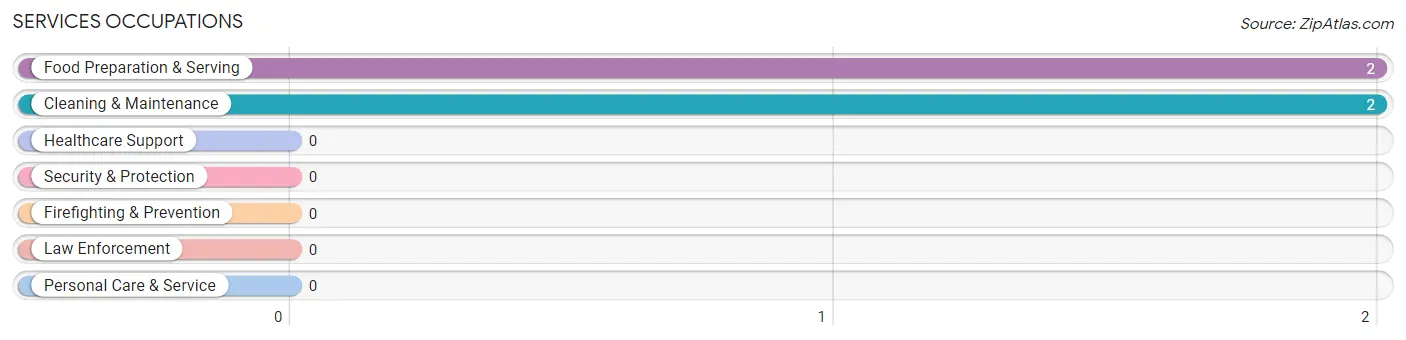
Services Occupations by Sex
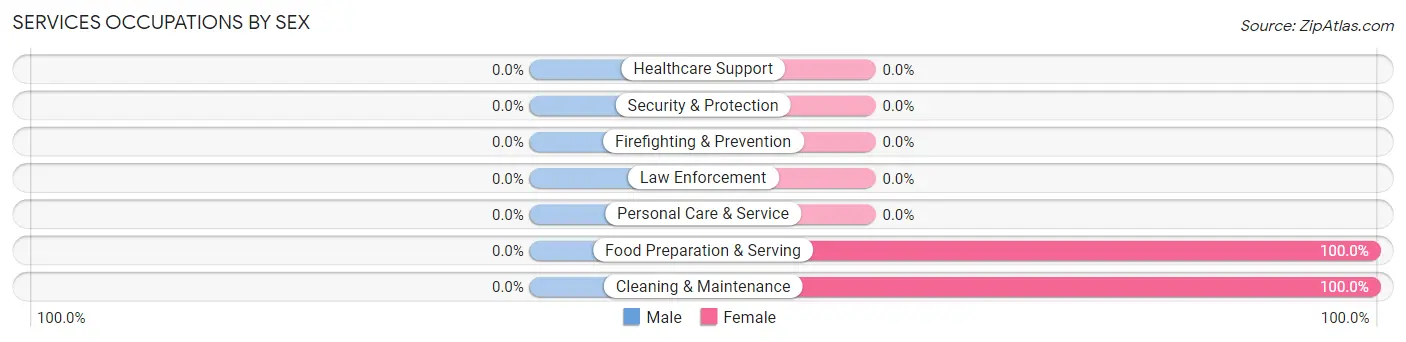
| Occupation | Male | Female |
| Healthcare Support | 0 (0.0%) | 0 (0.0%) |
| Security & Protection | 0 (0.0%) | 0 (0.0%) |
| Firefighting & Prevention | 0 (0.0%) | 0 (0.0%) |
| Law Enforcement | 0 (0.0%) | 0 (0.0%) |
| Food Preparation & Serving | 0 (0.0%) | 2 (100.0%) |
| Cleaning & Maintenance | 0 (0.0%) | 2 (100.0%) |
| Personal Care & Service | 0 (0.0%) | 0 (0.0%) |
| Total (Category) | 0 (0.0%) | 4 (100.0%) |
| Total (Overall) | 12 (57.1%) | 9 (42.9%) |
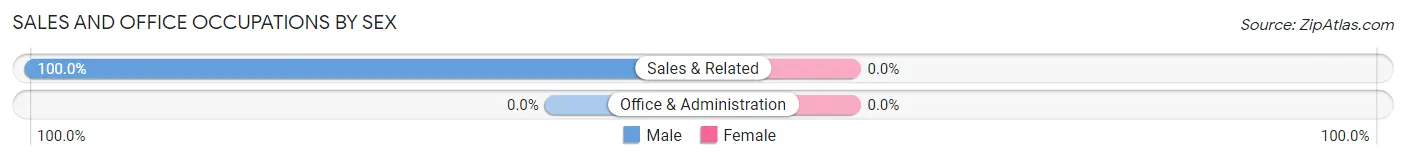
Sales and Office Occupations
The most common Sales and Office occupations in Salem are , and Sales & Related (1 | 4.8%).
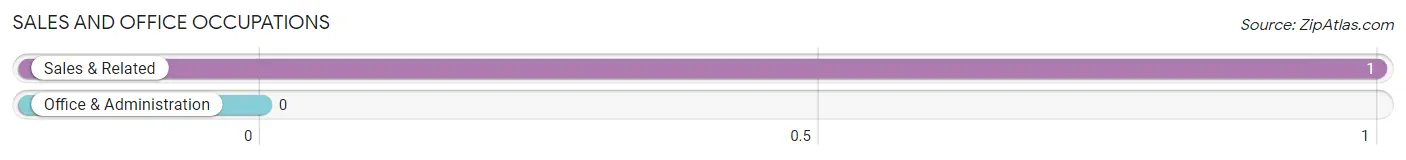
Sales and Office Occupations by Sex
| Occupation | Male | Female |
| Sales & Related | 1 (100.0%) | 0 (0.0%) |
| Office & Administration | 0 (0.0%) | 0 (0.0%) |
| Total (Category) | 1 (100.0%) | 0 (0.0%) |
| Total (Overall) | 12 (57.1%) | 9 (42.9%) |
Natural Resources, Construction and Maintenance Occupations
The most common Natural Resources, Construction and Maintenance occupations in Salem are , and Construction & Extraction (4 | 19.1%).
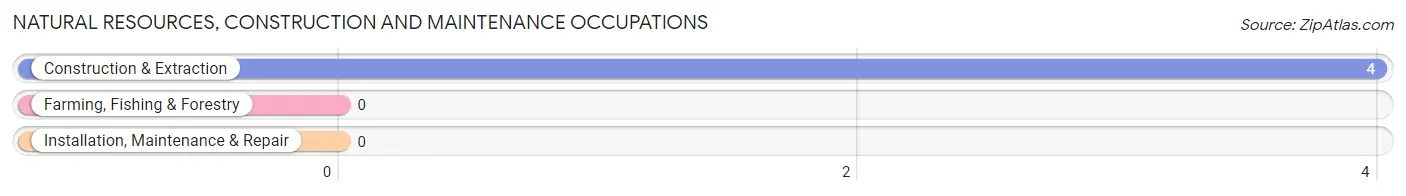
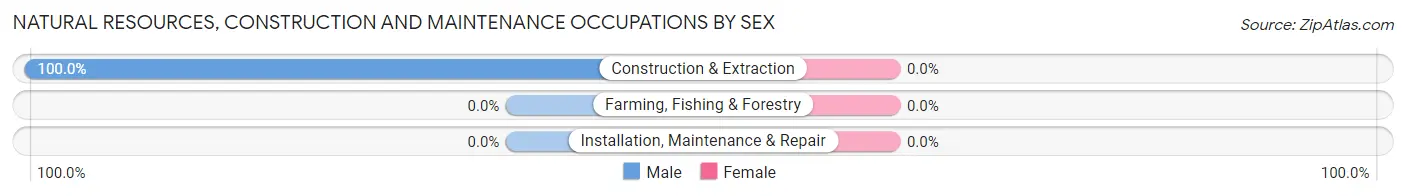
Natural Resources, Construction and Maintenance Occupations by Sex
| Occupation | Male | Female |
| Farming, Fishing & Forestry | 0 (0.0%) | 0 (0.0%) |
| Construction & Extraction | 4 (100.0%) | 0 (0.0%) |
| Installation, Maintenance & Repair | 0 (0.0%) | 0 (0.0%) |
| Total (Category) | 4 (100.0%) | 0 (0.0%) |
| Total (Overall) | 12 (57.1%) | 9 (42.9%) |
Production, Transportation and Moving Occupations
The most common Production, Transportation and Moving occupations in Salem are Transportation (4 | 19.1%), Material Moving (4 | 19.1%), and Production (1 | 4.8%).
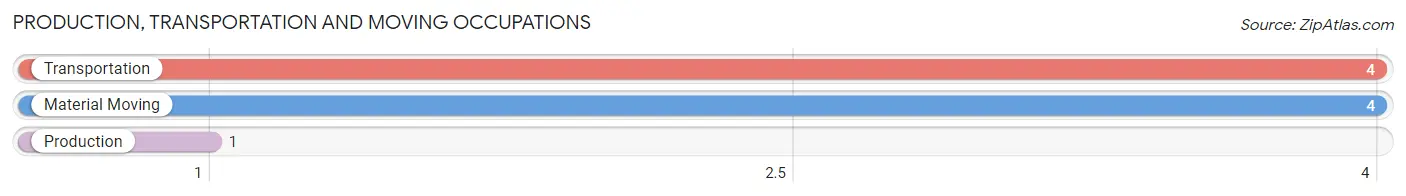
Production, Transportation and Moving Occupations by Sex
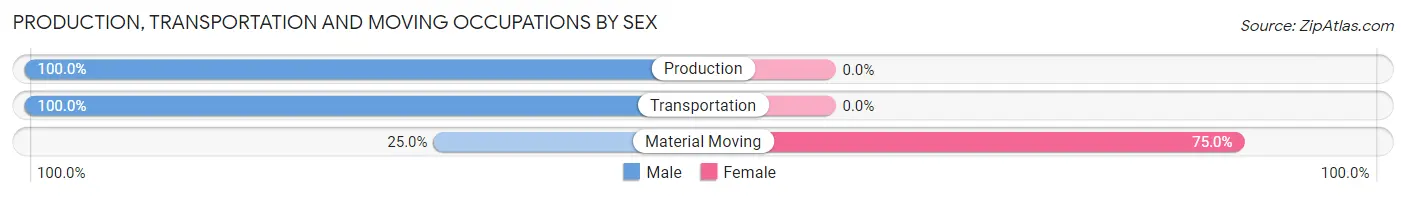
| Occupation | Male | Female |
| Production | 1 (100.0%) | 0 (0.0%) |
| Transportation | 4 (100.0%) | 0 (0.0%) |
| Material Moving | 1 (25.0%) | 3 (75.0%) |
| Total (Category) | 6 (66.7%) | 3 (33.3%) |
| Total (Overall) | 12 (57.1%) | 9 (42.9%) |
Employment Industries by Sex in Salem
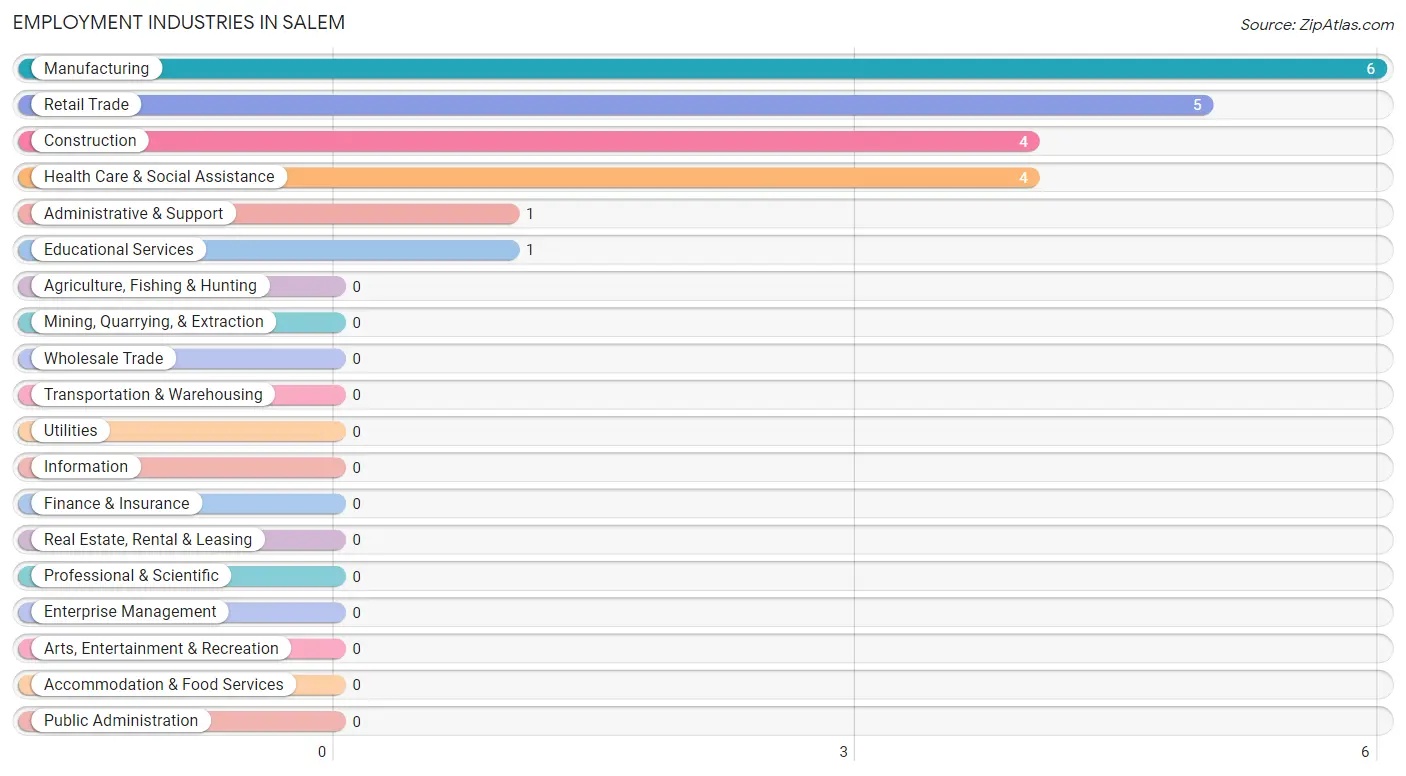
Employment Industries in Salem
The major employment industries in Salem include Manufacturing (6 | 28.6%), Retail Trade (5 | 23.8%), Construction (4 | 19.1%), Health Care & Social Assistance (4 | 19.1%), and Administrative & Support (1 | 4.8%).
Employment Industries by Sex in Salem
The Salem industries that see more men than women are Construction (100.0%), Retail Trade (100.0%), and Administrative & Support (100.0%), whereas the industries that tend to have a higher number of women are Health Care & Social Assistance (100.0%), and Manufacturing (83.3%).
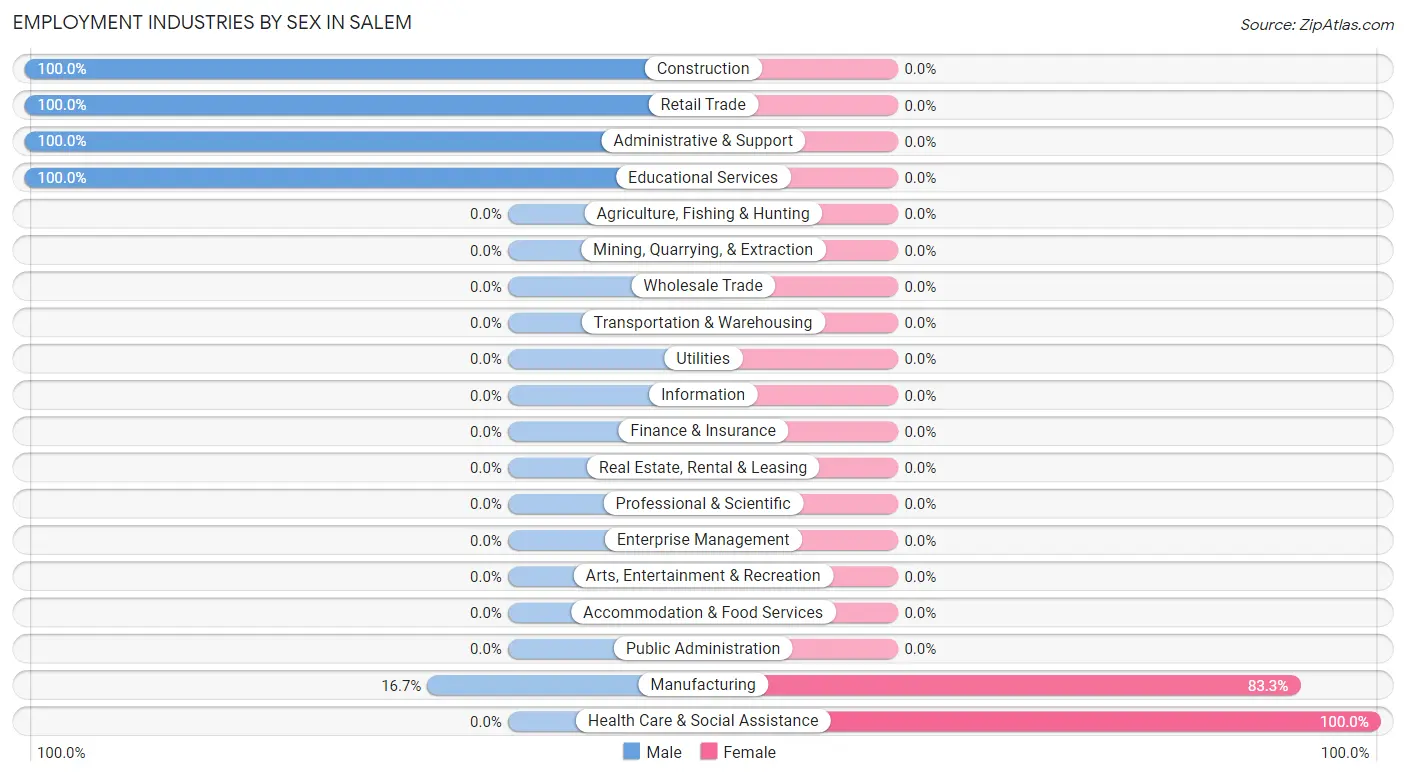
| Industry | Male | Female |
| Agriculture, Fishing & Hunting | 0 (0.0%) | 0 (0.0%) |
| Mining, Quarrying, & Extraction | 0 (0.0%) | 0 (0.0%) |
| Construction | 4 (100.0%) | 0 (0.0%) |
| Manufacturing | 1 (16.7%) | 5 (83.3%) |
| Wholesale Trade | 0 (0.0%) | 0 (0.0%) |
| Retail Trade | 5 (100.0%) | 0 (0.0%) |
| Transportation & Warehousing | 0 (0.0%) | 0 (0.0%) |
| Utilities | 0 (0.0%) | 0 (0.0%) |
| Information | 0 (0.0%) | 0 (0.0%) |
| Finance & Insurance | 0 (0.0%) | 0 (0.0%) |
| Real Estate, Rental & Leasing | 0 (0.0%) | 0 (0.0%) |
| Professional & Scientific | 0 (0.0%) | 0 (0.0%) |
| Enterprise Management | 0 (0.0%) | 0 (0.0%) |
| Administrative & Support | 1 (100.0%) | 0 (0.0%) |
| Educational Services | 1 (100.0%) | 0 (0.0%) |
| Health Care & Social Assistance | 0 (0.0%) | 4 (100.0%) |
| Arts, Entertainment & Recreation | 0 (0.0%) | 0 (0.0%) |
| Accommodation & Food Services | 0 (0.0%) | 0 (0.0%) |
| Public Administration | 0 (0.0%) | 0 (0.0%) |
| Total | 12 (57.1%) | 9 (42.9%) |
Education in Salem
School Enrollment in Salem
The most common levels of schooling among the 11 students in Salem are middle school (4 | 36.4%), elementary school (3 | 27.3%), and high school (2 | 18.2%).
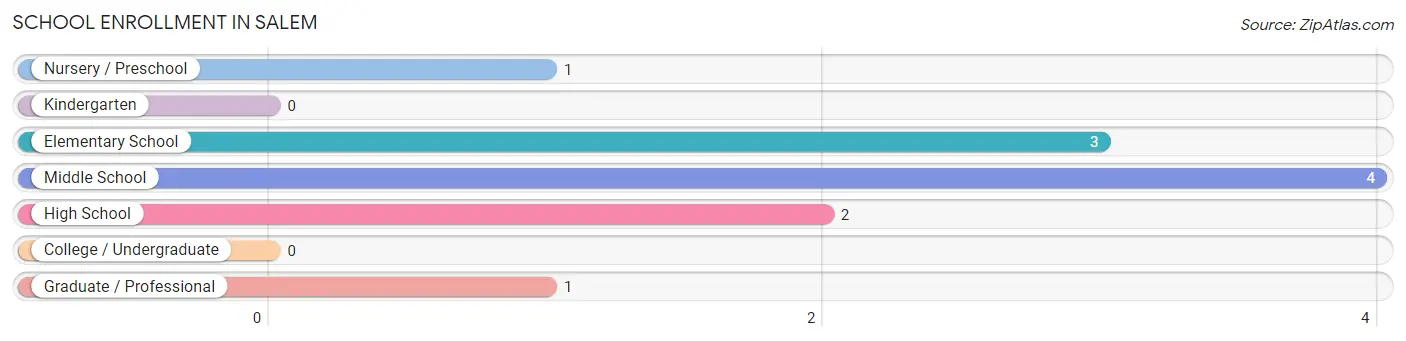
| School Level | # Students | % Students |
| Nursery / Preschool | 1 | 9.1% |
| Kindergarten | 0 | 0.0% |
| Elementary School | 3 | 27.3% |
| Middle School | 4 | 36.4% |
| High School | 2 | 18.2% |
| College / Undergraduate | 0 | 0.0% |
| Graduate / Professional | 1 | 9.1% |
| Total | 11 | 100.0% |
School Enrollment by Age by Funding Source in Salem
Out of a total of 11 students who are enrolled in schools in Salem, 1 (9.1%) attend a private institution, while the remaining 10 (90.9%) are enrolled in public schools. The age group of 15 to 17 year olds has the highest likelihood of being enrolled in private schools, with 1 (50.0% in the age bracket) enrolled. Conversely, the age group of 3 to 4 year olds has the lowest likelihood of being enrolled in a private school, with 1 (100.0% in the age bracket) attending a public institution.
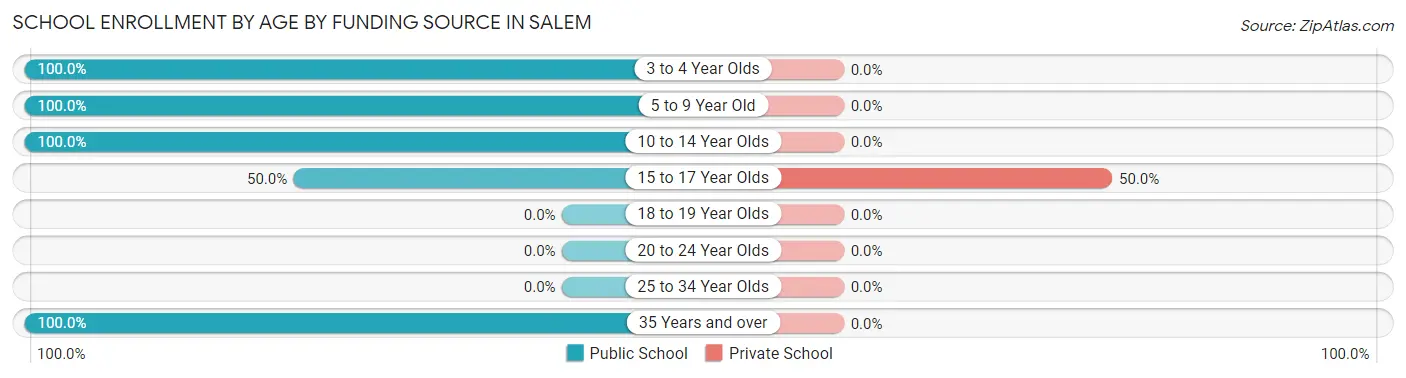
| Age Bracket | Public School | Private School |
| 3 to 4 Year Olds | 1 (100.0%) | 0 (0.0%) |
| 5 to 9 Year Old | 3 (100.0%) | 0 (0.0%) |
| 10 to 14 Year Olds | 4 (100.0%) | 0 (0.0%) |
| 15 to 17 Year Olds | 1 (50.0%) | 1 (50.0%) |
| 18 to 19 Year Olds | 0 (0.0%) | 0 (0.0%) |
| 20 to 24 Year Olds | 0 (0.0%) | 0 (0.0%) |
| 25 to 34 Year Olds | 0 (0.0%) | 0 (0.0%) |
| 35 Years and over | 1 (100.0%) | 0 (0.0%) |
| Total | 10 (90.9%) | 1 (9.1%) |
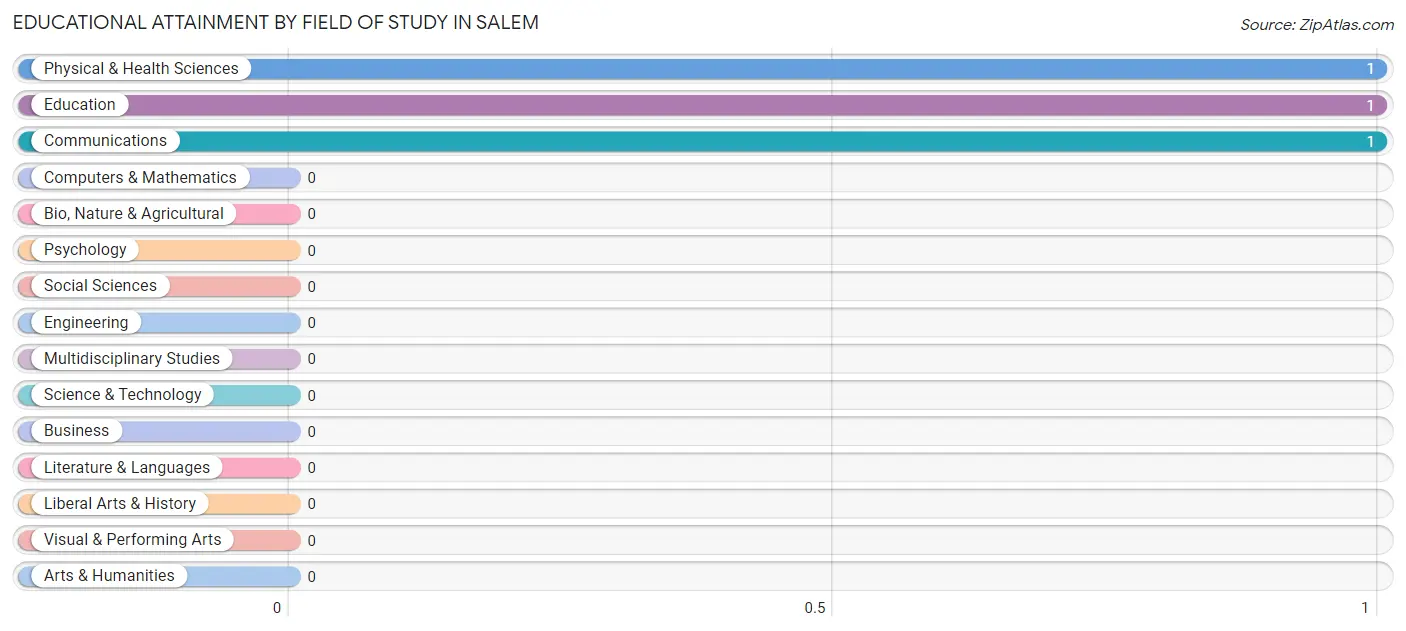
Educational Attainment by Field of Study in Salem
Physical & health sciences (1 | 33.3%), education (1 | 33.3%), and communications (1 | 33.3%) are the most common fields of study among 3 individuals in Salem who have obtained a bachelor's degree or higher.
| Field of Study | # Graduates | % Graduates |
| Computers & Mathematics | 0 | 0.0% |
| Bio, Nature & Agricultural | 0 | 0.0% |
| Physical & Health Sciences | 1 | 33.3% |
| Psychology | 0 | 0.0% |
| Social Sciences | 0 | 0.0% |
| Engineering | 0 | 0.0% |
| Multidisciplinary Studies | 0 | 0.0% |
| Science & Technology | 0 | 0.0% |
| Business | 0 | 0.0% |
| Education | 1 | 33.3% |
| Literature & Languages | 0 | 0.0% |
| Liberal Arts & History | 0 | 0.0% |
| Visual & Performing Arts | 0 | 0.0% |
| Communications | 1 | 33.3% |
| Arts & Humanities | 0 | 0.0% |
| Total | 3 | 100.0% |
Transportation & Commute in Salem
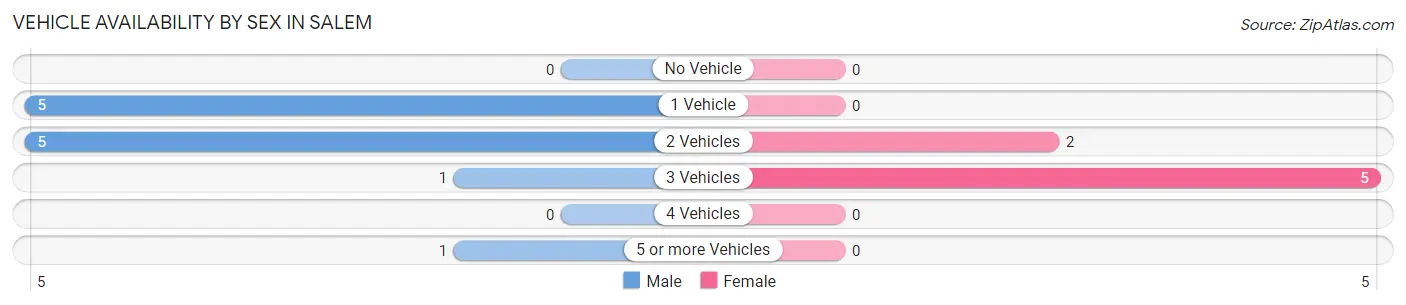
Vehicle Availability by Sex in Salem
The most prevalent vehicle ownership categories in Salem are males with 1 vehicle (5, accounting for 41.7%) and females with 1 vehicle (0, making up 71.4%).
| Vehicles Available | Male | Female |
| No Vehicle | 0 (0.0%) | 0 (0.0%) |
| 1 Vehicle | 5 (41.7%) | 0 (0.0%) |
| 2 Vehicles | 5 (41.7%) | 2 (28.6%) |
| 3 Vehicles | 1 (8.3%) | 5 (71.4%) |
| 4 Vehicles | 0 (0.0%) | 0 (0.0%) |
| 5 or more Vehicles | 1 (8.3%) | 0 (0.0%) |
| Total | 12 (100.0%) | 7 (100.0%) |
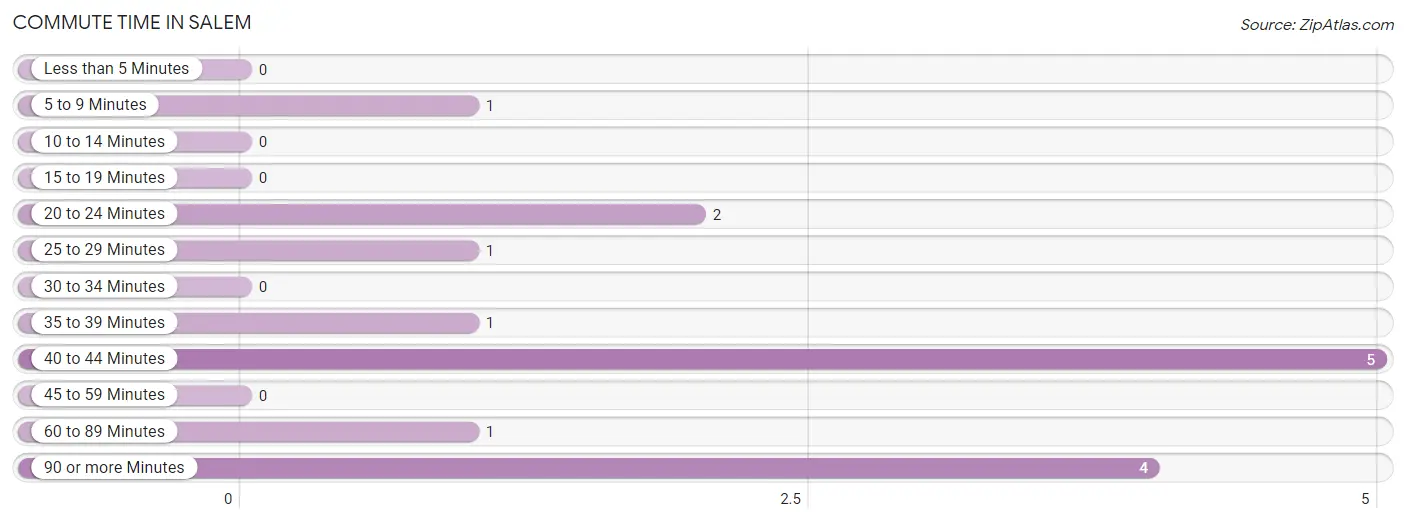
Commute Time in Salem
The most frequently occuring commute durations in Salem are 40 to 44 minutes (5 commuters, 33.3%), 90 or more minutes (4 commuters, 26.7%), and 20 to 24 minutes (2 commuters, 13.3%).
| Commute Time | # Commuters | % Commuters |
| Less than 5 Minutes | 0 | 0.0% |
| 5 to 9 Minutes | 1 | 6.7% |
| 10 to 14 Minutes | 0 | 0.0% |
| 15 to 19 Minutes | 0 | 0.0% |
| 20 to 24 Minutes | 2 | 13.3% |
| 25 to 29 Minutes | 1 | 6.7% |
| 30 to 34 Minutes | 0 | 0.0% |
| 35 to 39 Minutes | 1 | 6.7% |
| 40 to 44 Minutes | 5 | 33.3% |
| 45 to 59 Minutes | 0 | 0.0% |
| 60 to 89 Minutes | 1 | 6.7% |
| 90 or more Minutes | 4 | 26.7% |
Commute Time by Sex in Salem
The most common commute times in Salem are 90 or more minutes (4 commuters, 50.0%) for males and 40 to 44 minutes (5 commuters, 71.4%) for females.
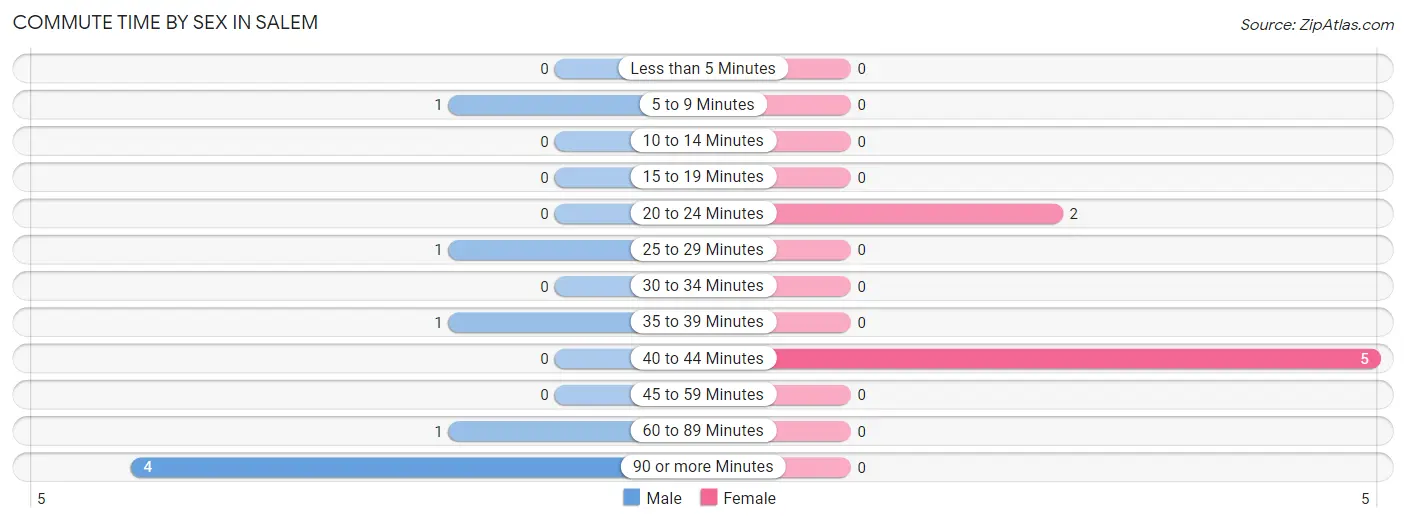
| Commute Time | Male | Female |
| Less than 5 Minutes | 0 (0.0%) | 0 (0.0%) |
| 5 to 9 Minutes | 1 (12.5%) | 0 (0.0%) |
| 10 to 14 Minutes | 0 (0.0%) | 0 (0.0%) |
| 15 to 19 Minutes | 0 (0.0%) | 0 (0.0%) |
| 20 to 24 Minutes | 0 (0.0%) | 2 (28.6%) |
| 25 to 29 Minutes | 1 (12.5%) | 0 (0.0%) |
| 30 to 34 Minutes | 0 (0.0%) | 0 (0.0%) |
| 35 to 39 Minutes | 1 (12.5%) | 0 (0.0%) |
| 40 to 44 Minutes | 0 (0.0%) | 5 (71.4%) |
| 45 to 59 Minutes | 0 (0.0%) | 0 (0.0%) |
| 60 to 89 Minutes | 1 (12.5%) | 0 (0.0%) |
| 90 or more Minutes | 4 (50.0%) | 0 (0.0%) |
Time of Departure to Work by Sex in Salem
The most frequent times of departure to work in Salem are 4:00 PM to 11:59 PM (4, 50.0%) for males and 5:00 AM to 5:29 AM (5, 71.4%) for females.
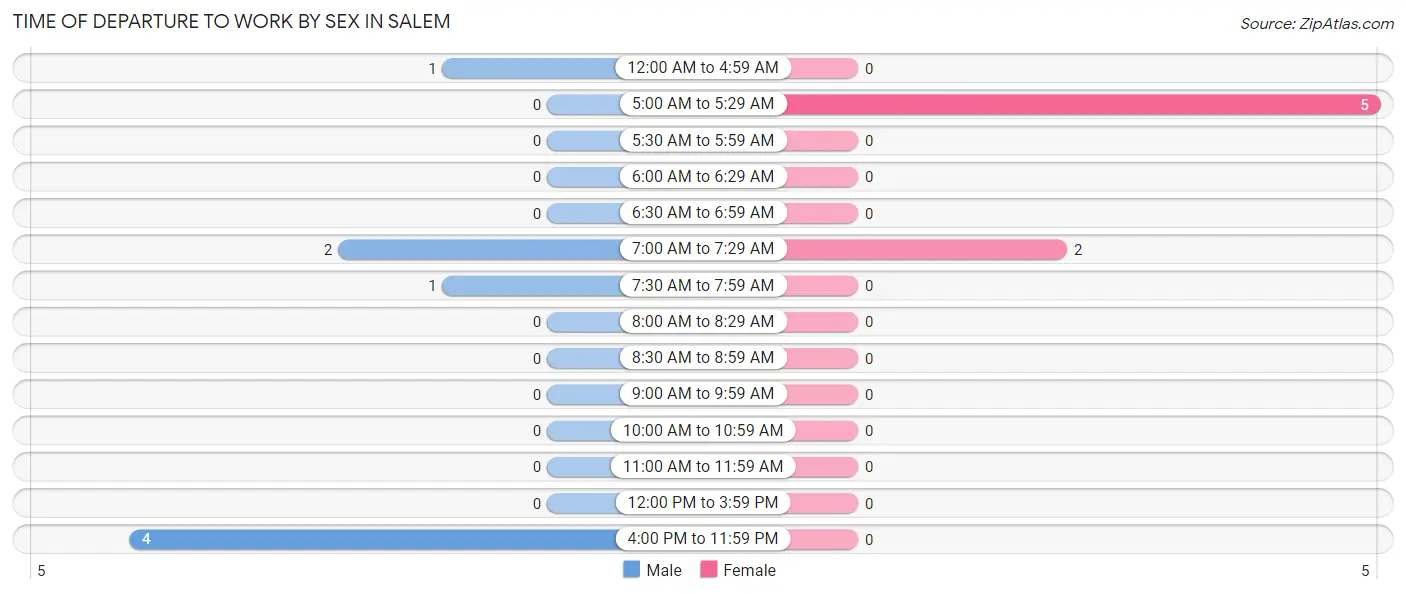
| Time of Departure | Male | Female |
| 12:00 AM to 4:59 AM | 1 (12.5%) | 0 (0.0%) |
| 5:00 AM to 5:29 AM | 0 (0.0%) | 5 (71.4%) |
| 5:30 AM to 5:59 AM | 0 (0.0%) | 0 (0.0%) |
| 6:00 AM to 6:29 AM | 0 (0.0%) | 0 (0.0%) |
| 6:30 AM to 6:59 AM | 0 (0.0%) | 0 (0.0%) |
| 7:00 AM to 7:29 AM | 2 (25.0%) | 2 (28.6%) |
| 7:30 AM to 7:59 AM | 1 (12.5%) | 0 (0.0%) |
| 8:00 AM to 8:29 AM | 0 (0.0%) | 0 (0.0%) |
| 8:30 AM to 8:59 AM | 0 (0.0%) | 0 (0.0%) |
| 9:00 AM to 9:59 AM | 0 (0.0%) | 0 (0.0%) |
| 10:00 AM to 10:59 AM | 0 (0.0%) | 0 (0.0%) |
| 11:00 AM to 11:59 AM | 0 (0.0%) | 0 (0.0%) |
| 12:00 PM to 3:59 PM | 0 (0.0%) | 0 (0.0%) |
| 4:00 PM to 11:59 PM | 4 (50.0%) | 0 (0.0%) |
| Total | 8 (100.0%) | 7 (100.0%) |
Housing Occupancy in Salem
Occupancy by Ownership in Salem
Of the total 44 dwellings in Salem, owner-occupied units account for 30 (68.2%), while renter-occupied units make up 14 (31.8%).
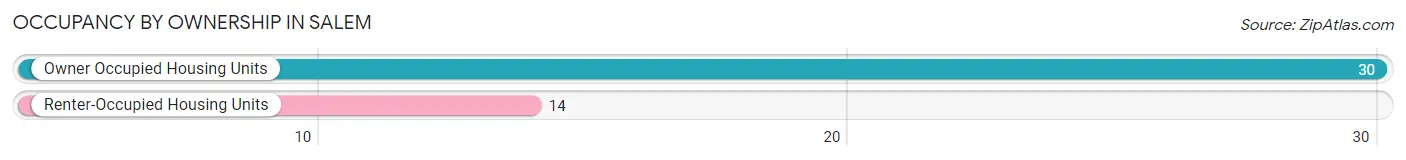
| Occupancy | # Housing Units | % Housing Units |
| Owner Occupied Housing Units | 30 | 68.2% |
| Renter-Occupied Housing Units | 14 | 31.8% |
| Total Occupied Housing Units | 44 | 100.0% |
Occupancy by Household Size in Salem
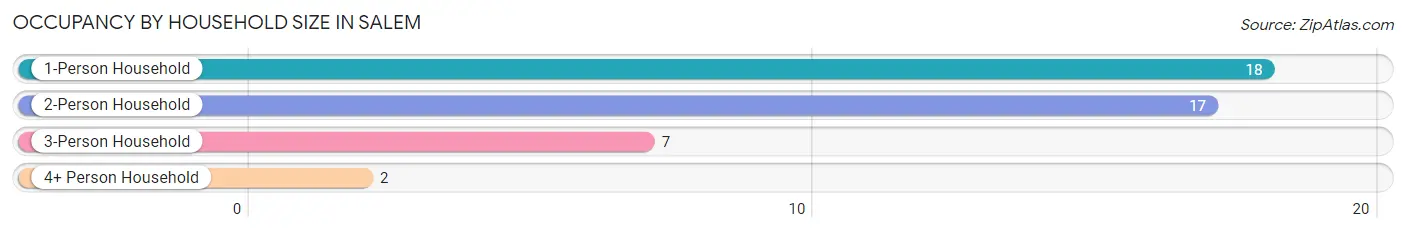
| Household Size | # Housing Units | % Housing Units |
| 1-Person Household | 18 | 40.9% |
| 2-Person Household | 17 | 38.6% |
| 3-Person Household | 7 | 15.9% |
| 4+ Person Household | 2 | 4.5% |
| Total Housing Units | 44 | 100.0% |
Occupancy by Ownership by Household Size in Salem
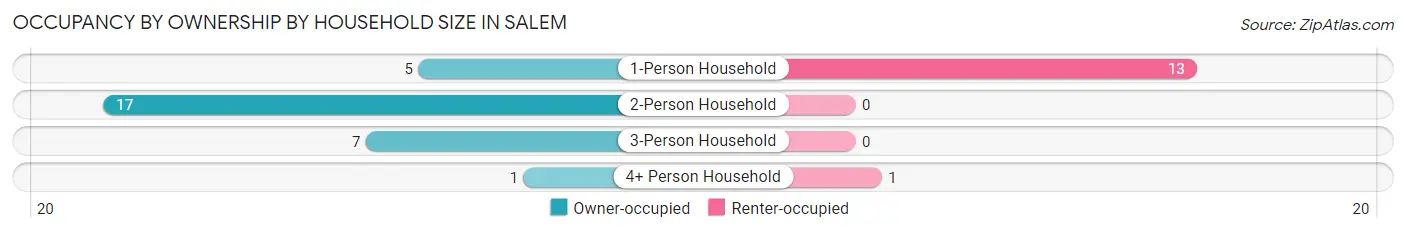
| Household Size | Owner-occupied | Renter-occupied |
| 1-Person Household | 5 (27.8%) | 13 (72.2%) |
| 2-Person Household | 17 (100.0%) | 0 (0.0%) |
| 3-Person Household | 7 (100.0%) | 0 (0.0%) |
| 4+ Person Household | 1 (50.0%) | 1 (50.0%) |
| Total Housing Units | 30 (68.2%) | 14 (31.8%) |
Occupancy by Educational Attainment in Salem
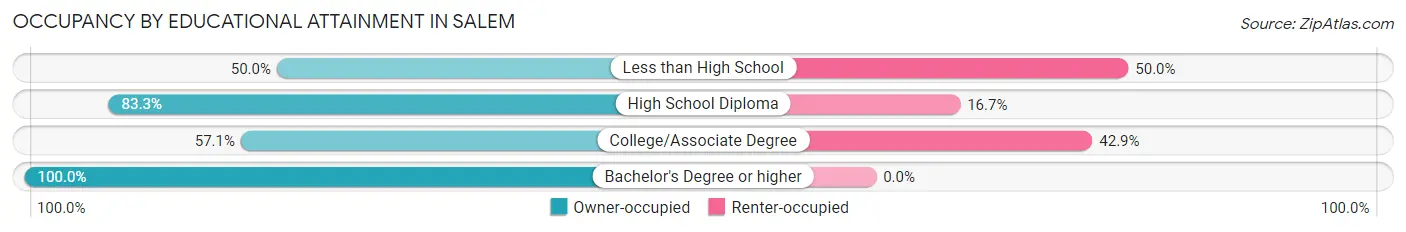
| Household Size | Owner-occupied | Renter-occupied |
| Less than High School | 2 (50.0%) | 2 (50.0%) |
| High School Diploma | 15 (83.3%) | 3 (16.7%) |
| College/Associate Degree | 12 (57.1%) | 9 (42.9%) |
| Bachelor's Degree or higher | 1 (100.0%) | 0 (0.0%) |
Occupancy by Age of Householder in Salem
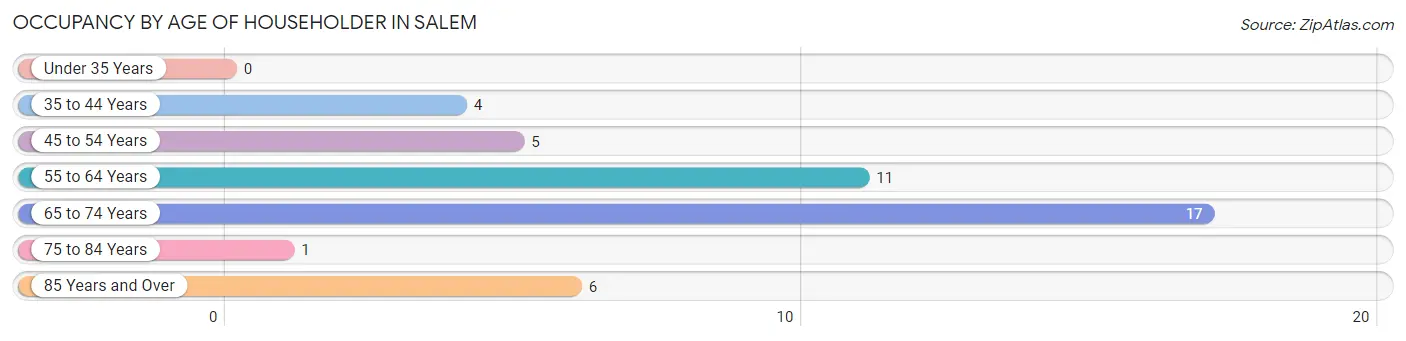
| Age Bracket | # Households | % Households |
| Under 35 Years | 0 | 0.0% |
| 35 to 44 Years | 4 | 9.1% |
| 45 to 54 Years | 5 | 11.4% |
| 55 to 64 Years | 11 | 25.0% |
| 65 to 74 Years | 17 | 38.6% |
| 75 to 84 Years | 1 | 2.3% |
| 85 Years and Over | 6 | 13.6% |
| Total | 44 | 100.0% |
Housing Finances in Salem
Median Income by Occupancy in Salem
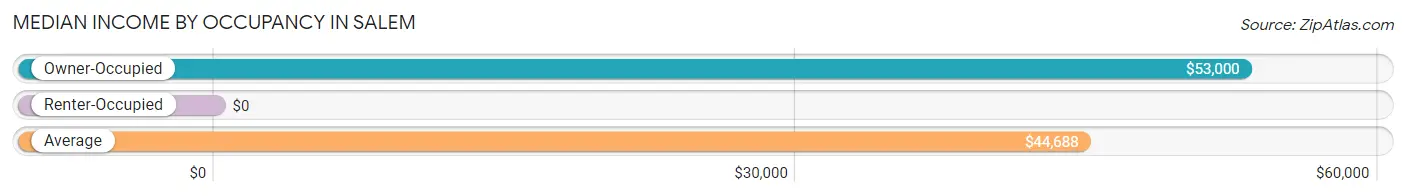
| Occupancy Type | # Households | Median Income |
| Owner-Occupied | 30 (68.2%) | $53,000 |
| Renter-Occupied | 14 (31.8%) | $0 |
| Average | 44 (100.0%) | $44,688 |
Occupancy by Householder Income Bracket in Salem
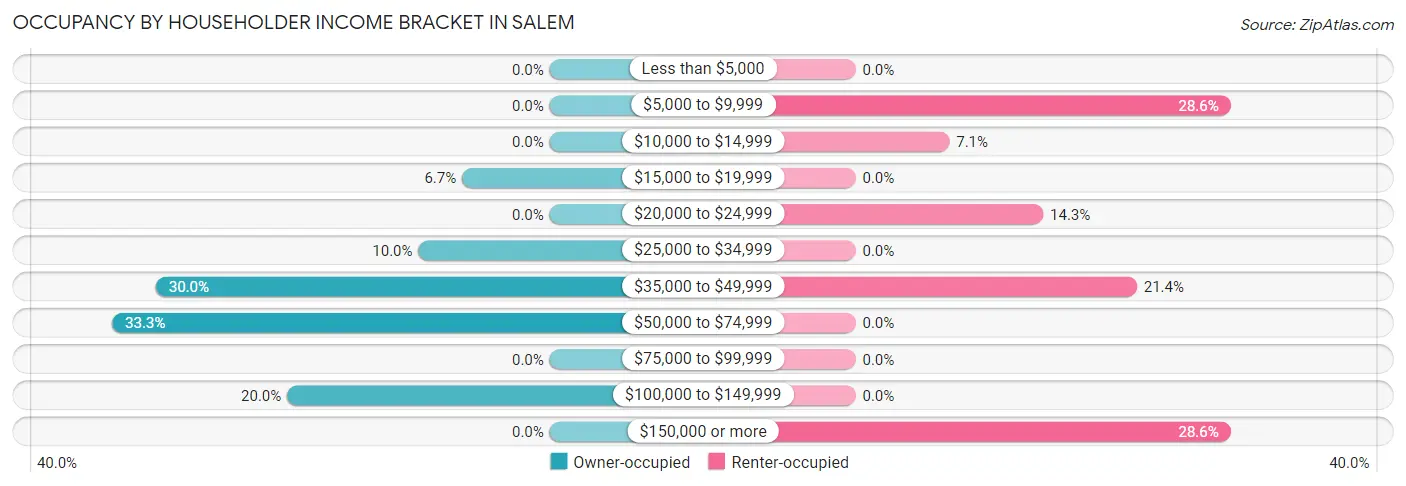
| Income Bracket | Owner-occupied | Renter-occupied |
| Less than $5,000 | 0 (0.0%) | 0 (0.0%) |
| $5,000 to $9,999 | 0 (0.0%) | 4 (28.6%) |
| $10,000 to $14,999 | 0 (0.0%) | 1 (7.1%) |
| $15,000 to $19,999 | 2 (6.7%) | 0 (0.0%) |
| $20,000 to $24,999 | 0 (0.0%) | 2 (14.3%) |
| $25,000 to $34,999 | 3 (10.0%) | 0 (0.0%) |
| $35,000 to $49,999 | 9 (30.0%) | 3 (21.4%) |
| $50,000 to $74,999 | 10 (33.3%) | 0 (0.0%) |
| $75,000 to $99,999 | 0 (0.0%) | 0 (0.0%) |
| $100,000 to $149,999 | 6 (20.0%) | 0 (0.0%) |
| $150,000 or more | 0 (0.0%) | 4 (28.6%) |
| Total | 30 (100.0%) | 14 (100.0%) |
Monthly Housing Cost Tiers in Salem
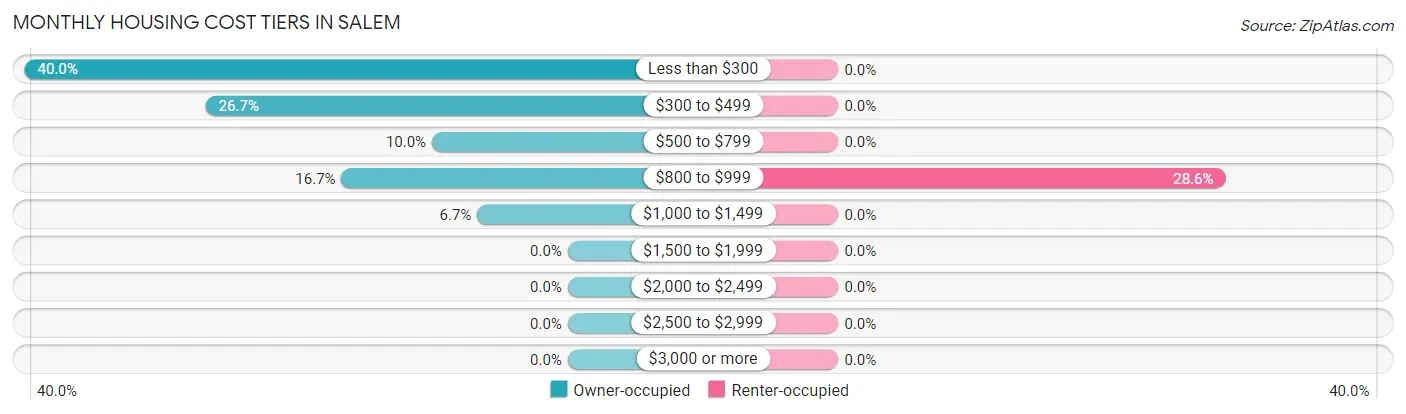
| Monthly Cost | Owner-occupied | Renter-occupied |
| Less than $300 | 12 (40.0%) | 0 (0.0%) |
| $300 to $499 | 8 (26.7%) | 0 (0.0%) |
| $500 to $799 | 3 (10.0%) | 0 (0.0%) |
| $800 to $999 | 5 (16.7%) | 4 (28.6%) |
| $1,000 to $1,499 | 2 (6.7%) | 0 (0.0%) |
| $1,500 to $1,999 | 0 (0.0%) | 0 (0.0%) |
| $2,000 to $2,499 | 0 (0.0%) | 0 (0.0%) |
| $2,500 to $2,999 | 0 (0.0%) | 0 (0.0%) |
| $3,000 or more | 0 (0.0%) | 0 (0.0%) |
| Total | 30 (100.0%) | 14 (100.0%) |
Physical Housing Characteristics in Salem
Housing Structures in Salem
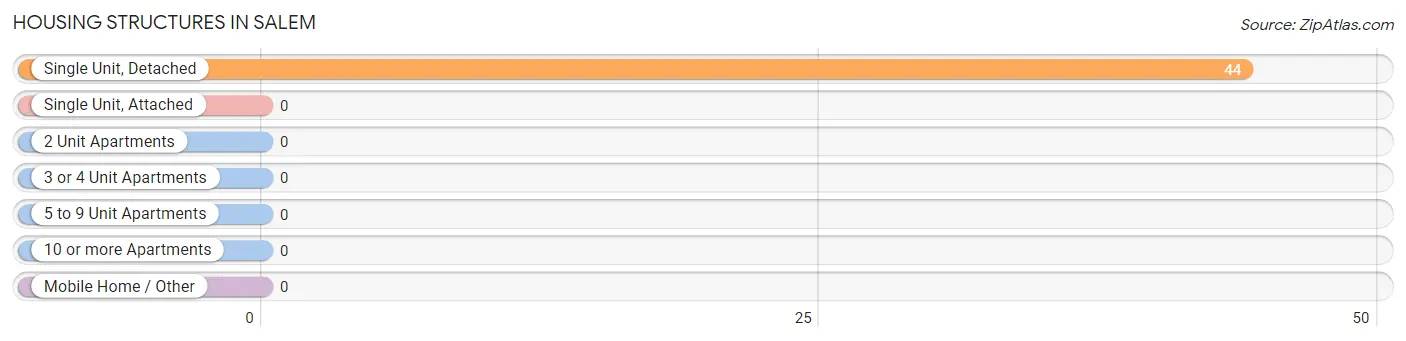
| Structure Type | # Housing Units | % Housing Units |
| Single Unit, Detached | 44 | 100.0% |
| Single Unit, Attached | 0 | 0.0% |
| 2 Unit Apartments | 0 | 0.0% |
| 3 or 4 Unit Apartments | 0 | 0.0% |
| 5 to 9 Unit Apartments | 0 | 0.0% |
| 10 or more Apartments | 0 | 0.0% |
| Mobile Home / Other | 0 | 0.0% |
| Total | 44 | 100.0% |
Housing Structures by Occupancy in Salem
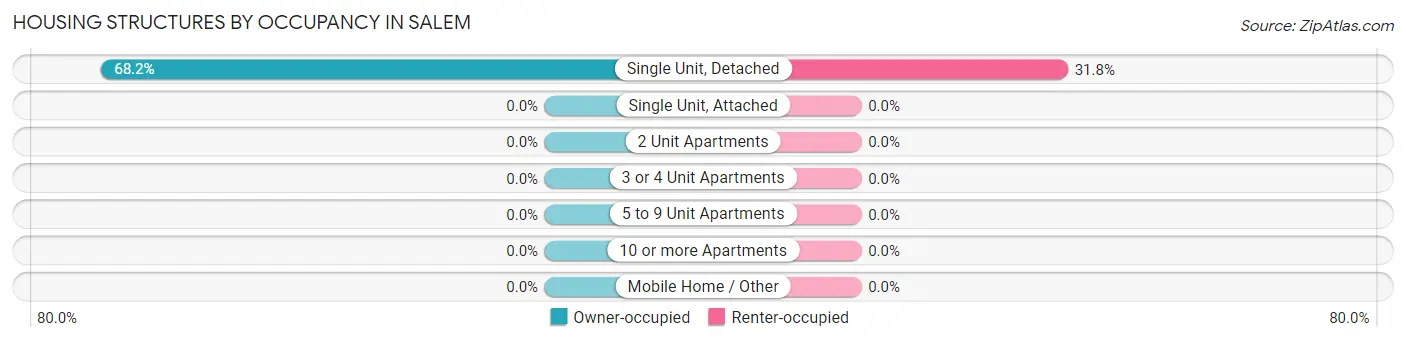
| Structure Type | Owner-occupied | Renter-occupied |
| Single Unit, Detached | 30 (68.2%) | 14 (31.8%) |
| Single Unit, Attached | 0 (0.0%) | 0 (0.0%) |
| 2 Unit Apartments | 0 (0.0%) | 0 (0.0%) |
| 3 or 4 Unit Apartments | 0 (0.0%) | 0 (0.0%) |
| 5 to 9 Unit Apartments | 0 (0.0%) | 0 (0.0%) |
| 10 or more Apartments | 0 (0.0%) | 0 (0.0%) |
| Mobile Home / Other | 0 (0.0%) | 0 (0.0%) |
| Total | 30 (68.2%) | 14 (31.8%) |
Housing Structures by Number of Rooms in Salem
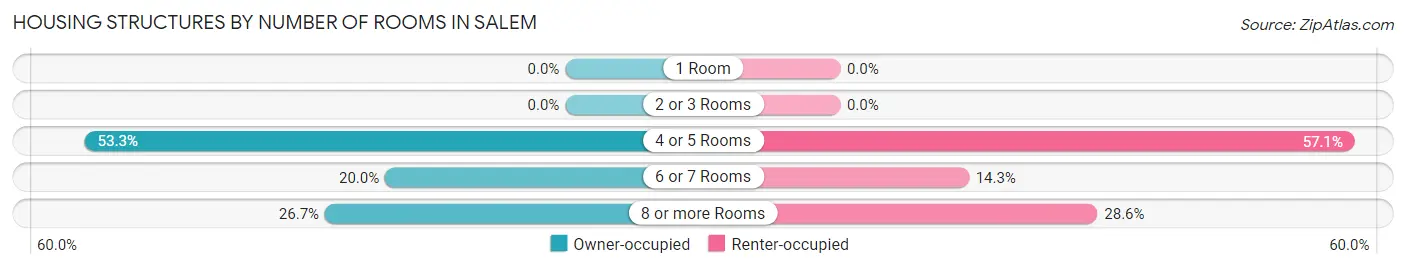
| Number of Rooms | Owner-occupied | Renter-occupied |
| 1 Room | 0 (0.0%) | 0 (0.0%) |
| 2 or 3 Rooms | 0 (0.0%) | 0 (0.0%) |
| 4 or 5 Rooms | 16 (53.3%) | 8 (57.1%) |
| 6 or 7 Rooms | 6 (20.0%) | 2 (14.3%) |
| 8 or more Rooms | 8 (26.7%) | 4 (28.6%) |
| Total | 30 (100.0%) | 14 (100.0%) |
Housing Structure by Heating Type in Salem
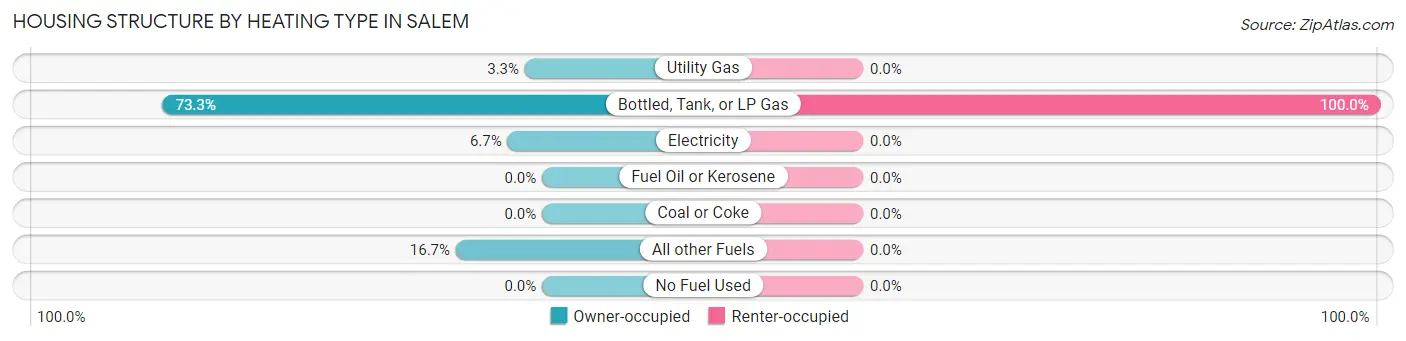
| Heating Type | Owner-occupied | Renter-occupied |
| Utility Gas | 1 (3.3%) | 0 (0.0%) |
| Bottled, Tank, or LP Gas | 22 (73.3%) | 14 (100.0%) |
| Electricity | 2 (6.7%) | 0 (0.0%) |
| Fuel Oil or Kerosene | 0 (0.0%) | 0 (0.0%) |
| Coal or Coke | 0 (0.0%) | 0 (0.0%) |
| All other Fuels | 5 (16.7%) | 0 (0.0%) |
| No Fuel Used | 0 (0.0%) | 0 (0.0%) |
| Total | 30 (100.0%) | 14 (100.0%) |
Household Vehicle Usage in Salem
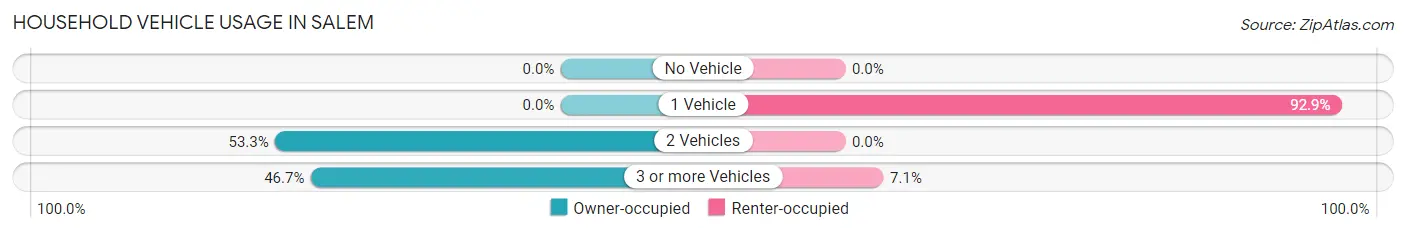
| Vehicles per Household | Owner-occupied | Renter-occupied |
| No Vehicle | 0 (0.0%) | 0 (0.0%) |
| 1 Vehicle | 0 (0.0%) | 13 (92.9%) |
| 2 Vehicles | 16 (53.3%) | 0 (0.0%) |
| 3 or more Vehicles | 14 (46.7%) | 1 (7.1%) |
| Total | 30 (100.0%) | 14 (100.0%) |
Real Estate & Mortgages in Salem
Real Estate and Mortgage Overview in Salem
| Characteristic | Without Mortgage | With Mortgage |
| Housing Units | 22 | 8 |
| Median Property Value | - | - |
| Median Household Income | $44,375 | $0 |
| Monthly Housing Costs | $294 | $0 |
| Real Estate Taxes | $372 | $0 |
Property Value by Mortgage Status in Salem
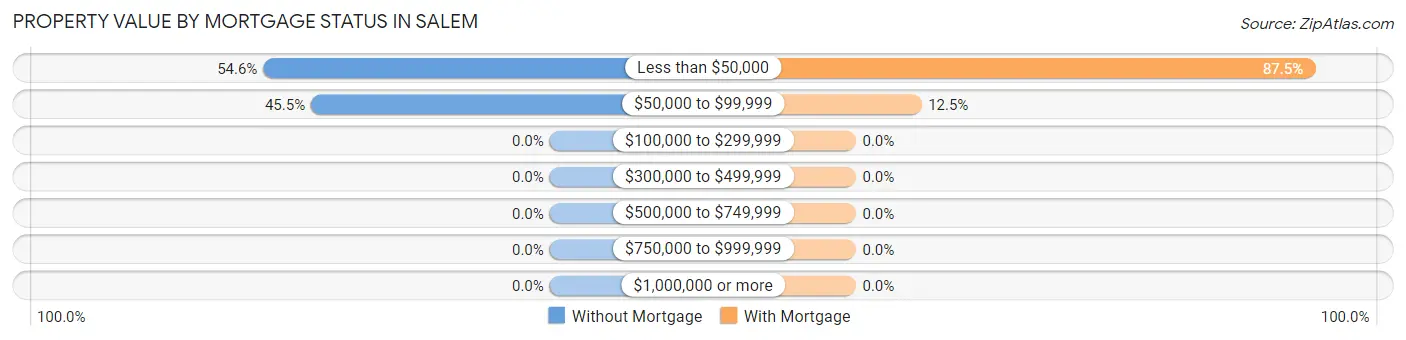
| Property Value | Without Mortgage | With Mortgage |
| Less than $50,000 | 12 (54.5%) | 7 (87.5%) |
| $50,000 to $99,999 | 10 (45.5%) | 1 (12.5%) |
| $100,000 to $299,999 | 0 (0.0%) | 0 (0.0%) |
| $300,000 to $499,999 | 0 (0.0%) | 0 (0.0%) |
| $500,000 to $749,999 | 0 (0.0%) | 0 (0.0%) |
| $750,000 to $999,999 | 0 (0.0%) | 0 (0.0%) |
| $1,000,000 or more | 0 (0.0%) | 0 (0.0%) |
| Total | 22 (100.0%) | 8 (100.0%) |
Household Income by Mortgage Status in Salem
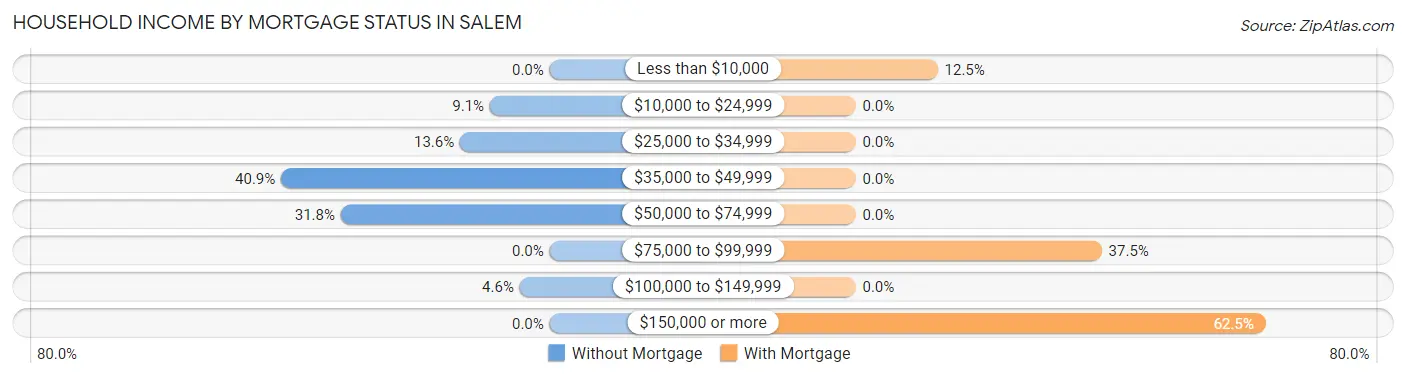
| Household Income | Without Mortgage | With Mortgage |
| Less than $10,000 | 0 (0.0%) | 1 (12.5%) |
| $10,000 to $24,999 | 2 (9.1%) | 0 (0.0%) |
| $25,000 to $34,999 | 3 (13.6%) | 0 (0.0%) |
| $35,000 to $49,999 | 9 (40.9%) | 0 (0.0%) |
| $50,000 to $74,999 | 7 (31.8%) | 0 (0.0%) |
| $75,000 to $99,999 | 0 (0.0%) | 3 (37.5%) |
| $100,000 to $149,999 | 1 (4.5%) | 0 (0.0%) |
| $150,000 or more | 0 (0.0%) | 5 (62.5%) |
| Total | 22 (100.0%) | 8 (100.0%) |
Property Value to Household Income Ratio in Salem
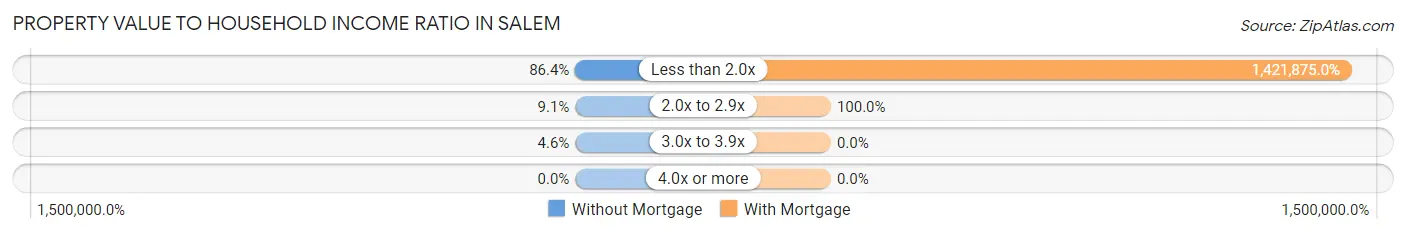
| Value-to-Income Ratio | Without Mortgage | With Mortgage |
| Less than 2.0x | 19 (86.4%) | 113,750 (1,421,875.0%) |
| 2.0x to 2.9x | 2 (9.1%) | 8 (100.0%) |
| 3.0x to 3.9x | 1 (4.5%) | 0 (0.0%) |
| 4.0x or more | 0 (0.0%) | 0 (0.0%) |
| Total | 22 (100.0%) | 8 (100.0%) |
Real Estate Taxes by Mortgage Status in Salem
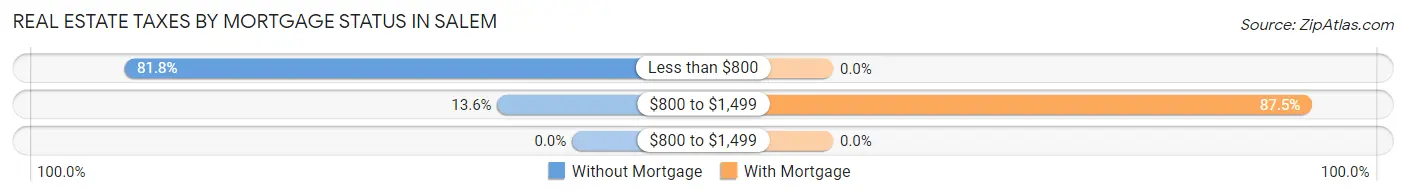
| Property Taxes | Without Mortgage | With Mortgage |
| Less than $800 | 18 (81.8%) | 0 (0.0%) |
| $800 to $1,499 | 3 (13.6%) | 7 (87.5%) |
| $800 to $1,499 | 0 (0.0%) | 0 (0.0%) |
| Total | 22 (100.0%) | 8 (100.0%) |
Health & Disability in Salem
Health Insurance Coverage by Age in Salem
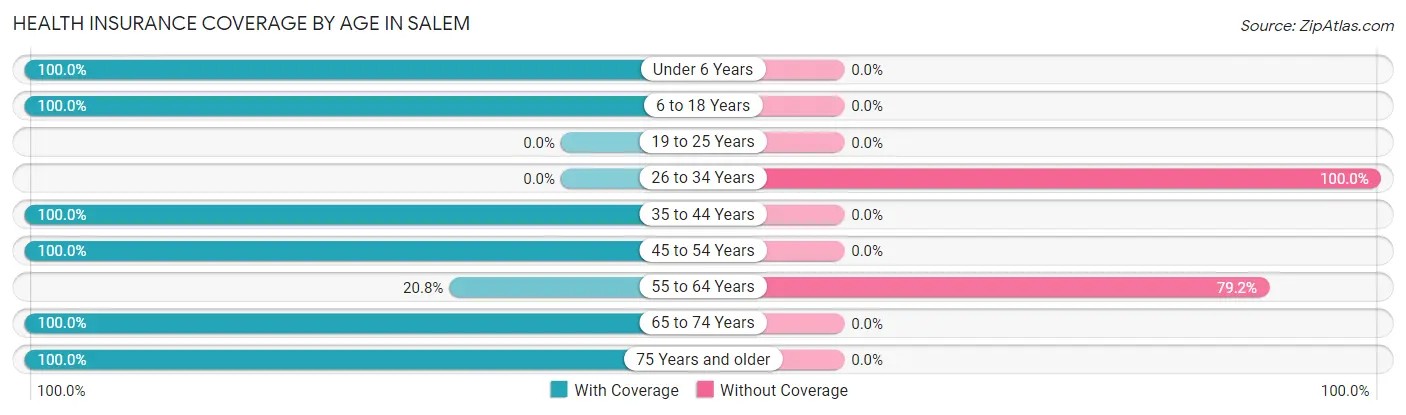
| Age Bracket | With Coverage | Without Coverage |
| Under 6 Years | 1 (100.0%) | 0 (0.0%) |
| 6 to 18 Years | 9 (100.0%) | 0 (0.0%) |
| 19 to 25 Years | 0 (0.0%) | 0 (0.0%) |
| 26 to 34 Years | 0 (0.0%) | 1 (100.0%) |
| 35 to 44 Years | 5 (100.0%) | 0 (0.0%) |
| 45 to 54 Years | 13 (100.0%) | 0 (0.0%) |
| 55 to 64 Years | 5 (20.8%) | 19 (79.2%) |
| 65 to 74 Years | 20 (100.0%) | 0 (0.0%) |
| 75 Years and older | 15 (100.0%) | 0 (0.0%) |
| Total | 68 (77.3%) | 20 (22.7%) |
Health Insurance Coverage by Citizenship Status in Salem
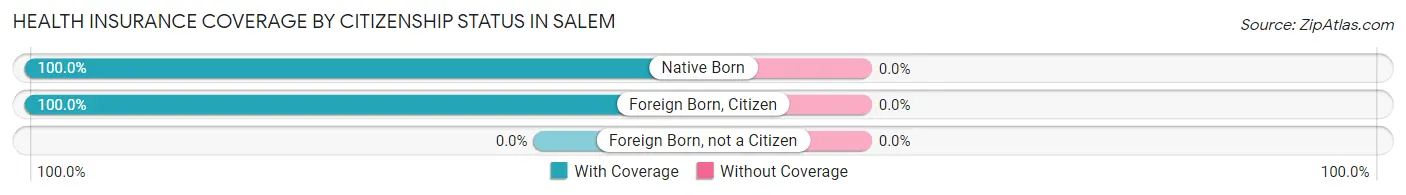
| Citizenship Status | With Coverage | Without Coverage |
| Native Born | 1 (100.0%) | 0 (0.0%) |
| Foreign Born, Citizen | 9 (100.0%) | 0 (0.0%) |
| Foreign Born, not a Citizen | 0 (0.0%) | 0 (0.0%) |
Health Insurance Coverage by Household Income in Salem
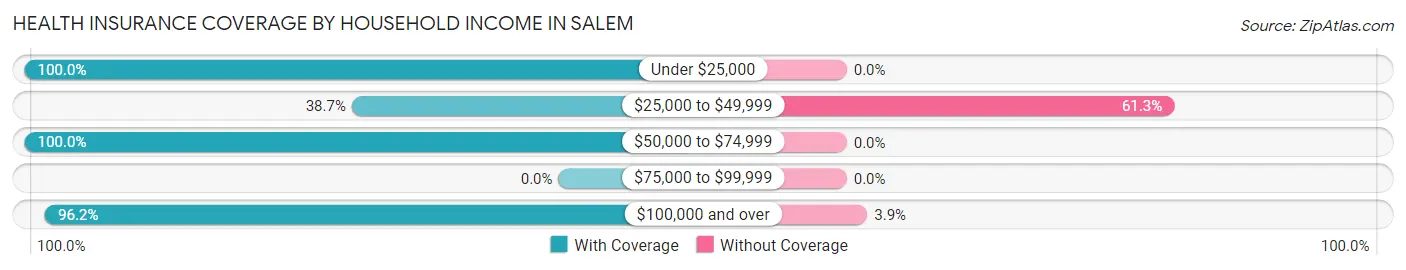
| Household Income | With Coverage | Without Coverage |
| Under $25,000 | 12 (100.0%) | 0 (0.0%) |
| $25,000 to $49,999 | 12 (38.7%) | 19 (61.3%) |
| $50,000 to $74,999 | 19 (100.0%) | 0 (0.0%) |
| $75,000 to $99,999 | 0 (0.0%) | 0 (0.0%) |
| $100,000 and over | 25 (96.2%) | 1 (3.8%) |
Public vs Private Health Insurance Coverage by Age in Salem
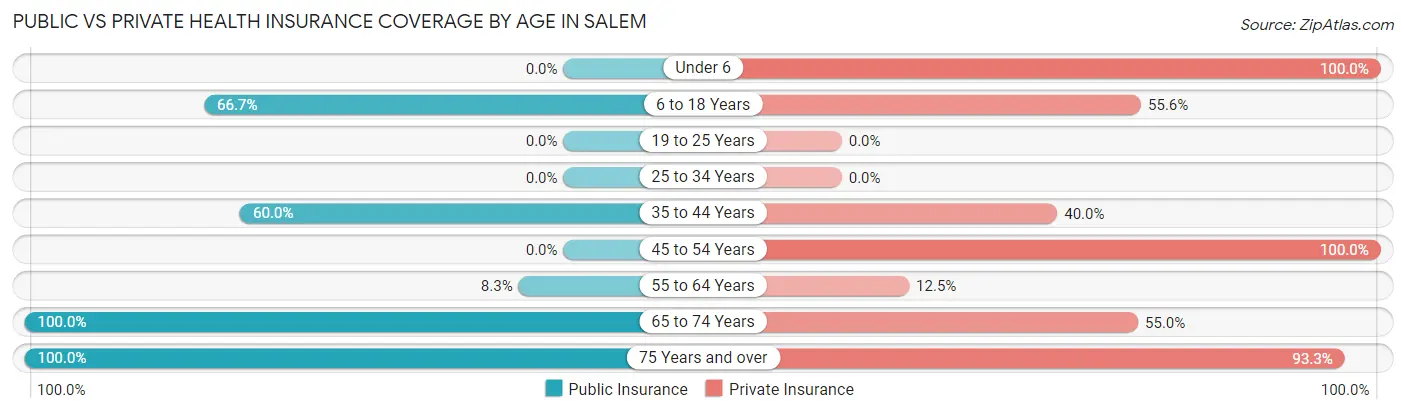
| Age Bracket | Public Insurance | Private Insurance |
| Under 6 | 0 (0.0%) | 1 (100.0%) |
| 6 to 18 Years | 6 (66.7%) | 5 (55.6%) |
| 19 to 25 Years | 0 (0.0%) | 0 (0.0%) |
| 25 to 34 Years | 0 (0.0%) | 0 (0.0%) |
| 35 to 44 Years | 3 (60.0%) | 2 (40.0%) |
| 45 to 54 Years | 0 (0.0%) | 13 (100.0%) |
| 55 to 64 Years | 2 (8.3%) | 3 (12.5%) |
| 65 to 74 Years | 20 (100.0%) | 11 (55.0%) |
| 75 Years and over | 15 (100.0%) | 14 (93.3%) |
| Total | 46 (52.3%) | 49 (55.7%) |
Disability Status by Sex by Age in Salem
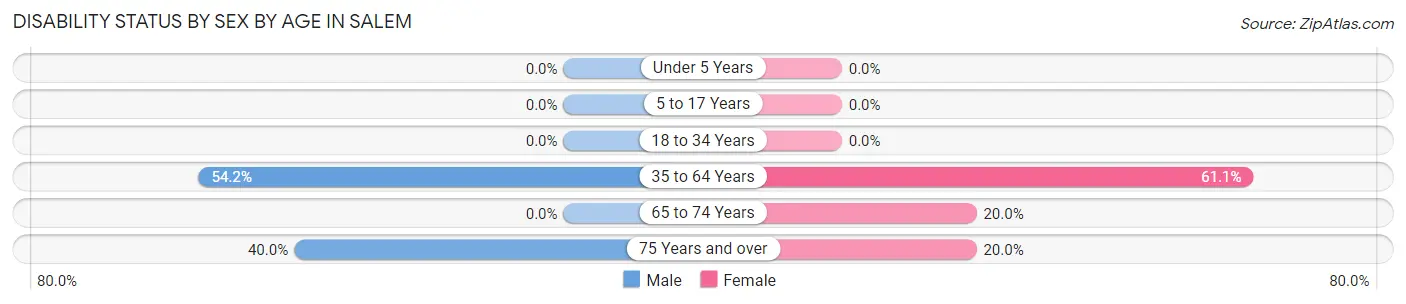
| Age Bracket | Male | Female |
| Under 5 Years | 0 (0.0%) | 0 (0.0%) |
| 5 to 17 Years | 0 (0.0%) | 0 (0.0%) |
| 18 to 34 Years | 0 (0.0%) | 0 (0.0%) |
| 35 to 64 Years | 13 (54.2%) | 11 (61.1%) |
| 65 to 74 Years | 0 (0.0%) | 3 (20.0%) |
| 75 Years and over | 4 (40.0%) | 1 (20.0%) |
Disability Class by Sex by Age in Salem
Disability Class: Hearing Difficulty
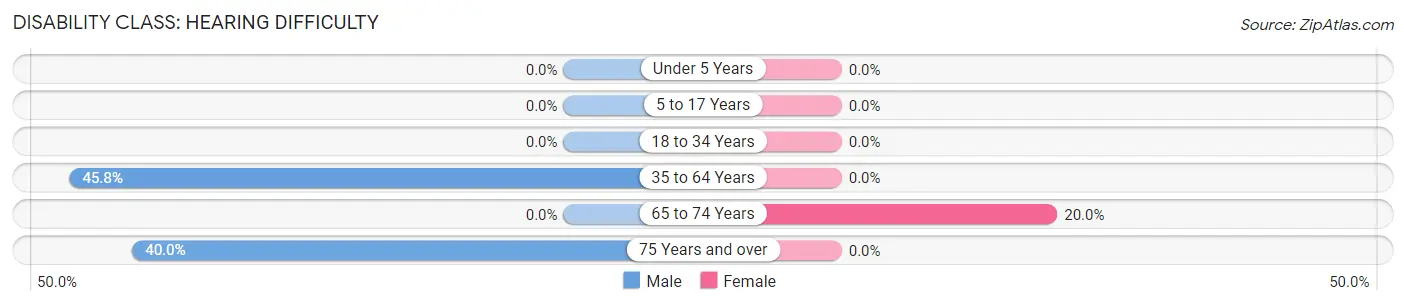
| Age Bracket | Male | Female |
| Under 5 Years | 0 (0.0%) | 0 (0.0%) |
| 5 to 17 Years | 0 (0.0%) | 0 (0.0%) |
| 18 to 34 Years | 0 (0.0%) | 0 (0.0%) |
| 35 to 64 Years | 11 (45.8%) | 0 (0.0%) |
| 65 to 74 Years | 0 (0.0%) | 3 (20.0%) |
| 75 Years and over | 4 (40.0%) | 0 (0.0%) |
Disability Class: Vision Difficulty
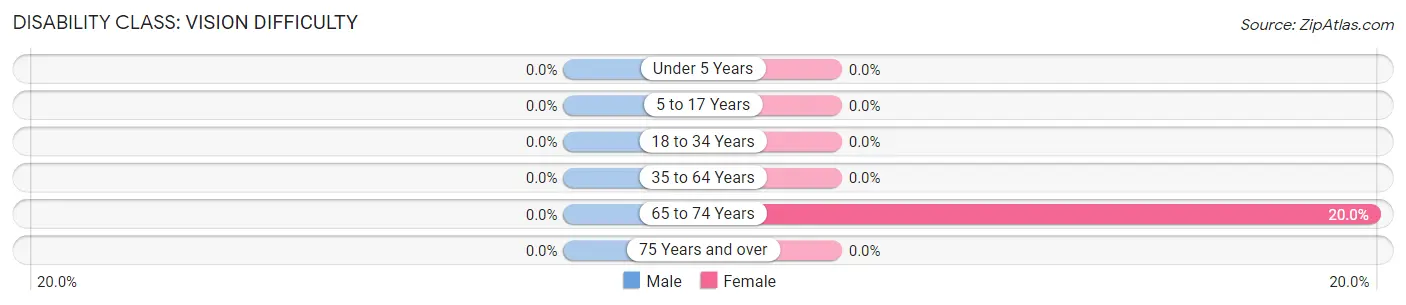
| Age Bracket | Male | Female |
| Under 5 Years | 0 (0.0%) | 0 (0.0%) |
| 5 to 17 Years | 0 (0.0%) | 0 (0.0%) |
| 18 to 34 Years | 0 (0.0%) | 0 (0.0%) |
| 35 to 64 Years | 0 (0.0%) | 0 (0.0%) |
| 65 to 74 Years | 0 (0.0%) | 3 (20.0%) |
| 75 Years and over | 0 (0.0%) | 0 (0.0%) |
Disability Class: Cognitive Difficulty
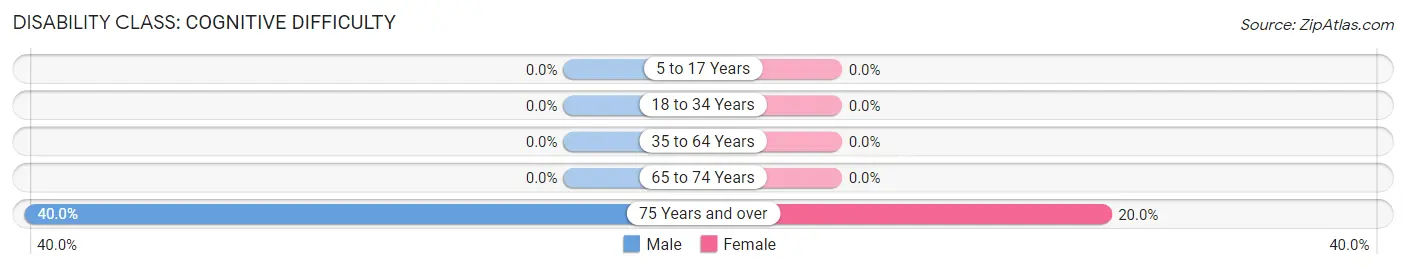
| Age Bracket | Male | Female |
| 5 to 17 Years | 0 (0.0%) | 0 (0.0%) |
| 18 to 34 Years | 0 (0.0%) | 0 (0.0%) |
| 35 to 64 Years | 0 (0.0%) | 0 (0.0%) |
| 65 to 74 Years | 0 (0.0%) | 0 (0.0%) |
| 75 Years and over | 4 (40.0%) | 1 (20.0%) |
Disability Class: Ambulatory Difficulty
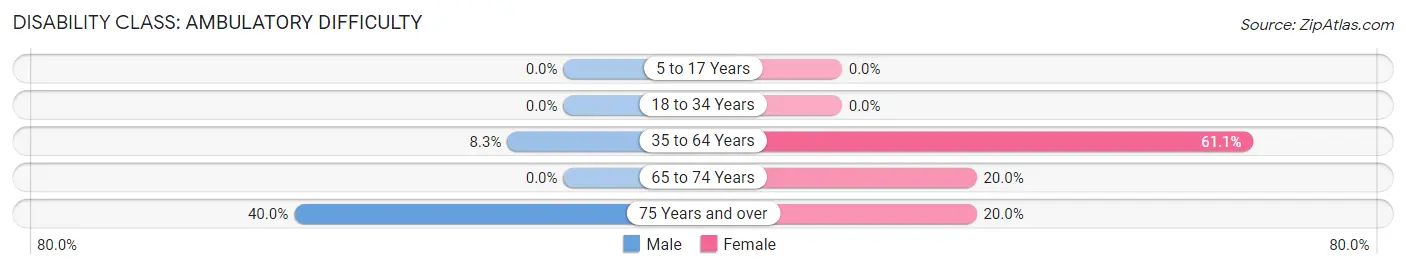
| Age Bracket | Male | Female |
| 5 to 17 Years | 0 (0.0%) | 0 (0.0%) |
| 18 to 34 Years | 0 (0.0%) | 0 (0.0%) |
| 35 to 64 Years | 2 (8.3%) | 11 (61.1%) |
| 65 to 74 Years | 0 (0.0%) | 3 (20.0%) |
| 75 Years and over | 4 (40.0%) | 1 (20.0%) |
Disability Class: Self-Care Difficulty
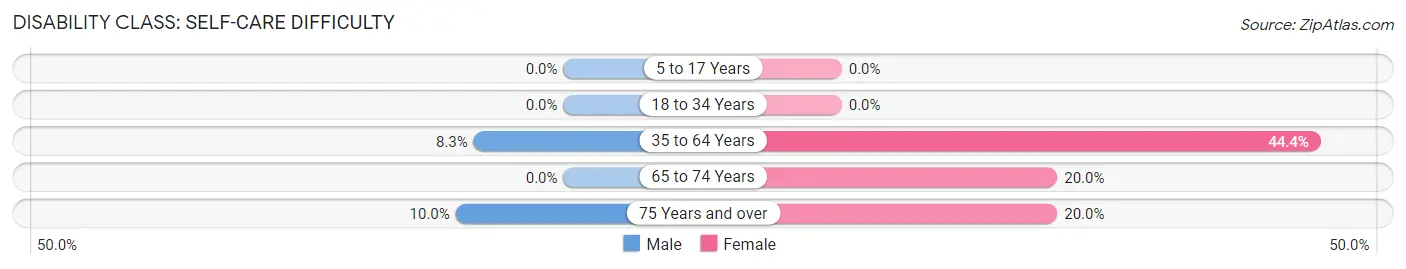
| Age Bracket | Male | Female |
| 5 to 17 Years | 0 (0.0%) | 0 (0.0%) |
| 18 to 34 Years | 0 (0.0%) | 0 (0.0%) |
| 35 to 64 Years | 2 (8.3%) | 8 (44.4%) |
| 65 to 74 Years | 0 (0.0%) | 3 (20.0%) |
| 75 Years and over | 1 (10.0%) | 1 (20.0%) |
Technology Access in Salem
Computing Device Access in Salem
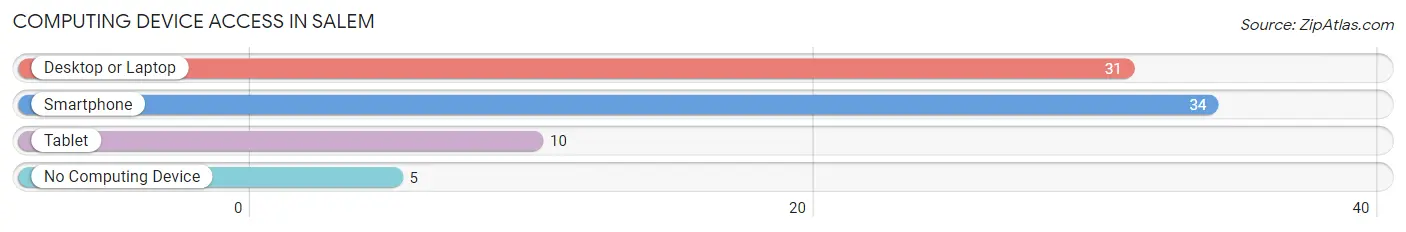
| Device Type | # Households | % Households |
| Desktop or Laptop | 31 | 70.5% |
| Smartphone | 34 | 77.3% |
| Tablet | 10 | 22.7% |
| No Computing Device | 5 | 11.4% |
| Total | 44 | 100.0% |
Internet Access in Salem
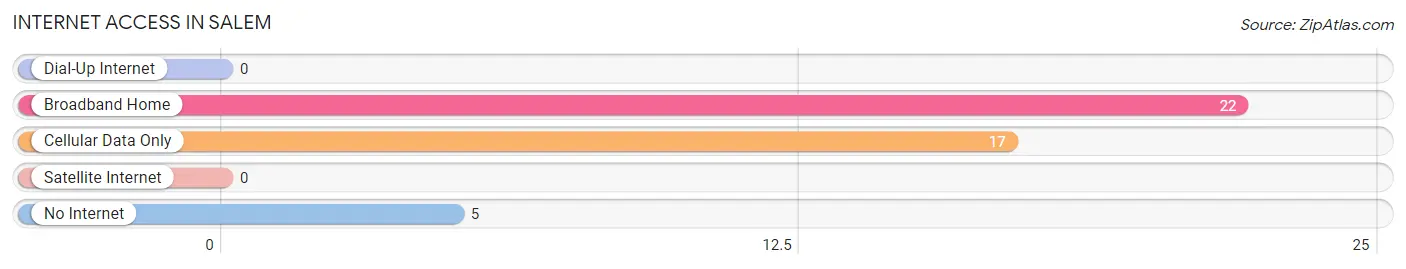
| Internet Type | # Households | % Households |
| Dial-Up Internet | 0 | 0.0% |
| Broadband Home | 22 | 50.0% |
| Cellular Data Only | 17 | 38.6% |
| Satellite Internet | 0 | 0.0% |
| No Internet | 5 | 11.4% |
| Total | 44 | 100.0% |
Salem Summary
Salem, Nebraska is a small town located in the southeastern corner of the state, in the county of Nemaha. It is situated on the banks of the Missouri River, and is home to a population of just over 1,000 people. The town was founded in 1856, and has a rich history of farming, ranching, and industry.
Geography
Salem is located in the southeastern corner of Nebraska, in Nemaha County. It is situated on the banks of the Missouri River, and is surrounded by rolling hills and farmland. The town is located approximately 30 miles south of Omaha, and is part of the Omaha-Council Bluffs metropolitan area. The town is located at an elevation of 1,072 feet above sea level.
Economy
The economy of Salem is largely based on agriculture and industry. The town is home to several large farms and ranches, as well as a number of small businesses. The town is also home to a number of manufacturing companies, including a plastics factory and a metal fabrication plant. The town is also home to a number of retail stores, restaurants, and other services.
Demographics
As of the 2010 census, the population of Salem was 1,072. The racial makeup of the town was 97.2% White, 0.3% African American, 0.2% Native American, 0.2% Asian, 0.1% Pacific Islander, 0.7% from other races, and 1.3% from two or more races. Hispanic or Latino of any race were 2.2% of the population.
The median income for a household in Salem was $41,250, and the median income for a family was $48,750. The per capita income for the town was $19,945. About 8.2% of families and 10.2% of the population were below the poverty line, including 14.2% of those under age 18 and 8.3% of those age 65 or over.
History
Salem was founded in 1856 by a group of settlers from Ohio. The town was originally named “Salemville”, after the town of Salem, Ohio. The town was incorporated in 1872, and the name was changed to “Salem”. The town was a major stop on the Union Pacific Railroad, and was a major shipping point for grain and livestock.
In the early 1900s, Salem was home to a number of industries, including a flour mill, a brickyard, a creamery, and a canning factory. The town was also home to a number of retail stores, restaurants, and other services.
In the late 20th century, Salem began to experience a decline in population and economic activity. The town was hit hard by the Great Recession of 2008, and many businesses closed or moved away. However, the town has since seen a resurgence in population and economic activity, and is now home to a number of small businesses and services.
Common Questions
What is Per Capita Income in Salem?
Per Capita income in Salem is $35,448.
What is the Median Family Income in Salem?
Median Family Income in Salem is $53,500.
What is the Median Household income in Salem?
Median Household Income in Salem is $44,688.
What is Income or Wage Gap in Salem?
Income or Wage Gap in Salem is 50.9%.
Women in Salem earn 49.1 cents for every dollar earned by a man.
What is Inequality or Gini Index in Salem?
Inequality or Gini Index in Salem is 0.43.
What is the Total Population of Salem?
Total Population of Salem is 88.
What is the Total Male Population of Salem?
Total Male Population of Salem is 48.
What is the Total Female Population of Salem?
Total Female Population of Salem is 40.
What is the Ratio of Males per 100 Females in Salem?
There are 120.00 Males per 100 Females in Salem.
What is the Ratio of Females per 100 Males in Salem?
There are 83.33 Females per 100 Males in Salem.
What is the Median Population Age in Salem?
Median Population Age in Salem is 63.2 Years.
What is the Average Family Size in Salem
Average Family Size in Salem is 2.6 People.
What is the Average Household Size in Salem
Average Household Size in Salem is 2.0 People.
How Large is the Labor Force in Salem?
There are 21 People in the Labor Forcein in Salem.
What is the Percentage of People in the Labor Force in Salem?
26.6% of People are in the Labor Force in Salem.