Grant, NE Map & Demographics
Grant Map
Grant Overview
$33,053
PER CAPITA INCOME
$79,444
AVG FAMILY INCOME
$67,500
AVG HOUSEHOLD INCOME
15.7%
WAGE / INCOME GAP [ % ]
84.3¢/ $1
WAGE / INCOME GAP [ $ ]
0.40
INEQUALITY / GINI INDEX
1,398
TOTAL POPULATION
733
MALE POPULATION
665
FEMALE POPULATION
110.23
MALES / 100 FEMALES
90.72
FEMALES / 100 MALES
41.6
MEDIAN AGE
3.0
AVG FAMILY SIZE
2.4
AVG HOUSEHOLD SIZE
691
LABOR FORCE [ PEOPLE ]
63.3%
PERCENT IN LABOR FORCE
1.2%
UNEMPLOYMENT RATE
Grant Zip Codes
Grant Area Codes
Income in Grant
Income Overview in Grant
Per Capita Income in Grant is $33,053, while median incomes of families and households are $79,444 and $67,500 respectively.
| Characteristic | Number | Measure |
| Per Capita Income | 1,398 | $33,053 |
| Median Family Income | 398 | $79,444 |
| Mean Family Income | 398 | $87,212 |
| Median Household Income | 560 | $67,500 |
| Mean Household Income | 560 | $78,326 |
| Income Deficit | 398 | $0 |
| Wage / Income Gap (%) | 1,398 | 15.70% |
| Wage / Income Gap ($) | 1,398 | 84.30¢ per $1 |
| Gini / Inequality Index | 1,398 | 0.40 |
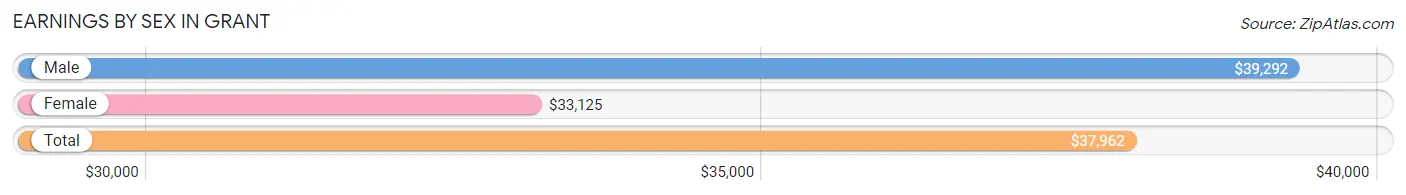
Earnings by Sex in Grant
Average Earnings in Grant are $37,962, $39,292 for men and $33,125 for women, a difference of 15.7%.
| Sex | Number | Average Earnings |
| Male | 431 (59.5%) | $39,292 |
| Female | 294 (40.6%) | $33,125 |
| Total | 725 (100.0%) | $37,962 |
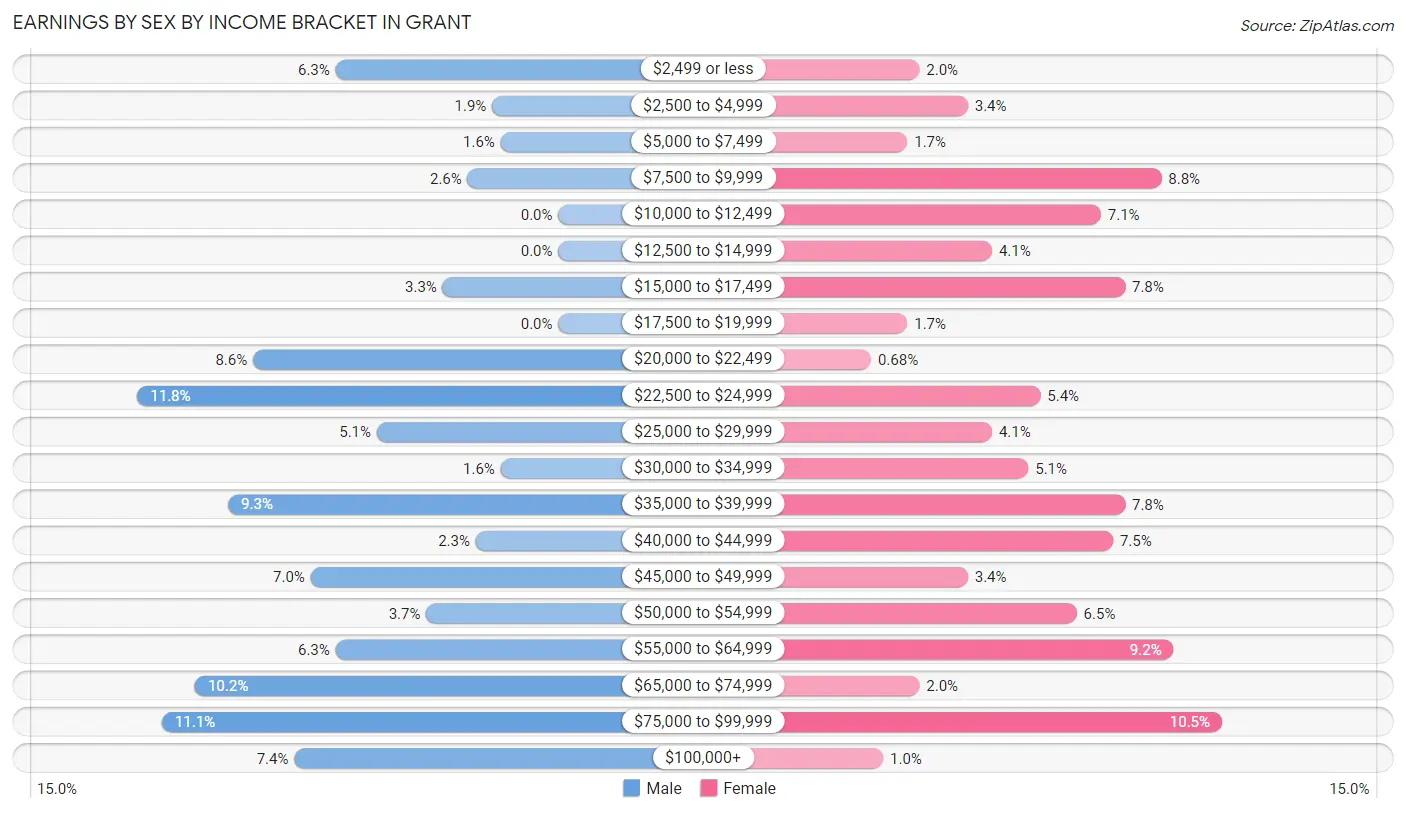
Earnings by Sex by Income Bracket in Grant
The most common earnings brackets in Grant are $22,500 to $24,999 for men (51 | 11.8%) and $75,000 to $99,999 for women (31 | 10.5%).
| Income | Male | Female |
| $2,499 or less | 27 (6.3%) | 6 (2.0%) |
| $2,500 to $4,999 | 8 (1.9%) | 10 (3.4%) |
| $5,000 to $7,499 | 7 (1.6%) | 5 (1.7%) |
| $7,500 to $9,999 | 11 (2.5%) | 26 (8.8%) |
| $10,000 to $12,499 | 0 (0.0%) | 21 (7.1%) |
| $12,500 to $14,999 | 0 (0.0%) | 12 (4.1%) |
| $15,000 to $17,499 | 14 (3.3%) | 23 (7.8%) |
| $17,500 to $19,999 | 0 (0.0%) | 5 (1.7%) |
| $20,000 to $22,499 | 37 (8.6%) | 2 (0.7%) |
| $22,500 to $24,999 | 51 (11.8%) | 16 (5.4%) |
| $25,000 to $29,999 | 22 (5.1%) | 12 (4.1%) |
| $30,000 to $34,999 | 7 (1.6%) | 15 (5.1%) |
| $35,000 to $39,999 | 40 (9.3%) | 23 (7.8%) |
| $40,000 to $44,999 | 10 (2.3%) | 22 (7.5%) |
| $45,000 to $49,999 | 30 (7.0%) | 10 (3.4%) |
| $50,000 to $54,999 | 16 (3.7%) | 19 (6.5%) |
| $55,000 to $64,999 | 27 (6.3%) | 27 (9.2%) |
| $65,000 to $74,999 | 44 (10.2%) | 6 (2.0%) |
| $75,000 to $99,999 | 48 (11.1%) | 31 (10.5%) |
| $100,000+ | 32 (7.4%) | 3 (1.0%) |
| Total | 431 (100.0%) | 294 (100.0%) |
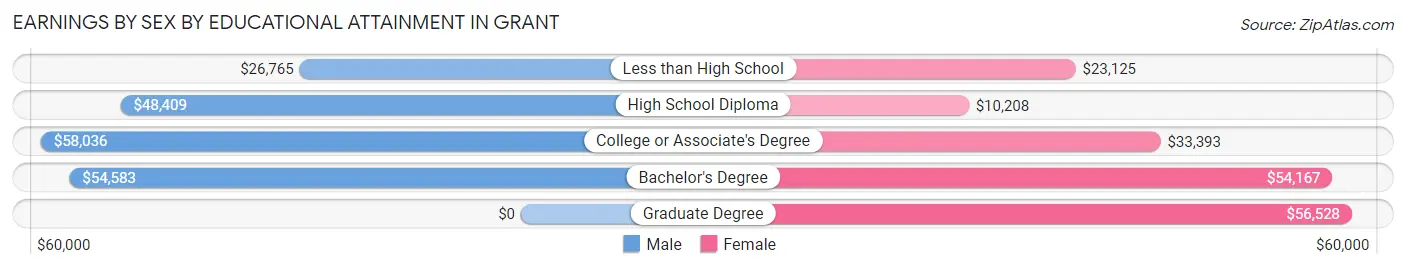
Earnings by Sex by Educational Attainment in Grant
Average earnings in Grant are $49,018 for men and $34,063 for women, a difference of 30.5%. Men with an educational attainment of college or associate's degree enjoy the highest average annual earnings of $58,036, while those with less than high school education earn the least with $26,765. Women with an educational attainment of graduate degree earn the most with the average annual earnings of $56,528, while those with high school diploma education have the smallest earnings of $10,208.
| Educational Attainment | Male Income | Female Income |
| Less than High School | $26,765 | $23,125 |
| High School Diploma | $48,409 | $10,208 |
| College or Associate's Degree | $58,036 | $33,393 |
| Bachelor's Degree | $54,583 | $54,167 |
| Graduate Degree | - | - |
| Total | $49,018 | $34,063 |
Family Income in Grant
Family Income Brackets in Grant
According to the Grant family income data, there are 105 families falling into the $100,000 to $149,999 income range, which is the most common income bracket and makes up 26.4% of all families.
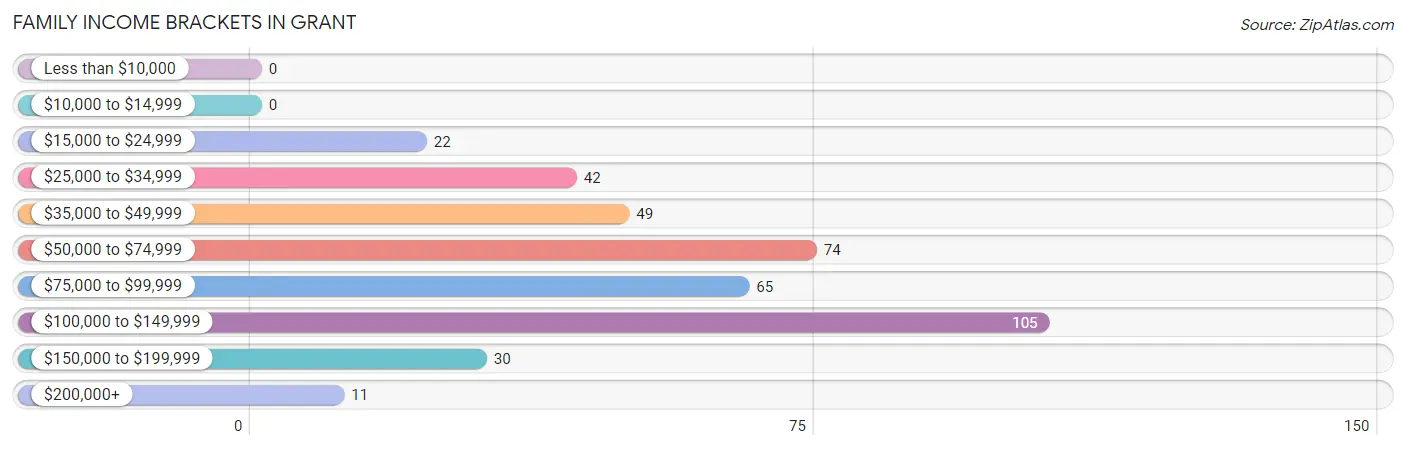
| Income Bracket | # Families | % Families |
| Less than $10,000 | 0 | 0.0% |
| $10,000 to $14,999 | 0 | 0.0% |
| $15,000 to $24,999 | 22 | 5.5% |
| $25,000 to $34,999 | 42 | 10.6% |
| $35,000 to $49,999 | 49 | 12.3% |
| $50,000 to $74,999 | 74 | 18.6% |
| $75,000 to $99,999 | 65 | 16.3% |
| $100,000 to $149,999 | 105 | 26.4% |
| $150,000 to $199,999 | 30 | 7.5% |
| $200,000+ | 11 | 2.8% |
Family Income by Famaliy Size in Grant
4-person families (37 | 9.3%) account for the highest median family income in Grant with $98,125 per family, while 2-person families (246 | 61.8%) have the highest median income of $36,250 per family member.
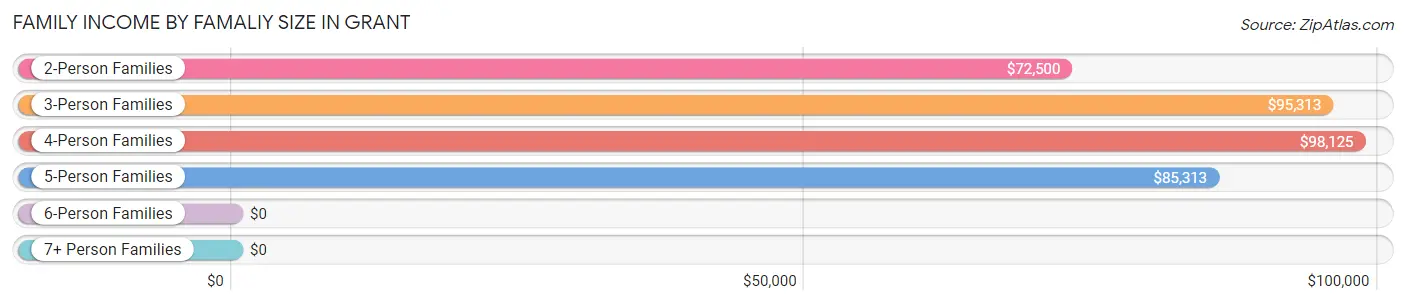
| Income Bracket | # Families | Median Income |
| 2-Person Families | 246 (61.8%) | $72,500 |
| 3-Person Families | 51 (12.8%) | $95,313 |
| 4-Person Families | 37 (9.3%) | $98,125 |
| 5-Person Families | 51 (12.8%) | $85,313 |
| 6-Person Families | 11 (2.8%) | $0 |
| 7+ Person Families | 2 (0.5%) | $0 |
| Total | 398 (100.0%) | $79,444 |
Family Income by Number of Earners in Grant
The median family income in Grant is $79,444, with families comprising 3+ earners (27) having the highest median family income of $99,375, while families with no earners (84) have the lowest median family income of $40,000, accounting for 6.8% and 21.1% of families, respectively.
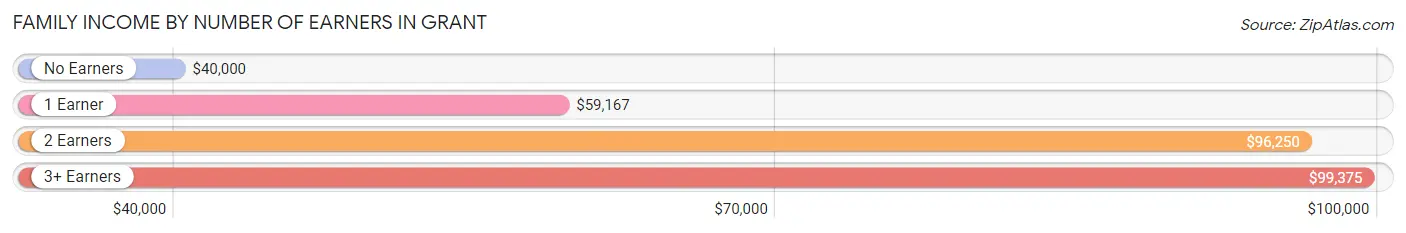
| Number of Earners | # Families | Median Income |
| No Earners | 84 (21.1%) | $40,000 |
| 1 Earner | 86 (21.6%) | $59,167 |
| 2 Earners | 201 (50.5%) | $96,250 |
| 3+ Earners | 27 (6.8%) | $99,375 |
| Total | 398 (100.0%) | $79,444 |
Household Income in Grant
Household Income Brackets in Grant
With 108 households falling in the category, the $100,000 to $149,999 income range is the most frequent in Grant, accounting for 19.3% of all households. In contrast, only 13 households (2.3%) fall into the less than $10,000 income bracket, making it the least populous group.
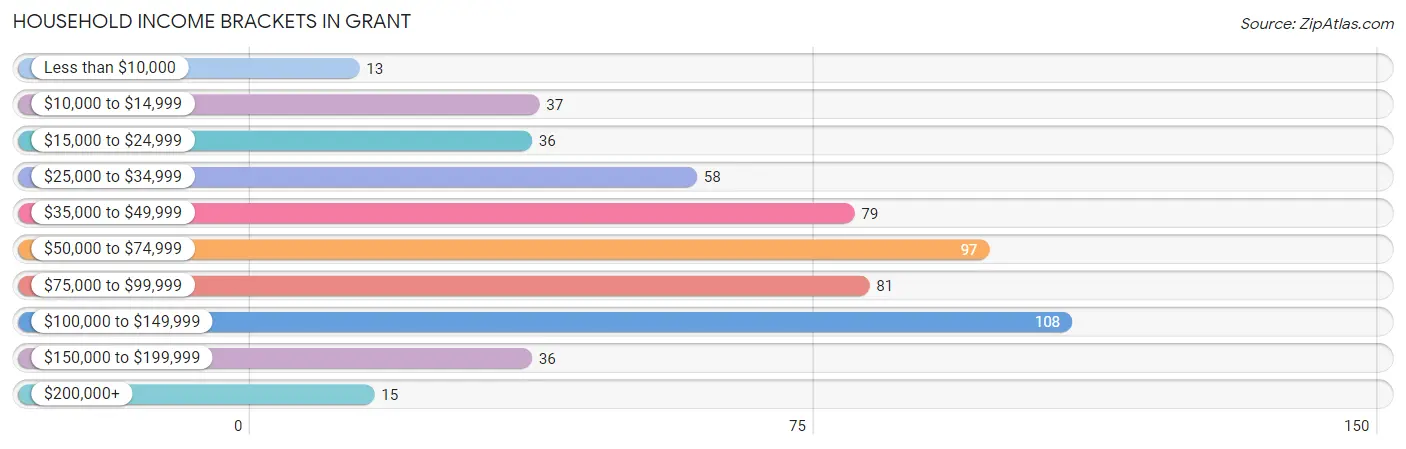
| Income Bracket | # Households | % Households |
| Less than $10,000 | 13 | 2.3% |
| $10,000 to $14,999 | 37 | 6.6% |
| $15,000 to $24,999 | 36 | 6.4% |
| $25,000 to $34,999 | 58 | 10.4% |
| $35,000 to $49,999 | 79 | 14.1% |
| $50,000 to $74,999 | 97 | 17.3% |
| $75,000 to $99,999 | 81 | 14.5% |
| $100,000 to $149,999 | 108 | 19.3% |
| $150,000 to $199,999 | 36 | 6.4% |
| $200,000+ | 15 | 2.7% |
Household Income by Householder Age in Grant
The median household income in Grant is $67,500, with the highest median household income of $95,357 found in the 25 to 44 years age bracket for the primary householder. A total of 158 households (28.2%) fall into this category. Meanwhile, the 65+ years age bracket for the primary householder has the lowest median household income of $47,321, with 212 households (37.9%) in this group.
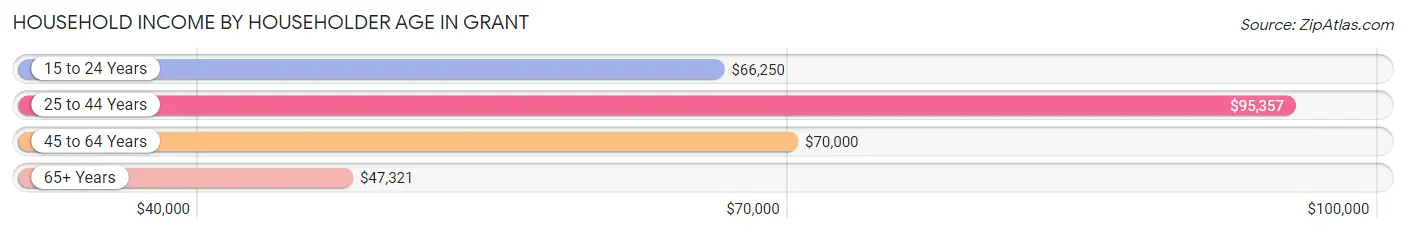
| Income Bracket | # Households | Median Income |
| 15 to 24 Years | 10 (1.8%) | $66,250 |
| 25 to 44 Years | 158 (28.2%) | $95,357 |
| 45 to 64 Years | 180 (32.1%) | $70,000 |
| 65+ Years | 212 (37.9%) | $47,321 |
| Total | 560 (100.0%) | $67,500 |
Poverty in Grant
Income Below Poverty by Sex and Age in Grant
With 5.6% poverty level for males and 13.2% for females among the residents of Grant, under 5 year old males and 15 year old females are the most vulnerable to poverty, with 8 males (20.0%) and 4 females (50.0%) in their respective age groups living below the poverty level.
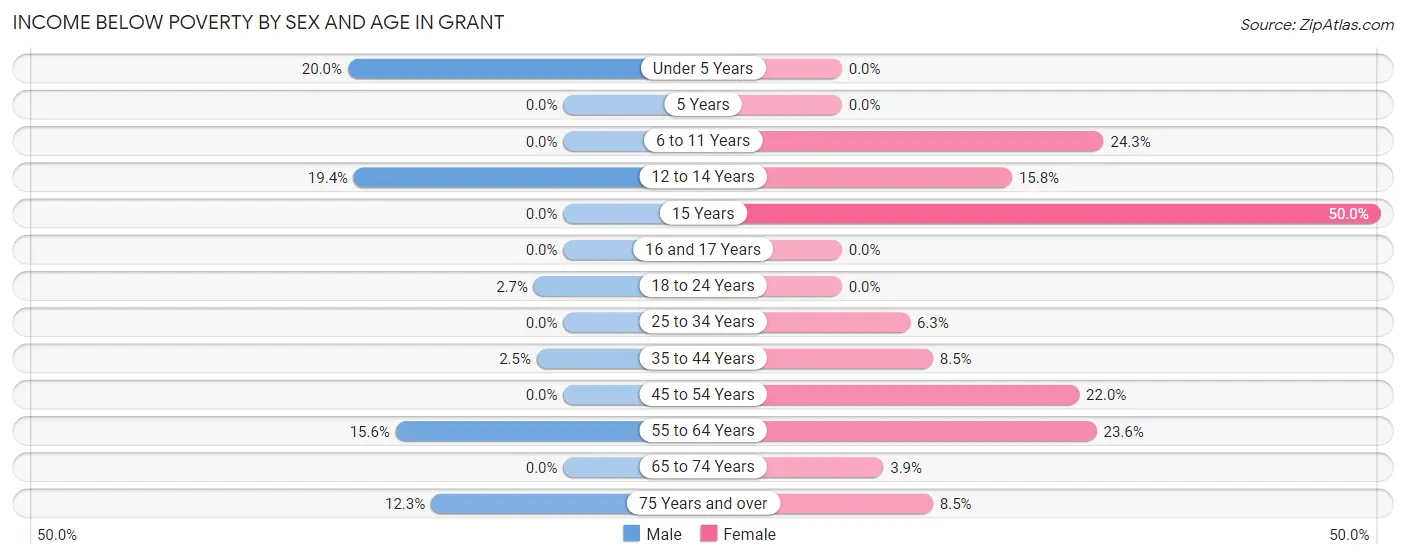
| Age Bracket | Male | Female |
| Under 5 Years | 8 (20.0%) | 0 (0.0%) |
| 5 Years | 0 (0.0%) | 0 (0.0%) |
| 6 to 11 Years | 0 (0.0%) | 17 (24.3%) |
| 12 to 14 Years | 7 (19.4%) | 3 (15.8%) |
| 15 Years | 0 (0.0%) | 4 (50.0%) |
| 16 and 17 Years | 0 (0.0%) | 0 (0.0%) |
| 18 to 24 Years | 2 (2.7%) | 0 (0.0%) |
| 25 to 34 Years | 0 (0.0%) | 5 (6.3%) |
| 35 to 44 Years | 3 (2.5%) | 6 (8.5%) |
| 45 to 54 Years | 0 (0.0%) | 13 (22.0%) |
| 55 to 64 Years | 14 (15.6%) | 26 (23.6%) |
| 65 to 74 Years | 0 (0.0%) | 3 (3.8%) |
| 75 Years and over | 7 (12.3%) | 6 (8.5%) |
| Total | 41 (5.6%) | 83 (13.2%) |
Income Above Poverty by Sex and Age in Grant
According to the poverty statistics in Grant, males aged 5 years and females aged under 5 years are the age groups that are most secure financially, with 100.0% of males and 100.0% of females in these age groups living above the poverty line.
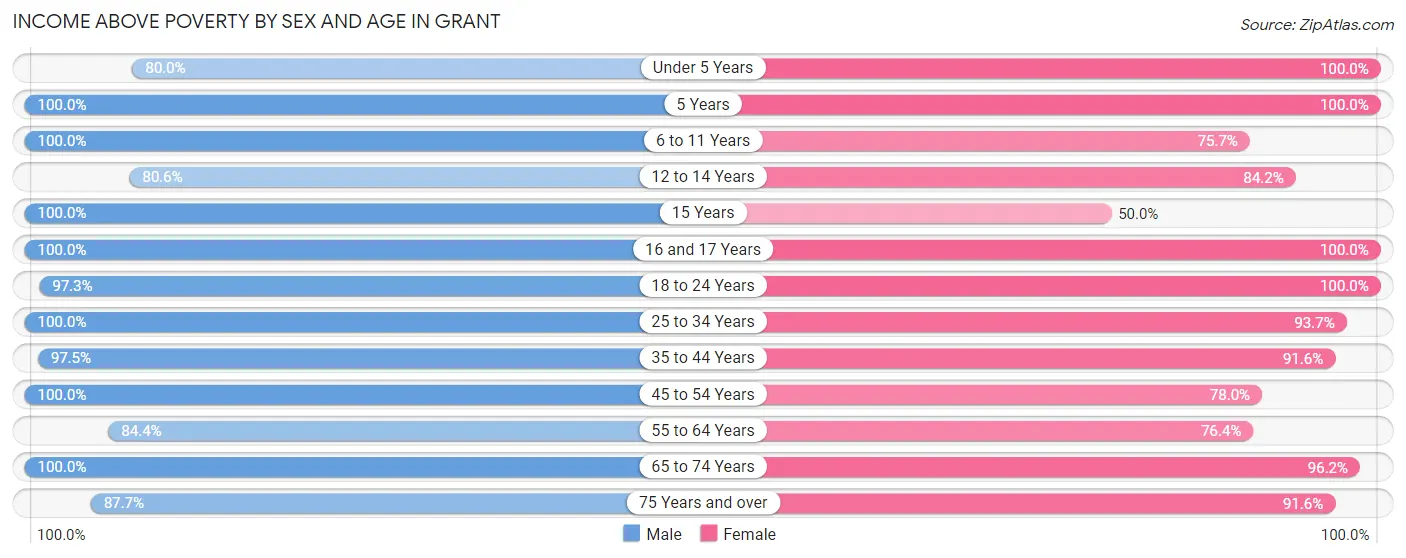
| Age Bracket | Male | Female |
| Under 5 Years | 32 (80.0%) | 30 (100.0%) |
| 5 Years | 19 (100.0%) | 12 (100.0%) |
| 6 to 11 Years | 62 (100.0%) | 53 (75.7%) |
| 12 to 14 Years | 29 (80.6%) | 16 (84.2%) |
| 15 Years | 6 (100.0%) | 4 (50.0%) |
| 16 and 17 Years | 10 (100.0%) | 19 (100.0%) |
| 18 to 24 Years | 71 (97.3%) | 5 (100.0%) |
| 25 to 34 Years | 79 (100.0%) | 74 (93.7%) |
| 35 to 44 Years | 119 (97.5%) | 65 (91.5%) |
| 45 to 54 Years | 35 (100.0%) | 46 (78.0%) |
| 55 to 64 Years | 76 (84.4%) | 84 (76.4%) |
| 65 to 74 Years | 99 (100.0%) | 75 (96.2%) |
| 75 Years and over | 50 (87.7%) | 65 (91.5%) |
| Total | 687 (94.4%) | 548 (86.9%) |
Income Below Poverty Among Married-Couple Families in Grant
The poverty statistics for married-couple families in Grant show that 3.9% or 14 of the total 358 families live below the poverty line. Families with 3 or 4 children have the highest poverty rate of 5.3%, comprising of 3 families. On the other hand, families with 1 or 2 children have the lowest poverty rate of 0.0%, which includes 0 families.
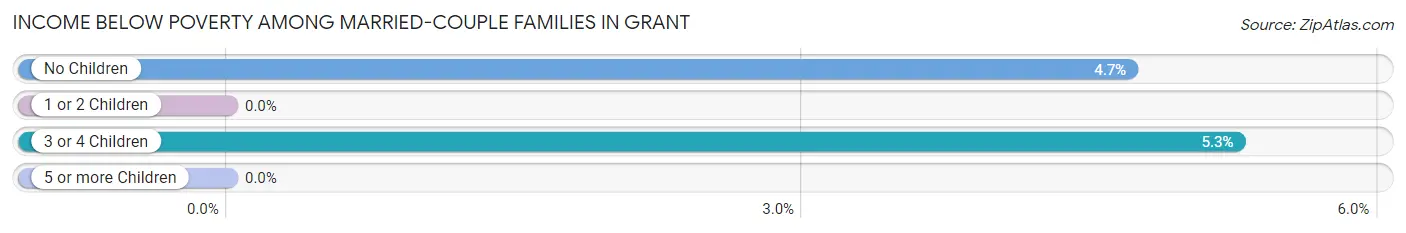
| Children | Above Poverty | Below Poverty |
| No Children | 223 (95.3%) | 11 (4.7%) |
| 1 or 2 Children | 65 (100.0%) | 0 (0.0%) |
| 3 or 4 Children | 54 (94.7%) | 3 (5.3%) |
| 5 or more Children | 2 (100.0%) | 0 (0.0%) |
| Total | 344 (96.1%) | 14 (3.9%) |
Income Below Poverty Among Single-Parent Households in Grant
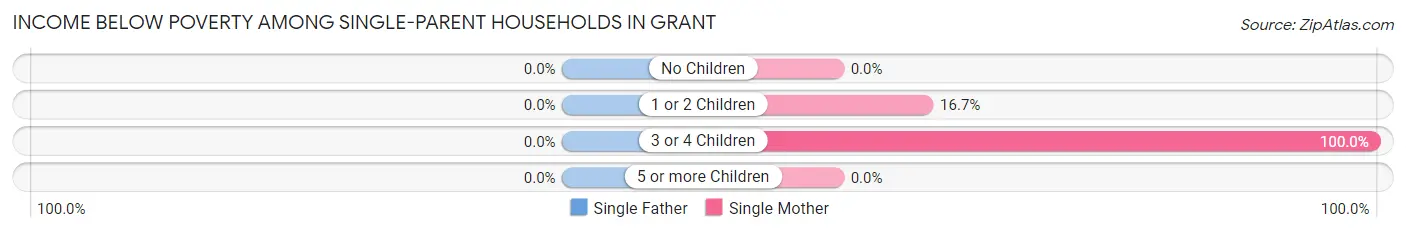
| Children | Single Father | Single Mother |
| No Children | 0 (0.0%) | 0 (0.0%) |
| 1 or 2 Children | 0 (0.0%) | 3 (16.7%) |
| 3 or 4 Children | 0 (0.0%) | 5 (100.0%) |
| 5 or more Children | 0 (0.0%) | 0 (0.0%) |
| Total | 0 (0.0%) | 8 (27.6%) |
Income Below Poverty Among Married-Couple vs Single-Parent Households in Grant
The poverty data for Grant shows that 14 of the married-couple family households (3.9%) and 8 of the single-parent households (20.0%) are living below the poverty level. Within the married-couple family households, those with 3 or 4 children have the highest poverty rate, with 3 households (5.3%) falling below the poverty line. Among the single-parent households, those with 3 or 4 children have the highest poverty rate, with 5 household (71.4%) living below poverty.
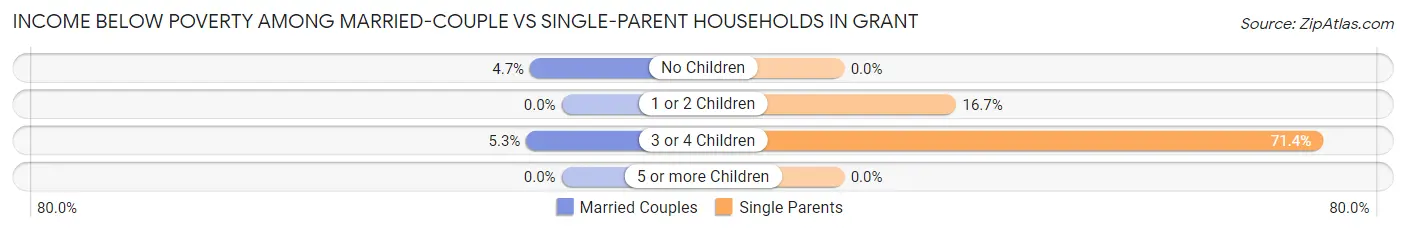
| Children | Married-Couple Families | Single-Parent Households |
| No Children | 11 (4.7%) | 0 (0.0%) |
| 1 or 2 Children | 0 (0.0%) | 3 (16.7%) |
| 3 or 4 Children | 3 (5.3%) | 5 (71.4%) |
| 5 or more Children | 0 (0.0%) | 0 (0.0%) |
| Total | 14 (3.9%) | 8 (20.0%) |
Race in Grant
The most populous races in Grant are White / Caucasian (1,269 | 90.8%), Hispanic or Latino (118 | 8.4%), and Two or more Races (80 | 5.7%).
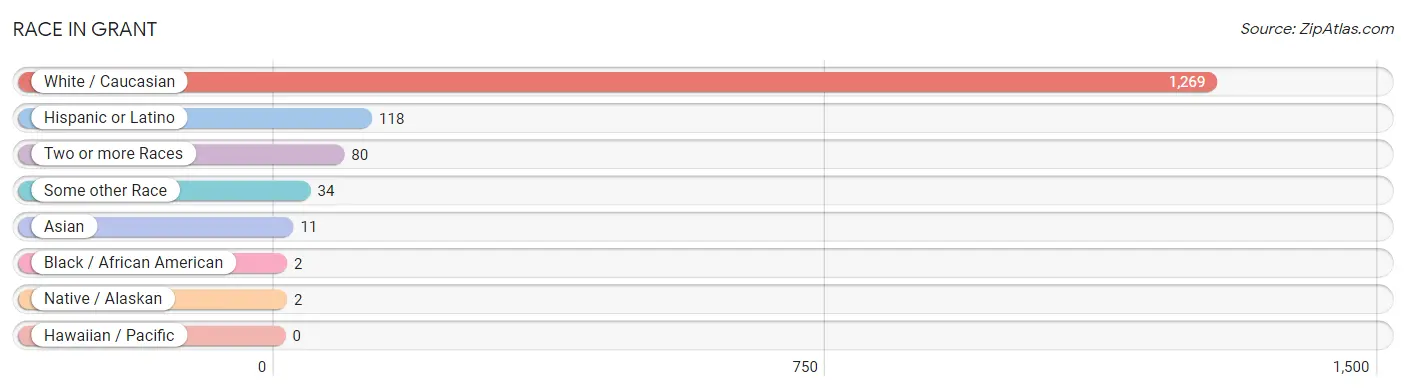
| Race | # Population | % Population |
| Asian | 11 | 0.8% |
| Black / African American | 2 | 0.1% |
| Hawaiian / Pacific | 0 | 0.0% |
| Hispanic or Latino | 118 | 8.4% |
| Native / Alaskan | 2 | 0.1% |
| White / Caucasian | 1,269 | 90.8% |
| Two or more Races | 80 | 5.7% |
| Some other Race | 34 | 2.4% |
| Total | 1,398 | 100.0% |
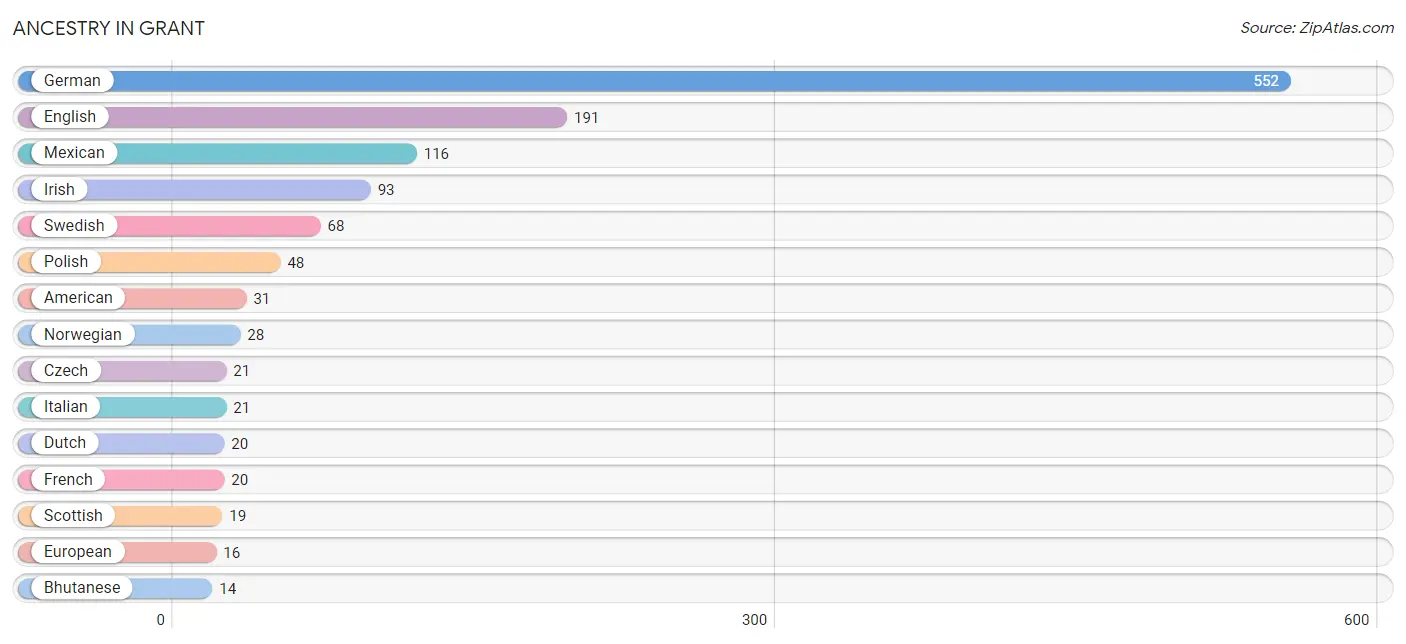
Ancestry in Grant
The most populous ancestries reported in Grant are German (552 | 39.5%), English (191 | 13.7%), Mexican (116 | 8.3%), Irish (93 | 6.7%), and Swedish (68 | 4.9%), together accounting for 72.9% of all Grant residents.
| Ancestry | # Population | % Population |
| American | 31 | 2.2% |
| Austrian | 3 | 0.2% |
| Belgian | 3 | 0.2% |
| Bhutanese | 14 | 1.0% |
| Brazilian | 4 | 0.3% |
| Burmese | 2 | 0.1% |
| Choctaw | 2 | 0.1% |
| Cuban | 2 | 0.1% |
| Czech | 21 | 1.5% |
| Czechoslovakian | 4 | 0.3% |
| Danish | 11 | 0.8% |
| Dutch | 20 | 1.4% |
| English | 191 | 13.7% |
| European | 16 | 1.1% |
| French | 20 | 1.4% |
| German | 552 | 39.5% |
| Hungarian | 2 | 0.1% |
| Indian (Asian) | 2 | 0.1% |
| Irish | 93 | 6.7% |
| Italian | 21 | 1.5% |
| Korean | 2 | 0.1% |
| Mexican | 116 | 8.3% |
| Native Hawaiian | 2 | 0.1% |
| Norwegian | 28 | 2.0% |
| Polish | 48 | 3.4% |
| Russian | 6 | 0.4% |
| Samoan | 2 | 0.1% |
| Scandinavian | 5 | 0.4% |
| Scotch-Irish | 8 | 0.6% |
| Scottish | 19 | 1.4% |
| Sri Lankan | 2 | 0.1% |
| Swedish | 68 | 4.9% |
| Thai | 2 | 0.1% |
| Welsh | 4 | 0.3% | View All 34 Rows |
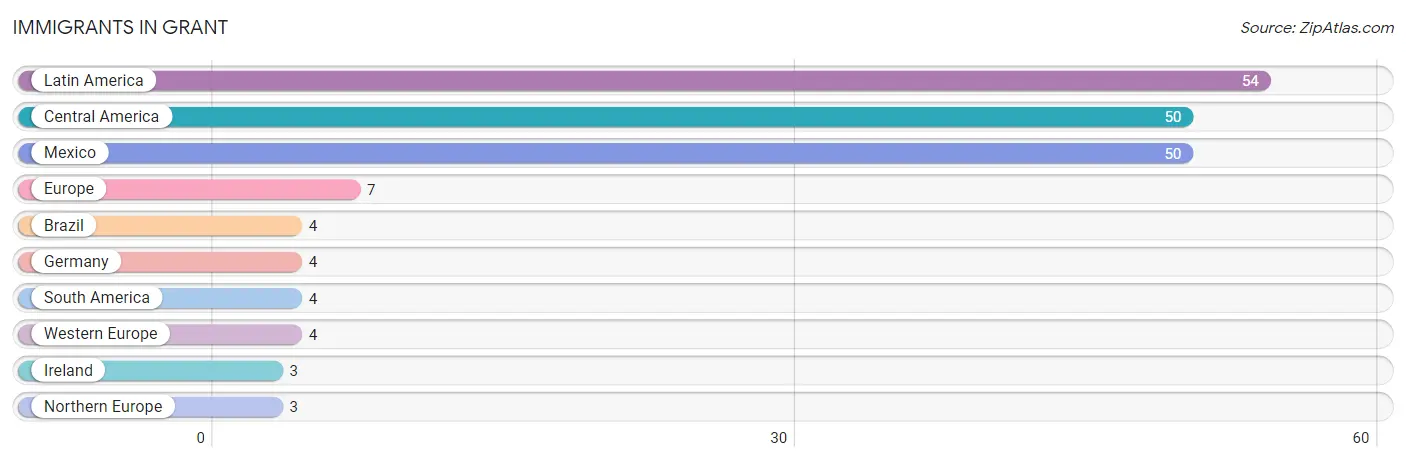
Immigrants in Grant
The most numerous immigrant groups reported in Grant came from Latin America (54 | 3.9%), Central America (50 | 3.6%), Mexico (50 | 3.6%), Europe (7 | 0.5%), and Brazil (4 | 0.3%), together accounting for 11.8% of all Grant residents.
| Immigration Origin | # Population | % Population |
| Brazil | 4 | 0.3% |
| Central America | 50 | 3.6% |
| Europe | 7 | 0.5% |
| Germany | 4 | 0.3% |
| Ireland | 3 | 0.2% |
| Latin America | 54 | 3.9% |
| Mexico | 50 | 3.6% |
| Northern Europe | 3 | 0.2% |
| South America | 4 | 0.3% |
| Western Europe | 4 | 0.3% | View All 10 Rows |
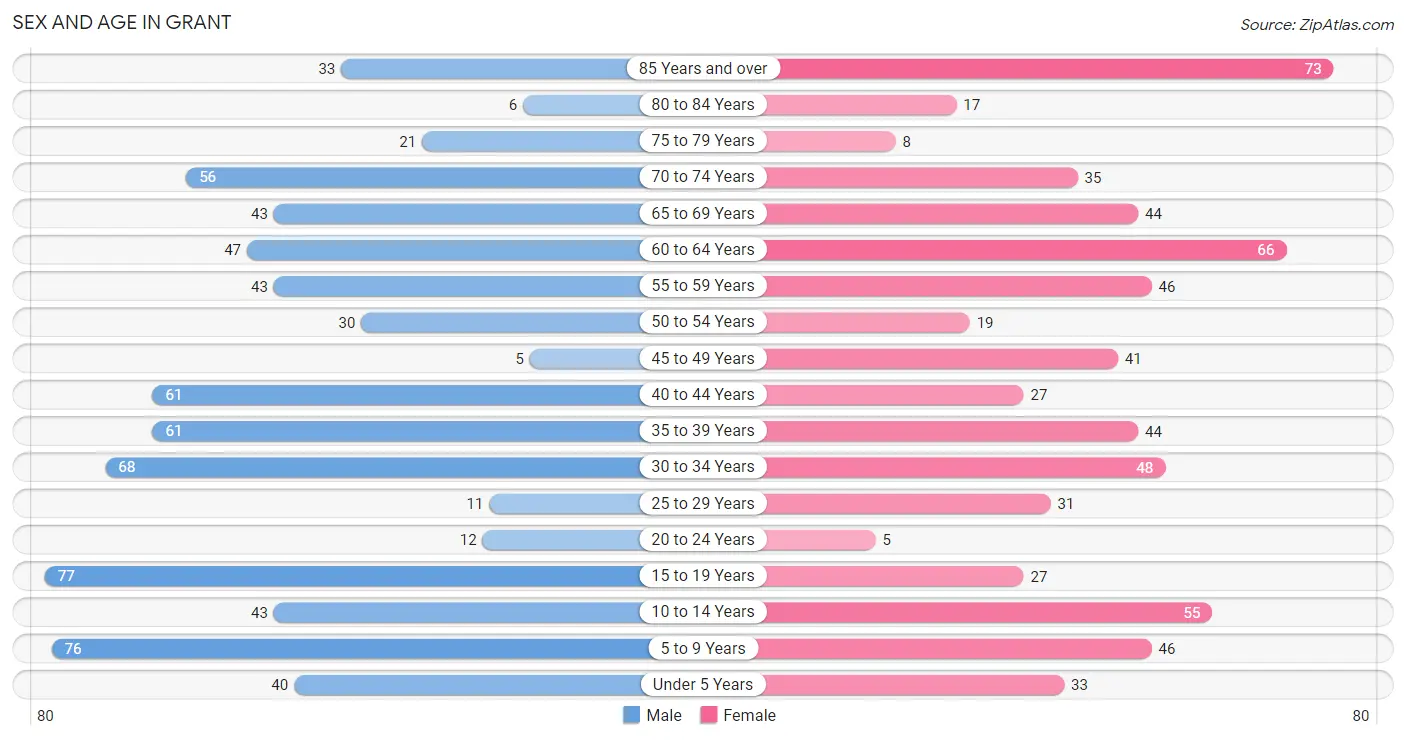
Sex and Age in Grant
Sex and Age in Grant
The most populous age groups in Grant are 15 to 19 Years (77 | 10.5%) for men and 85 Years and over (73 | 11.0%) for women.
| Age Bracket | Male | Female |
| Under 5 Years | 40 (5.5%) | 33 (5.0%) |
| 5 to 9 Years | 76 (10.4%) | 46 (6.9%) |
| 10 to 14 Years | 43 (5.9%) | 55 (8.3%) |
| 15 to 19 Years | 77 (10.5%) | 27 (4.1%) |
| 20 to 24 Years | 12 (1.6%) | 5 (0.7%) |
| 25 to 29 Years | 11 (1.5%) | 31 (4.7%) |
| 30 to 34 Years | 68 (9.3%) | 48 (7.2%) |
| 35 to 39 Years | 61 (8.3%) | 44 (6.6%) |
| 40 to 44 Years | 61 (8.3%) | 27 (4.1%) |
| 45 to 49 Years | 5 (0.7%) | 41 (6.2%) |
| 50 to 54 Years | 30 (4.1%) | 19 (2.9%) |
| 55 to 59 Years | 43 (5.9%) | 46 (6.9%) |
| 60 to 64 Years | 47 (6.4%) | 66 (9.9%) |
| 65 to 69 Years | 43 (5.9%) | 44 (6.6%) |
| 70 to 74 Years | 56 (7.6%) | 35 (5.3%) |
| 75 to 79 Years | 21 (2.9%) | 8 (1.2%) |
| 80 to 84 Years | 6 (0.8%) | 17 (2.6%) |
| 85 Years and over | 33 (4.5%) | 73 (11.0%) |
| Total | 733 (100.0%) | 665 (100.0%) |
Families and Households in Grant
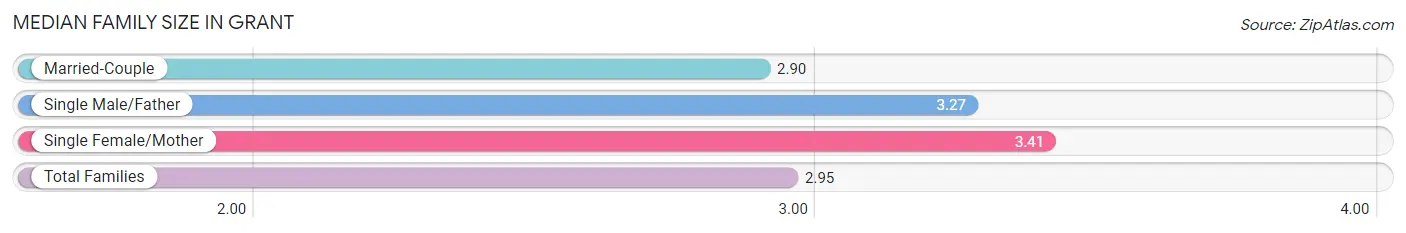
Median Family Size in Grant
The median family size in Grant is 2.95 persons per family, with single female/mother families (29 | 7.3%) accounting for the largest median family size of 3.41 persons per family. On the other hand, married-couple families (358 | 89.9%) represent the smallest median family size with 2.90 persons per family.
| Family Type | # Families | Family Size |
| Married-Couple | 358 (89.9%) | 2.90 |
| Single Male/Father | 11 (2.8%) | 3.27 |
| Single Female/Mother | 29 (7.3%) | 3.41 |
| Total Families | 398 (100.0%) | 2.95 |
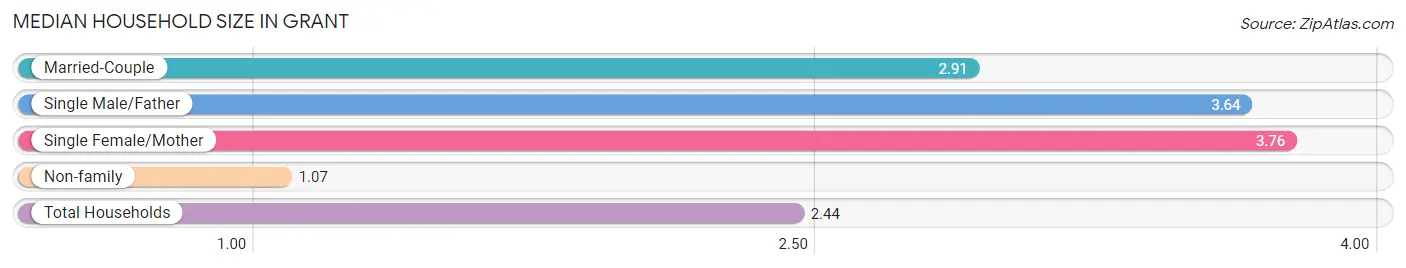
Median Household Size in Grant
The median household size in Grant is 2.44 persons per household, with single female/mother households (29 | 5.2%) accounting for the largest median household size of 3.76 persons per household. non-family households (162 | 28.9%) represent the smallest median household size with 1.07 persons per household.
| Household Type | # Households | Household Size |
| Married-Couple | 358 (63.9%) | 2.91 |
| Single Male/Father | 11 (2.0%) | 3.64 |
| Single Female/Mother | 29 (5.2%) | 3.76 |
| Non-family | 162 (28.9%) | 1.07 |
| Total Households | 560 (100.0%) | 2.44 |
Household Size by Marriage Status in Grant
Out of a total of 560 households in Grant, 398 (71.1%) are family households, while 162 (28.9%) are nonfamily households. The most numerous type of family households are 2-person households, comprising 244, and the most common type of nonfamily households are 1-person households, comprising 156.
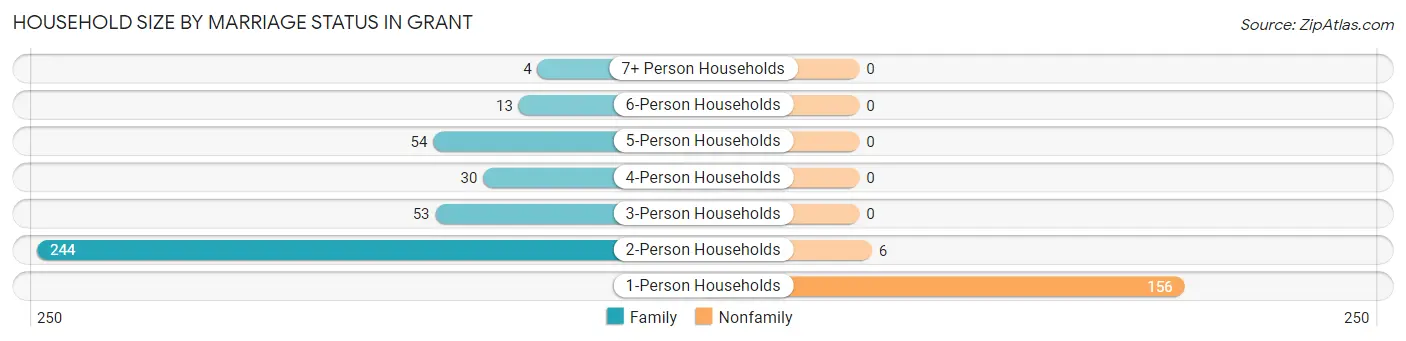
| Household Size | Family Households | Nonfamily Households |
| 1-Person Households | - | 156 (27.9%) |
| 2-Person Households | 244 (43.6%) | 6 (1.1%) |
| 3-Person Households | 53 (9.5%) | 0 (0.0%) |
| 4-Person Households | 30 (5.4%) | 0 (0.0%) |
| 5-Person Households | 54 (9.6%) | 0 (0.0%) |
| 6-Person Households | 13 (2.3%) | 0 (0.0%) |
| 7+ Person Households | 4 (0.7%) | 0 (0.0%) |
| Total | 398 (71.1%) | 162 (28.9%) |
Female Fertility in Grant
Fertility by Age in Grant
Average fertility rate in Grant is 22.0 births per 1,000 women. Women in the age bracket of 20 to 34 years have the highest fertility rate with 60.0 births per 1,000 women. Women in the age bracket of 20 to 34 years acount for 100.0% of all women with births.
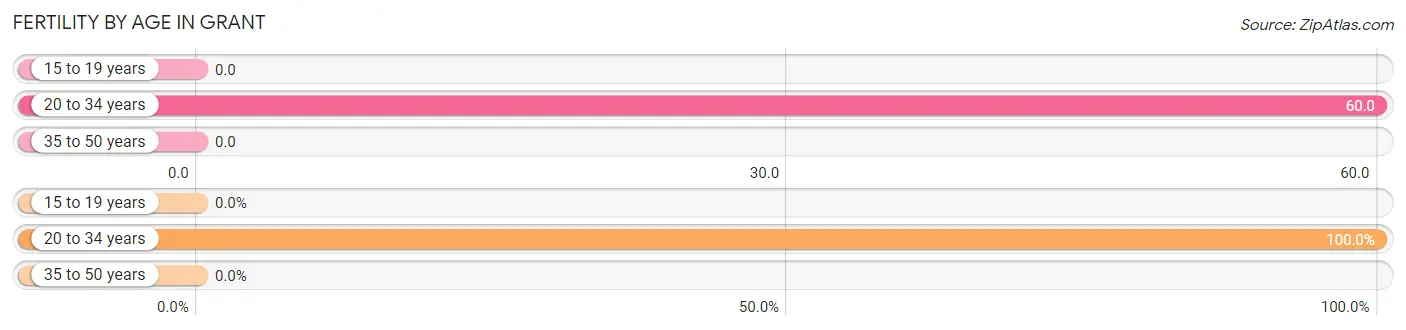
| Age Bracket | Women with Births | Births / 1,000 Women |
| 15 to 19 years | 0 (0.0%) | 0.0 |
| 20 to 34 years | 5 (100.0%) | 60.0 |
| 35 to 50 years | 0 (0.0%) | 0.0 |
| Total | 5 (100.0%) | 22.0 |
Fertility by Age by Marriage Status in Grant
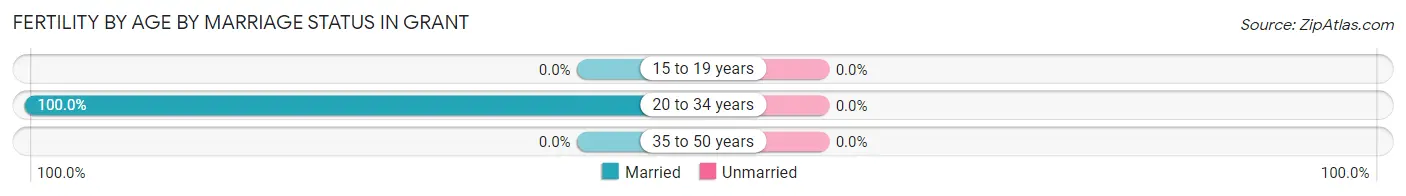
| Age Bracket | Married | Unmarried |
| 15 to 19 years | 0 (0.0%) | 0 (0.0%) |
| 20 to 34 years | 5 (100.0%) | 0 (0.0%) |
| 35 to 50 years | 0 (0.0%) | 0 (0.0%) |
| Total | 5 (100.0%) | 0 (0.0%) |
Fertility by Education in Grant
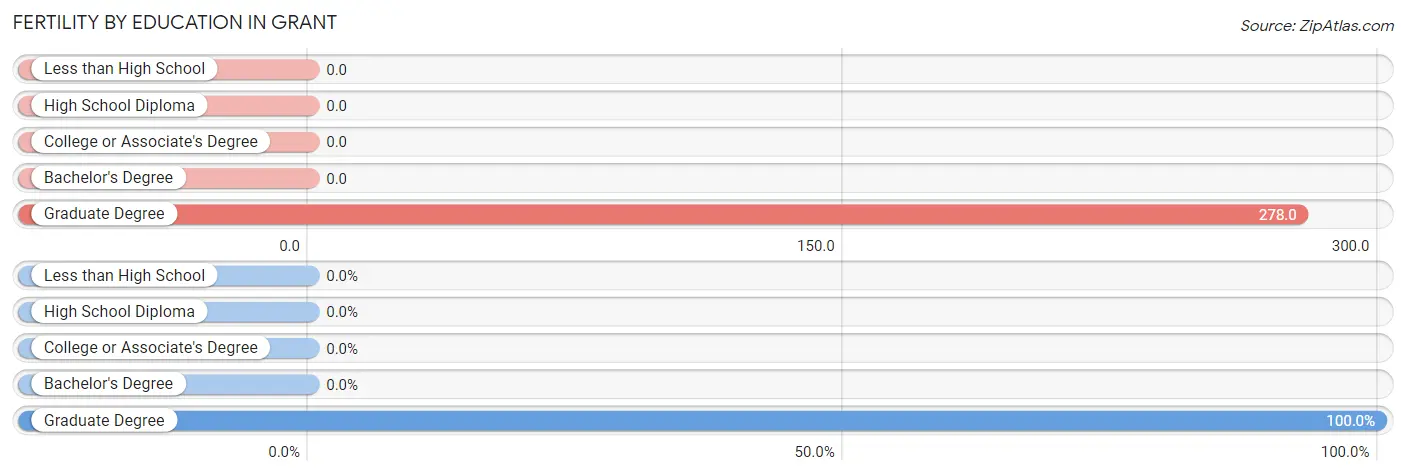
| Educational Attainment | Women with Births | Births / 1,000 Women |
| Less than High School | 0 (0.0%) | 0.0 |
| High School Diploma | 0 (0.0%) | 0.0 |
| College or Associate's Degree | 0 (0.0%) | 0.0 |
| Bachelor's Degree | 0 (0.0%) | 0.0 |
| Graduate Degree | 5 (100.0%) | 278.0 |
| Total | 5 (100.0%) | 22.0 |
Fertility by Education by Marriage Status in Grant
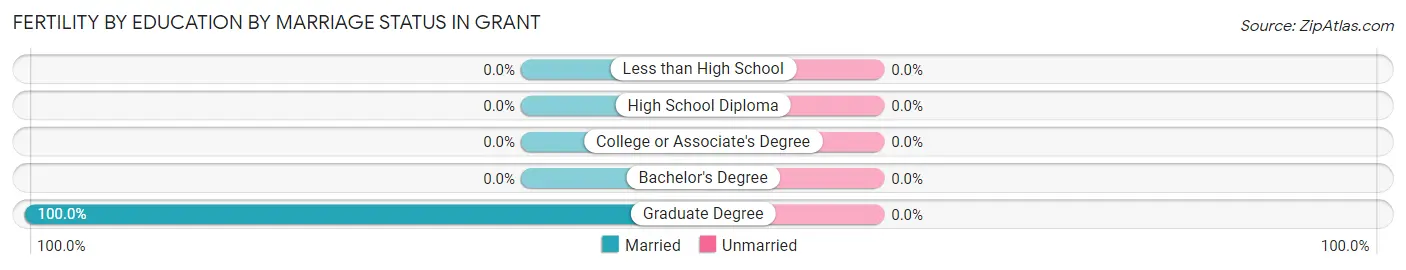
| Educational Attainment | Married | Unmarried |
| Less than High School | 0 (0.0%) | 0 (0.0%) |
| High School Diploma | 0 (0.0%) | 0 (0.0%) |
| College or Associate's Degree | 0 (0.0%) | 0 (0.0%) |
| Bachelor's Degree | 0 (0.0%) | 0 (0.0%) |
| Graduate Degree | 5 (100.0%) | 0 (0.0%) |
| Total | 5 (100.0%) | 0 (0.0%) |
Employment Characteristics in Grant
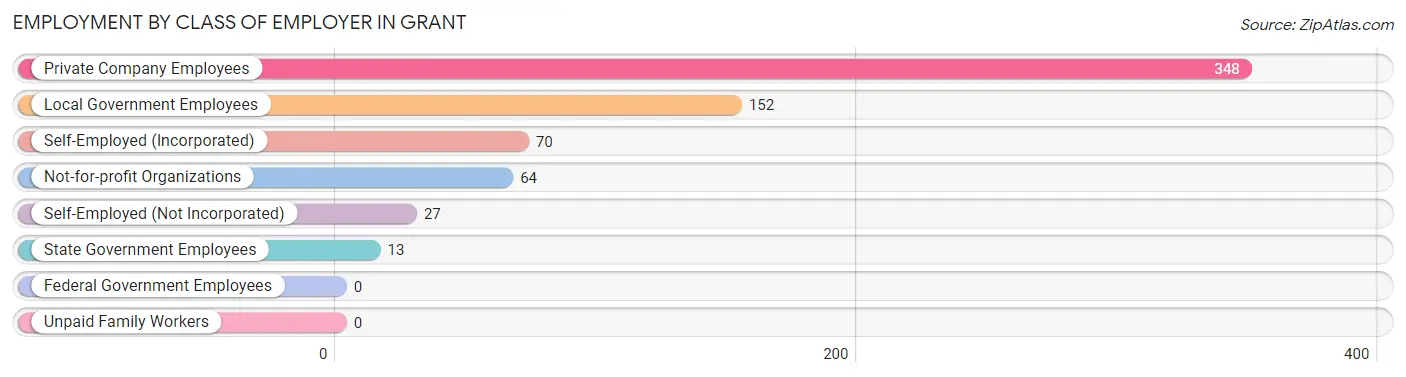
Employment by Class of Employer in Grant
Among the 674 employed individuals in Grant, private company employees (348 | 51.6%), local government employees (152 | 22.6%), and self-employed (incorporated) (70 | 10.4%) make up the most common classes of employment.
| Employer Class | # Employees | % Employees |
| Private Company Employees | 348 | 51.6% |
| Self-Employed (Incorporated) | 70 | 10.4% |
| Self-Employed (Not Incorporated) | 27 | 4.0% |
| Not-for-profit Organizations | 64 | 9.5% |
| Local Government Employees | 152 | 22.6% |
| State Government Employees | 13 | 1.9% |
| Federal Government Employees | 0 | 0.0% |
| Unpaid Family Workers | 0 | 0.0% |
| Total | 674 | 100.0% |
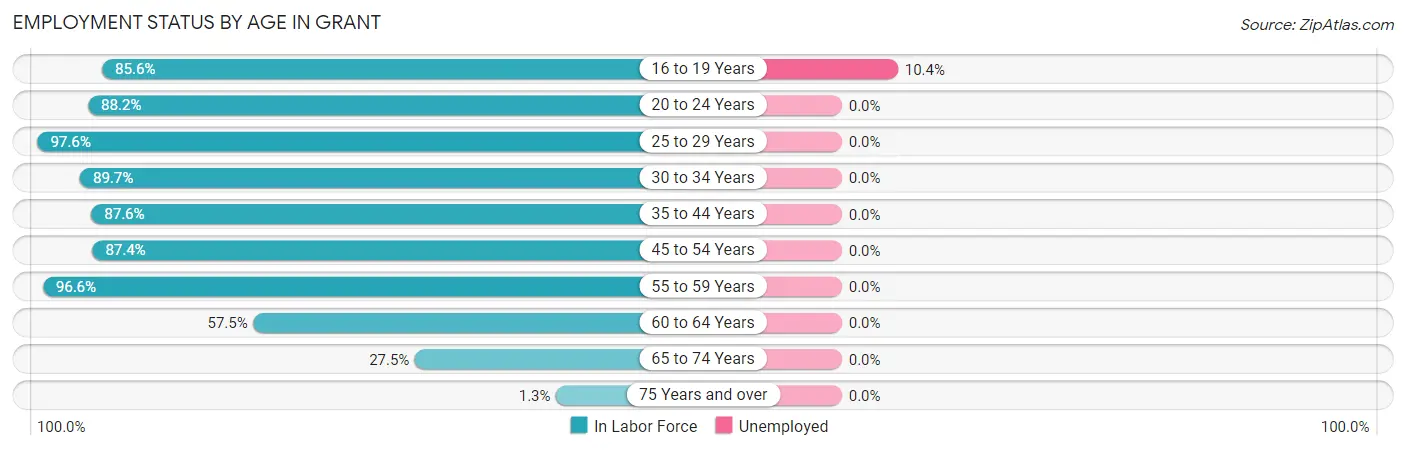
Employment Status by Age in Grant
According to the labor force statistics for Grant, out of the total population over 16 years of age (1,091), 63.3% or 691 individuals are in the labor force, with 1.2% or 8 of them unemployed. The age group with the highest labor force participation rate is 25 to 29 years, with 97.6% or 41 individuals in the labor force. Within the labor force, the 16 to 19 years age range has the highest percentage of unemployed individuals, with 10.4% or 8 of them being unemployed.
| Age Bracket | In Labor Force | Unemployed |
| 16 to 19 Years | 77 (85.6%) | 8 (10.4%) |
| 20 to 24 Years | 15 (88.2%) | 0 (0.0%) |
| 25 to 29 Years | 41 (97.6%) | 0 (0.0%) |
| 30 to 34 Years | 104 (89.7%) | 0 (0.0%) |
| 35 to 44 Years | 169 (87.6%) | 0 (0.0%) |
| 45 to 54 Years | 83 (87.4%) | 0 (0.0%) |
| 55 to 59 Years | 86 (96.6%) | 0 (0.0%) |
| 60 to 64 Years | 65 (57.5%) | 0 (0.0%) |
| 65 to 74 Years | 49 (27.5%) | 0 (0.0%) |
| 75 Years and over | 2 (1.3%) | 0 (0.0%) |
| Total | 691 (63.3%) | 8 (1.2%) |
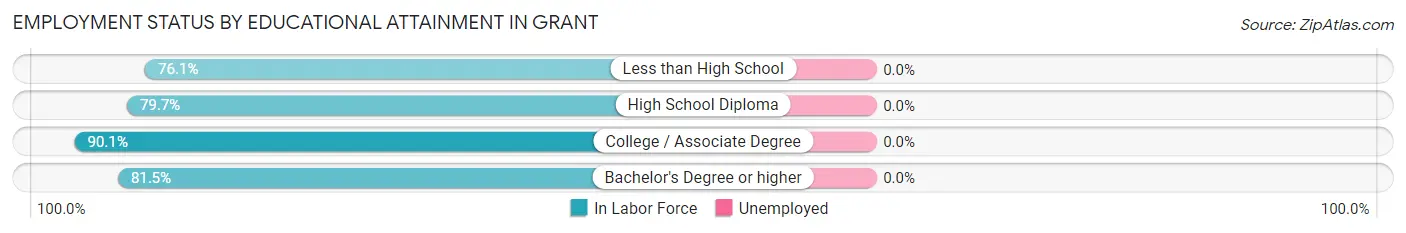
Employment Status by Educational Attainment in Grant
| Educational Attainment | In Labor Force | Unemployed |
| Less than High School | 54 (76.1%) | 0 (0.0%) |
| High School Diploma | 94 (79.7%) | 0 (0.0%) |
| College / Associate Degree | 272 (90.1%) | 0 (0.0%) |
| Bachelor's Degree or higher | 128 (81.5%) | 0 (0.0%) |
| Total | 548 (84.6%) | 0 (0.0%) |
Employment Occupations by Sex in Grant
Management, Business, Science and Arts Occupations
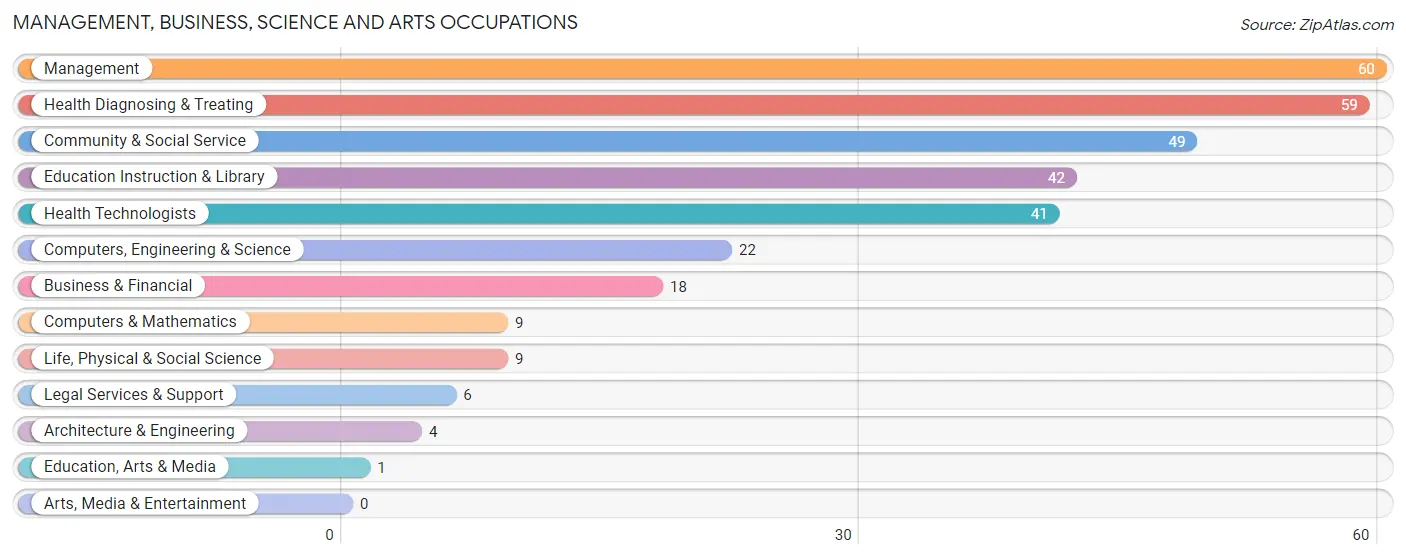
The most common Management, Business, Science and Arts occupations in Grant are Management (60 | 8.8%), Health Diagnosing & Treating (59 | 8.6%), Community & Social Service (49 | 7.2%), Education Instruction & Library (42 | 6.1%), and Health Technologists (41 | 6.0%).
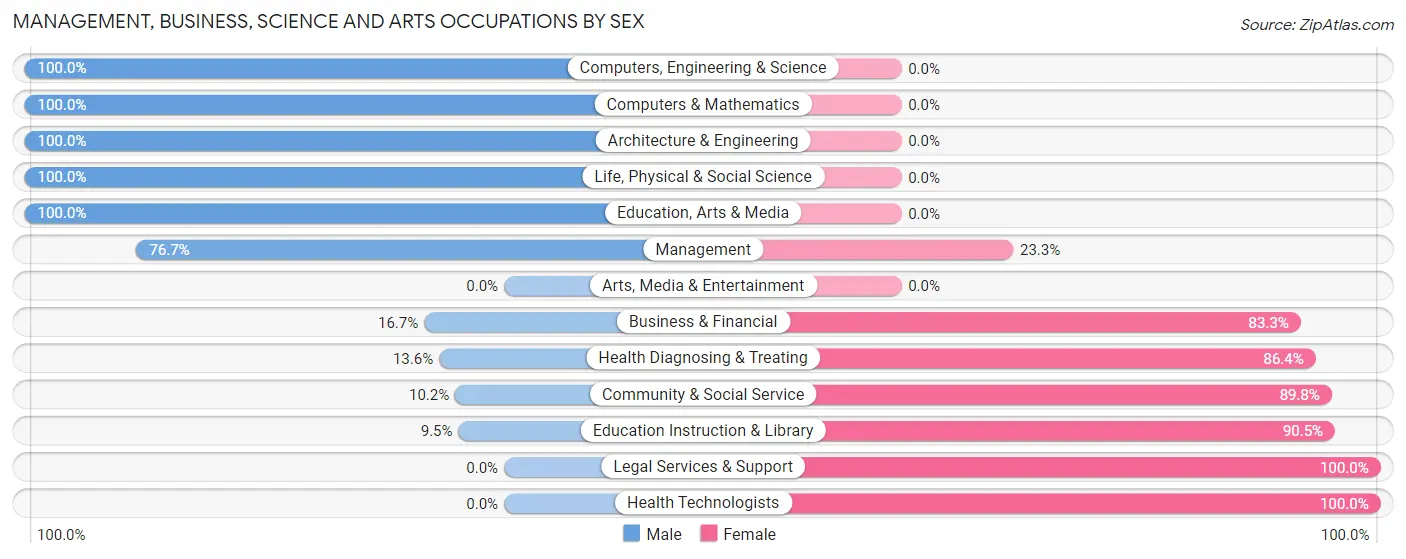
Management, Business, Science and Arts Occupations by Sex
Within the Management, Business, Science and Arts occupations in Grant, the most male-oriented occupations are Computers, Engineering & Science (100.0%), Computers & Mathematics (100.0%), and Architecture & Engineering (100.0%), while the most female-oriented occupations are Legal Services & Support (100.0%), Health Technologists (100.0%), and Education Instruction & Library (90.5%).
| Occupation | Male | Female |
| Management | 46 (76.7%) | 14 (23.3%) |
| Business & Financial | 3 (16.7%) | 15 (83.3%) |
| Computers, Engineering & Science | 22 (100.0%) | 0 (0.0%) |
| Computers & Mathematics | 9 (100.0%) | 0 (0.0%) |
| Architecture & Engineering | 4 (100.0%) | 0 (0.0%) |
| Life, Physical & Social Science | 9 (100.0%) | 0 (0.0%) |
| Community & Social Service | 5 (10.2%) | 44 (89.8%) |
| Education, Arts & Media | 1 (100.0%) | 0 (0.0%) |
| Legal Services & Support | 0 (0.0%) | 6 (100.0%) |
| Education Instruction & Library | 4 (9.5%) | 38 (90.5%) |
| Arts, Media & Entertainment | 0 (0.0%) | 0 (0.0%) |
| Health Diagnosing & Treating | 8 (13.6%) | 51 (86.4%) |
| Health Technologists | 0 (0.0%) | 41 (100.0%) |
| Total (Category) | 84 (40.4%) | 124 (59.6%) |
| Total (Overall) | 401 (58.7%) | 282 (41.3%) |
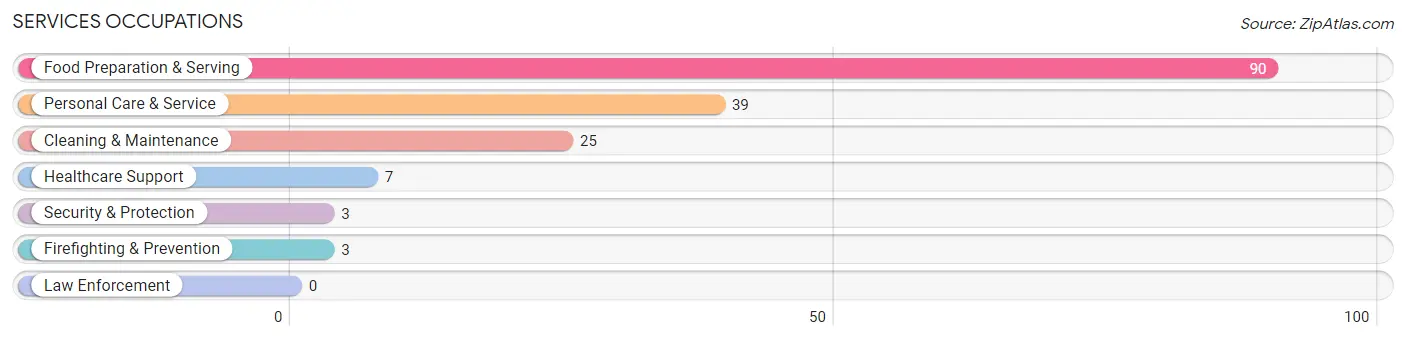
Services Occupations
The most common Services occupations in Grant are Food Preparation & Serving (90 | 13.2%), Personal Care & Service (39 | 5.7%), Cleaning & Maintenance (25 | 3.7%), Healthcare Support (7 | 1.0%), and Security & Protection (3 | 0.4%).
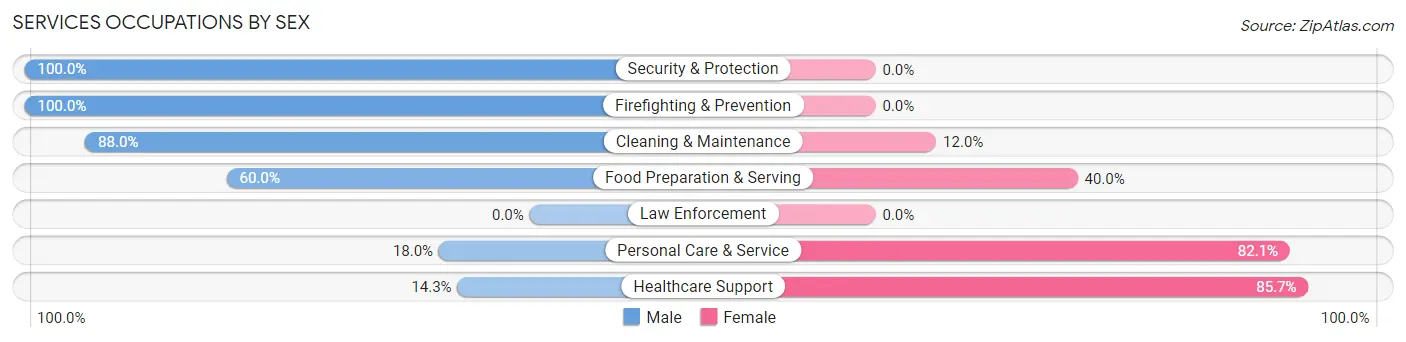
Services Occupations by Sex
Within the Services occupations in Grant, the most male-oriented occupations are Security & Protection (100.0%), Firefighting & Prevention (100.0%), and Cleaning & Maintenance (88.0%), while the most female-oriented occupations are Healthcare Support (85.7%), Personal Care & Service (82.1%), and Food Preparation & Serving (40.0%).
| Occupation | Male | Female |
| Healthcare Support | 1 (14.3%) | 6 (85.7%) |
| Security & Protection | 3 (100.0%) | 0 (0.0%) |
| Firefighting & Prevention | 3 (100.0%) | 0 (0.0%) |
| Law Enforcement | 0 (0.0%) | 0 (0.0%) |
| Food Preparation & Serving | 54 (60.0%) | 36 (40.0%) |
| Cleaning & Maintenance | 22 (88.0%) | 3 (12.0%) |
| Personal Care & Service | 7 (17.9%) | 32 (82.1%) |
| Total (Category) | 87 (53.0%) | 77 (46.9%) |
| Total (Overall) | 401 (58.7%) | 282 (41.3%) |
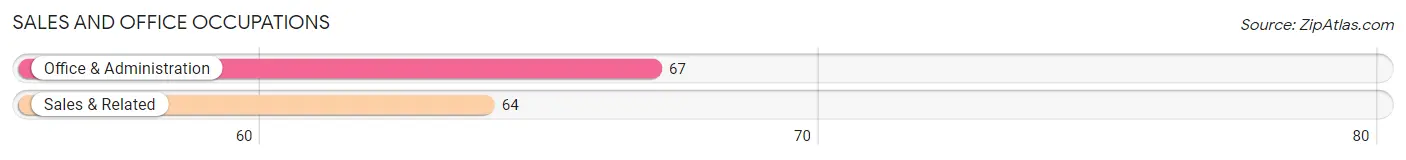
Sales and Office Occupations
The most common Sales and Office occupations in Grant are Office & Administration (67 | 9.8%), and Sales & Related (64 | 9.4%).
Sales and Office Occupations by Sex
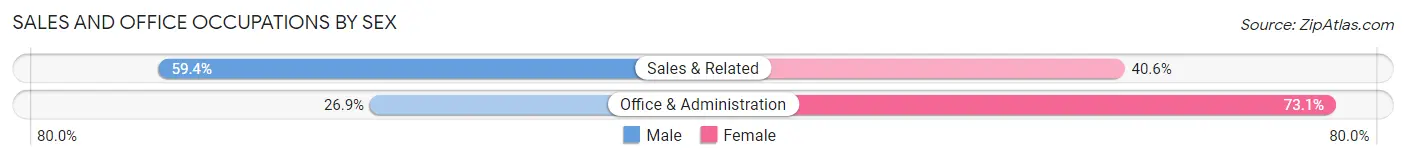
| Occupation | Male | Female |
| Sales & Related | 38 (59.4%) | 26 (40.6%) |
| Office & Administration | 18 (26.9%) | 49 (73.1%) |
| Total (Category) | 56 (42.7%) | 75 (57.3%) |
| Total (Overall) | 401 (58.7%) | 282 (41.3%) |
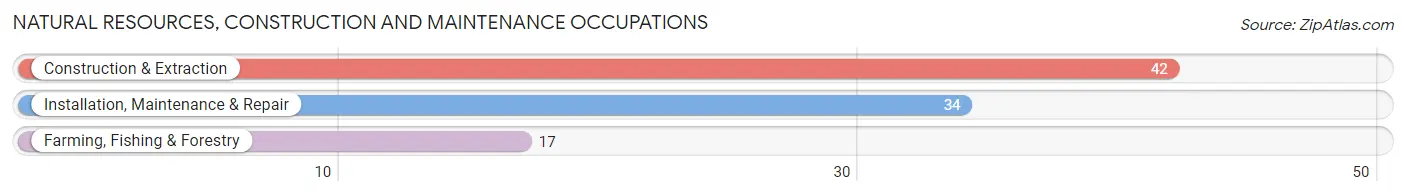
Natural Resources, Construction and Maintenance Occupations
The most common Natural Resources, Construction and Maintenance occupations in Grant are Construction & Extraction (42 | 6.1%), Installation, Maintenance & Repair (34 | 5.0%), and Farming, Fishing & Forestry (17 | 2.5%).
Natural Resources, Construction and Maintenance Occupations by Sex
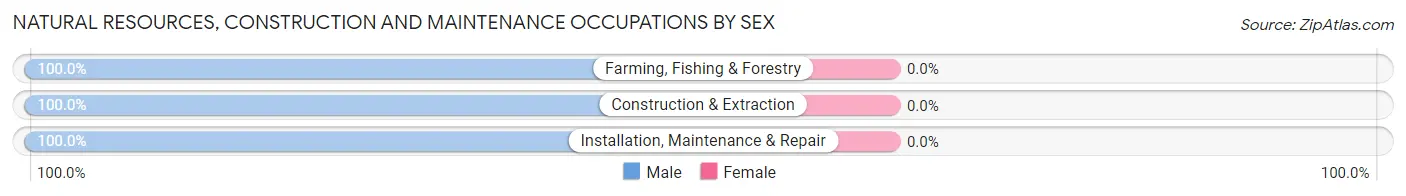
| Occupation | Male | Female |
| Farming, Fishing & Forestry | 17 (100.0%) | 0 (0.0%) |
| Construction & Extraction | 42 (100.0%) | 0 (0.0%) |
| Installation, Maintenance & Repair | 34 (100.0%) | 0 (0.0%) |
| Total (Category) | 93 (100.0%) | 0 (0.0%) |
| Total (Overall) | 401 (58.7%) | 282 (41.3%) |
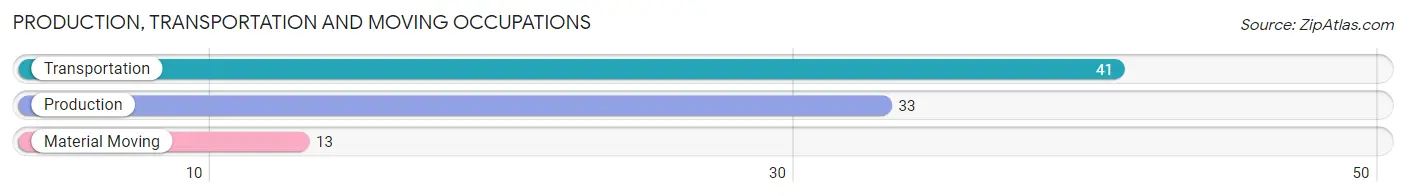
Production, Transportation and Moving Occupations
The most common Production, Transportation and Moving occupations in Grant are Transportation (41 | 6.0%), Production (33 | 4.8%), and Material Moving (13 | 1.9%).
Production, Transportation and Moving Occupations by Sex
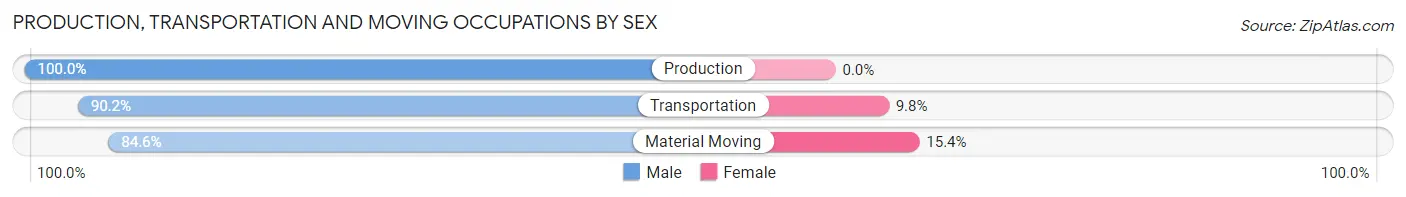
| Occupation | Male | Female |
| Production | 33 (100.0%) | 0 (0.0%) |
| Transportation | 37 (90.2%) | 4 (9.8%) |
| Material Moving | 11 (84.6%) | 2 (15.4%) |
| Total (Category) | 81 (93.1%) | 6 (6.9%) |
| Total (Overall) | 401 (58.7%) | 282 (41.3%) |
Employment Industries by Sex in Grant
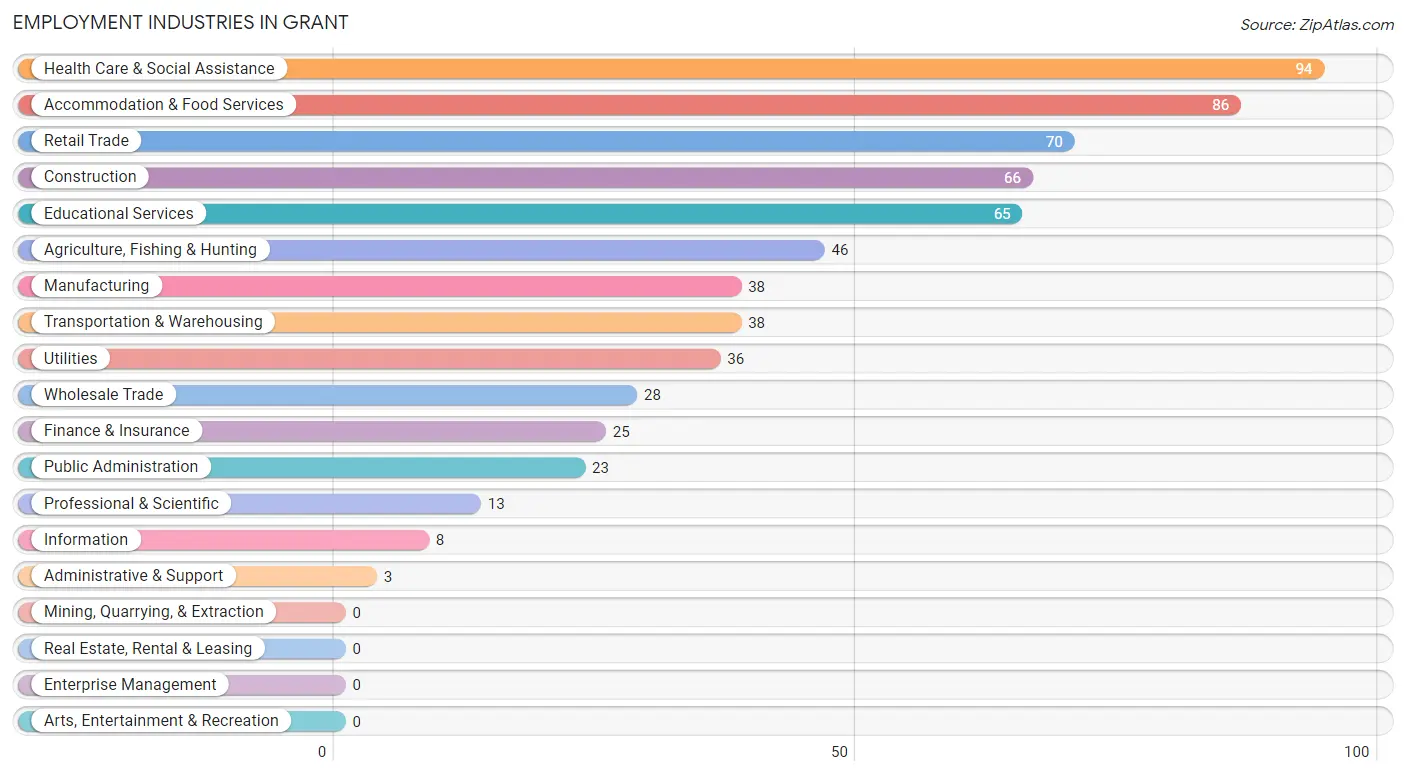
Employment Industries in Grant
The major employment industries in Grant include Health Care & Social Assistance (94 | 13.8%), Accommodation & Food Services (86 | 12.6%), Retail Trade (70 | 10.2%), Construction (66 | 9.7%), and Educational Services (65 | 9.5%).
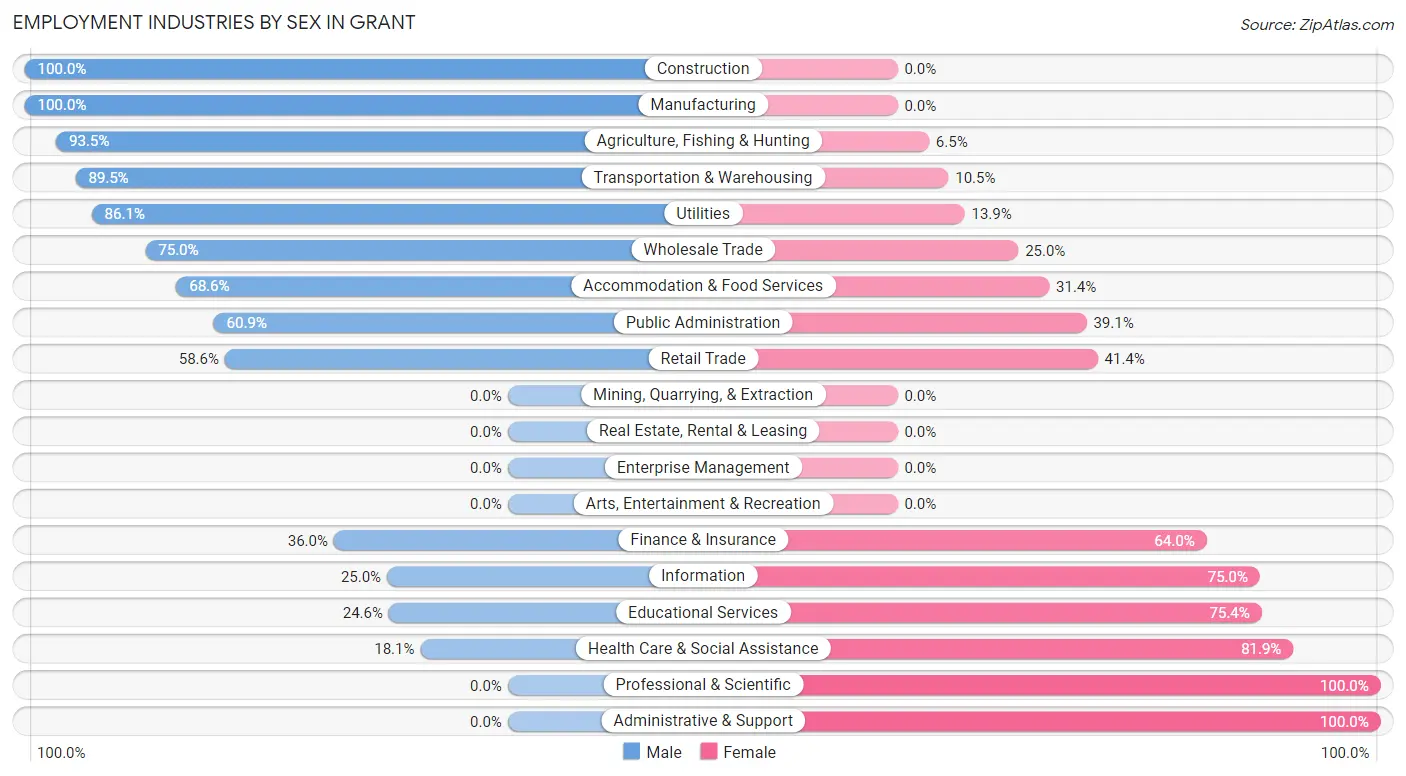
Employment Industries by Sex in Grant
The Grant industries that see more men than women are Construction (100.0%), Manufacturing (100.0%), and Agriculture, Fishing & Hunting (93.5%), whereas the industries that tend to have a higher number of women are Professional & Scientific (100.0%), Administrative & Support (100.0%), and Health Care & Social Assistance (81.9%).
| Industry | Male | Female |
| Agriculture, Fishing & Hunting | 43 (93.5%) | 3 (6.5%) |
| Mining, Quarrying, & Extraction | 0 (0.0%) | 0 (0.0%) |
| Construction | 66 (100.0%) | 0 (0.0%) |
| Manufacturing | 38 (100.0%) | 0 (0.0%) |
| Wholesale Trade | 21 (75.0%) | 7 (25.0%) |
| Retail Trade | 41 (58.6%) | 29 (41.4%) |
| Transportation & Warehousing | 34 (89.5%) | 4 (10.5%) |
| Utilities | 31 (86.1%) | 5 (13.9%) |
| Information | 2 (25.0%) | 6 (75.0%) |
| Finance & Insurance | 9 (36.0%) | 16 (64.0%) |
| Real Estate, Rental & Leasing | 0 (0.0%) | 0 (0.0%) |
| Professional & Scientific | 0 (0.0%) | 13 (100.0%) |
| Enterprise Management | 0 (0.0%) | 0 (0.0%) |
| Administrative & Support | 0 (0.0%) | 3 (100.0%) |
| Educational Services | 16 (24.6%) | 49 (75.4%) |
| Health Care & Social Assistance | 17 (18.1%) | 77 (81.9%) |
| Arts, Entertainment & Recreation | 0 (0.0%) | 0 (0.0%) |
| Accommodation & Food Services | 59 (68.6%) | 27 (31.4%) |
| Public Administration | 14 (60.9%) | 9 (39.1%) |
| Total | 401 (58.7%) | 282 (41.3%) |
Education in Grant
School Enrollment in Grant
The most common levels of schooling among the 339 students in Grant are college / undergraduate (80 | 23.6%), elementary school (75 | 22.1%), and high school (73 | 21.5%).
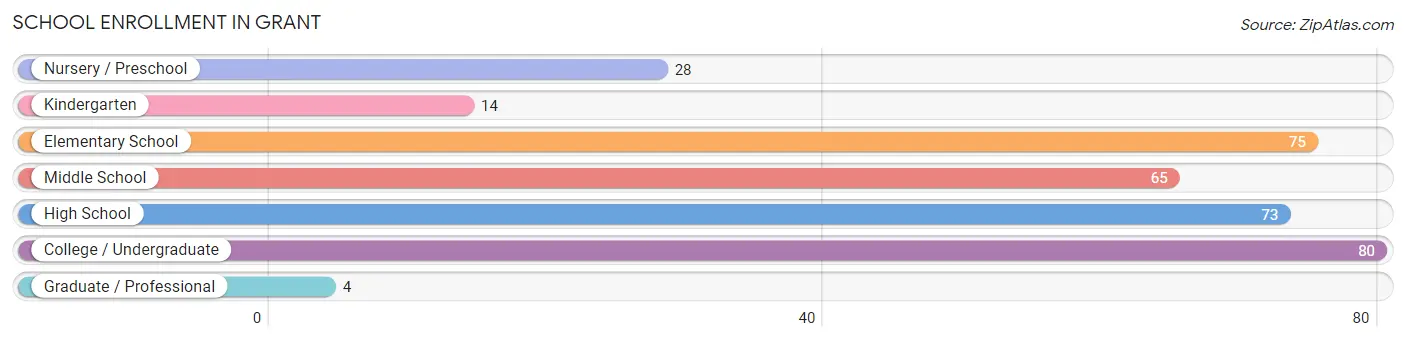
| School Level | # Students | % Students |
| Nursery / Preschool | 28 | 8.3% |
| Kindergarten | 14 | 4.1% |
| Elementary School | 75 | 22.1% |
| Middle School | 65 | 19.2% |
| High School | 73 | 21.5% |
| College / Undergraduate | 80 | 23.6% |
| Graduate / Professional | 4 | 1.2% |
| Total | 339 | 100.0% |
School Enrollment by Age by Funding Source in Grant
Out of a total of 339 students who are enrolled in schools in Grant, 30 (8.8%) attend a private institution, while the remaining 309 (91.2%) are enrolled in public schools. The age group of 35 years and over has the highest likelihood of being enrolled in private schools, with 5 (19.2% in the age bracket) enrolled. Conversely, the age group of 3 to 4 year olds has the lowest likelihood of being enrolled in a private school, with 12 (100.0% in the age bracket) attending a public institution.
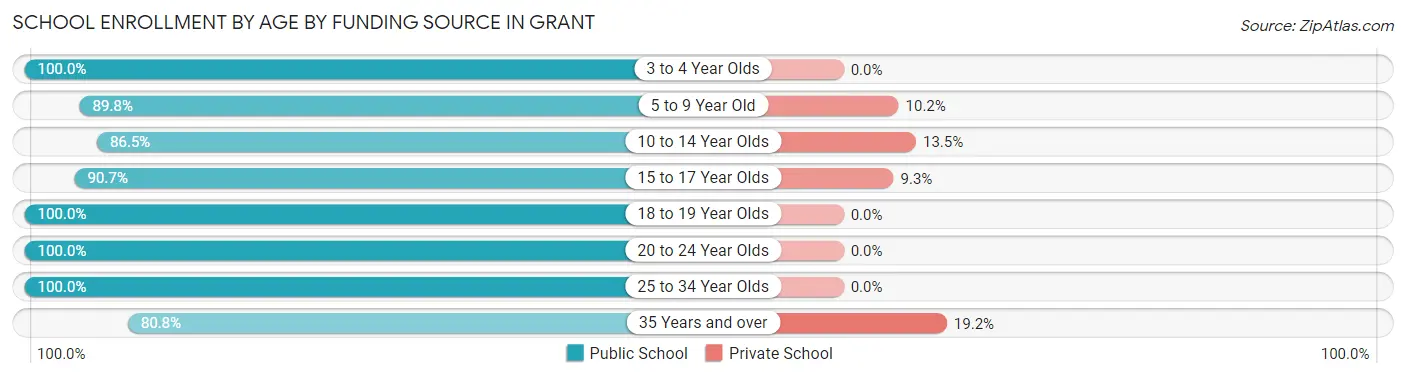
| Age Bracket | Public School | Private School |
| 3 to 4 Year Olds | 12 (100.0%) | 0 (0.0%) |
| 5 to 9 Year Old | 79 (89.8%) | 9 (10.2%) |
| 10 to 14 Year Olds | 77 (86.5%) | 12 (13.5%) |
| 15 to 17 Year Olds | 39 (90.7%) | 4 (9.3%) |
| 18 to 19 Year Olds | 61 (100.0%) | 0 (0.0%) |
| 20 to 24 Year Olds | 7 (100.0%) | 0 (0.0%) |
| 25 to 34 Year Olds | 13 (100.0%) | 0 (0.0%) |
| 35 Years and over | 21 (80.8%) | 5 (19.2%) |
| Total | 309 (91.2%) | 30 (8.8%) |
Educational Attainment by Field of Study in Grant
Education (82 | 31.4%), business (49 | 18.8%), arts & humanities (31 | 11.9%), science & technology (26 | 10.0%), and bio, nature & agricultural (20 | 7.7%) are the most common fields of study among 261 individuals in Grant who have obtained a bachelor's degree or higher.
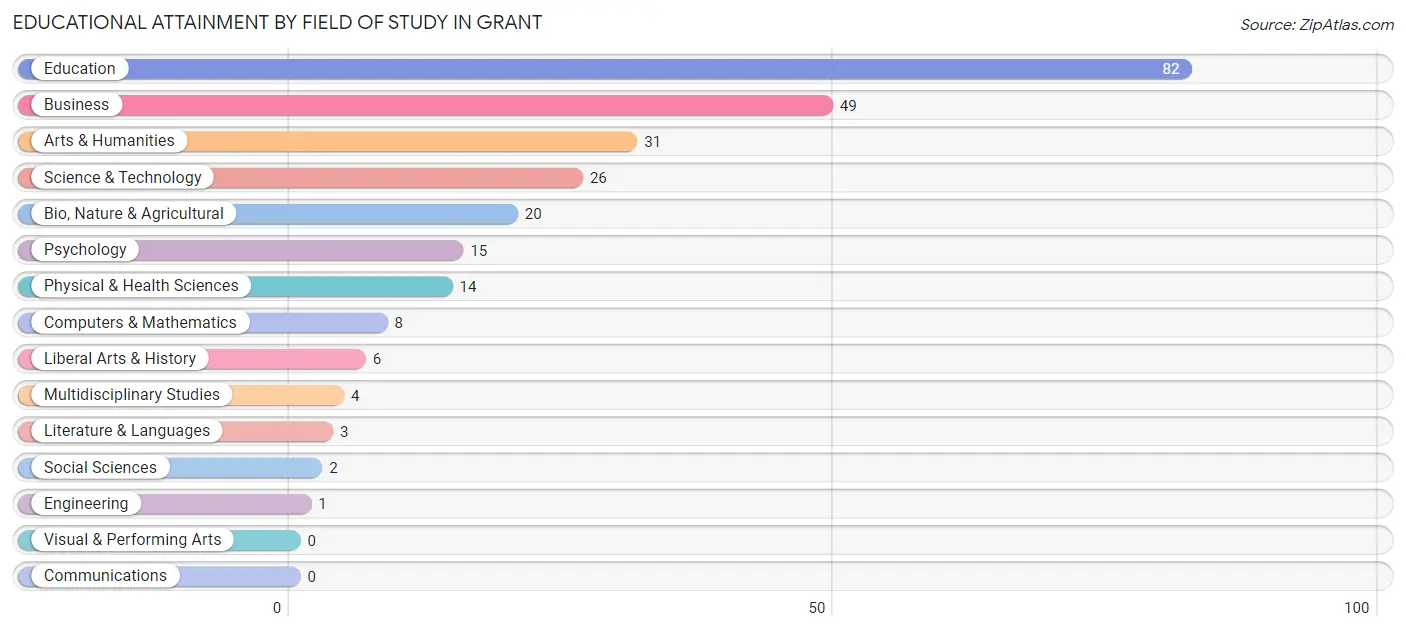
| Field of Study | # Graduates | % Graduates |
| Computers & Mathematics | 8 | 3.1% |
| Bio, Nature & Agricultural | 20 | 7.7% |
| Physical & Health Sciences | 14 | 5.4% |
| Psychology | 15 | 5.8% |
| Social Sciences | 2 | 0.8% |
| Engineering | 1 | 0.4% |
| Multidisciplinary Studies | 4 | 1.5% |
| Science & Technology | 26 | 10.0% |
| Business | 49 | 18.8% |
| Education | 82 | 31.4% |
| Literature & Languages | 3 | 1.1% |
| Liberal Arts & History | 6 | 2.3% |
| Visual & Performing Arts | 0 | 0.0% |
| Communications | 0 | 0.0% |
| Arts & Humanities | 31 | 11.9% |
| Total | 261 | 100.0% |
Transportation & Commute in Grant
Vehicle Availability by Sex in Grant
The most prevalent vehicle ownership categories in Grant are males with 2 vehicles (171, accounting for 43.6%) and females with 2 vehicles (110, making up 60.6%).
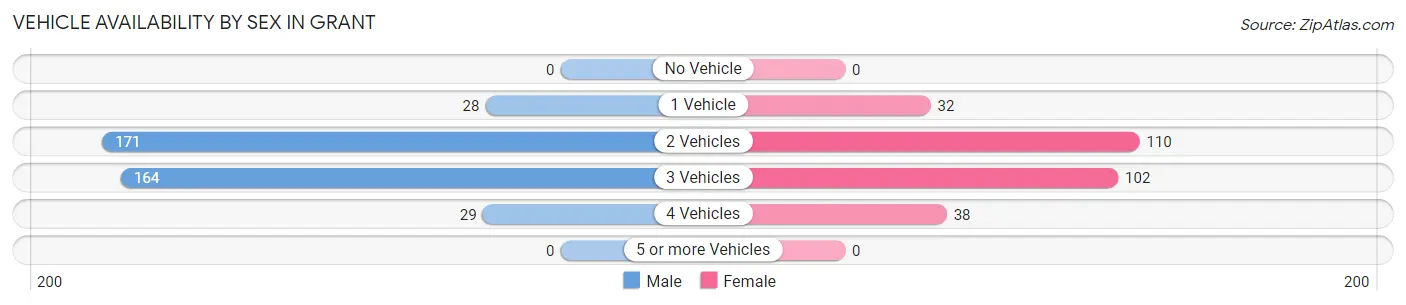
| Vehicles Available | Male | Female |
| No Vehicle | 0 (0.0%) | 0 (0.0%) |
| 1 Vehicle | 28 (7.1%) | 32 (11.4%) |
| 2 Vehicles | 171 (43.6%) | 110 (39.0%) |
| 3 Vehicles | 164 (41.8%) | 102 (36.2%) |
| 4 Vehicles | 29 (7.4%) | 38 (13.5%) |
| 5 or more Vehicles | 0 (0.0%) | 0 (0.0%) |
| Total | 392 (100.0%) | 282 (100.0%) |
Commute Time in Grant
The most frequently occuring commute durations in Grant are less than 5 minutes (236 commuters, 35.9%), 5 to 9 minutes (211 commuters, 32.1%), and 10 to 14 minutes (52 commuters, 7.9%).
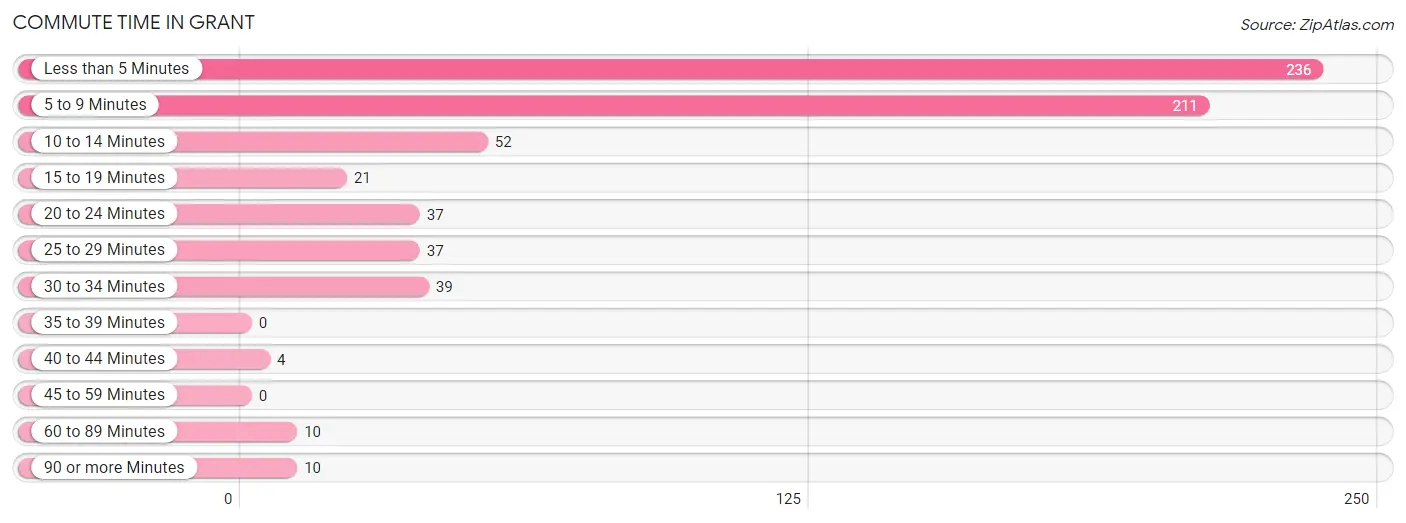
| Commute Time | # Commuters | % Commuters |
| Less than 5 Minutes | 236 | 35.9% |
| 5 to 9 Minutes | 211 | 32.1% |
| 10 to 14 Minutes | 52 | 7.9% |
| 15 to 19 Minutes | 21 | 3.2% |
| 20 to 24 Minutes | 37 | 5.6% |
| 25 to 29 Minutes | 37 | 5.6% |
| 30 to 34 Minutes | 39 | 5.9% |
| 35 to 39 Minutes | 0 | 0.0% |
| 40 to 44 Minutes | 4 | 0.6% |
| 45 to 59 Minutes | 0 | 0.0% |
| 60 to 89 Minutes | 10 | 1.5% |
| 90 or more Minutes | 10 | 1.5% |
Commute Time by Sex in Grant
The most common commute times in Grant are less than 5 minutes (141 commuters, 36.7%) for males and 5 to 9 minutes (133 commuters, 48.7%) for females.
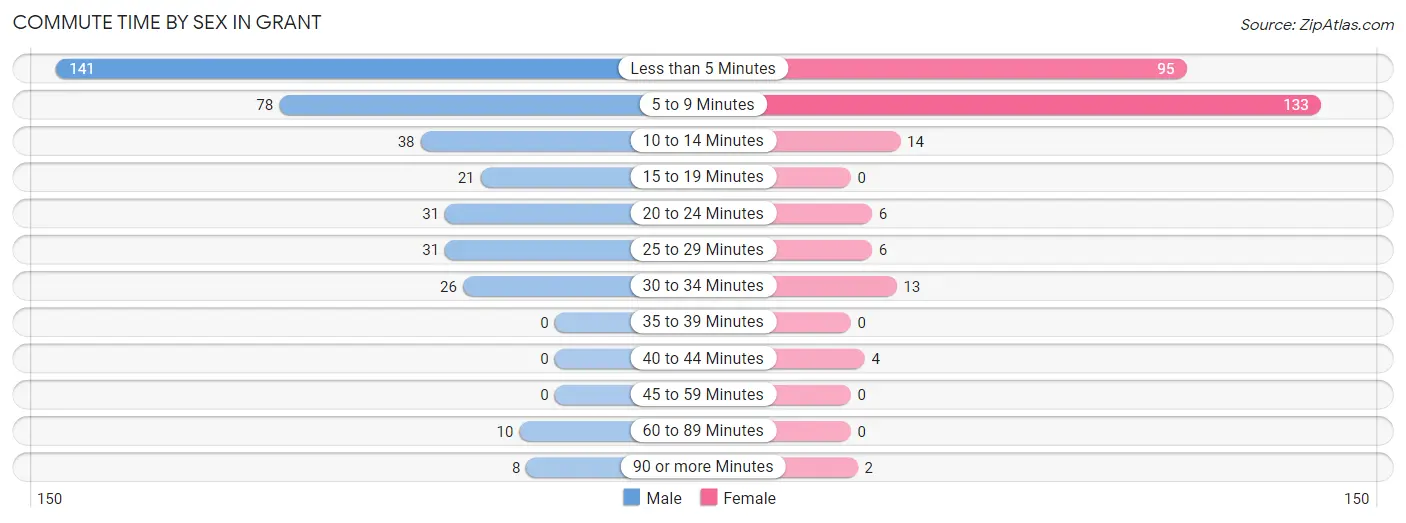
| Commute Time | Male | Female |
| Less than 5 Minutes | 141 (36.7%) | 95 (34.8%) |
| 5 to 9 Minutes | 78 (20.3%) | 133 (48.7%) |
| 10 to 14 Minutes | 38 (9.9%) | 14 (5.1%) |
| 15 to 19 Minutes | 21 (5.5%) | 0 (0.0%) |
| 20 to 24 Minutes | 31 (8.1%) | 6 (2.2%) |
| 25 to 29 Minutes | 31 (8.1%) | 6 (2.2%) |
| 30 to 34 Minutes | 26 (6.8%) | 13 (4.8%) |
| 35 to 39 Minutes | 0 (0.0%) | 0 (0.0%) |
| 40 to 44 Minutes | 0 (0.0%) | 4 (1.5%) |
| 45 to 59 Minutes | 0 (0.0%) | 0 (0.0%) |
| 60 to 89 Minutes | 10 (2.6%) | 0 (0.0%) |
| 90 or more Minutes | 8 (2.1%) | 2 (0.7%) |
Time of Departure to Work by Sex in Grant
The most frequent times of departure to work in Grant are 7:00 AM to 7:29 AM (86, 22.4%) for males and 7:30 AM to 7:59 AM (82, 30.0%) for females.
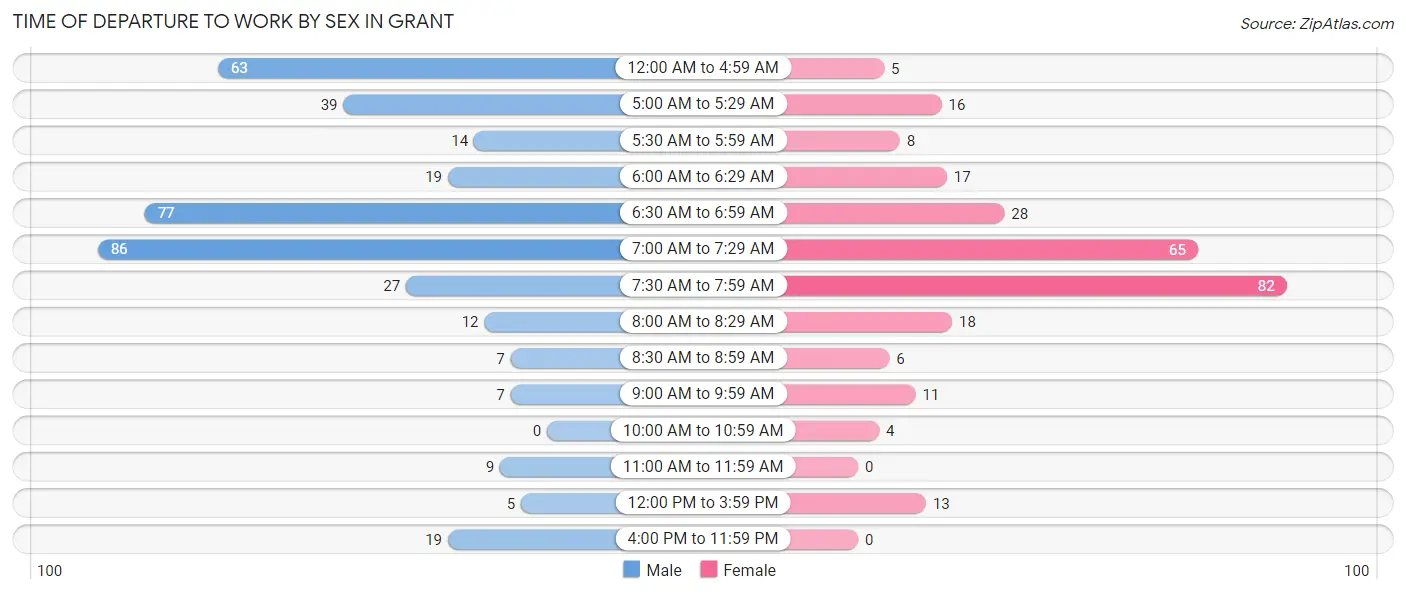
| Time of Departure | Male | Female |
| 12:00 AM to 4:59 AM | 63 (16.4%) | 5 (1.8%) |
| 5:00 AM to 5:29 AM | 39 (10.2%) | 16 (5.9%) |
| 5:30 AM to 5:59 AM | 14 (3.6%) | 8 (2.9%) |
| 6:00 AM to 6:29 AM | 19 (5.0%) | 17 (6.2%) |
| 6:30 AM to 6:59 AM | 77 (20.1%) | 28 (10.3%) |
| 7:00 AM to 7:29 AM | 86 (22.4%) | 65 (23.8%) |
| 7:30 AM to 7:59 AM | 27 (7.0%) | 82 (30.0%) |
| 8:00 AM to 8:29 AM | 12 (3.1%) | 18 (6.6%) |
| 8:30 AM to 8:59 AM | 7 (1.8%) | 6 (2.2%) |
| 9:00 AM to 9:59 AM | 7 (1.8%) | 11 (4.0%) |
| 10:00 AM to 10:59 AM | 0 (0.0%) | 4 (1.5%) |
| 11:00 AM to 11:59 AM | 9 (2.3%) | 0 (0.0%) |
| 12:00 PM to 3:59 PM | 5 (1.3%) | 13 (4.8%) |
| 4:00 PM to 11:59 PM | 19 (5.0%) | 0 (0.0%) |
| Total | 384 (100.0%) | 273 (100.0%) |
Housing Occupancy in Grant
Occupancy by Ownership in Grant
Of the total 560 dwellings in Grant, owner-occupied units account for 426 (76.1%), while renter-occupied units make up 134 (23.9%).
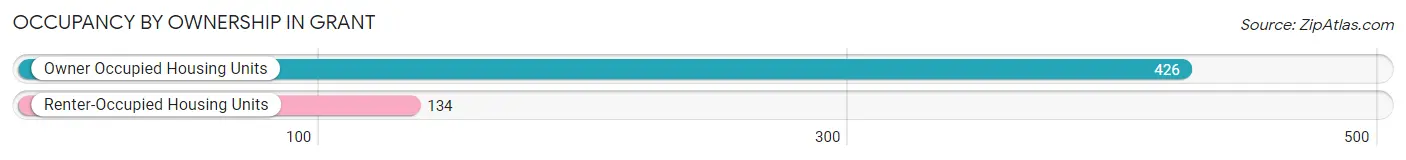
| Occupancy | # Housing Units | % Housing Units |
| Owner Occupied Housing Units | 426 | 76.1% |
| Renter-Occupied Housing Units | 134 | 23.9% |
| Total Occupied Housing Units | 560 | 100.0% |
Occupancy by Household Size in Grant
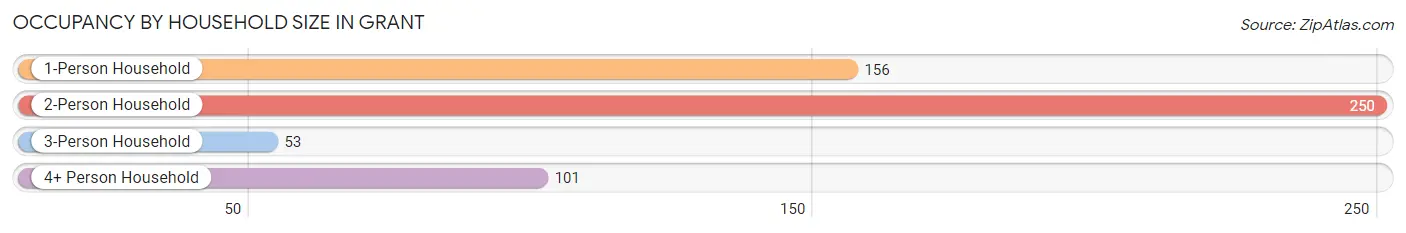
| Household Size | # Housing Units | % Housing Units |
| 1-Person Household | 156 | 27.9% |
| 2-Person Household | 250 | 44.6% |
| 3-Person Household | 53 | 9.5% |
| 4+ Person Household | 101 | 18.0% |
| Total Housing Units | 560 | 100.0% |
Occupancy by Ownership by Household Size in Grant
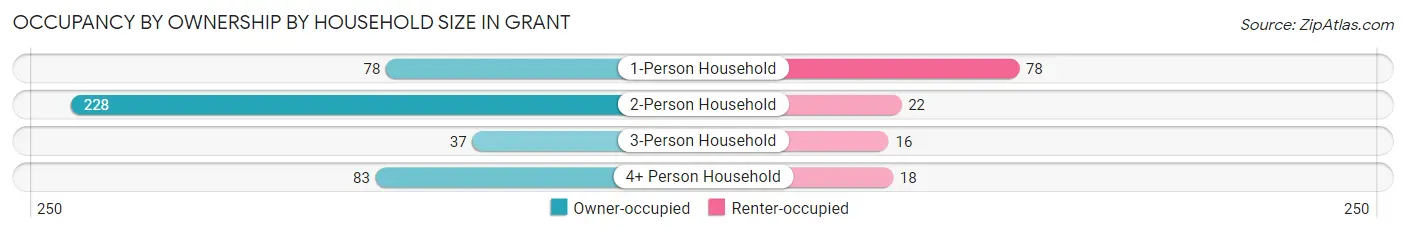
| Household Size | Owner-occupied | Renter-occupied |
| 1-Person Household | 78 (50.0%) | 78 (50.0%) |
| 2-Person Household | 228 (91.2%) | 22 (8.8%) |
| 3-Person Household | 37 (69.8%) | 16 (30.2%) |
| 4+ Person Household | 83 (82.2%) | 18 (17.8%) |
| Total Housing Units | 426 (76.1%) | 134 (23.9%) |
Occupancy by Educational Attainment in Grant
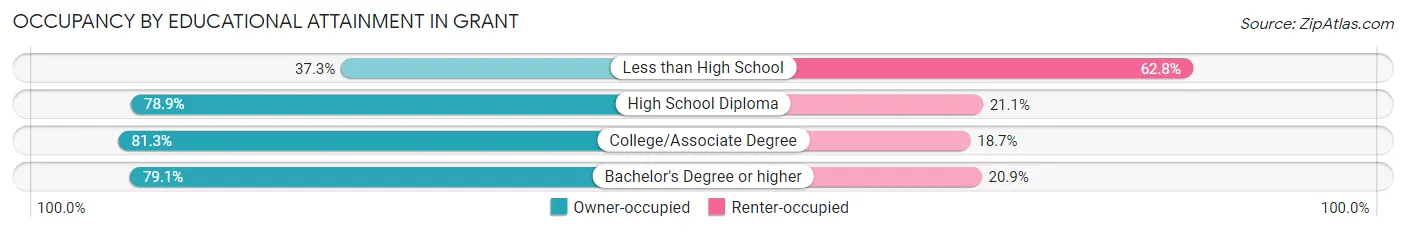
| Household Size | Owner-occupied | Renter-occupied |
| Less than High School | 19 (37.2%) | 32 (62.7%) |
| High School Diploma | 112 (78.9%) | 30 (21.1%) |
| College/Associate Degree | 170 (81.3%) | 39 (18.7%) |
| Bachelor's Degree or higher | 125 (79.1%) | 33 (20.9%) |
Occupancy by Age of Householder in Grant
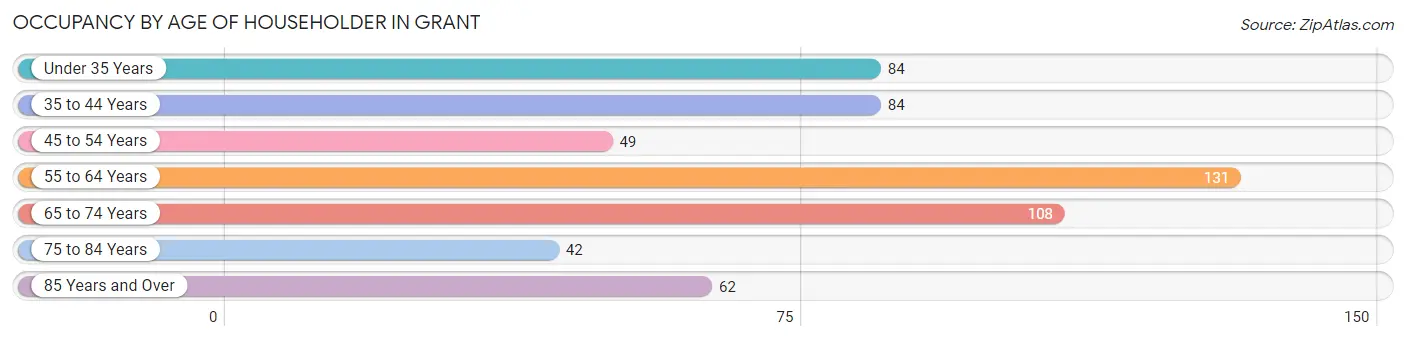
| Age Bracket | # Households | % Households |
| Under 35 Years | 84 | 15.0% |
| 35 to 44 Years | 84 | 15.0% |
| 45 to 54 Years | 49 | 8.7% |
| 55 to 64 Years | 131 | 23.4% |
| 65 to 74 Years | 108 | 19.3% |
| 75 to 84 Years | 42 | 7.5% |
| 85 Years and Over | 62 | 11.1% |
| Total | 560 | 100.0% |
Housing Finances in Grant
Median Income by Occupancy in Grant
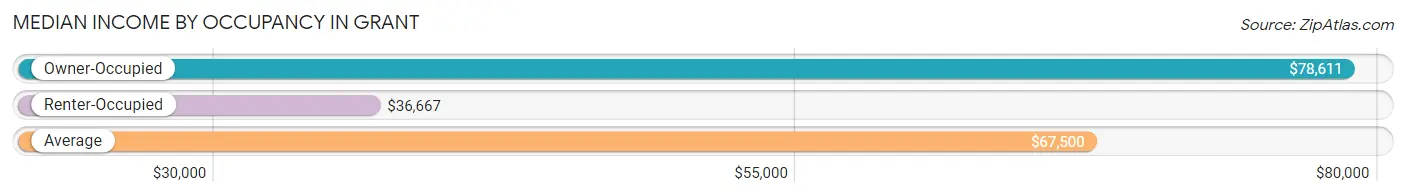
| Occupancy Type | # Households | Median Income |
| Owner-Occupied | 426 (76.1%) | $78,611 |
| Renter-Occupied | 134 (23.9%) | $36,667 |
| Average | 560 (100.0%) | $67,500 |
Occupancy by Householder Income Bracket in Grant
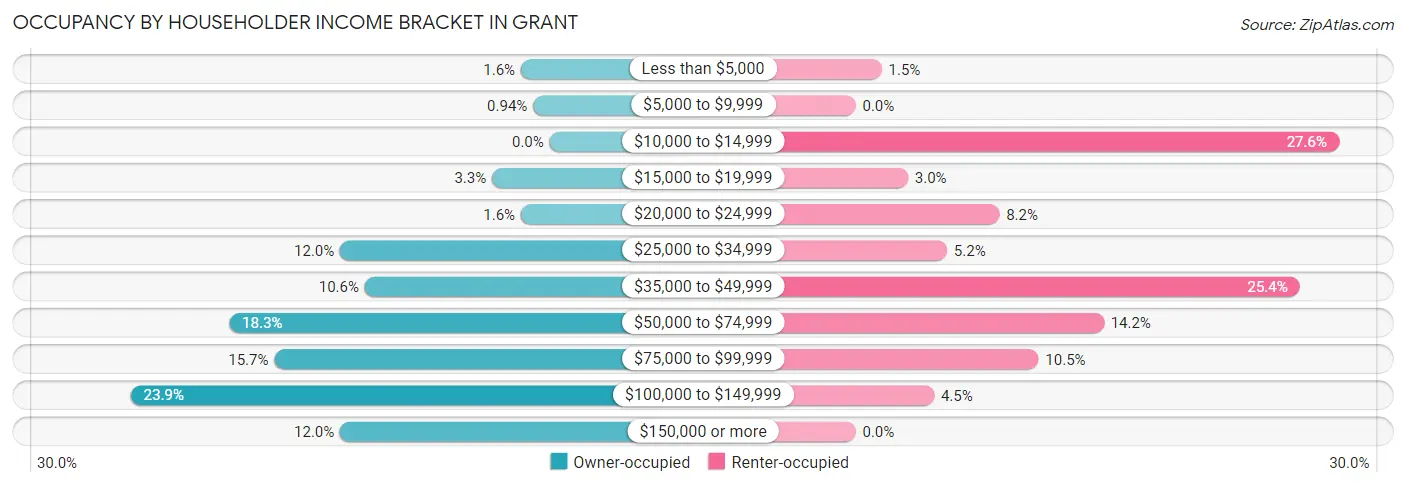
| Income Bracket | Owner-occupied | Renter-occupied |
| Less than $5,000 | 7 (1.6%) | 2 (1.5%) |
| $5,000 to $9,999 | 4 (0.9%) | 0 (0.0%) |
| $10,000 to $14,999 | 0 (0.0%) | 37 (27.6%) |
| $15,000 to $19,999 | 14 (3.3%) | 4 (3.0%) |
| $20,000 to $24,999 | 7 (1.6%) | 11 (8.2%) |
| $25,000 to $34,999 | 51 (12.0%) | 7 (5.2%) |
| $35,000 to $49,999 | 45 (10.6%) | 34 (25.4%) |
| $50,000 to $74,999 | 78 (18.3%) | 19 (14.2%) |
| $75,000 to $99,999 | 67 (15.7%) | 14 (10.4%) |
| $100,000 to $149,999 | 102 (23.9%) | 6 (4.5%) |
| $150,000 or more | 51 (12.0%) | 0 (0.0%) |
| Total | 426 (100.0%) | 134 (100.0%) |
Monthly Housing Cost Tiers in Grant
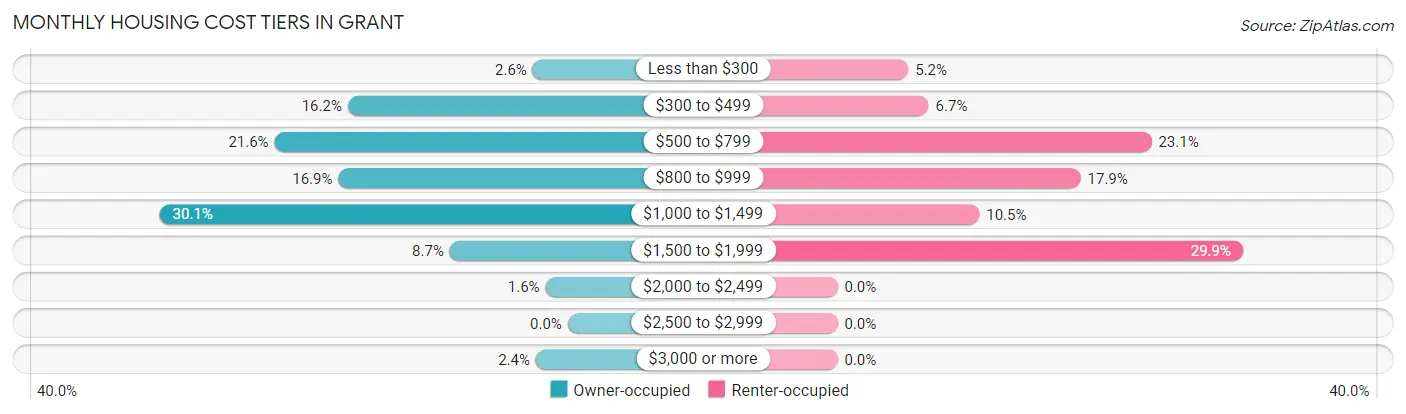
| Monthly Cost | Owner-occupied | Renter-occupied |
| Less than $300 | 11 (2.6%) | 7 (5.2%) |
| $300 to $499 | 69 (16.2%) | 9 (6.7%) |
| $500 to $799 | 92 (21.6%) | 31 (23.1%) |
| $800 to $999 | 72 (16.9%) | 24 (17.9%) |
| $1,000 to $1,499 | 128 (30.0%) | 14 (10.4%) |
| $1,500 to $1,999 | 37 (8.7%) | 40 (29.8%) |
| $2,000 to $2,499 | 7 (1.6%) | 0 (0.0%) |
| $2,500 to $2,999 | 0 (0.0%) | 0 (0.0%) |
| $3,000 or more | 10 (2.4%) | 0 (0.0%) |
| Total | 426 (100.0%) | 134 (100.0%) |
Physical Housing Characteristics in Grant
Housing Structures in Grant
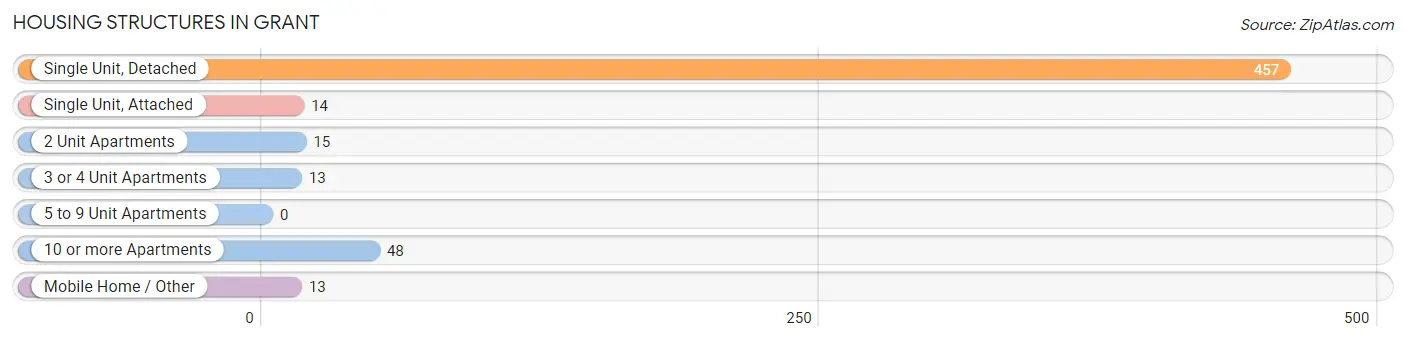
| Structure Type | # Housing Units | % Housing Units |
| Single Unit, Detached | 457 | 81.6% |
| Single Unit, Attached | 14 | 2.5% |
| 2 Unit Apartments | 15 | 2.7% |
| 3 or 4 Unit Apartments | 13 | 2.3% |
| 5 to 9 Unit Apartments | 0 | 0.0% |
| 10 or more Apartments | 48 | 8.6% |
| Mobile Home / Other | 13 | 2.3% |
| Total | 560 | 100.0% |
Housing Structures by Occupancy in Grant
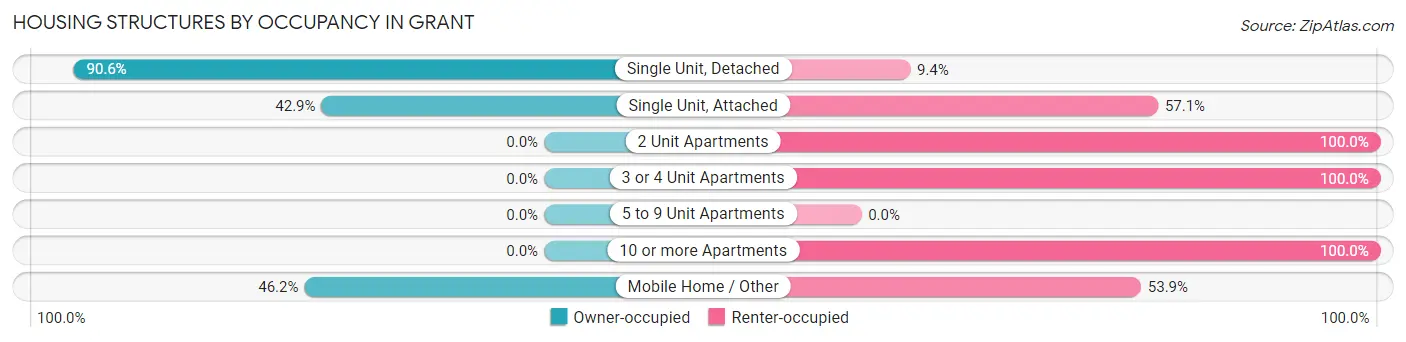
| Structure Type | Owner-occupied | Renter-occupied |
| Single Unit, Detached | 414 (90.6%) | 43 (9.4%) |
| Single Unit, Attached | 6 (42.9%) | 8 (57.1%) |
| 2 Unit Apartments | 0 (0.0%) | 15 (100.0%) |
| 3 or 4 Unit Apartments | 0 (0.0%) | 13 (100.0%) |
| 5 to 9 Unit Apartments | 0 (0.0%) | 0 (0.0%) |
| 10 or more Apartments | 0 (0.0%) | 48 (100.0%) |
| Mobile Home / Other | 6 (46.2%) | 7 (53.8%) |
| Total | 426 (76.1%) | 134 (23.9%) |
Housing Structures by Number of Rooms in Grant
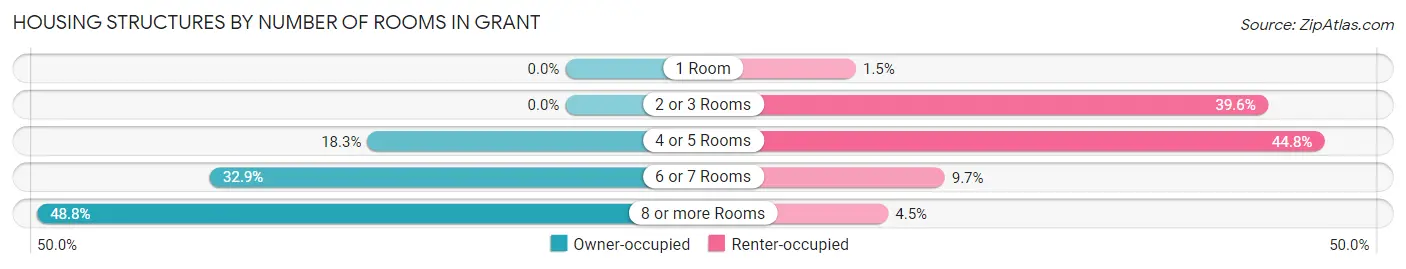
| Number of Rooms | Owner-occupied | Renter-occupied |
| 1 Room | 0 (0.0%) | 2 (1.5%) |
| 2 or 3 Rooms | 0 (0.0%) | 53 (39.6%) |
| 4 or 5 Rooms | 78 (18.3%) | 60 (44.8%) |
| 6 or 7 Rooms | 140 (32.9%) | 13 (9.7%) |
| 8 or more Rooms | 208 (48.8%) | 6 (4.5%) |
| Total | 426 (100.0%) | 134 (100.0%) |
Housing Structure by Heating Type in Grant
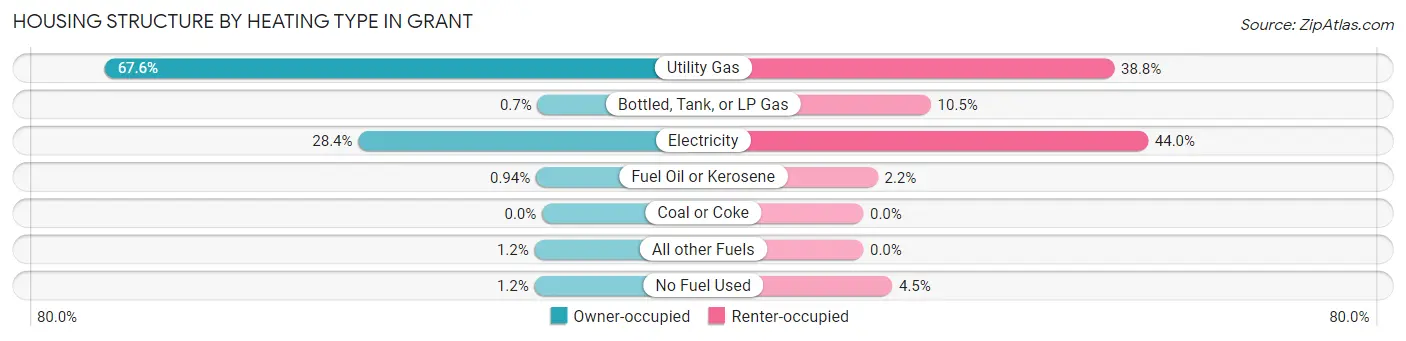
| Heating Type | Owner-occupied | Renter-occupied |
| Utility Gas | 288 (67.6%) | 52 (38.8%) |
| Bottled, Tank, or LP Gas | 3 (0.7%) | 14 (10.4%) |
| Electricity | 121 (28.4%) | 59 (44.0%) |
| Fuel Oil or Kerosene | 4 (0.9%) | 3 (2.2%) |
| Coal or Coke | 0 (0.0%) | 0 (0.0%) |
| All other Fuels | 5 (1.2%) | 0 (0.0%) |
| No Fuel Used | 5 (1.2%) | 6 (4.5%) |
| Total | 426 (100.0%) | 134 (100.0%) |
Household Vehicle Usage in Grant
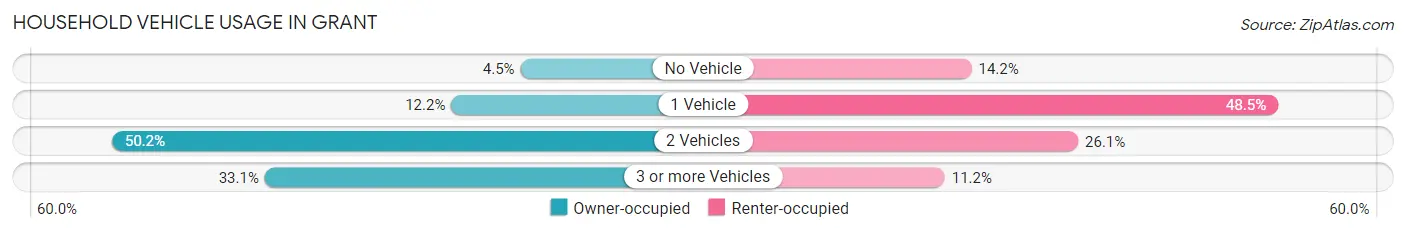
| Vehicles per Household | Owner-occupied | Renter-occupied |
| No Vehicle | 19 (4.5%) | 19 (14.2%) |
| 1 Vehicle | 52 (12.2%) | 65 (48.5%) |
| 2 Vehicles | 214 (50.2%) | 35 (26.1%) |
| 3 or more Vehicles | 141 (33.1%) | 15 (11.2%) |
| Total | 426 (100.0%) | 134 (100.0%) |
Real Estate & Mortgages in Grant
Real Estate and Mortgage Overview in Grant
| Characteristic | Without Mortgage | With Mortgage |
| Housing Units | 229 | 197 |
| Median Property Value | $158,900 | $135,100 |
| Median Household Income | $67,813 | $19 |
| Monthly Housing Costs | $638 | $10 |
| Real Estate Taxes | $1,824 | $3 |
Property Value by Mortgage Status in Grant
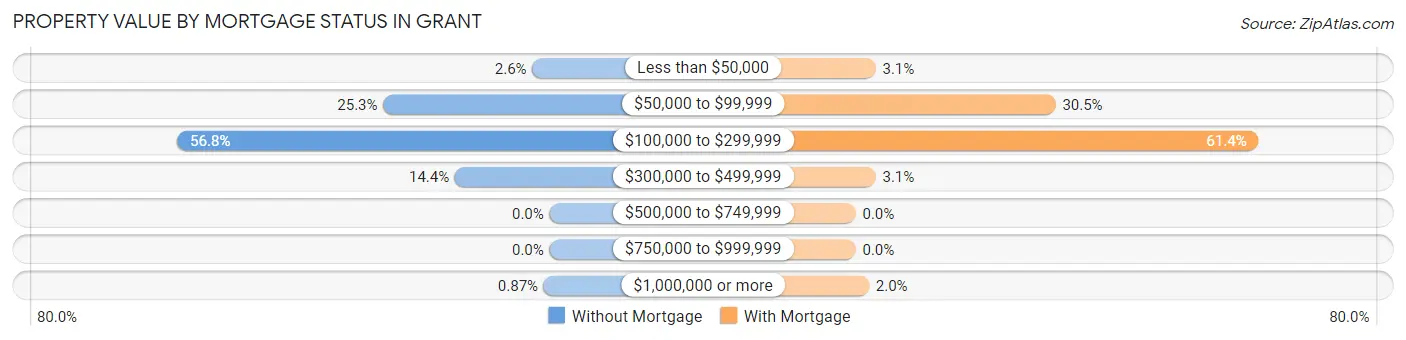
| Property Value | Without Mortgage | With Mortgage |
| Less than $50,000 | 6 (2.6%) | 6 (3.0%) |
| $50,000 to $99,999 | 58 (25.3%) | 60 (30.5%) |
| $100,000 to $299,999 | 130 (56.8%) | 121 (61.4%) |
| $300,000 to $499,999 | 33 (14.4%) | 6 (3.0%) |
| $500,000 to $749,999 | 0 (0.0%) | 0 (0.0%) |
| $750,000 to $999,999 | 0 (0.0%) | 0 (0.0%) |
| $1,000,000 or more | 2 (0.9%) | 4 (2.0%) |
| Total | 229 (100.0%) | 197 (100.0%) |
Household Income by Mortgage Status in Grant
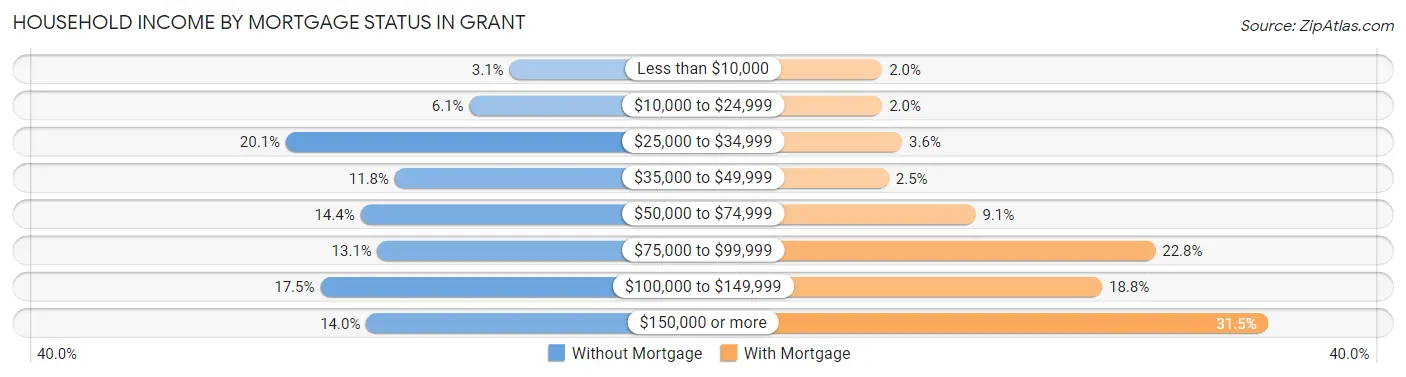
| Household Income | Without Mortgage | With Mortgage |
| Less than $10,000 | 7 (3.1%) | 4 (2.0%) |
| $10,000 to $24,999 | 14 (6.1%) | 4 (2.0%) |
| $25,000 to $34,999 | 46 (20.1%) | 7 (3.5%) |
| $35,000 to $49,999 | 27 (11.8%) | 5 (2.5%) |
| $50,000 to $74,999 | 33 (14.4%) | 18 (9.1%) |
| $75,000 to $99,999 | 30 (13.1%) | 45 (22.8%) |
| $100,000 to $149,999 | 40 (17.5%) | 37 (18.8%) |
| $150,000 or more | 32 (14.0%) | 62 (31.5%) |
| Total | 229 (100.0%) | 197 (100.0%) |
Property Value to Household Income Ratio in Grant
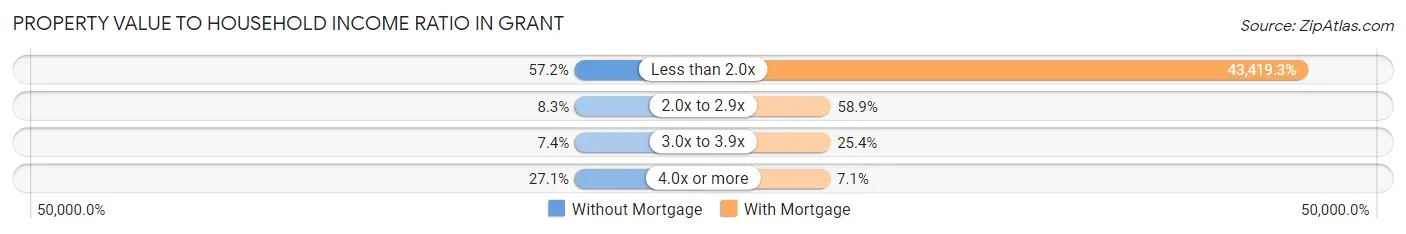
| Value-to-Income Ratio | Without Mortgage | With Mortgage |
| Less than 2.0x | 131 (57.2%) | 85,536 (43,419.3%) |
| 2.0x to 2.9x | 19 (8.3%) | 116 (58.9%) |
| 3.0x to 3.9x | 17 (7.4%) | 50 (25.4%) |
| 4.0x or more | 62 (27.1%) | 14 (7.1%) |
| Total | 229 (100.0%) | 197 (100.0%) |
Real Estate Taxes by Mortgage Status in Grant
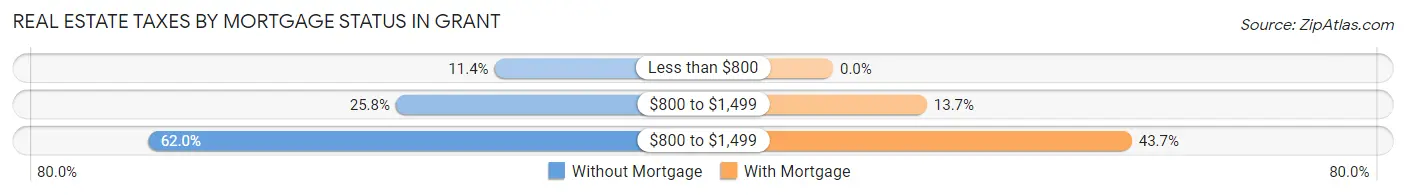
| Property Taxes | Without Mortgage | With Mortgage |
| Less than $800 | 26 (11.4%) | 0 (0.0%) |
| $800 to $1,499 | 59 (25.8%) | 27 (13.7%) |
| $800 to $1,499 | 142 (62.0%) | 86 (43.6%) |
| Total | 229 (100.0%) | 197 (100.0%) |
Health & Disability in Grant
Health Insurance Coverage by Age in Grant
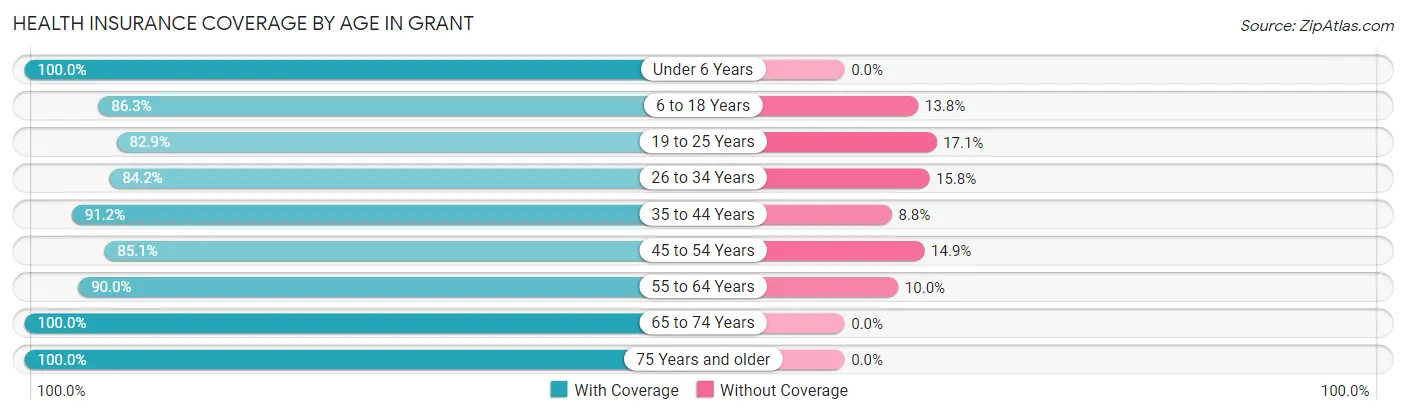
| Age Bracket | With Coverage | Without Coverage |
| Under 6 Years | 104 (100.0%) | 0 (0.0%) |
| 6 to 18 Years | 207 (86.3%) | 33 (13.8%) |
| 19 to 25 Years | 58 (82.9%) | 12 (17.1%) |
| 26 to 34 Years | 133 (84.2%) | 25 (15.8%) |
| 35 to 44 Years | 176 (91.2%) | 17 (8.8%) |
| 45 to 54 Years | 80 (85.1%) | 14 (14.9%) |
| 55 to 64 Years | 180 (90.0%) | 20 (10.0%) |
| 65 to 74 Years | 177 (100.0%) | 0 (0.0%) |
| 75 Years and older | 128 (100.0%) | 0 (0.0%) |
| Total | 1,243 (91.1%) | 121 (8.9%) |
Health Insurance Coverage by Citizenship Status in Grant
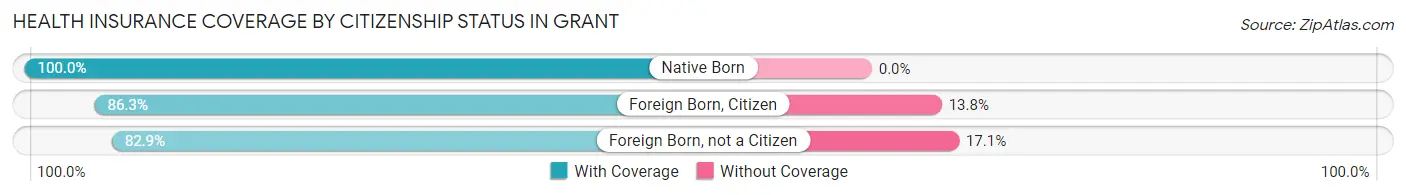
| Citizenship Status | With Coverage | Without Coverage |
| Native Born | 104 (100.0%) | 0 (0.0%) |
| Foreign Born, Citizen | 207 (86.3%) | 33 (13.8%) |
| Foreign Born, not a Citizen | 58 (82.9%) | 12 (17.1%) |
Health Insurance Coverage by Household Income in Grant
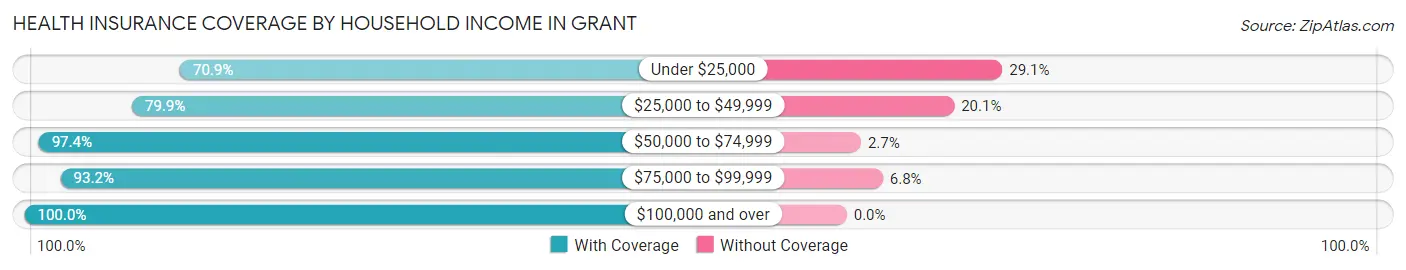
| Household Income | With Coverage | Without Coverage |
| Under $25,000 | 90 (70.9%) | 37 (29.1%) |
| $25,000 to $49,999 | 238 (79.9%) | 60 (20.1%) |
| $50,000 to $74,999 | 184 (97.4%) | 5 (2.6%) |
| $75,000 to $99,999 | 262 (93.2%) | 19 (6.8%) |
| $100,000 and over | 469 (100.0%) | 0 (0.0%) |
Public vs Private Health Insurance Coverage by Age in Grant
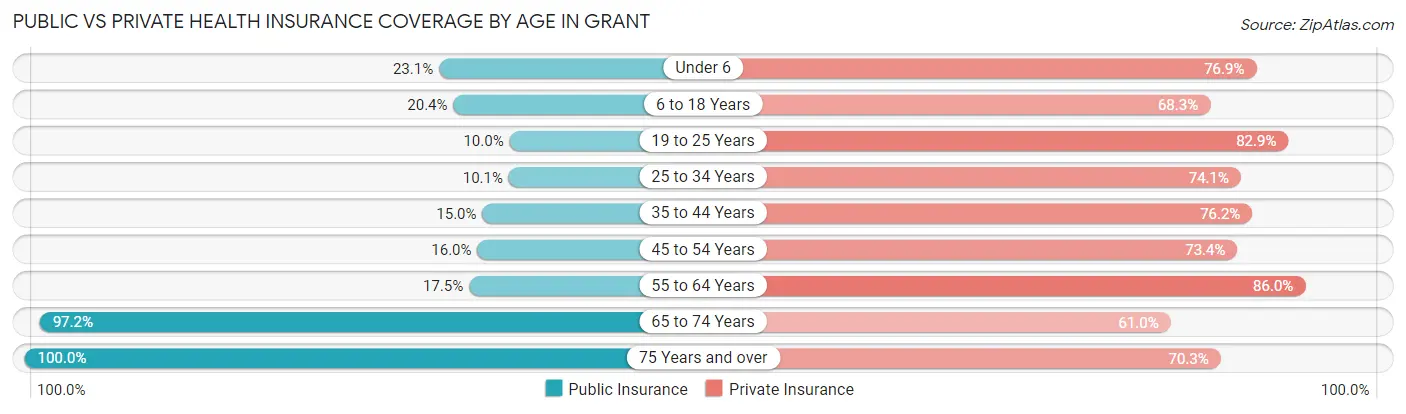
| Age Bracket | Public Insurance | Private Insurance |
| Under 6 | 24 (23.1%) | 80 (76.9%) |
| 6 to 18 Years | 49 (20.4%) | 164 (68.3%) |
| 19 to 25 Years | 7 (10.0%) | 58 (82.9%) |
| 25 to 34 Years | 16 (10.1%) | 117 (74.1%) |
| 35 to 44 Years | 29 (15.0%) | 147 (76.2%) |
| 45 to 54 Years | 15 (16.0%) | 69 (73.4%) |
| 55 to 64 Years | 35 (17.5%) | 172 (86.0%) |
| 65 to 74 Years | 172 (97.2%) | 108 (61.0%) |
| 75 Years and over | 128 (100.0%) | 90 (70.3%) |
| Total | 475 (34.8%) | 1,005 (73.7%) |
Disability Status by Sex by Age in Grant
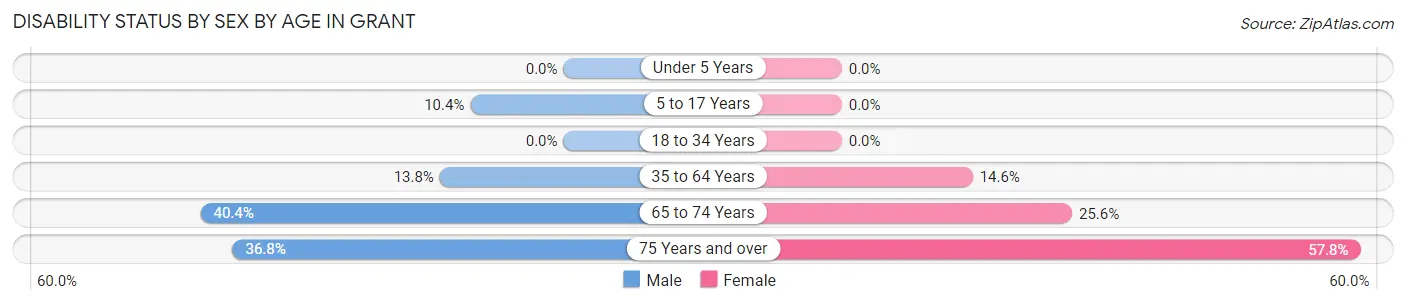
| Age Bracket | Male | Female |
| Under 5 Years | 0 (0.0%) | 0 (0.0%) |
| 5 to 17 Years | 14 (10.4%) | 0 (0.0%) |
| 18 to 34 Years | 0 (0.0%) | 0 (0.0%) |
| 35 to 64 Years | 34 (13.8%) | 35 (14.6%) |
| 65 to 74 Years | 40 (40.4%) | 20 (25.6%) |
| 75 Years and over | 21 (36.8%) | 41 (57.8%) |
Disability Class by Sex by Age in Grant
Disability Class: Hearing Difficulty
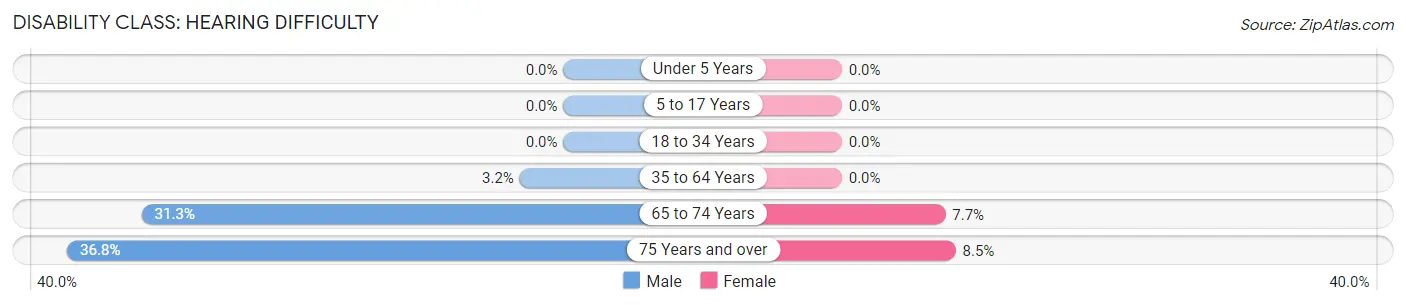
| Age Bracket | Male | Female |
| Under 5 Years | 0 (0.0%) | 0 (0.0%) |
| 5 to 17 Years | 0 (0.0%) | 0 (0.0%) |
| 18 to 34 Years | 0 (0.0%) | 0 (0.0%) |
| 35 to 64 Years | 8 (3.2%) | 0 (0.0%) |
| 65 to 74 Years | 31 (31.3%) | 6 (7.7%) |
| 75 Years and over | 21 (36.8%) | 6 (8.5%) |
Disability Class: Vision Difficulty
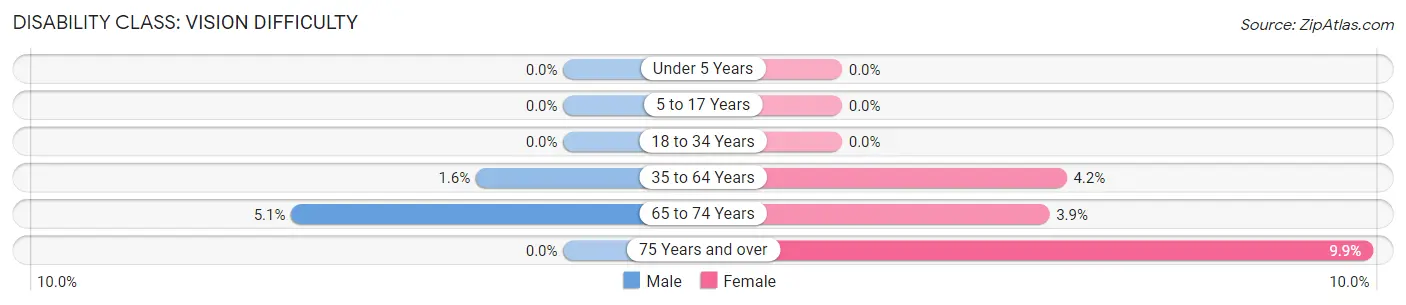
| Age Bracket | Male | Female |
| Under 5 Years | 0 (0.0%) | 0 (0.0%) |
| 5 to 17 Years | 0 (0.0%) | 0 (0.0%) |
| 18 to 34 Years | 0 (0.0%) | 0 (0.0%) |
| 35 to 64 Years | 4 (1.6%) | 10 (4.2%) |
| 65 to 74 Years | 5 (5.1%) | 3 (3.8%) |
| 75 Years and over | 0 (0.0%) | 7 (9.9%) |
Disability Class: Cognitive Difficulty
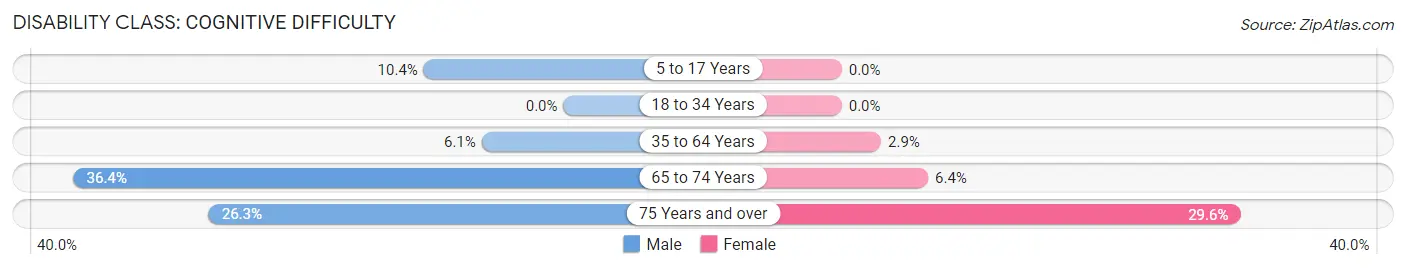
| Age Bracket | Male | Female |
| 5 to 17 Years | 14 (10.4%) | 0 (0.0%) |
| 18 to 34 Years | 0 (0.0%) | 0 (0.0%) |
| 35 to 64 Years | 15 (6.1%) | 7 (2.9%) |
| 65 to 74 Years | 36 (36.4%) | 5 (6.4%) |
| 75 Years and over | 15 (26.3%) | 21 (29.6%) |
Disability Class: Ambulatory Difficulty
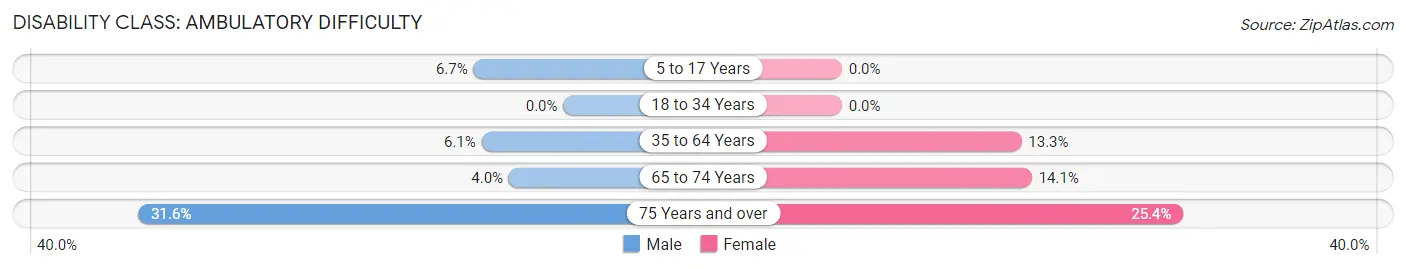
| Age Bracket | Male | Female |
| 5 to 17 Years | 9 (6.7%) | 0 (0.0%) |
| 18 to 34 Years | 0 (0.0%) | 0 (0.0%) |
| 35 to 64 Years | 15 (6.1%) | 32 (13.3%) |
| 65 to 74 Years | 4 (4.0%) | 11 (14.1%) |
| 75 Years and over | 18 (31.6%) | 18 (25.4%) |
Disability Class: Self-Care Difficulty
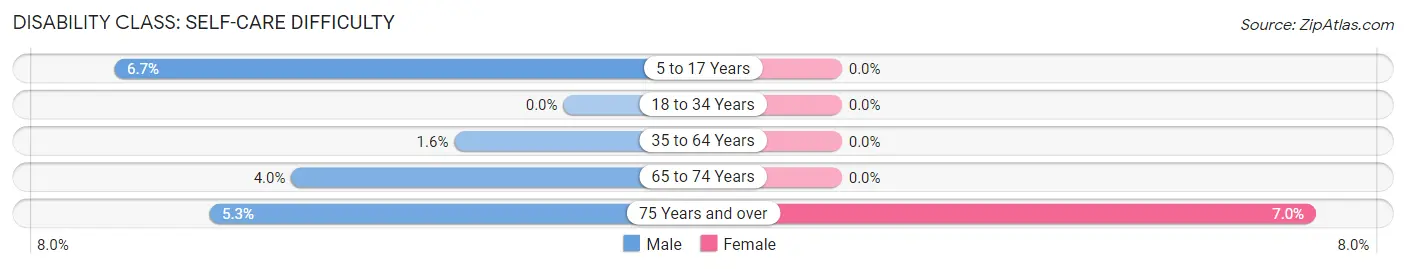
| Age Bracket | Male | Female |
| 5 to 17 Years | 9 (6.7%) | 0 (0.0%) |
| 18 to 34 Years | 0 (0.0%) | 0 (0.0%) |
| 35 to 64 Years | 4 (1.6%) | 0 (0.0%) |
| 65 to 74 Years | 4 (4.0%) | 0 (0.0%) |
| 75 Years and over | 3 (5.3%) | 5 (7.0%) |
Technology Access in Grant
Computing Device Access in Grant
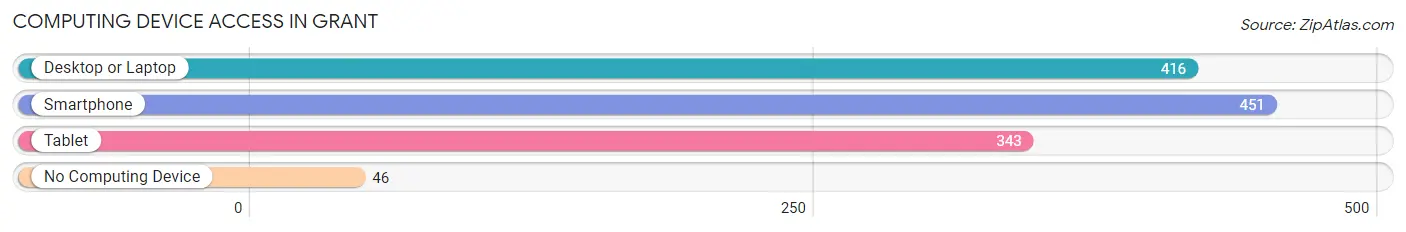
| Device Type | # Households | % Households |
| Desktop or Laptop | 416 | 74.3% |
| Smartphone | 451 | 80.5% |
| Tablet | 343 | 61.3% |
| No Computing Device | 46 | 8.2% |
| Total | 560 | 100.0% |
Internet Access in Grant
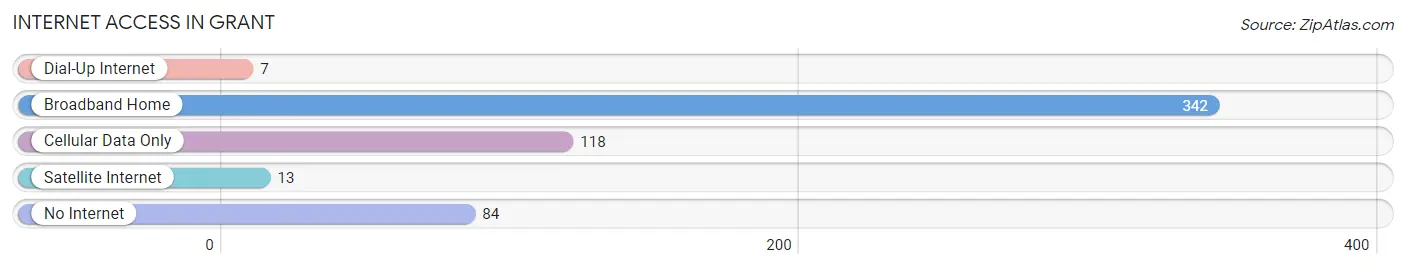
| Internet Type | # Households | % Households |
| Dial-Up Internet | 7 | 1.3% |
| Broadband Home | 342 | 61.1% |
| Cellular Data Only | 118 | 21.1% |
| Satellite Internet | 13 | 2.3% |
| No Internet | 84 | 15.0% |
| Total | 560 | 100.0% |
Grant Summary
History
Grant, Nebraska is a small town located in Perkins County in the western part of the state. It was founded in 1887 by the Union Pacific Railroad and was named after Ulysses S. Grant, the 18th President of the United States. The town was originally a stop on the railroad and was used as a supply point for the surrounding area.
In the early 1900s, Grant began to grow and develop as a farming community. The town was home to a variety of businesses, including a bank, a hotel, a lumberyard, a blacksmith shop, and a general store. The town also had a school, a post office, and a newspaper.
In the 1920s, Grant experienced a period of growth and prosperity. The town was home to a variety of businesses, including a movie theater, a bowling alley, a drug store, and a variety of other stores. The town also had a hospital, a library, and a variety of churches.
In the 1950s, Grant began to decline as the railroad industry began to decline. The town was no longer a stop on the railroad and the businesses began to close. The population of the town began to decline as well.
In the 1970s, Grant began to experience a resurgence. The town was home to a variety of businesses, including a grocery store, a hardware store, a restaurant, and a variety of other stores. The town also had a library, a post office, and a variety of churches.
Geography
Grant is located in Perkins County in the western part of Nebraska. The town is situated on the banks of the North Platte River and is surrounded by rolling hills and prairies. The town is located approximately 50 miles from the state capital of Lincoln.
The climate in Grant is semi-arid, with hot summers and cold winters. The average temperature in the summer is around 80 degrees Fahrenheit and the average temperature in the winter is around 20 degrees Fahrenheit.
Economy
The economy of Grant is largely based on agriculture. The town is home to a variety of farms, including cattle, sheep, and grain farms. The town is also home to a variety of businesses, including a grocery store, a hardware store, a restaurant, and a variety of other stores.
Demographics
As of the 2010 census, the population of Grant was 1,717. The population is largely white (94.3%) and the median age is 44. The median household income is $41,250 and the median home value is $90,000. The town is home to a variety of churches, including Catholic, Lutheran, and Methodist.
Common Questions
What is Per Capita Income in Grant?
Per Capita income in Grant is $33,053.
What is the Median Family Income in Grant?
Median Family Income in Grant is $79,444.
What is the Median Household income in Grant?
Median Household Income in Grant is $67,500.
What is Income or Wage Gap in Grant?
Income or Wage Gap in Grant is 15.7%.
Women in Grant earn 84.3 cents for every dollar earned by a man.
What is Inequality or Gini Index in Grant?
Inequality or Gini Index in Grant is 0.40.
What is the Total Population of Grant?
Total Population of Grant is 1,398.
What is the Total Male Population of Grant?
Total Male Population of Grant is 733.
What is the Total Female Population of Grant?
Total Female Population of Grant is 665.
What is the Ratio of Males per 100 Females in Grant?
There are 110.23 Males per 100 Females in Grant.
What is the Ratio of Females per 100 Males in Grant?
There are 90.72 Females per 100 Males in Grant.
What is the Median Population Age in Grant?
Median Population Age in Grant is 41.6 Years.
What is the Average Family Size in Grant
Average Family Size in Grant is 3.0 People.
What is the Average Household Size in Grant
Average Household Size in Grant is 2.4 People.
How Large is the Labor Force in Grant?
There are 691 People in the Labor Forcein in Grant.
What is the Percentage of People in the Labor Force in Grant?
63.3% of People are in the Labor Force in Grant.
What is the Unemployment Rate in Grant?
Unemployment Rate in Grant is 1.2%.