Berwyn, NE Map & Demographics
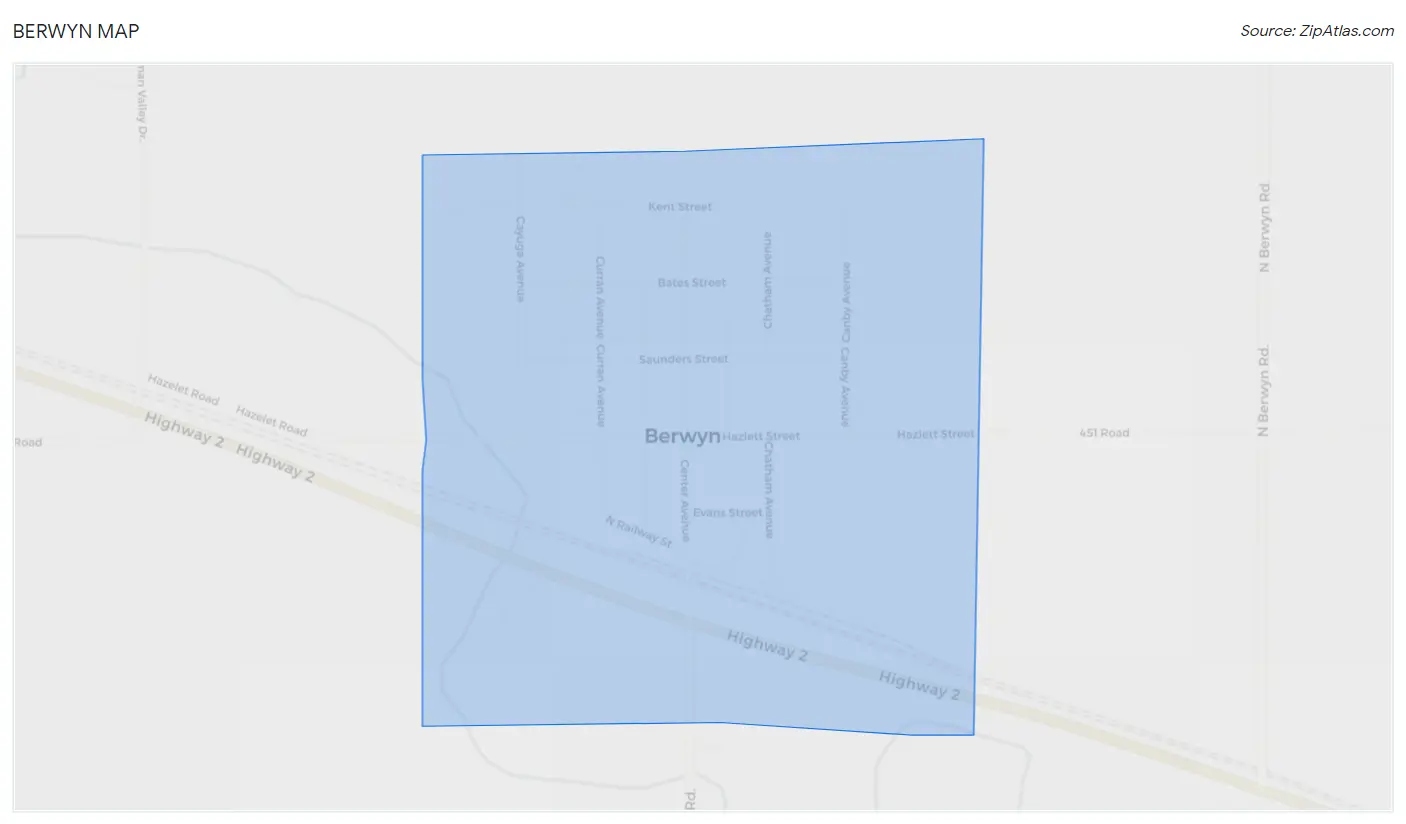
Berwyn Map
Berwyn Overview
$23,332
PER CAPITA INCOME
$60,000
AVG FAMILY INCOME
$43,125
AVG HOUSEHOLD INCOME
0.35
INEQUALITY / GINI INDEX
75
TOTAL POPULATION
29
MALE POPULATION
46
FEMALE POPULATION
63.04
MALES / 100 FEMALES
158.62
FEMALES / 100 MALES
42.3
MEDIAN AGE
2.6
AVG FAMILY SIZE
2.3
AVG HOUSEHOLD SIZE
48
LABOR FORCE [ PEOPLE ]
70.6%
PERCENT IN LABOR FORCE
Berwyn Area Codes
Income in Berwyn
Income Overview in Berwyn
Per Capita Income in Berwyn is $23,332, while median incomes of families and households are $60,000 and $43,125 respectively.
| Characteristic | Number | Measure |
| Per Capita Income | 75 | $23,332 |
| Median Family Income | 26 | $60,000 |
| Mean Family Income | 26 | $58,258 |
| Median Household Income | 33 | $43,125 |
| Mean Household Income | 33 | $48,767 |
| Income Deficit | 26 | $0 |
| Wage / Income Gap (%) | 75 | 0.00% |
| Wage / Income Gap ($) | 75 | 100.00¢ per $1 |
| Gini / Inequality Index | 75 | 0.35 |
Earnings by Sex in Berwyn
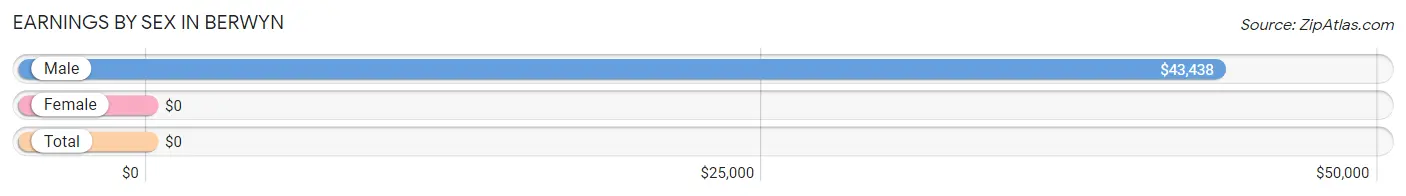
| Sex | Number | Average Earnings |
| Male | 19 (38.0%) | $43,438 |
| Female | 31 (62.0%) | $0 |
| Total | 50 (100.0%) | $0 |
Earnings by Sex by Income Bracket in Berwyn
The most common earnings brackets in Berwyn are $40,000 to $44,999 for men (4 | 21.0%) and $2,499 or less for women (9 | 29.0%).
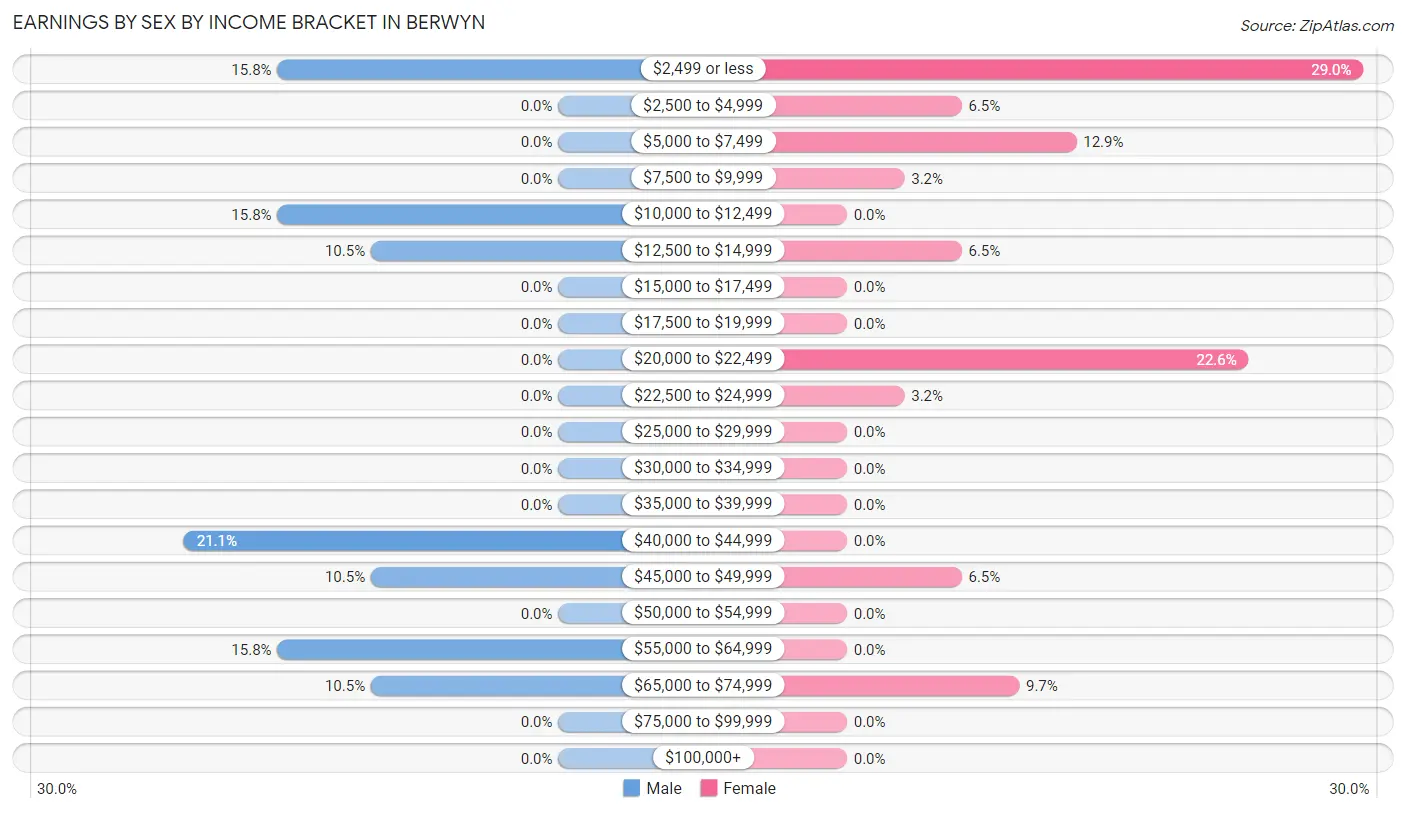
| Income | Male | Female |
| $2,499 or less | 3 (15.8%) | 9 (29.0%) |
| $2,500 to $4,999 | 0 (0.0%) | 2 (6.5%) |
| $5,000 to $7,499 | 0 (0.0%) | 4 (12.9%) |
| $7,500 to $9,999 | 0 (0.0%) | 1 (3.2%) |
| $10,000 to $12,499 | 3 (15.8%) | 0 (0.0%) |
| $12,500 to $14,999 | 2 (10.5%) | 2 (6.5%) |
| $15,000 to $17,499 | 0 (0.0%) | 0 (0.0%) |
| $17,500 to $19,999 | 0 (0.0%) | 0 (0.0%) |
| $20,000 to $22,499 | 0 (0.0%) | 7 (22.6%) |
| $22,500 to $24,999 | 0 (0.0%) | 1 (3.2%) |
| $25,000 to $29,999 | 0 (0.0%) | 0 (0.0%) |
| $30,000 to $34,999 | 0 (0.0%) | 0 (0.0%) |
| $35,000 to $39,999 | 0 (0.0%) | 0 (0.0%) |
| $40,000 to $44,999 | 4 (21.0%) | 0 (0.0%) |
| $45,000 to $49,999 | 2 (10.5%) | 2 (6.5%) |
| $50,000 to $54,999 | 0 (0.0%) | 0 (0.0%) |
| $55,000 to $64,999 | 3 (15.8%) | 0 (0.0%) |
| $65,000 to $74,999 | 2 (10.5%) | 3 (9.7%) |
| $75,000 to $99,999 | 0 (0.0%) | 0 (0.0%) |
| $100,000+ | 0 (0.0%) | 0 (0.0%) |
| Total | 19 (100.0%) | 31 (100.0%) |
Earnings by Sex by Educational Attainment in Berwyn
Average earnings in Berwyn are $44,375 for men and $21,786 for women, a difference of 50.9%. Men with an educational attainment of college or associate's degree enjoy the highest average annual earnings of $46,250, while those with high school diploma education earn the least with $43,750. Women with an educational attainment of college or associate's degree earn the most with the average annual earnings of $21,429, while those with college or associate's degree education have the smallest earnings of $21,429.
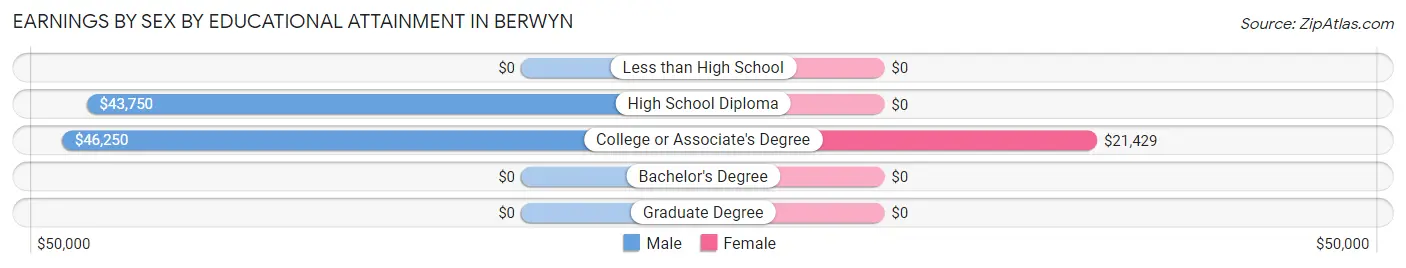
| Educational Attainment | Male Income | Female Income |
| Less than High School | - | - |
| High School Diploma | $43,750 | $0 |
| College or Associate's Degree | $46,250 | $21,429 |
| Bachelor's Degree | - | - |
| Graduate Degree | - | - |
| Total | $44,375 | $21,786 |
Family Income in Berwyn
Family Income Brackets in Berwyn
According to the Berwyn family income data, there are 9 families falling into the $75,000 to $99,999 income range, which is the most common income bracket and makes up 34.6% of all families.
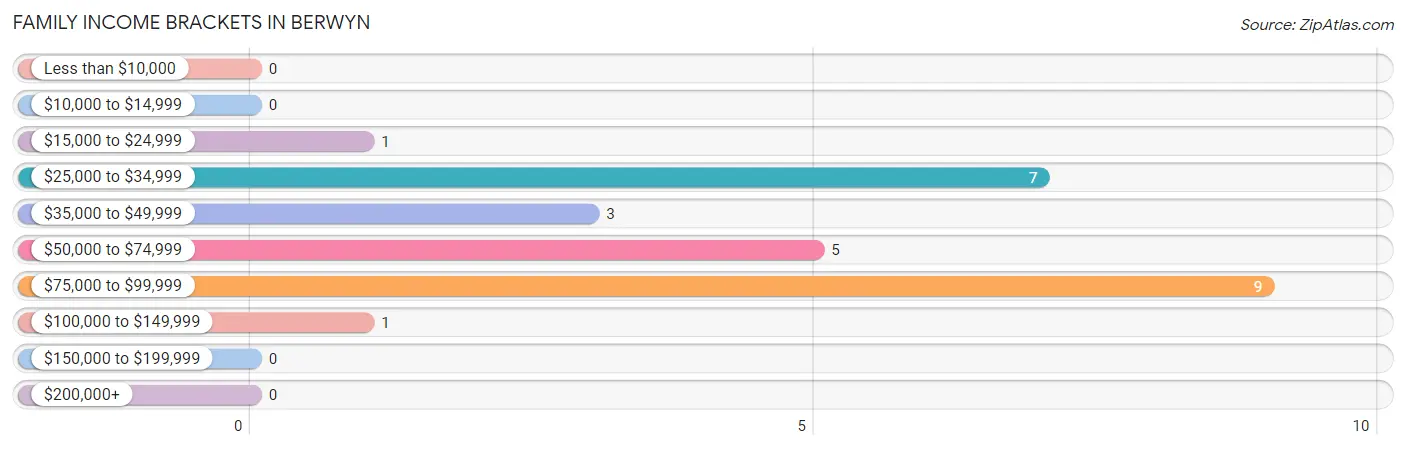
| Income Bracket | # Families | % Families |
| Less than $10,000 | 0 | 0.0% |
| $10,000 to $14,999 | 0 | 0.0% |
| $15,000 to $24,999 | 1 | 3.8% |
| $25,000 to $34,999 | 7 | 26.9% |
| $35,000 to $49,999 | 3 | 11.5% |
| $50,000 to $74,999 | 5 | 19.2% |
| $75,000 to $99,999 | 9 | 34.6% |
| $100,000 to $149,999 | 1 | 3.8% |
| $150,000 to $199,999 | 0 | 0.0% |
| $200,000+ | 0 | 0.0% |
Family Income by Famaliy Size in Berwyn
2-person families (12 | 46.2%) account for the highest median family income in Berwyn with $68,750 per family, while 2-person families (12 | 46.2%) have the highest median income of $34,375 per family member.
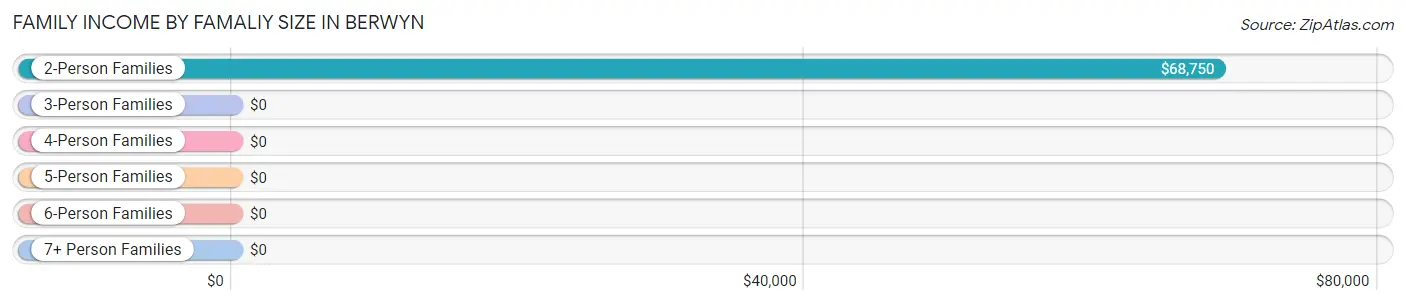
| Income Bracket | # Families | Median Income |
| 2-Person Families | 12 (46.2%) | $68,750 |
| 3-Person Families | 4 (15.4%) | $0 |
| 4-Person Families | 8 (30.8%) | $0 |
| 5-Person Families | 2 (7.7%) | $0 |
| 6-Person Families | 0 (0.0%) | $0 |
| 7+ Person Families | 0 (0.0%) | $0 |
| Total | 26 (100.0%) | $60,000 |
Family Income by Number of Earners in Berwyn
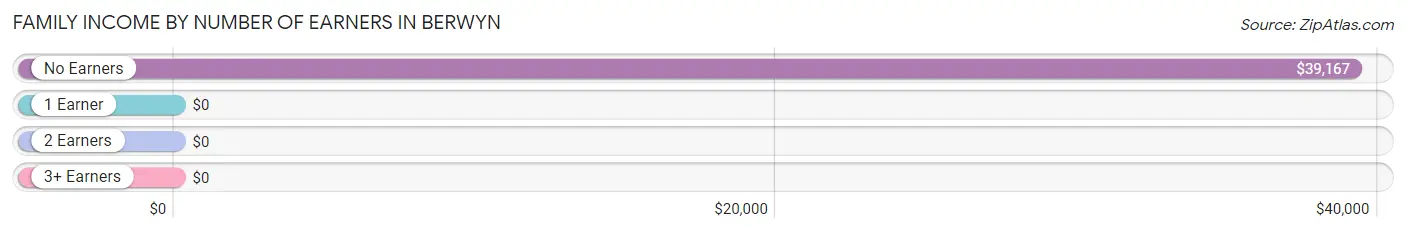
| Number of Earners | # Families | Median Income |
| No Earners | 6 (23.1%) | $39,167 |
| 1 Earner | 2 (7.7%) | $0 |
| 2 Earners | 15 (57.7%) | $0 |
| 3+ Earners | 3 (11.5%) | $0 |
| Total | 26 (100.0%) | $60,000 |
Household Income in Berwyn
Household Income Brackets in Berwyn
With 9 households falling in the category, the $75,000 to $99,999 income range is the most frequent in Berwyn, accounting for 27.3% of all households.
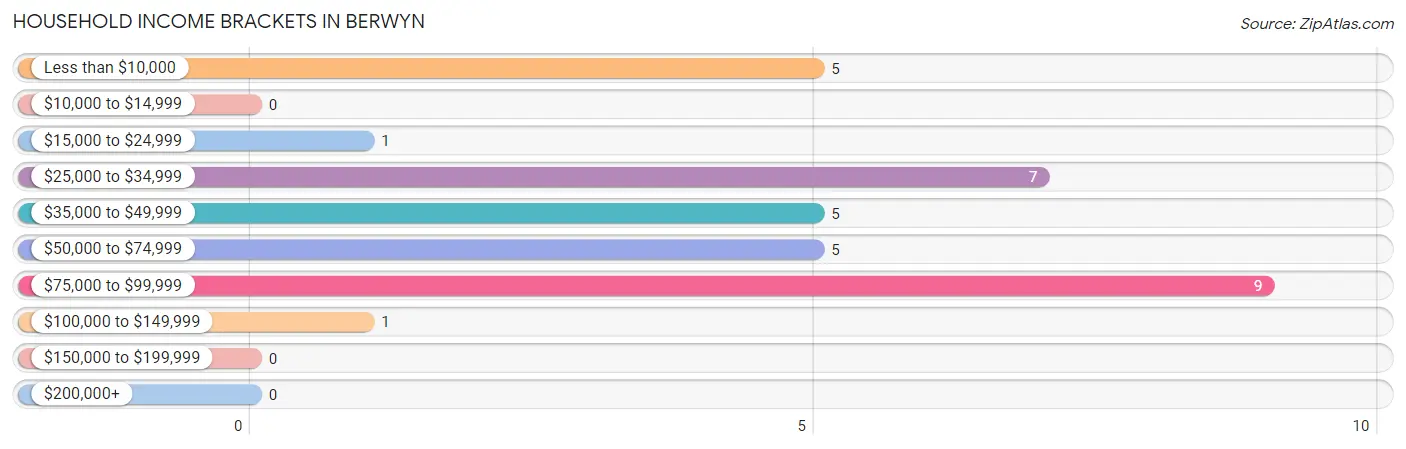
| Income Bracket | # Households | % Households |
| Less than $10,000 | 5 | 15.2% |
| $10,000 to $14,999 | 0 | 0.0% |
| $15,000 to $24,999 | 1 | 3.0% |
| $25,000 to $34,999 | 7 | 21.2% |
| $35,000 to $49,999 | 5 | 15.2% |
| $50,000 to $74,999 | 5 | 15.2% |
| $75,000 to $99,999 | 9 | 27.3% |
| $100,000 to $149,999 | 1 | 3.0% |
| $150,000 to $199,999 | 0 | 0.0% |
| $200,000+ | 0 | 0.0% |
Household Income by Householder Age in Berwyn
The median household income in Berwyn is $43,125, with the highest median household income of $78,750 found in the 25 to 44 years age bracket for the primary householder. A total of 7 households (21.2%) fall into this category.
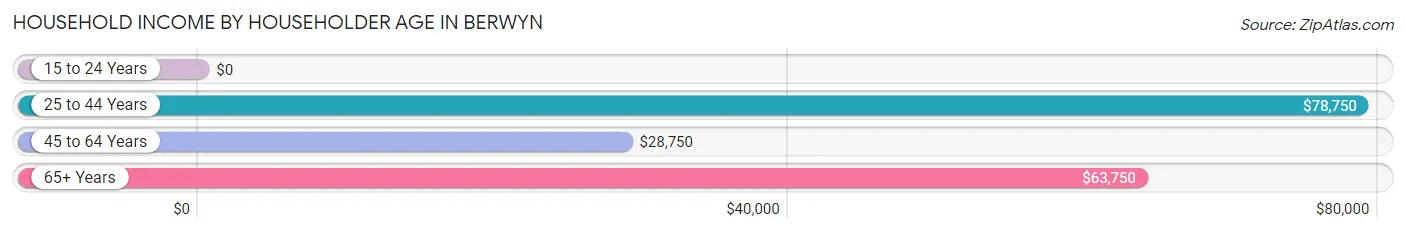
| Income Bracket | # Households | Median Income |
| 15 to 24 Years | 0 (0.0%) | $0 |
| 25 to 44 Years | 7 (21.2%) | $78,750 |
| 45 to 64 Years | 19 (57.6%) | $28,750 |
| 65+ Years | 7 (21.2%) | $63,750 |
| Total | 33 (100.0%) | $43,125 |
Poverty in Berwyn
Income Below Poverty by Sex and Age in Berwyn
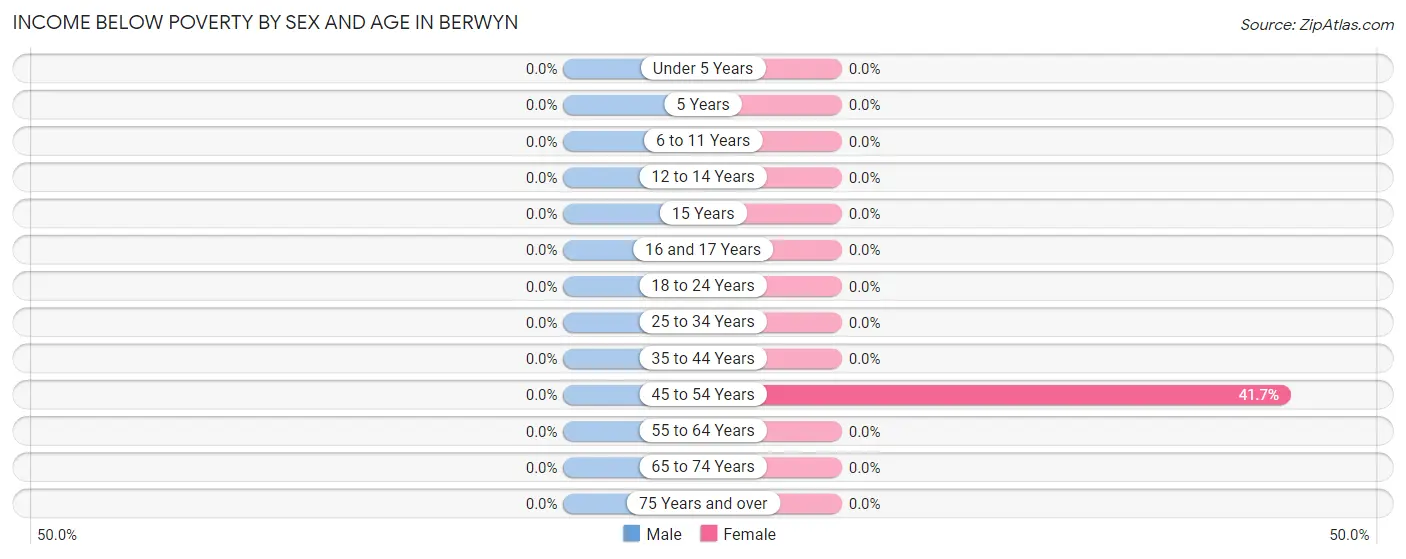
| Age Bracket | Male | Female |
| Under 5 Years | 0 (0.0%) | 0 (0.0%) |
| 5 Years | 0 (0.0%) | 0 (0.0%) |
| 6 to 11 Years | 0 (0.0%) | 0 (0.0%) |
| 12 to 14 Years | 0 (0.0%) | 0 (0.0%) |
| 15 Years | 0 (0.0%) | 0 (0.0%) |
| 16 and 17 Years | 0 (0.0%) | 0 (0.0%) |
| 18 to 24 Years | 0 (0.0%) | 0 (0.0%) |
| 25 to 34 Years | 0 (0.0%) | 0 (0.0%) |
| 35 to 44 Years | 0 (0.0%) | 0 (0.0%) |
| 45 to 54 Years | 0 (0.0%) | 5 (41.7%) |
| 55 to 64 Years | 0 (0.0%) | 0 (0.0%) |
| 65 to 74 Years | 0 (0.0%) | 0 (0.0%) |
| 75 Years and over | 0 (0.0%) | 0 (0.0%) |
| Total | 0 (0.0%) | 5 (10.9%) |
Income Above Poverty by Sex and Age in Berwyn
According to the poverty statistics in Berwyn, males aged under 5 years and females aged 6 to 11 years are the age groups that are most secure financially, with 100.0% of males and 100.0% of females in these age groups living above the poverty line.
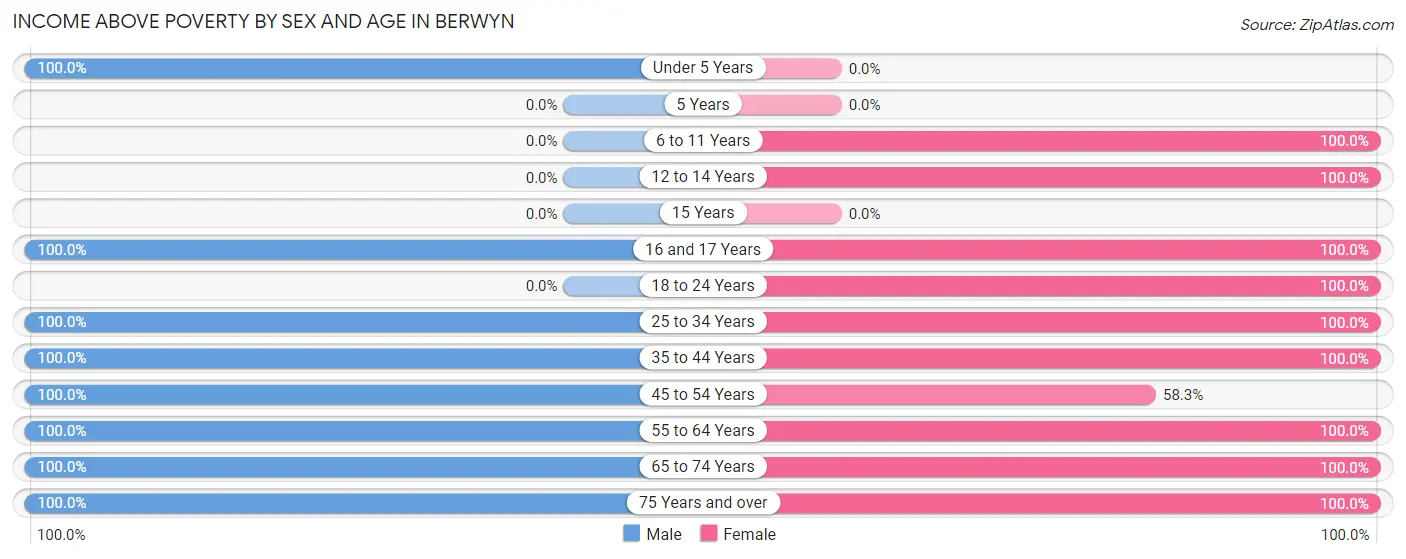
| Age Bracket | Male | Female |
| Under 5 Years | 1 (100.0%) | 0 (0.0%) |
| 5 Years | 0 (0.0%) | 0 (0.0%) |
| 6 to 11 Years | 0 (0.0%) | 2 (100.0%) |
| 12 to 14 Years | 0 (0.0%) | 4 (100.0%) |
| 15 Years | 0 (0.0%) | 0 (0.0%) |
| 16 and 17 Years | 3 (100.0%) | 10 (100.0%) |
| 18 to 24 Years | 0 (0.0%) | 5 (100.0%) |
| 25 to 34 Years | 7 (100.0%) | 3 (100.0%) |
| 35 to 44 Years | 2 (100.0%) | 2 (100.0%) |
| 45 to 54 Years | 4 (100.0%) | 7 (58.3%) |
| 55 to 64 Years | 1 (100.0%) | 3 (100.0%) |
| 65 to 74 Years | 6 (100.0%) | 4 (100.0%) |
| 75 Years and over | 5 (100.0%) | 1 (100.0%) |
| Total | 29 (100.0%) | 41 (89.1%) |
Income Below Poverty Among Married-Couple Families in Berwyn
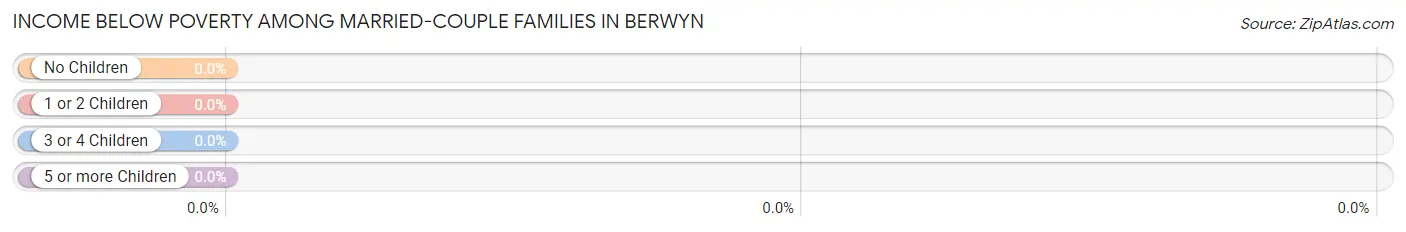
| Children | Above Poverty | Below Poverty |
| No Children | 10 (100.0%) | 0 (0.0%) |
| 1 or 2 Children | 7 (100.0%) | 0 (0.0%) |
| 3 or 4 Children | 0 (0.0%) | 0 (0.0%) |
| 5 or more Children | 0 (0.0%) | 0 (0.0%) |
| Total | 17 (100.0%) | 0 (0.0%) |
Income Below Poverty Among Single-Parent Households in Berwyn
| Children | Single Father | Single Mother |
| No Children | 0 (0.0%) | 0 (0.0%) |
| 1 or 2 Children | 0 (0.0%) | 0 (0.0%) |
| 3 or 4 Children | 0 (0.0%) | 0 (0.0%) |
| 5 or more Children | 0 (0.0%) | 0 (0.0%) |
| Total | 0 (0.0%) | 0 (0.0%) |
Income Below Poverty Among Married-Couple vs Single-Parent Households in Berwyn
| Children | Married-Couple Families | Single-Parent Households |
| No Children | 0 (0.0%) | 0 (0.0%) |
| 1 or 2 Children | 0 (0.0%) | 0 (0.0%) |
| 3 or 4 Children | 0 (0.0%) | 0 (0.0%) |
| 5 or more Children | 0 (0.0%) | 0 (0.0%) |
| Total | 0 (0.0%) | 0 (0.0%) |
Race in Berwyn
The most populous races in Berwyn are White / Caucasian (44 | 58.7%), Native / Alaskan (22 | 29.3%), and Hispanic or Latino (8 | 10.7%).
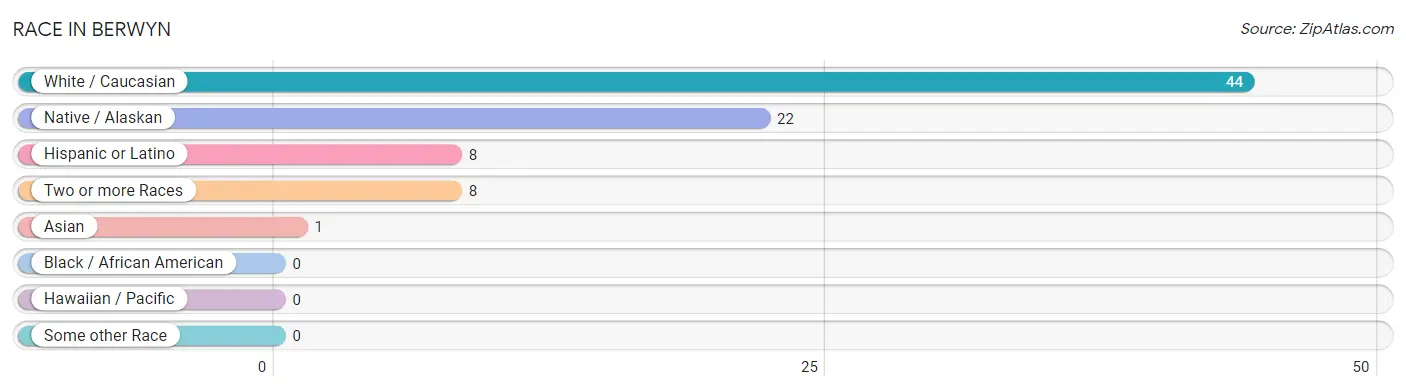
| Race | # Population | % Population |
| Asian | 1 | 1.3% |
| Black / African American | 0 | 0.0% |
| Hawaiian / Pacific | 0 | 0.0% |
| Hispanic or Latino | 8 | 10.7% |
| Native / Alaskan | 22 | 29.3% |
| White / Caucasian | 44 | 58.7% |
| Two or more Races | 8 | 10.7% |
| Some other Race | 0 | 0.0% |
| Total | 75 | 100.0% |
Ancestry in Berwyn
The most populous ancestries reported in Berwyn are Sioux (25 | 33.3%), English (10 | 13.3%), Mexican (8 | 10.7%), Irish (5 | 6.7%), and Swedish (4 | 5.3%), together accounting for 69.3% of all Berwyn residents.
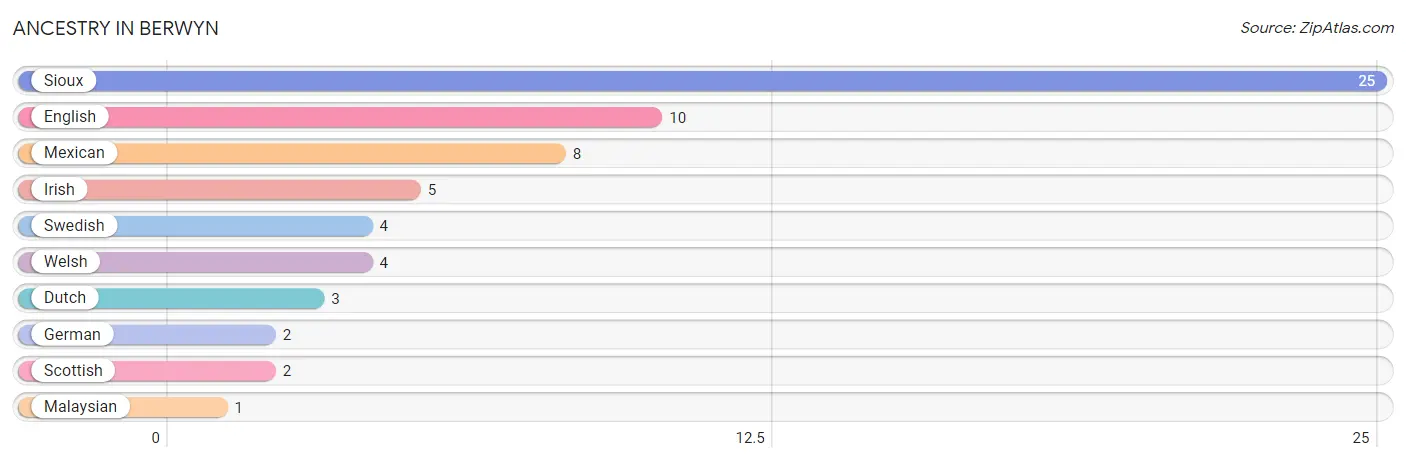
| Ancestry | # Population | % Population |
| Dutch | 3 | 4.0% |
| English | 10 | 13.3% |
| German | 2 | 2.7% |
| Irish | 5 | 6.7% |
| Malaysian | 1 | 1.3% |
| Mexican | 8 | 10.7% |
| Scottish | 2 | 2.7% |
| Sioux | 25 | 33.3% |
| Swedish | 4 | 5.3% |
| Welsh | 4 | 5.3% | View All 10 Rows |
Immigrants in Berwyn
The most numerous immigrant groups reported in Berwyn came from Asia (1 | 1.3%), Laos (1 | 1.3%), and South Eastern Asia (1 | 1.3%), together accounting for 4.0% of all Berwyn residents.
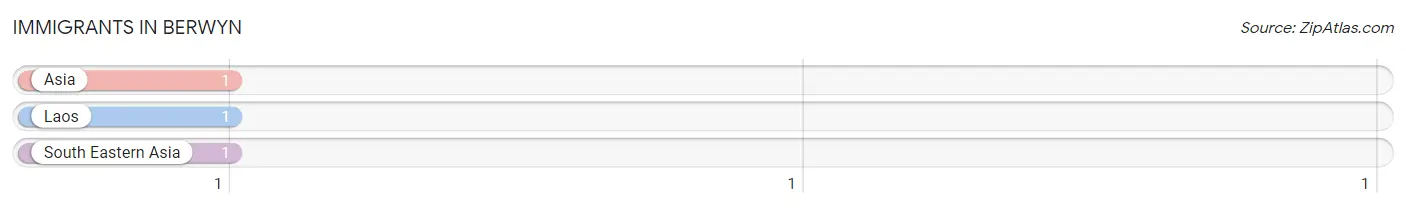
| Immigration Origin | # Population | % Population |
| Asia | 1 | 1.3% |
| Laos | 1 | 1.3% |
| South Eastern Asia | 1 | 1.3% | View All 3 Rows |
Sex and Age in Berwyn
Sex and Age in Berwyn
The most populous age groups in Berwyn are 25 to 29 Years (7 | 24.1%) for men and 15 to 19 Years (13 | 28.3%) for women.
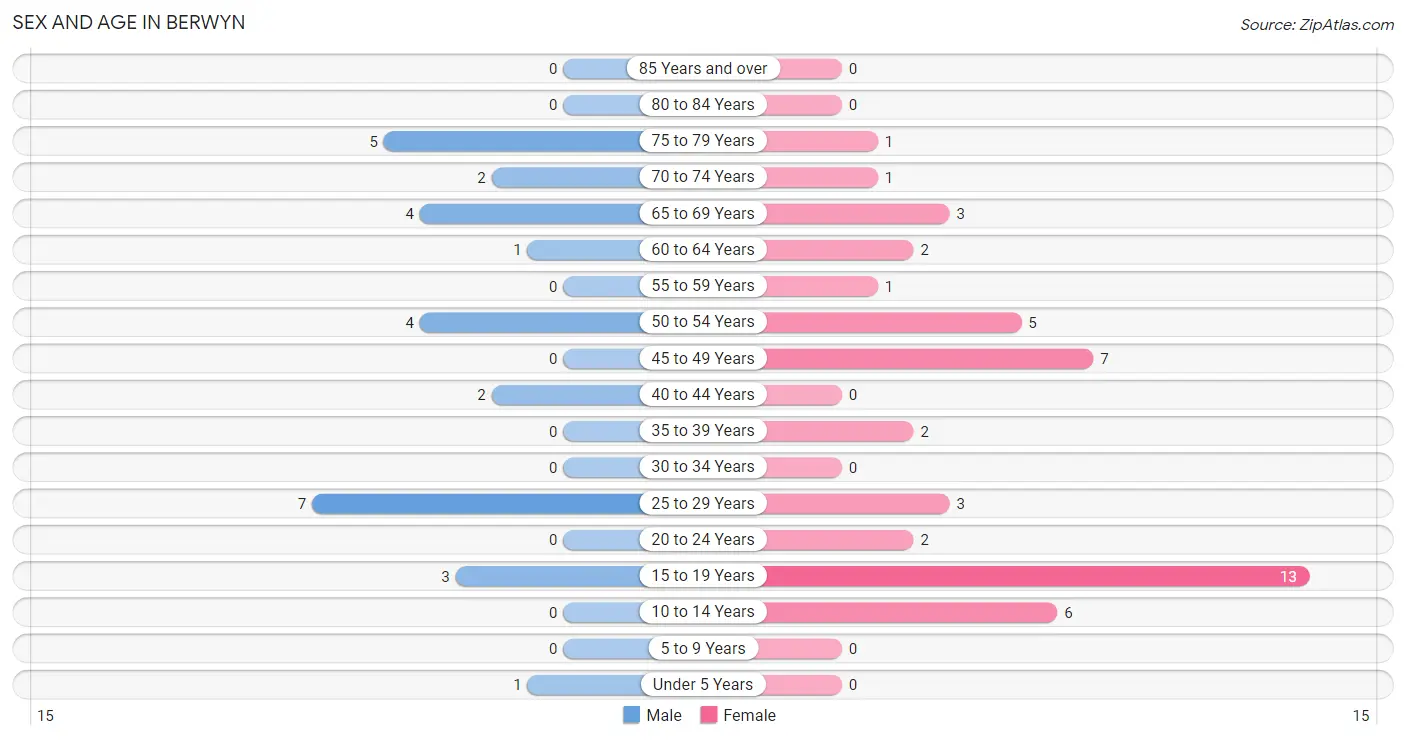
| Age Bracket | Male | Female |
| Under 5 Years | 1 (3.5%) | 0 (0.0%) |
| 5 to 9 Years | 0 (0.0%) | 0 (0.0%) |
| 10 to 14 Years | 0 (0.0%) | 6 (13.0%) |
| 15 to 19 Years | 3 (10.3%) | 13 (28.3%) |
| 20 to 24 Years | 0 (0.0%) | 2 (4.3%) |
| 25 to 29 Years | 7 (24.1%) | 3 (6.5%) |
| 30 to 34 Years | 0 (0.0%) | 0 (0.0%) |
| 35 to 39 Years | 0 (0.0%) | 2 (4.3%) |
| 40 to 44 Years | 2 (6.9%) | 0 (0.0%) |
| 45 to 49 Years | 0 (0.0%) | 7 (15.2%) |
| 50 to 54 Years | 4 (13.8%) | 5 (10.9%) |
| 55 to 59 Years | 0 (0.0%) | 1 (2.2%) |
| 60 to 64 Years | 1 (3.5%) | 2 (4.3%) |
| 65 to 69 Years | 4 (13.8%) | 3 (6.5%) |
| 70 to 74 Years | 2 (6.9%) | 1 (2.2%) |
| 75 to 79 Years | 5 (17.2%) | 1 (2.2%) |
| 80 to 84 Years | 0 (0.0%) | 0 (0.0%) |
| 85 Years and over | 0 (0.0%) | 0 (0.0%) |
| Total | 29 (100.0%) | 46 (100.0%) |
Families and Households in Berwyn
Median Family Size in Berwyn
The median family size in Berwyn is 2.62 persons per family, with single female/mother families (7 | 26.9%) accounting for the largest median family size of 2.71 persons per family. On the other hand, single male/father families (2 | 7.7%) represent the smallest median family size with 2.00 persons per family.
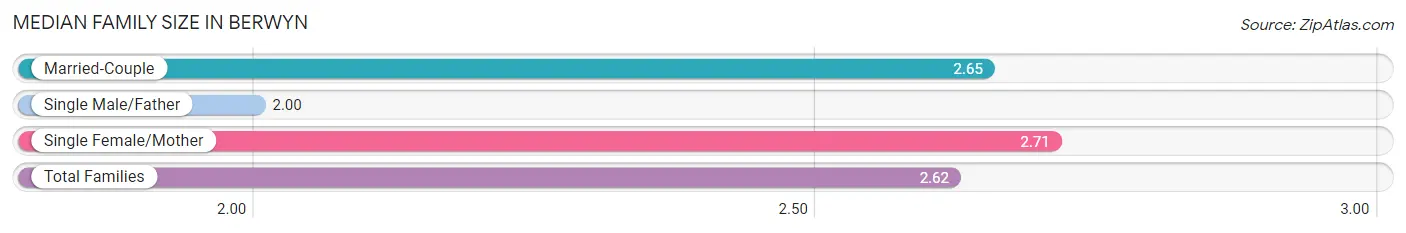
| Family Type | # Families | Family Size |
| Married-Couple | 17 (65.4%) | 2.65 |
| Single Male/Father | 2 (7.7%) | 2.00 |
| Single Female/Mother | 7 (26.9%) | 2.71 |
| Total Families | 26 (100.0%) | 2.62 |
Median Household Size in Berwyn
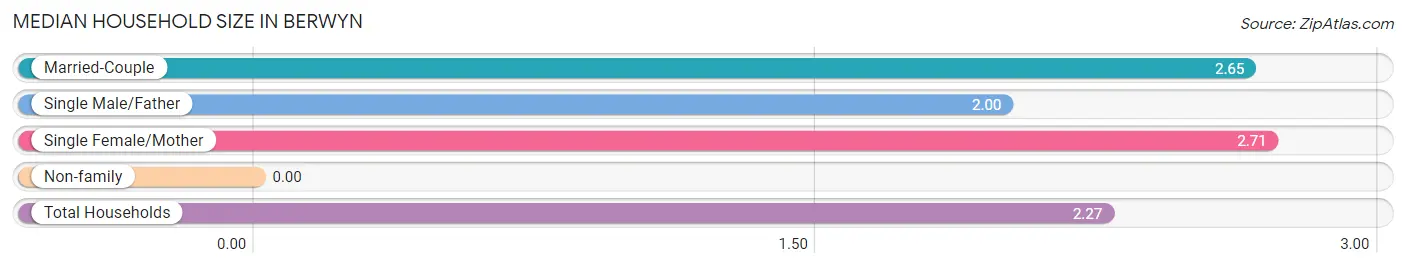
| Household Type | # Households | Household Size |
| Married-Couple | 17 (51.5%) | 2.65 |
| Single Male/Father | 2 (6.1%) | 2.00 |
| Single Female/Mother | 7 (21.2%) | 2.71 |
| Non-family | 7 (21.2%) | - |
| Total Households | 33 (100.0%) | 2.27 |
Household Size by Marriage Status in Berwyn
Out of a total of 33 households in Berwyn, 26 (78.8%) are family households, while 7 (21.2%) are nonfamily households. The most numerous type of family households are 2-person households, comprising 12, and the most common type of nonfamily households are 1-person households, comprising 7.
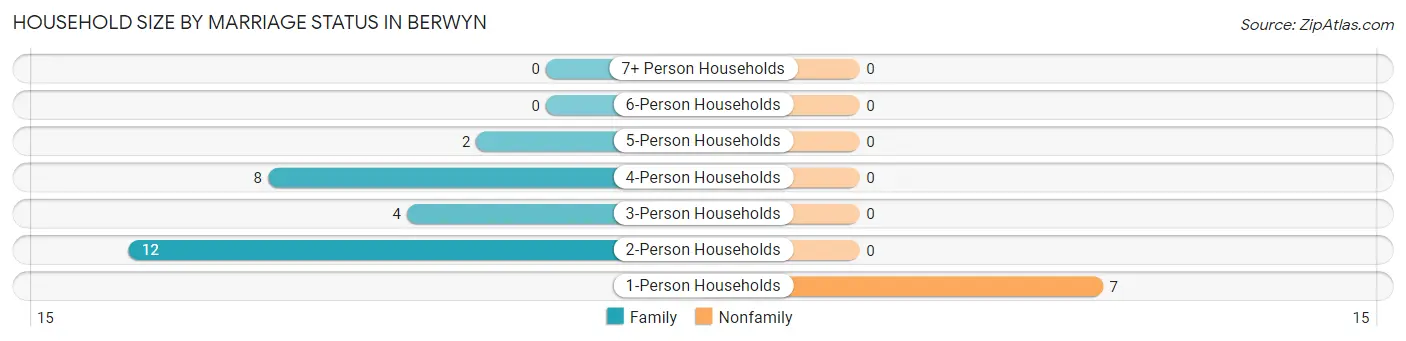
| Household Size | Family Households | Nonfamily Households |
| 1-Person Households | - | 7 (21.2%) |
| 2-Person Households | 12 (36.4%) | 0 (0.0%) |
| 3-Person Households | 4 (12.1%) | 0 (0.0%) |
| 4-Person Households | 8 (24.2%) | 0 (0.0%) |
| 5-Person Households | 2 (6.1%) | 0 (0.0%) |
| 6-Person Households | 0 (0.0%) | 0 (0.0%) |
| 7+ Person Households | 0 (0.0%) | 0 (0.0%) |
| Total | 26 (78.8%) | 7 (21.2%) |
Female Fertility in Berwyn
Fertility by Age in Berwyn
Average fertility rate in Berwyn is 111.0 births per 1,000 women. Women in the age bracket of 20 to 34 years have the highest fertility rate with 600.0 births per 1,000 women. Women in the age bracket of 20 to 34 years acount for 100.0% of all women with births.
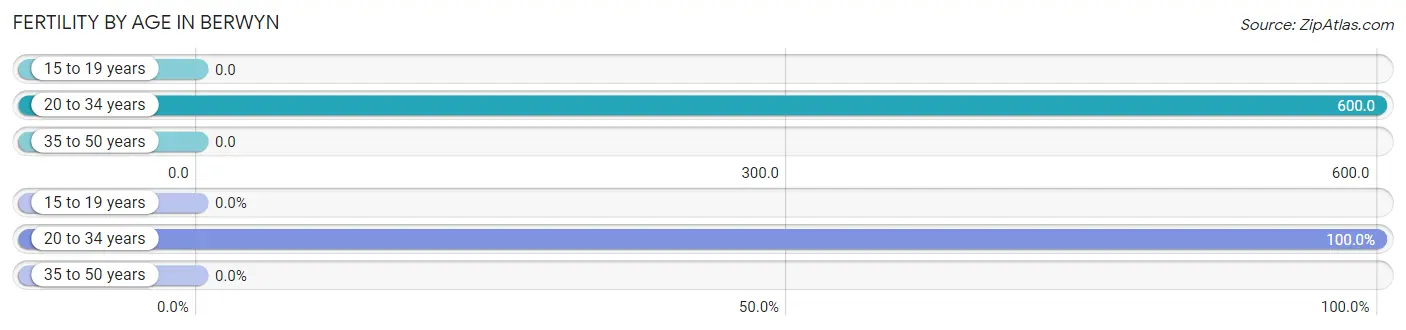
| Age Bracket | Women with Births | Births / 1,000 Women |
| 15 to 19 years | 0 (0.0%) | 0.0 |
| 20 to 34 years | 3 (100.0%) | 600.0 |
| 35 to 50 years | 0 (0.0%) | 0.0 |
| Total | 3 (100.0%) | 111.0 |
Fertility by Age by Marriage Status in Berwyn
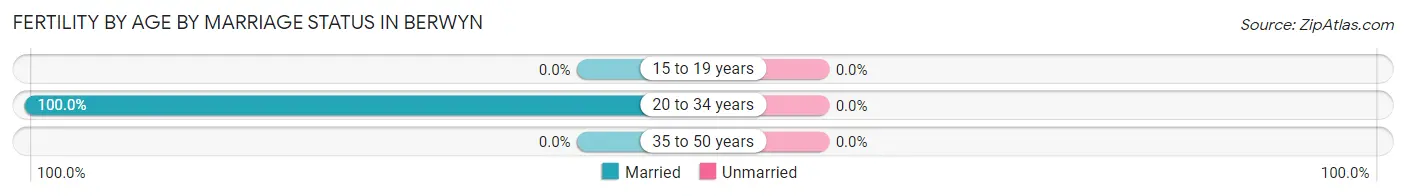
| Age Bracket | Married | Unmarried |
| 15 to 19 years | 0 (0.0%) | 0 (0.0%) |
| 20 to 34 years | 3 (100.0%) | 0 (0.0%) |
| 35 to 50 years | 0 (0.0%) | 0 (0.0%) |
| Total | 3 (100.0%) | 0 (0.0%) |
Fertility by Education in Berwyn
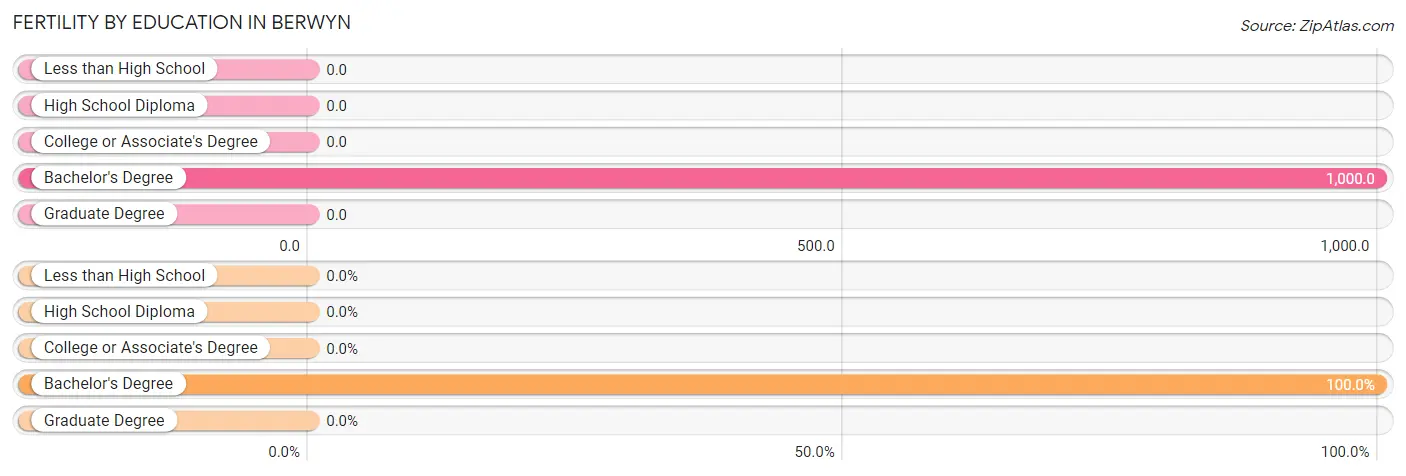
| Educational Attainment | Women with Births | Births / 1,000 Women |
| Less than High School | 0 (0.0%) | 0.0 |
| High School Diploma | 0 (0.0%) | 0.0 |
| College or Associate's Degree | 0 (0.0%) | 0.0 |
| Bachelor's Degree | 3 (100.0%) | 1,000.0 |
| Graduate Degree | 0 (0.0%) | 0.0 |
| Total | 3 (100.0%) | 111.0 |
Fertility by Education by Marriage Status in Berwyn
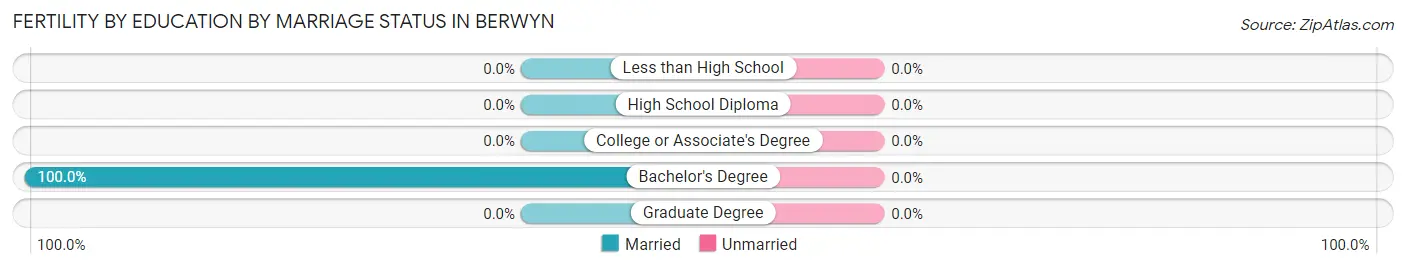
| Educational Attainment | Married | Unmarried |
| Less than High School | 0 (0.0%) | 0 (0.0%) |
| High School Diploma | 0 (0.0%) | 0 (0.0%) |
| College or Associate's Degree | 0 (0.0%) | 0 (0.0%) |
| Bachelor's Degree | 3 (100.0%) | 0 (0.0%) |
| Graduate Degree | 0 (0.0%) | 0 (0.0%) |
| Total | 3 (100.0%) | 0 (0.0%) |
Employment Characteristics in Berwyn
Employment by Class of Employer in Berwyn
Among the 48 employed individuals in Berwyn, private company employees (32 | 66.7%), not-for-profit organizations (10 | 20.8%), and self-employed (incorporated) (2 | 4.2%) make up the most common classes of employment.
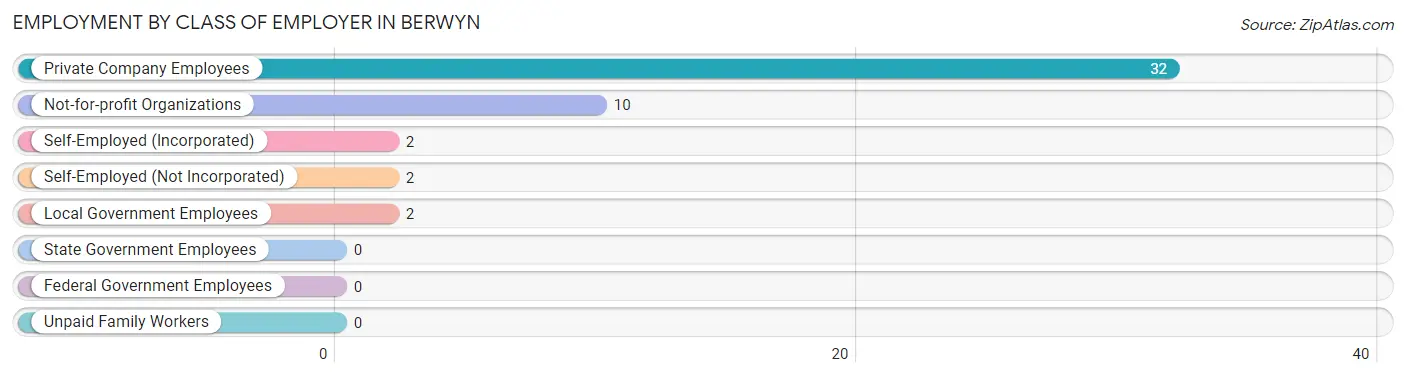
| Employer Class | # Employees | % Employees |
| Private Company Employees | 32 | 66.7% |
| Self-Employed (Incorporated) | 2 | 4.2% |
| Self-Employed (Not Incorporated) | 2 | 4.2% |
| Not-for-profit Organizations | 10 | 20.8% |
| Local Government Employees | 2 | 4.2% |
| State Government Employees | 0 | 0.0% |
| Federal Government Employees | 0 | 0.0% |
| Unpaid Family Workers | 0 | 0.0% |
| Total | 48 | 100.0% |
Employment Status by Age in Berwyn
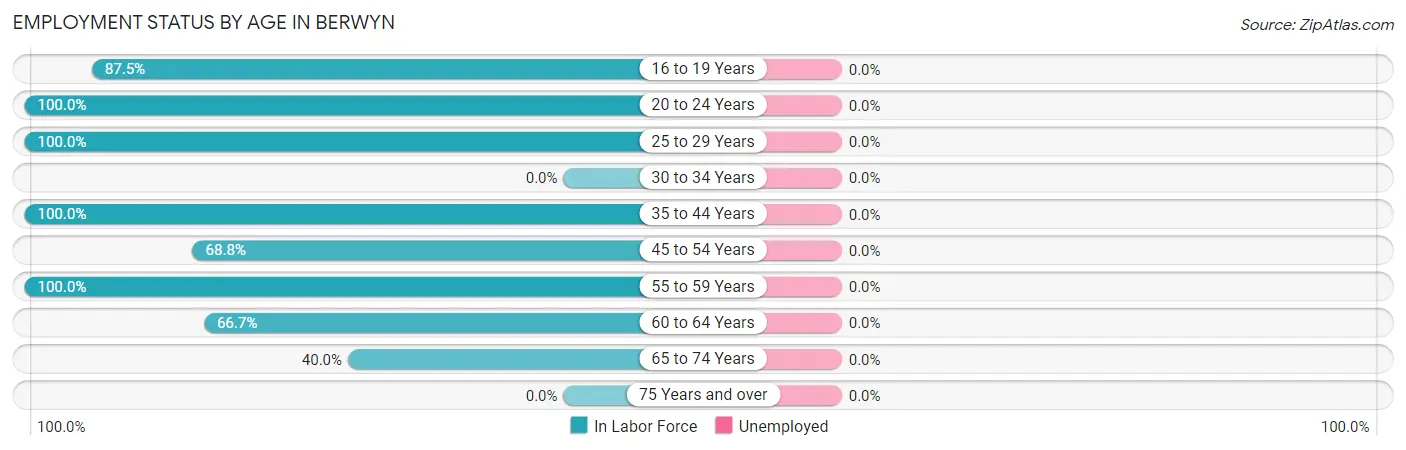
| Age Bracket | In Labor Force | Unemployed |
| 16 to 19 Years | 14 (87.5%) | 0 (0.0%) |
| 20 to 24 Years | 2 (100.0%) | 0 (0.0%) |
| 25 to 29 Years | 10 (100.0%) | 0 (0.0%) |
| 30 to 34 Years | 0 (0.0%) | 0 (0.0%) |
| 35 to 44 Years | 4 (100.0%) | 0 (0.0%) |
| 45 to 54 Years | 11 (68.8%) | 0 (0.0%) |
| 55 to 59 Years | 1 (100.0%) | 0 (0.0%) |
| 60 to 64 Years | 2 (66.7%) | 0 (0.0%) |
| 65 to 74 Years | 4 (40.0%) | 0 (0.0%) |
| 75 Years and over | 0 (0.0%) | 0 (0.0%) |
| Total | 48 (70.6%) | 0 (0.0%) |
Employment Status by Educational Attainment in Berwyn
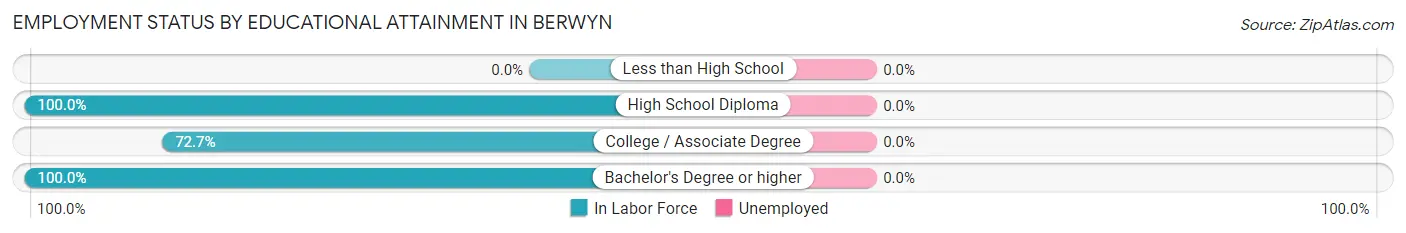
| Educational Attainment | In Labor Force | Unemployed |
| Less than High School | 0 (0.0%) | 0 (0.0%) |
| High School Diploma | 9 (100.0%) | 0 (0.0%) |
| College / Associate Degree | 16 (72.7%) | 0 (0.0%) |
| Bachelor's Degree or higher | 3 (100.0%) | 0 (0.0%) |
| Total | 28 (82.4%) | 0 (0.0%) |
Employment Occupations by Sex in Berwyn
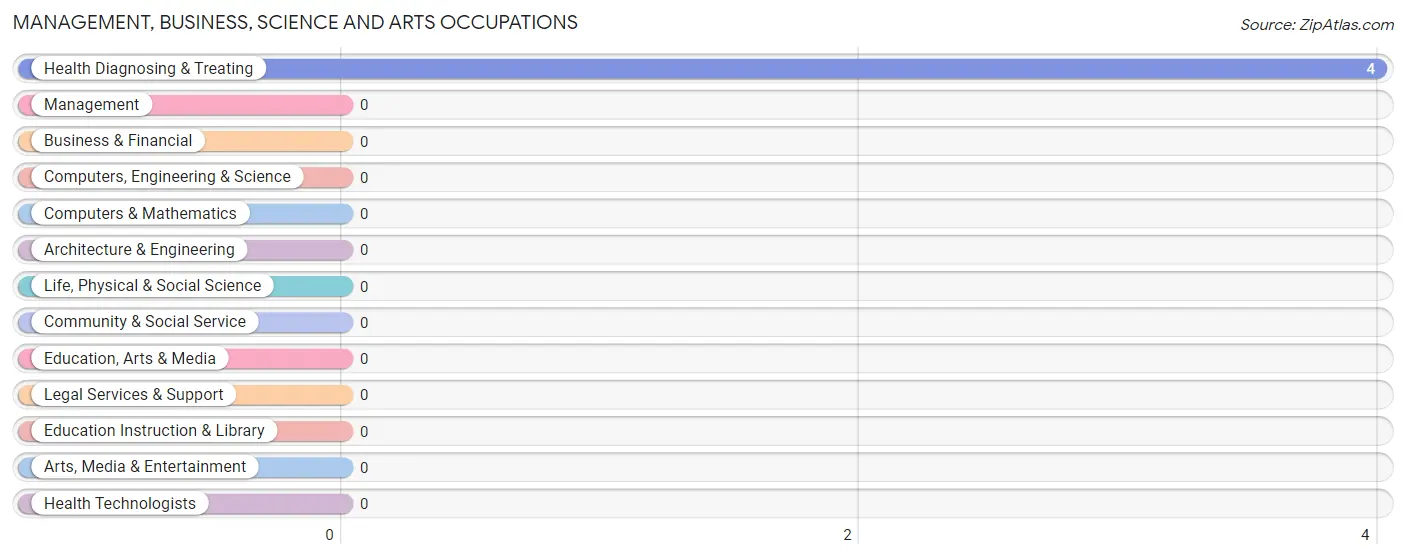
Management, Business, Science and Arts Occupations
The most common Management, Business, Science and Arts occupations in Berwyn are , and Health Diagnosing & Treating (4 | 8.3%).
Management, Business, Science and Arts Occupations by Sex
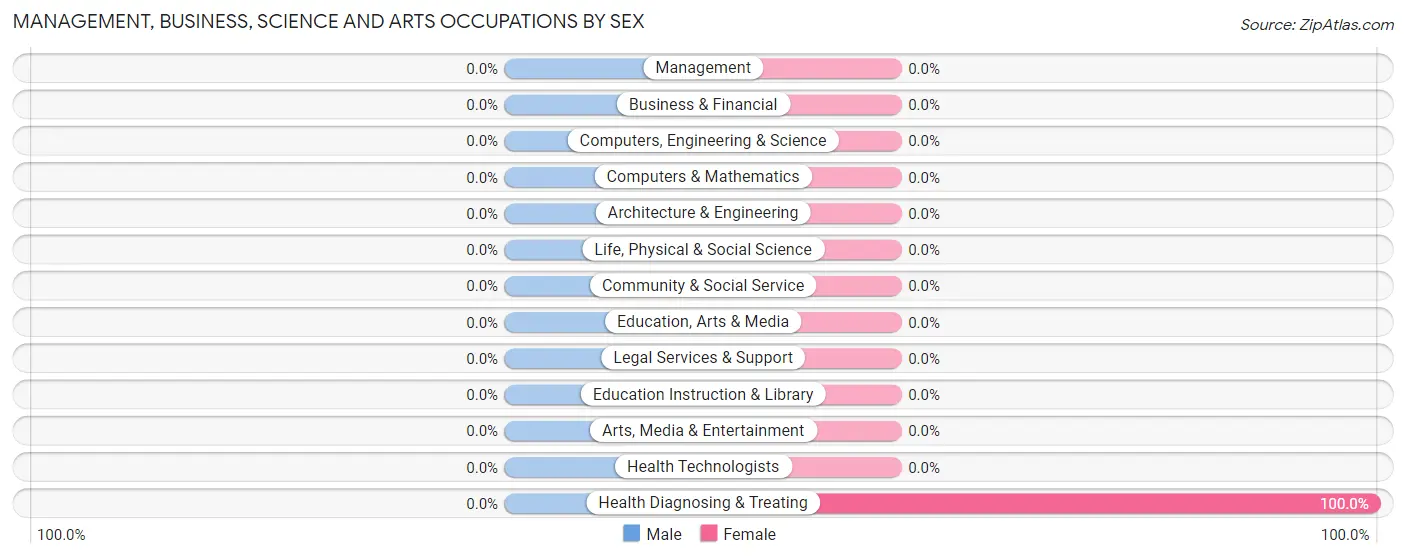
| Occupation | Male | Female |
| Management | 0 (0.0%) | 0 (0.0%) |
| Business & Financial | 0 (0.0%) | 0 (0.0%) |
| Computers, Engineering & Science | 0 (0.0%) | 0 (0.0%) |
| Computers & Mathematics | 0 (0.0%) | 0 (0.0%) |
| Architecture & Engineering | 0 (0.0%) | 0 (0.0%) |
| Life, Physical & Social Science | 0 (0.0%) | 0 (0.0%) |
| Community & Social Service | 0 (0.0%) | 0 (0.0%) |
| Education, Arts & Media | 0 (0.0%) | 0 (0.0%) |
| Legal Services & Support | 0 (0.0%) | 0 (0.0%) |
| Education Instruction & Library | 0 (0.0%) | 0 (0.0%) |
| Arts, Media & Entertainment | 0 (0.0%) | 0 (0.0%) |
| Health Diagnosing & Treating | 0 (0.0%) | 4 (100.0%) |
| Health Technologists | 0 (0.0%) | 0 (0.0%) |
| Total (Category) | 0 (0.0%) | 4 (100.0%) |
| Total (Overall) | 17 (35.4%) | 31 (64.6%) |
Services Occupations
The most common Services occupations in Berwyn are Food Preparation & Serving (11 | 22.9%), Healthcare Support (7 | 14.6%), and Cleaning & Maintenance (4 | 8.3%).
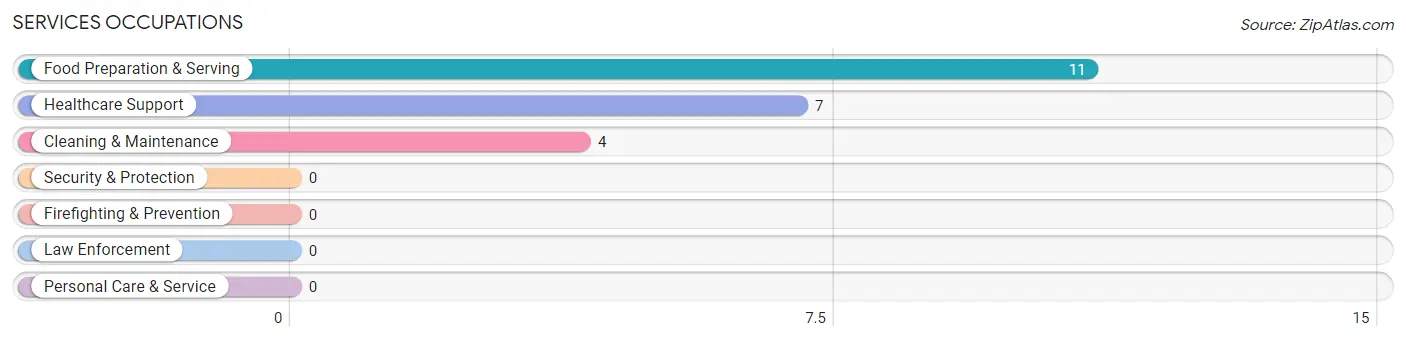
Services Occupations by Sex
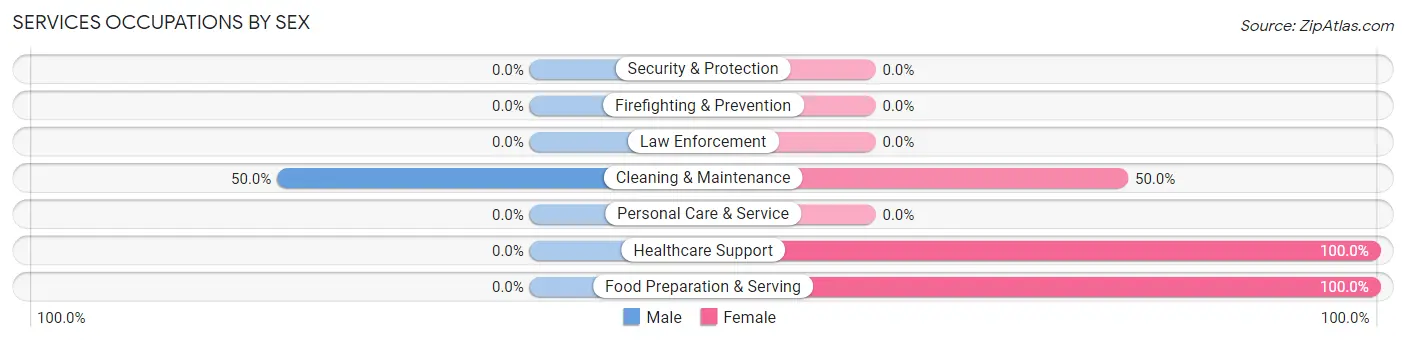
| Occupation | Male | Female |
| Healthcare Support | 0 (0.0%) | 7 (100.0%) |
| Security & Protection | 0 (0.0%) | 0 (0.0%) |
| Firefighting & Prevention | 0 (0.0%) | 0 (0.0%) |
| Law Enforcement | 0 (0.0%) | 0 (0.0%) |
| Food Preparation & Serving | 0 (0.0%) | 11 (100.0%) |
| Cleaning & Maintenance | 2 (50.0%) | 2 (50.0%) |
| Personal Care & Service | 0 (0.0%) | 0 (0.0%) |
| Total (Category) | 2 (9.1%) | 20 (90.9%) |
| Total (Overall) | 17 (35.4%) | 31 (64.6%) |
Sales and Office Occupations
The most common Sales and Office occupations in Berwyn are Sales & Related (2 | 4.2%), and Office & Administration (1 | 2.1%).

Sales and Office Occupations by Sex

| Occupation | Male | Female |
| Sales & Related | 0 (0.0%) | 2 (100.0%) |
| Office & Administration | 0 (0.0%) | 1 (100.0%) |
| Total (Category) | 0 (0.0%) | 3 (100.0%) |
| Total (Overall) | 17 (35.4%) | 31 (64.6%) |
Natural Resources, Construction and Maintenance Occupations
The most common Natural Resources, Construction and Maintenance occupations in Berwyn are Installation, Maintenance & Repair (9 | 18.8%), Construction & Extraction (2 | 4.2%), and Farming, Fishing & Forestry (1 | 2.1%).
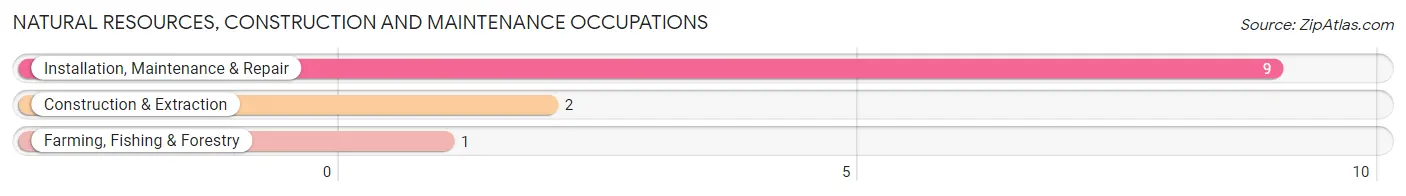
Natural Resources, Construction and Maintenance Occupations by Sex
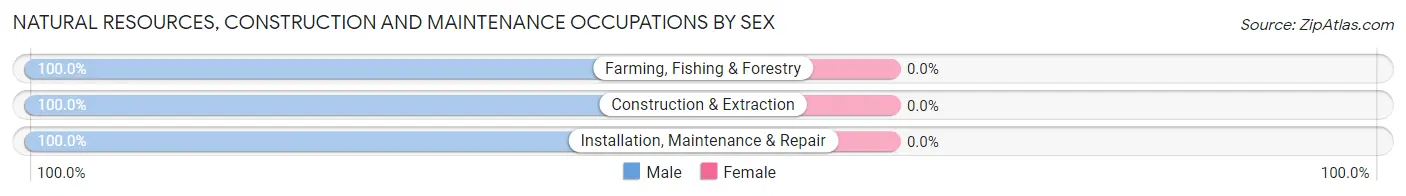
| Occupation | Male | Female |
| Farming, Fishing & Forestry | 1 (100.0%) | 0 (0.0%) |
| Construction & Extraction | 2 (100.0%) | 0 (0.0%) |
| Installation, Maintenance & Repair | 9 (100.0%) | 0 (0.0%) |
| Total (Category) | 12 (100.0%) | 0 (0.0%) |
| Total (Overall) | 17 (35.4%) | 31 (64.6%) |
Production, Transportation and Moving Occupations
The most common Production, Transportation and Moving occupations in Berwyn are Material Moving (3 | 6.2%), Production (2 | 4.2%), and Transportation (2 | 4.2%).
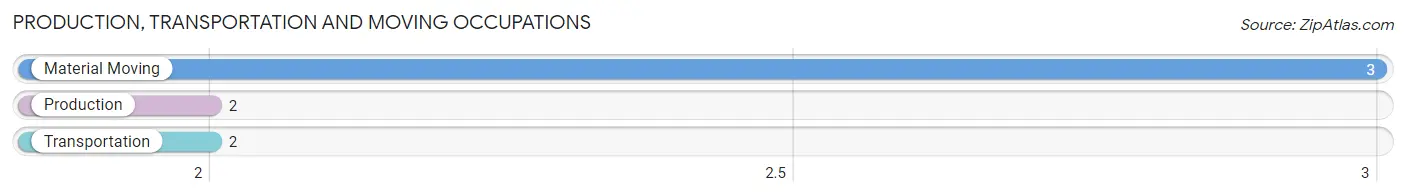
Production, Transportation and Moving Occupations by Sex
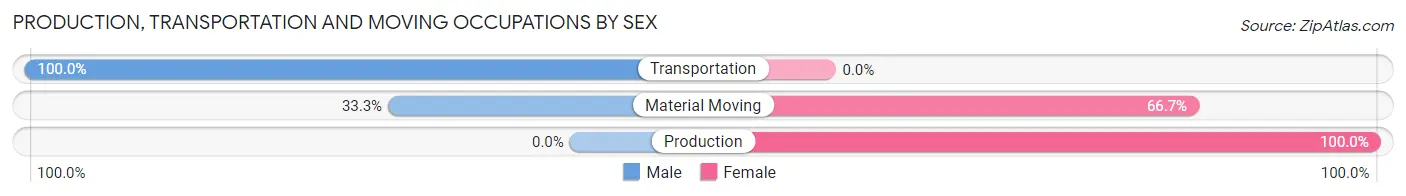
| Occupation | Male | Female |
| Production | 0 (0.0%) | 2 (100.0%) |
| Transportation | 2 (100.0%) | 0 (0.0%) |
| Material Moving | 1 (33.3%) | 2 (66.7%) |
| Total (Category) | 3 (42.9%) | 4 (57.1%) |
| Total (Overall) | 17 (35.4%) | 31 (64.6%) |
Employment Industries by Sex in Berwyn
Employment Industries in Berwyn
The major employment industries in Berwyn include Health Care & Social Assistance (11 | 22.9%), Accommodation & Food Services (10 | 20.8%), Retail Trade (8 | 16.7%), Construction (6 | 12.5%), and Administrative & Support (5 | 10.4%).
Employment Industries by Sex in Berwyn
The Berwyn industries that see more men than women are Agriculture, Fishing & Hunting (100.0%), Construction (100.0%), and Utilities (100.0%), whereas the industries that tend to have a higher number of women are Manufacturing (100.0%), Health Care & Social Assistance (100.0%), and Accommodation & Food Services (100.0%).
| Industry | Male | Female |
| Agriculture, Fishing & Hunting | 1 (100.0%) | 0 (0.0%) |
| Mining, Quarrying, & Extraction | 0 (0.0%) | 0 (0.0%) |
| Construction | 6 (100.0%) | 0 (0.0%) |
| Manufacturing | 0 (0.0%) | 2 (100.0%) |
| Wholesale Trade | 0 (0.0%) | 0 (0.0%) |
| Retail Trade | 3 (37.5%) | 5 (62.5%) |
| Transportation & Warehousing | 0 (0.0%) | 0 (0.0%) |
| Utilities | 3 (100.0%) | 0 (0.0%) |
| Information | 0 (0.0%) | 0 (0.0%) |
| Finance & Insurance | 0 (0.0%) | 0 (0.0%) |
| Real Estate, Rental & Leasing | 0 (0.0%) | 0 (0.0%) |
| Professional & Scientific | 0 (0.0%) | 0 (0.0%) |
| Enterprise Management | 0 (0.0%) | 0 (0.0%) |
| Administrative & Support | 2 (40.0%) | 3 (60.0%) |
| Educational Services | 0 (0.0%) | 0 (0.0%) |
| Health Care & Social Assistance | 0 (0.0%) | 11 (100.0%) |
| Arts, Entertainment & Recreation | 0 (0.0%) | 0 (0.0%) |
| Accommodation & Food Services | 0 (0.0%) | 10 (100.0%) |
| Public Administration | 0 (0.0%) | 0 (0.0%) |
| Total | 17 (35.4%) | 31 (64.6%) |
Education in Berwyn
School Enrollment in Berwyn
The most common levels of schooling among the 22 students in Berwyn are high school (16 | 72.7%), and middle school (6 | 27.3%).
| School Level | # Students | % Students |
| Nursery / Preschool | 0 | 0.0% |
| Kindergarten | 0 | 0.0% |
| Elementary School | 0 | 0.0% |
| Middle School | 6 | 27.3% |
| High School | 16 | 72.7% |
| College / Undergraduate | 0 | 0.0% |
| Graduate / Professional | 0 | 0.0% |
| Total | 22 | 100.0% |
School Enrollment by Age by Funding Source in Berwyn
Out of a total of 22 students who are enrolled in schools in Berwyn, 4 (18.2%) attend a private institution, while the remaining 18 (81.8%) are enrolled in public schools. The age group of 18 to 19 year olds has the highest likelihood of being enrolled in private schools, with 2 (66.7% in the age bracket) enrolled. Conversely, the age group of 10 to 14 year olds has the lowest likelihood of being enrolled in a private school, with 6 (100.0% in the age bracket) attending a public institution.
| Age Bracket | Public School | Private School |
| 3 to 4 Year Olds | 0 (0.0%) | 0 (0.0%) |
| 5 to 9 Year Old | 0 (0.0%) | 0 (0.0%) |
| 10 to 14 Year Olds | 6 (100.0%) | 0 (0.0%) |
| 15 to 17 Year Olds | 11 (84.6%) | 2 (15.4%) |
| 18 to 19 Year Olds | 1 (33.3%) | 2 (66.7%) |
| 20 to 24 Year Olds | 0 (0.0%) | 0 (0.0%) |
| 25 to 34 Year Olds | 0 (0.0%) | 0 (0.0%) |
| 35 Years and over | 0 (0.0%) | 0 (0.0%) |
| Total | 18 (81.8%) | 4 (18.2%) |
Educational Attainment by Field of Study in Berwyn
, and science & technology (3 | 100.0%) are the most common fields of study among 3 individuals in Berwyn who have obtained a bachelor's degree or higher.
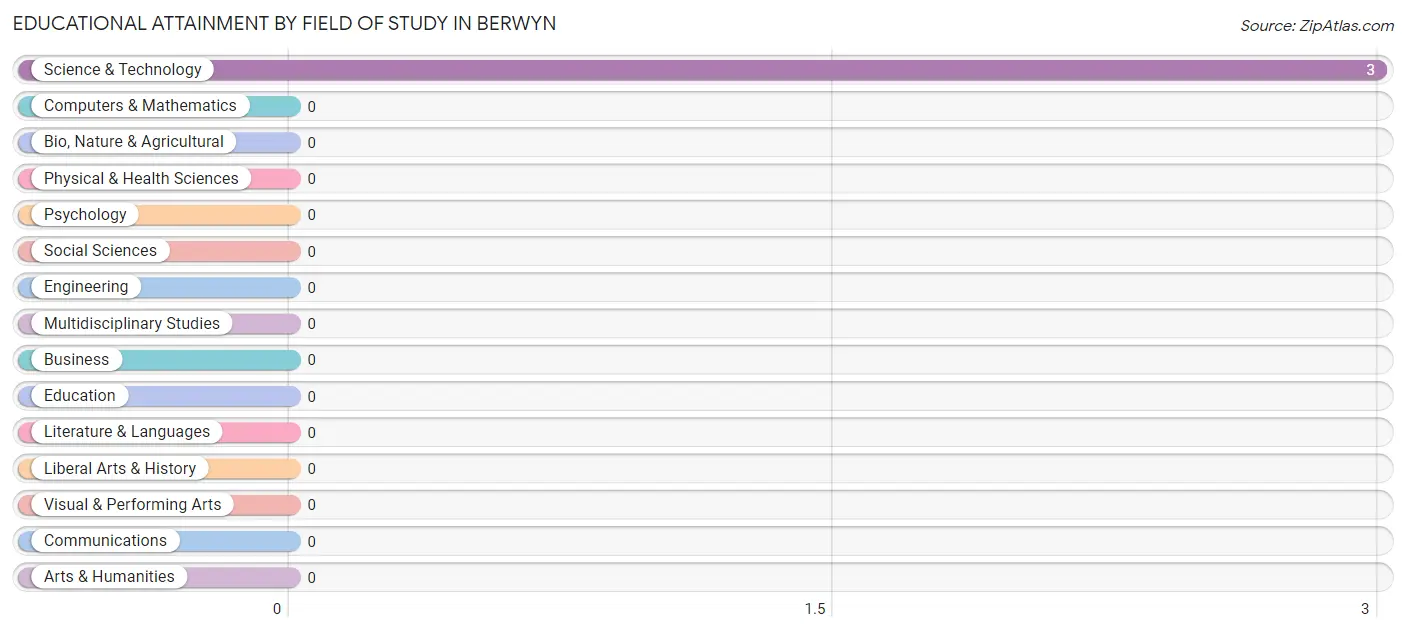
| Field of Study | # Graduates | % Graduates |
| Computers & Mathematics | 0 | 0.0% |
| Bio, Nature & Agricultural | 0 | 0.0% |
| Physical & Health Sciences | 0 | 0.0% |
| Psychology | 0 | 0.0% |
| Social Sciences | 0 | 0.0% |
| Engineering | 0 | 0.0% |
| Multidisciplinary Studies | 0 | 0.0% |
| Science & Technology | 3 | 100.0% |
| Business | 0 | 0.0% |
| Education | 0 | 0.0% |
| Literature & Languages | 0 | 0.0% |
| Liberal Arts & History | 0 | 0.0% |
| Visual & Performing Arts | 0 | 0.0% |
| Communications | 0 | 0.0% |
| Arts & Humanities | 0 | 0.0% |
| Total | 3 | 100.0% |
Transportation & Commute in Berwyn
Vehicle Availability by Sex in Berwyn
The most prevalent vehicle ownership categories in Berwyn are males with 4 vehicles (6, accounting for 35.3%) and females with 4 vehicles (5, making up 19.4%).
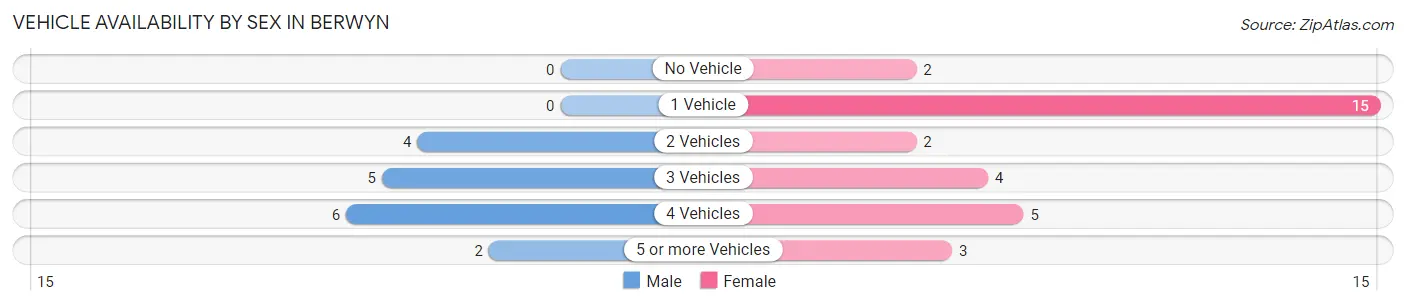
| Vehicles Available | Male | Female |
| No Vehicle | 0 (0.0%) | 2 (6.5%) |
| 1 Vehicle | 0 (0.0%) | 15 (48.4%) |
| 2 Vehicles | 4 (23.5%) | 2 (6.5%) |
| 3 Vehicles | 5 (29.4%) | 4 (12.9%) |
| 4 Vehicles | 6 (35.3%) | 5 (16.1%) |
| 5 or more Vehicles | 2 (11.8%) | 3 (9.7%) |
| Total | 17 (100.0%) | 31 (100.0%) |
Commute Time in Berwyn
The most frequently occuring commute durations in Berwyn are 10 to 14 minutes (19 commuters, 40.4%), 15 to 19 minutes (16 commuters, 34.0%), and 45 to 59 minutes (9 commuters, 19.2%).
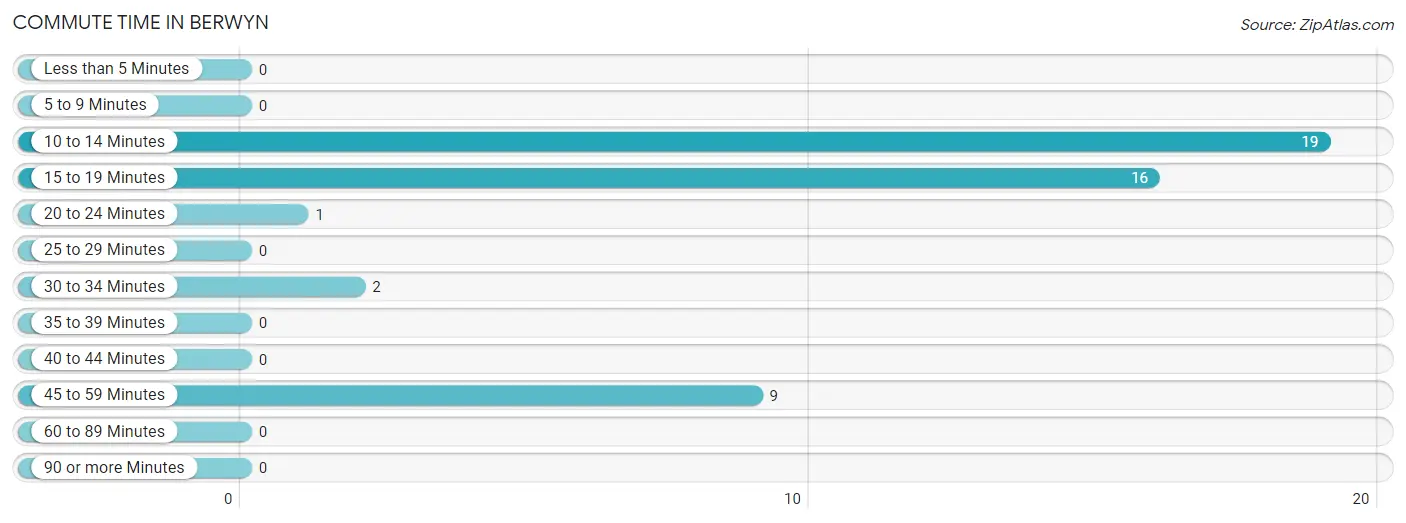
| Commute Time | # Commuters | % Commuters |
| Less than 5 Minutes | 0 | 0.0% |
| 5 to 9 Minutes | 0 | 0.0% |
| 10 to 14 Minutes | 19 | 40.4% |
| 15 to 19 Minutes | 16 | 34.0% |
| 20 to 24 Minutes | 1 | 2.1% |
| 25 to 29 Minutes | 0 | 0.0% |
| 30 to 34 Minutes | 2 | 4.3% |
| 35 to 39 Minutes | 0 | 0.0% |
| 40 to 44 Minutes | 0 | 0.0% |
| 45 to 59 Minutes | 9 | 19.2% |
| 60 to 89 Minutes | 0 | 0.0% |
| 90 or more Minutes | 0 | 0.0% |
Commute Time by Sex in Berwyn
The most common commute times in Berwyn are 15 to 19 minutes (8 commuters, 47.1%) for males and 10 to 14 minutes (12 commuters, 40.0%) for females.
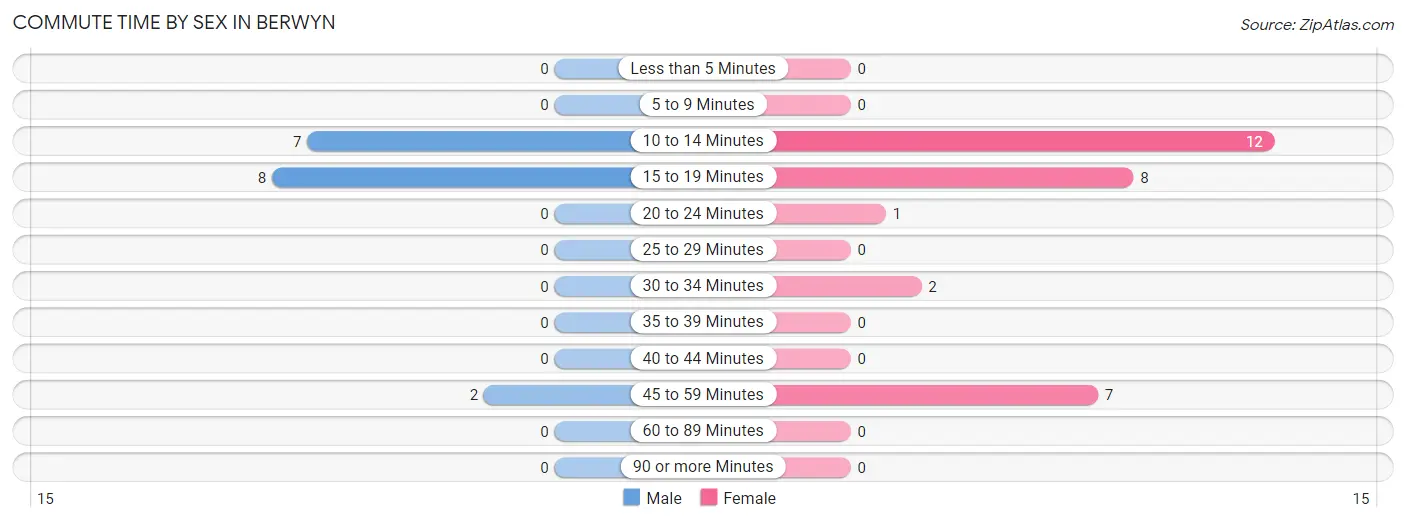
| Commute Time | Male | Female |
| Less than 5 Minutes | 0 (0.0%) | 0 (0.0%) |
| 5 to 9 Minutes | 0 (0.0%) | 0 (0.0%) |
| 10 to 14 Minutes | 7 (41.2%) | 12 (40.0%) |
| 15 to 19 Minutes | 8 (47.1%) | 8 (26.7%) |
| 20 to 24 Minutes | 0 (0.0%) | 1 (3.3%) |
| 25 to 29 Minutes | 0 (0.0%) | 0 (0.0%) |
| 30 to 34 Minutes | 0 (0.0%) | 2 (6.7%) |
| 35 to 39 Minutes | 0 (0.0%) | 0 (0.0%) |
| 40 to 44 Minutes | 0 (0.0%) | 0 (0.0%) |
| 45 to 59 Minutes | 2 (11.8%) | 7 (23.3%) |
| 60 to 89 Minutes | 0 (0.0%) | 0 (0.0%) |
| 90 or more Minutes | 0 (0.0%) | 0 (0.0%) |
Time of Departure to Work by Sex in Berwyn
The most frequent times of departure to work in Berwyn are 7:30 AM to 7:59 AM (6, 35.3%) for males and 8:00 AM to 8:29 AM (10, 33.3%) for females.
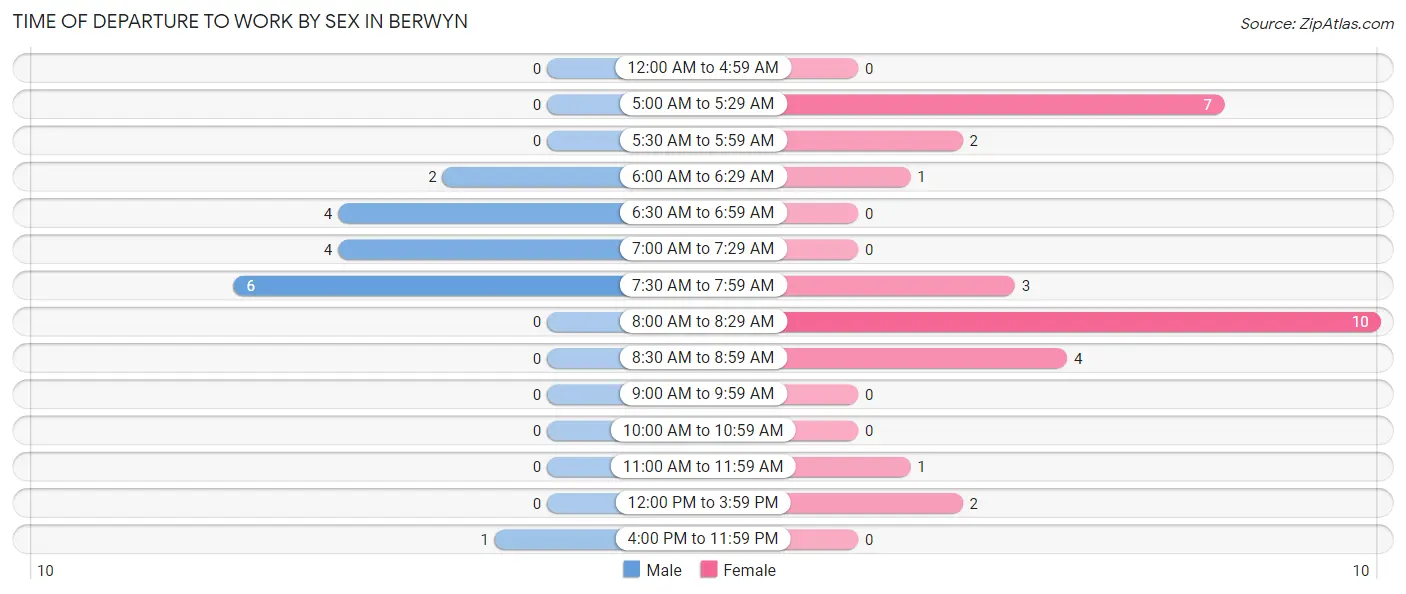
| Time of Departure | Male | Female |
| 12:00 AM to 4:59 AM | 0 (0.0%) | 0 (0.0%) |
| 5:00 AM to 5:29 AM | 0 (0.0%) | 7 (23.3%) |
| 5:30 AM to 5:59 AM | 0 (0.0%) | 2 (6.7%) |
| 6:00 AM to 6:29 AM | 2 (11.8%) | 1 (3.3%) |
| 6:30 AM to 6:59 AM | 4 (23.5%) | 0 (0.0%) |
| 7:00 AM to 7:29 AM | 4 (23.5%) | 0 (0.0%) |
| 7:30 AM to 7:59 AM | 6 (35.3%) | 3 (10.0%) |
| 8:00 AM to 8:29 AM | 0 (0.0%) | 10 (33.3%) |
| 8:30 AM to 8:59 AM | 0 (0.0%) | 4 (13.3%) |
| 9:00 AM to 9:59 AM | 0 (0.0%) | 0 (0.0%) |
| 10:00 AM to 10:59 AM | 0 (0.0%) | 0 (0.0%) |
| 11:00 AM to 11:59 AM | 0 (0.0%) | 1 (3.3%) |
| 12:00 PM to 3:59 PM | 0 (0.0%) | 2 (6.7%) |
| 4:00 PM to 11:59 PM | 1 (5.9%) | 0 (0.0%) |
| Total | 17 (100.0%) | 30 (100.0%) |
Housing Occupancy in Berwyn
Occupancy by Ownership in Berwyn
Of the total 33 dwellings in Berwyn, owner-occupied units account for 31 (93.9%), while renter-occupied units make up 2 (6.1%).
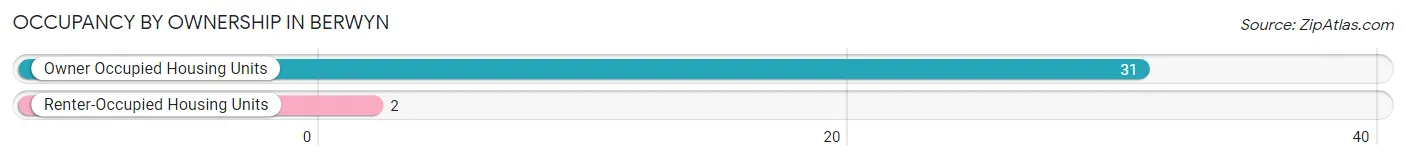
| Occupancy | # Housing Units | % Housing Units |
| Owner Occupied Housing Units | 31 | 93.9% |
| Renter-Occupied Housing Units | 2 | 6.1% |
| Total Occupied Housing Units | 33 | 100.0% |
Occupancy by Household Size in Berwyn
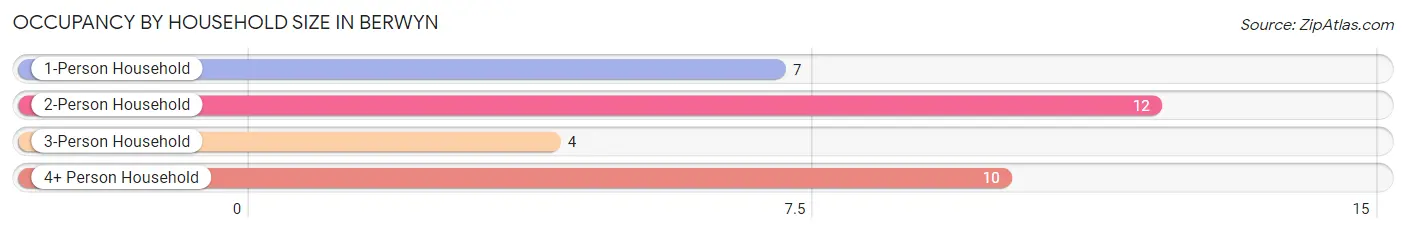
| Household Size | # Housing Units | % Housing Units |
| 1-Person Household | 7 | 21.2% |
| 2-Person Household | 12 | 36.4% |
| 3-Person Household | 4 | 12.1% |
| 4+ Person Household | 10 | 30.3% |
| Total Housing Units | 33 | 100.0% |
Occupancy by Ownership by Household Size in Berwyn
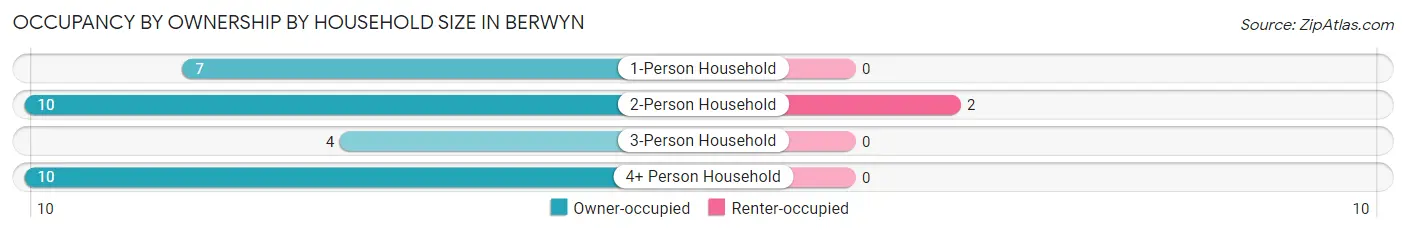
| Household Size | Owner-occupied | Renter-occupied |
| 1-Person Household | 7 (100.0%) | 0 (0.0%) |
| 2-Person Household | 10 (83.3%) | 2 (16.7%) |
| 3-Person Household | 4 (100.0%) | 0 (0.0%) |
| 4+ Person Household | 10 (100.0%) | 0 (0.0%) |
| Total Housing Units | 31 (93.9%) | 2 (6.1%) |
Occupancy by Educational Attainment in Berwyn
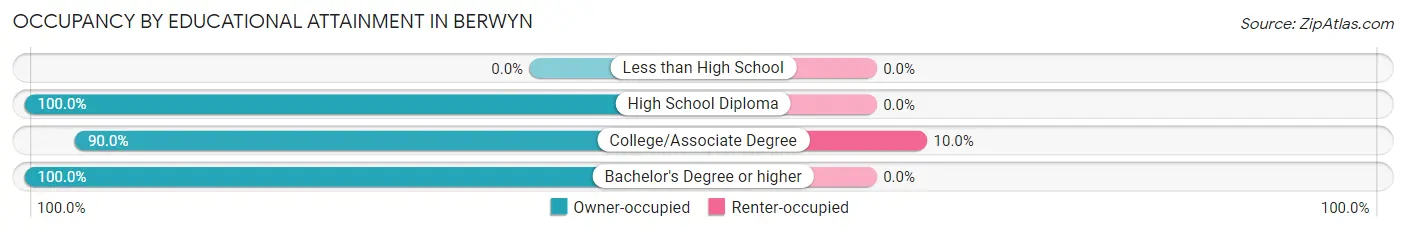
| Household Size | Owner-occupied | Renter-occupied |
| Less than High School | 0 (0.0%) | 0 (0.0%) |
| High School Diploma | 10 (100.0%) | 0 (0.0%) |
| College/Associate Degree | 18 (90.0%) | 2 (10.0%) |
| Bachelor's Degree or higher | 3 (100.0%) | 0 (0.0%) |
Occupancy by Age of Householder in Berwyn
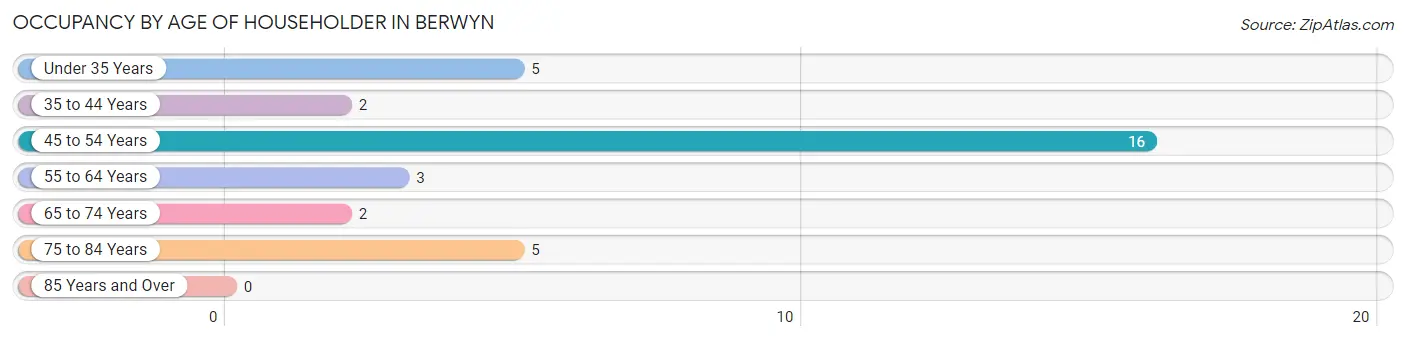
| Age Bracket | # Households | % Households |
| Under 35 Years | 5 | 15.1% |
| 35 to 44 Years | 2 | 6.1% |
| 45 to 54 Years | 16 | 48.5% |
| 55 to 64 Years | 3 | 9.1% |
| 65 to 74 Years | 2 | 6.1% |
| 75 to 84 Years | 5 | 15.1% |
| 85 Years and Over | 0 | 0.0% |
| Total | 33 | 100.0% |
Housing Finances in Berwyn
Median Income by Occupancy in Berwyn
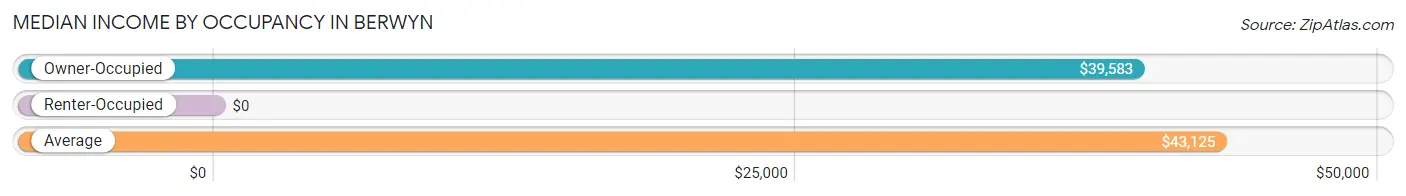
| Occupancy Type | # Households | Median Income |
| Owner-Occupied | 31 (93.9%) | $39,583 |
| Renter-Occupied | 2 (6.1%) | $0 |
| Average | 33 (100.0%) | $43,125 |
Occupancy by Householder Income Bracket in Berwyn
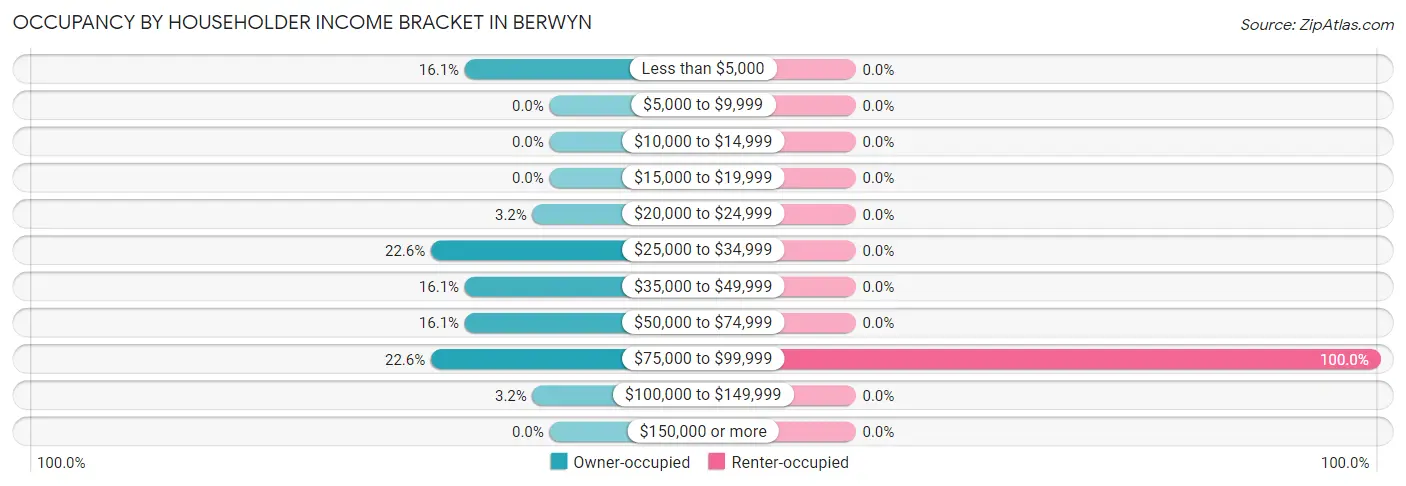
| Income Bracket | Owner-occupied | Renter-occupied |
| Less than $5,000 | 5 (16.1%) | 0 (0.0%) |
| $5,000 to $9,999 | 0 (0.0%) | 0 (0.0%) |
| $10,000 to $14,999 | 0 (0.0%) | 0 (0.0%) |
| $15,000 to $19,999 | 0 (0.0%) | 0 (0.0%) |
| $20,000 to $24,999 | 1 (3.2%) | 0 (0.0%) |
| $25,000 to $34,999 | 7 (22.6%) | 0 (0.0%) |
| $35,000 to $49,999 | 5 (16.1%) | 0 (0.0%) |
| $50,000 to $74,999 | 5 (16.1%) | 0 (0.0%) |
| $75,000 to $99,999 | 7 (22.6%) | 2 (100.0%) |
| $100,000 to $149,999 | 1 (3.2%) | 0 (0.0%) |
| $150,000 or more | 0 (0.0%) | 0 (0.0%) |
| Total | 31 (100.0%) | 2 (100.0%) |
Monthly Housing Cost Tiers in Berwyn
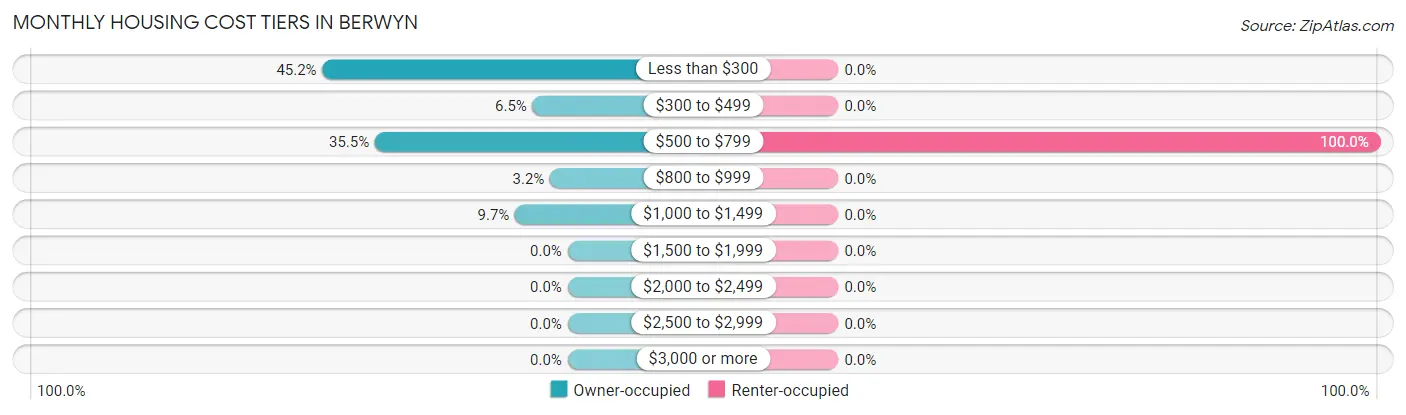
| Monthly Cost | Owner-occupied | Renter-occupied |
| Less than $300 | 14 (45.2%) | 0 (0.0%) |
| $300 to $499 | 2 (6.5%) | 0 (0.0%) |
| $500 to $799 | 11 (35.5%) | 2 (100.0%) |
| $800 to $999 | 1 (3.2%) | 0 (0.0%) |
| $1,000 to $1,499 | 3 (9.7%) | 0 (0.0%) |
| $1,500 to $1,999 | 0 (0.0%) | 0 (0.0%) |
| $2,000 to $2,499 | 0 (0.0%) | 0 (0.0%) |
| $2,500 to $2,999 | 0 (0.0%) | 0 (0.0%) |
| $3,000 or more | 0 (0.0%) | 0 (0.0%) |
| Total | 31 (100.0%) | 2 (100.0%) |
Physical Housing Characteristics in Berwyn
Housing Structures in Berwyn
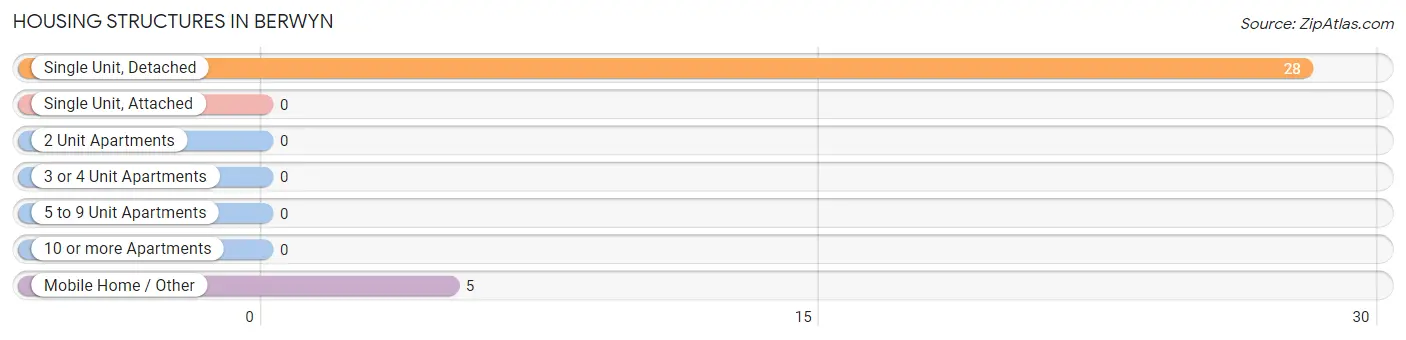
| Structure Type | # Housing Units | % Housing Units |
| Single Unit, Detached | 28 | 84.9% |
| Single Unit, Attached | 0 | 0.0% |
| 2 Unit Apartments | 0 | 0.0% |
| 3 or 4 Unit Apartments | 0 | 0.0% |
| 5 to 9 Unit Apartments | 0 | 0.0% |
| 10 or more Apartments | 0 | 0.0% |
| Mobile Home / Other | 5 | 15.1% |
| Total | 33 | 100.0% |
Housing Structures by Occupancy in Berwyn
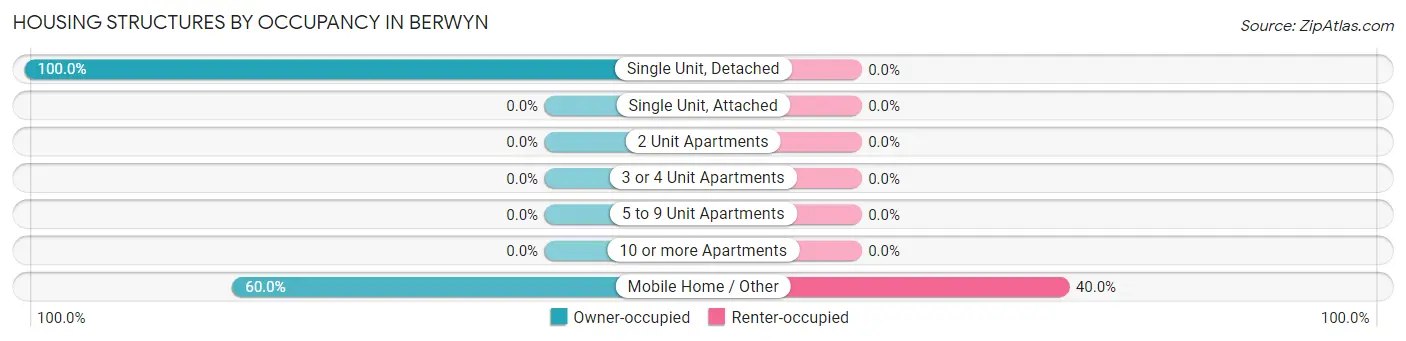
| Structure Type | Owner-occupied | Renter-occupied |
| Single Unit, Detached | 28 (100.0%) | 0 (0.0%) |
| Single Unit, Attached | 0 (0.0%) | 0 (0.0%) |
| 2 Unit Apartments | 0 (0.0%) | 0 (0.0%) |
| 3 or 4 Unit Apartments | 0 (0.0%) | 0 (0.0%) |
| 5 to 9 Unit Apartments | 0 (0.0%) | 0 (0.0%) |
| 10 or more Apartments | 0 (0.0%) | 0 (0.0%) |
| Mobile Home / Other | 3 (60.0%) | 2 (40.0%) |
| Total | 31 (93.9%) | 2 (6.1%) |
Housing Structures by Number of Rooms in Berwyn
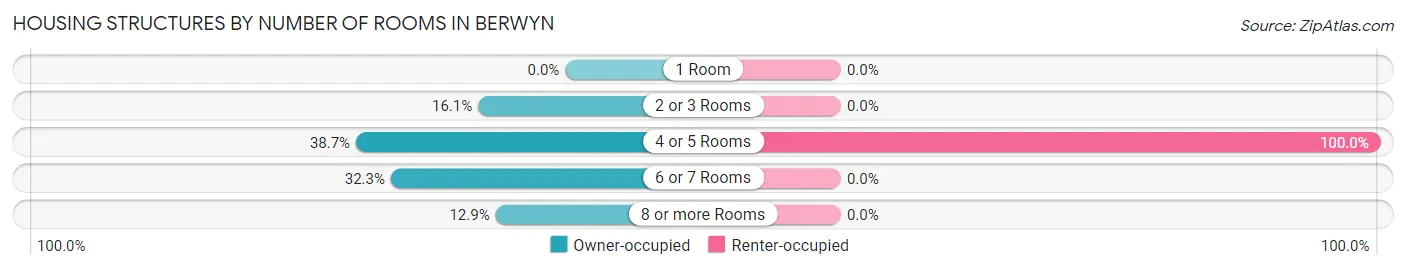
| Number of Rooms | Owner-occupied | Renter-occupied |
| 1 Room | 0 (0.0%) | 0 (0.0%) |
| 2 or 3 Rooms | 5 (16.1%) | 0 (0.0%) |
| 4 or 5 Rooms | 12 (38.7%) | 2 (100.0%) |
| 6 or 7 Rooms | 10 (32.3%) | 0 (0.0%) |
| 8 or more Rooms | 4 (12.9%) | 0 (0.0%) |
| Total | 31 (100.0%) | 2 (100.0%) |
Housing Structure by Heating Type in Berwyn
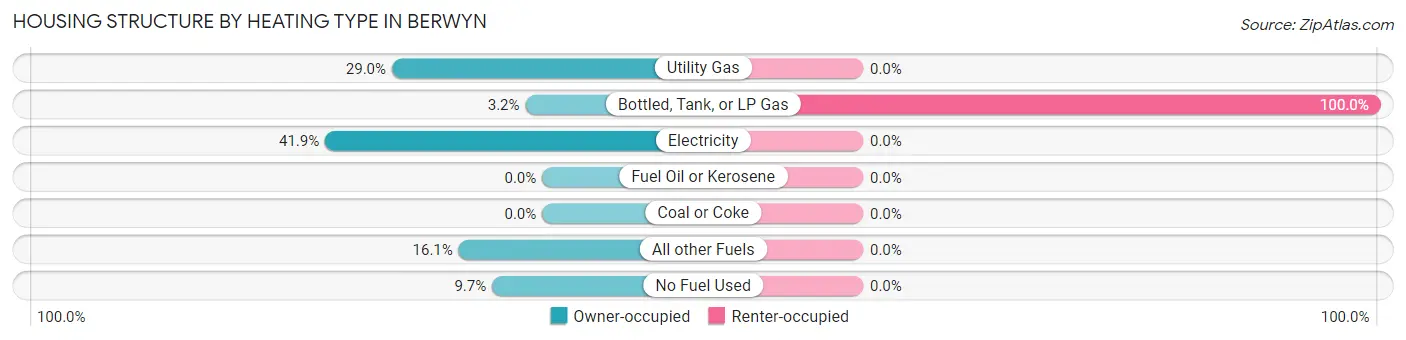
| Heating Type | Owner-occupied | Renter-occupied |
| Utility Gas | 9 (29.0%) | 0 (0.0%) |
| Bottled, Tank, or LP Gas | 1 (3.2%) | 2 (100.0%) |
| Electricity | 13 (41.9%) | 0 (0.0%) |
| Fuel Oil or Kerosene | 0 (0.0%) | 0 (0.0%) |
| Coal or Coke | 0 (0.0%) | 0 (0.0%) |
| All other Fuels | 5 (16.1%) | 0 (0.0%) |
| No Fuel Used | 3 (9.7%) | 0 (0.0%) |
| Total | 31 (100.0%) | 2 (100.0%) |
Household Vehicle Usage in Berwyn
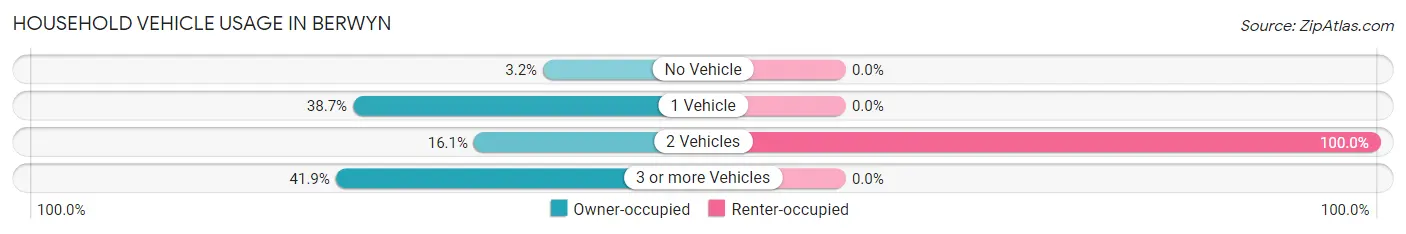
| Vehicles per Household | Owner-occupied | Renter-occupied |
| No Vehicle | 1 (3.2%) | 0 (0.0%) |
| 1 Vehicle | 12 (38.7%) | 0 (0.0%) |
| 2 Vehicles | 5 (16.1%) | 2 (100.0%) |
| 3 or more Vehicles | 13 (41.9%) | 0 (0.0%) |
| Total | 31 (100.0%) | 2 (100.0%) |
Real Estate & Mortgages in Berwyn
Real Estate and Mortgage Overview in Berwyn
| Characteristic | Without Mortgage | With Mortgage |
| Housing Units | 26 | 5 |
| Median Property Value | $57,500 | $104,200 |
| Median Household Income | $33,750 | $0 |
| Monthly Housing Costs | $293 | $0 |
| Real Estate Taxes | - | - |
Property Value by Mortgage Status in Berwyn
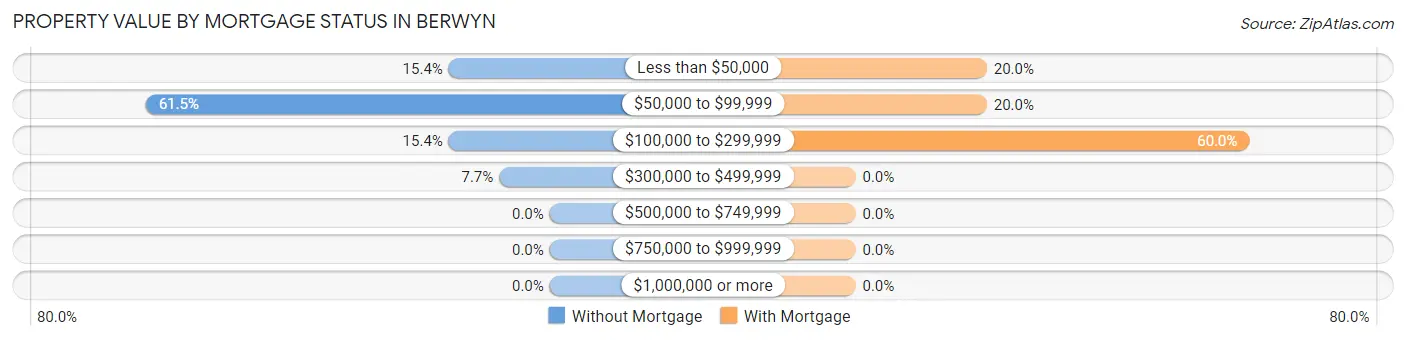
| Property Value | Without Mortgage | With Mortgage |
| Less than $50,000 | 4 (15.4%) | 1 (20.0%) |
| $50,000 to $99,999 | 16 (61.5%) | 1 (20.0%) |
| $100,000 to $299,999 | 4 (15.4%) | 3 (60.0%) |
| $300,000 to $499,999 | 2 (7.7%) | 0 (0.0%) |
| $500,000 to $749,999 | 0 (0.0%) | 0 (0.0%) |
| $750,000 to $999,999 | 0 (0.0%) | 0 (0.0%) |
| $1,000,000 or more | 0 (0.0%) | 0 (0.0%) |
| Total | 26 (100.0%) | 5 (100.0%) |
Household Income by Mortgage Status in Berwyn
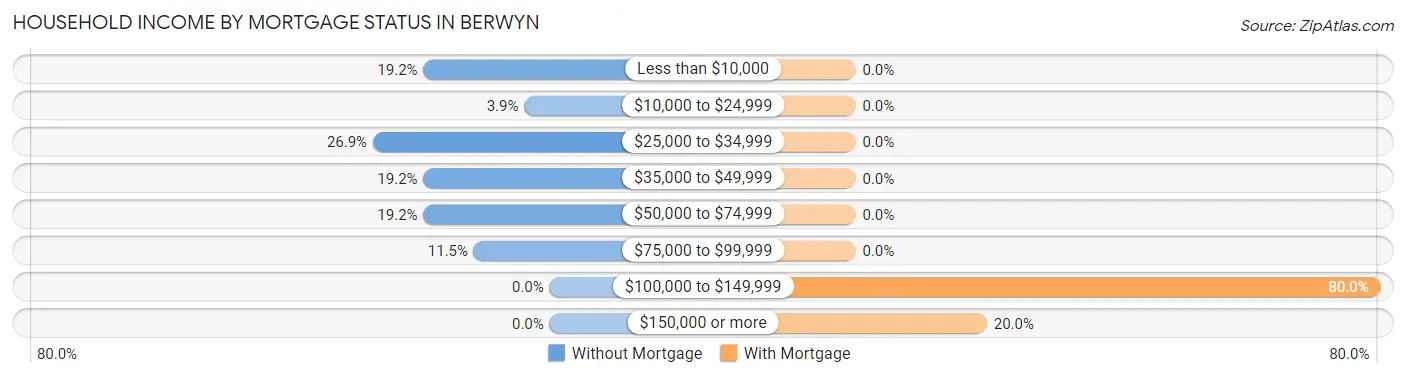
| Household Income | Without Mortgage | With Mortgage |
| Less than $10,000 | 5 (19.2%) | 0 (0.0%) |
| $10,000 to $24,999 | 1 (3.8%) | 0 (0.0%) |
| $25,000 to $34,999 | 7 (26.9%) | 0 (0.0%) |
| $35,000 to $49,999 | 5 (19.2%) | 0 (0.0%) |
| $50,000 to $74,999 | 5 (19.2%) | 0 (0.0%) |
| $75,000 to $99,999 | 3 (11.5%) | 0 (0.0%) |
| $100,000 to $149,999 | 0 (0.0%) | 4 (80.0%) |
| $150,000 or more | 0 (0.0%) | 1 (20.0%) |
| Total | 26 (100.0%) | 5 (100.0%) |
Property Value to Household Income Ratio in Berwyn
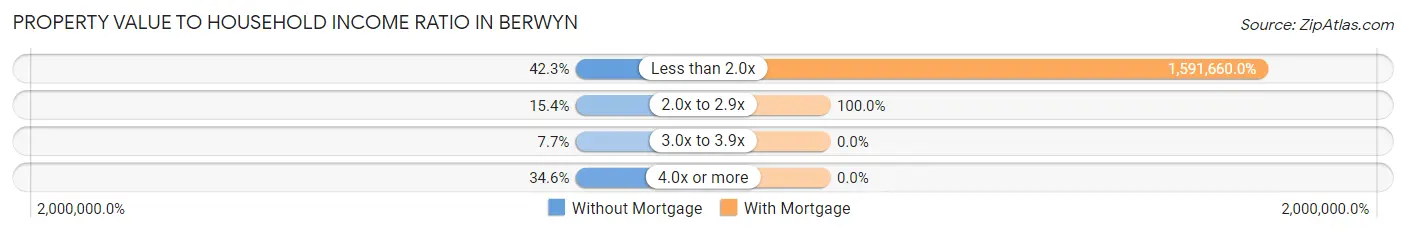
| Value-to-Income Ratio | Without Mortgage | With Mortgage |
| Less than 2.0x | 11 (42.3%) | 79,583 (1,591,660.0%) |
| 2.0x to 2.9x | 4 (15.4%) | 5 (100.0%) |
| 3.0x to 3.9x | 2 (7.7%) | 0 (0.0%) |
| 4.0x or more | 9 (34.6%) | 0 (0.0%) |
| Total | 26 (100.0%) | 5 (100.0%) |
Real Estate Taxes by Mortgage Status in Berwyn
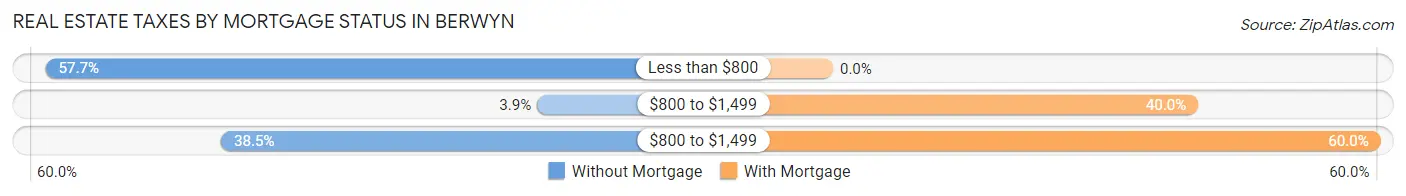
| Property Taxes | Without Mortgage | With Mortgage |
| Less than $800 | 15 (57.7%) | 0 (0.0%) |
| $800 to $1,499 | 1 (3.8%) | 2 (40.0%) |
| $800 to $1,499 | 10 (38.5%) | 3 (60.0%) |
| Total | 26 (100.0%) | 5 (100.0%) |
Health & Disability in Berwyn
Health Insurance Coverage by Age in Berwyn
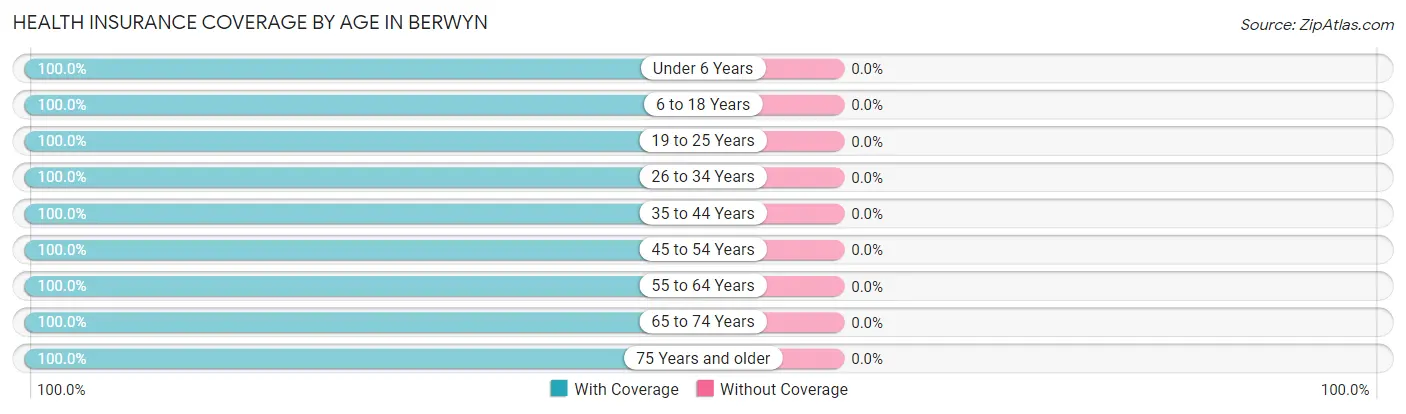
| Age Bracket | With Coverage | Without Coverage |
| Under 6 Years | 1 (100.0%) | 0 (0.0%) |
| 6 to 18 Years | 19 (100.0%) | 0 (0.0%) |
| 19 to 25 Years | 7 (100.0%) | 0 (0.0%) |
| 26 to 34 Years | 8 (100.0%) | 0 (0.0%) |
| 35 to 44 Years | 4 (100.0%) | 0 (0.0%) |
| 45 to 54 Years | 16 (100.0%) | 0 (0.0%) |
| 55 to 64 Years | 4 (100.0%) | 0 (0.0%) |
| 65 to 74 Years | 10 (100.0%) | 0 (0.0%) |
| 75 Years and older | 6 (100.0%) | 0 (0.0%) |
| Total | 75 (100.0%) | 0 (0.0%) |
Health Insurance Coverage by Citizenship Status in Berwyn

| Citizenship Status | With Coverage | Without Coverage |
| Native Born | 1 (100.0%) | 0 (0.0%) |
| Foreign Born, Citizen | 19 (100.0%) | 0 (0.0%) |
| Foreign Born, not a Citizen | 7 (100.0%) | 0 (0.0%) |
Health Insurance Coverage by Household Income in Berwyn
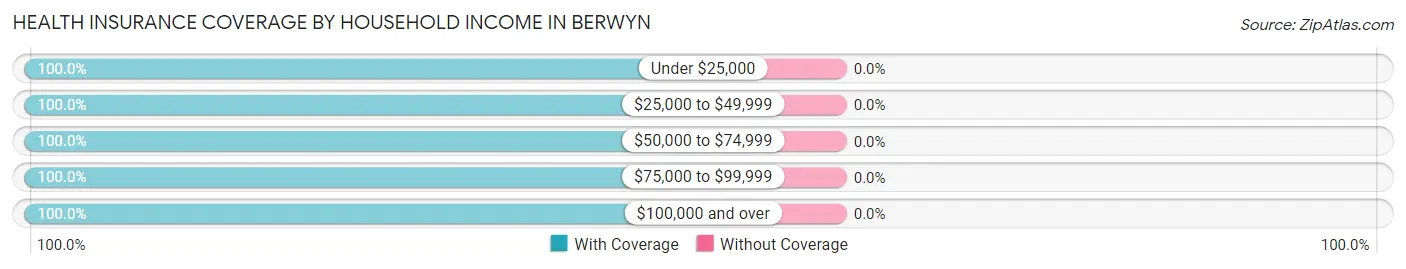
| Household Income | With Coverage | Without Coverage |
| Under $25,000 | 8 (100.0%) | 0 (0.0%) |
| $25,000 to $49,999 | 25 (100.0%) | 0 (0.0%) |
| $50,000 to $74,999 | 16 (100.0%) | 0 (0.0%) |
| $75,000 to $99,999 | 23 (100.0%) | 0 (0.0%) |
| $100,000 and over | 3 (100.0%) | 0 (0.0%) |
Public vs Private Health Insurance Coverage by Age in Berwyn
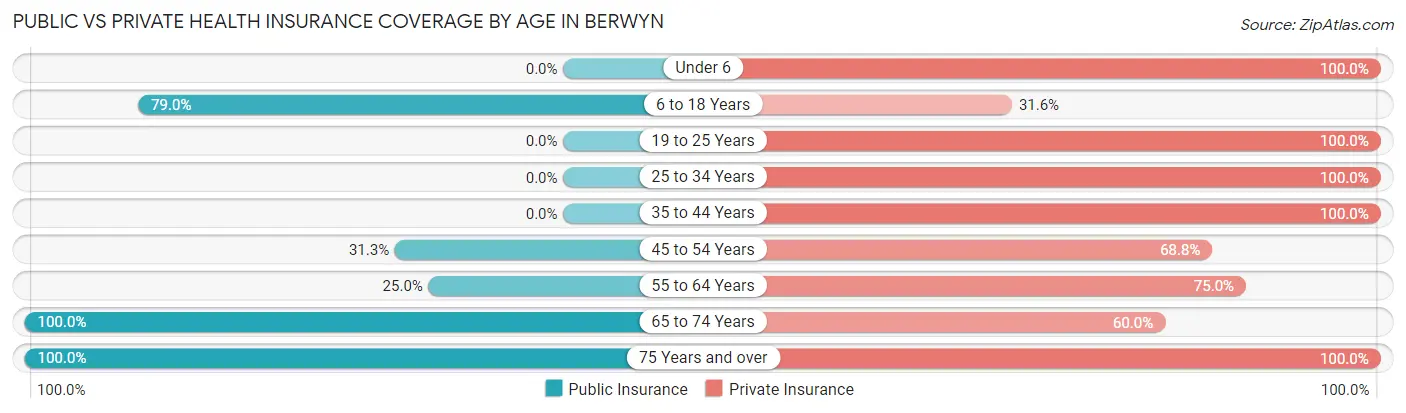
| Age Bracket | Public Insurance | Private Insurance |
| Under 6 | 0 (0.0%) | 1 (100.0%) |
| 6 to 18 Years | 15 (78.9%) | 6 (31.6%) |
| 19 to 25 Years | 0 (0.0%) | 7 (100.0%) |
| 25 to 34 Years | 0 (0.0%) | 8 (100.0%) |
| 35 to 44 Years | 0 (0.0%) | 4 (100.0%) |
| 45 to 54 Years | 5 (31.2%) | 11 (68.8%) |
| 55 to 64 Years | 1 (25.0%) | 3 (75.0%) |
| 65 to 74 Years | 10 (100.0%) | 6 (60.0%) |
| 75 Years and over | 6 (100.0%) | 6 (100.0%) |
| Total | 37 (49.3%) | 52 (69.3%) |
Disability Status by Sex by Age in Berwyn
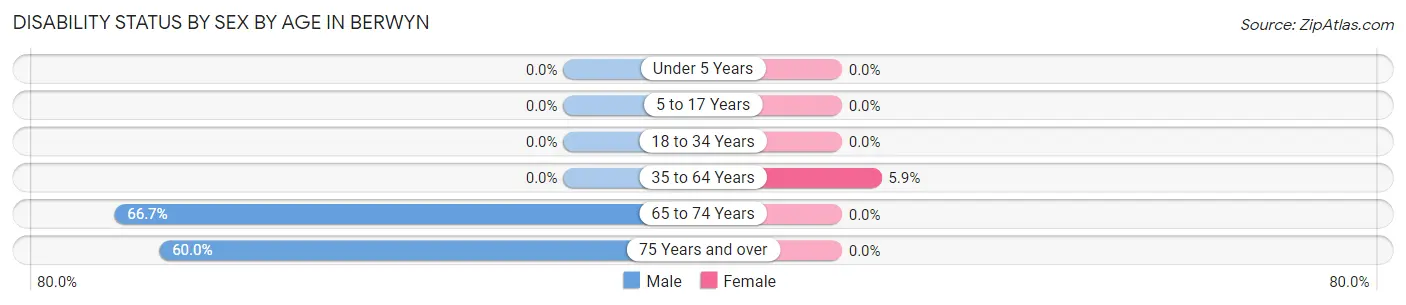
| Age Bracket | Male | Female |
| Under 5 Years | 0 (0.0%) | 0 (0.0%) |
| 5 to 17 Years | 0 (0.0%) | 0 (0.0%) |
| 18 to 34 Years | 0 (0.0%) | 0 (0.0%) |
| 35 to 64 Years | 0 (0.0%) | 1 (5.9%) |
| 65 to 74 Years | 4 (66.7%) | 0 (0.0%) |
| 75 Years and over | 3 (60.0%) | 0 (0.0%) |
Disability Class by Sex by Age in Berwyn
Disability Class: Hearing Difficulty
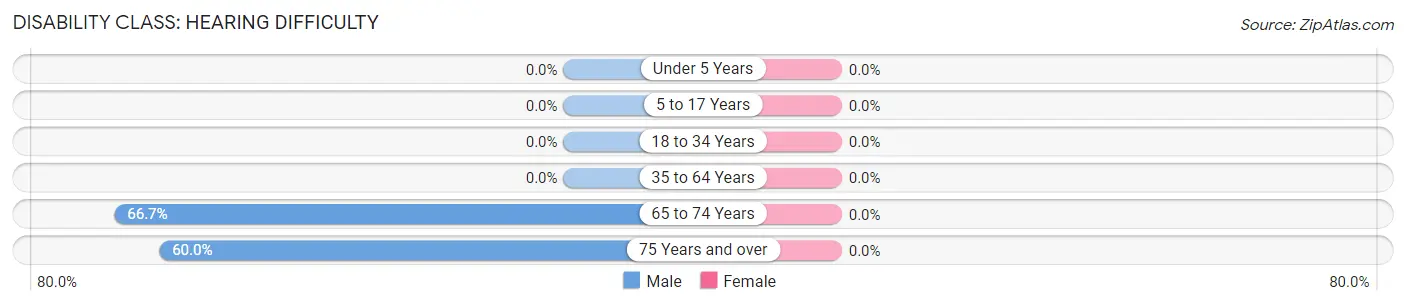
| Age Bracket | Male | Female |
| Under 5 Years | 0 (0.0%) | 0 (0.0%) |
| 5 to 17 Years | 0 (0.0%) | 0 (0.0%) |
| 18 to 34 Years | 0 (0.0%) | 0 (0.0%) |
| 35 to 64 Years | 0 (0.0%) | 0 (0.0%) |
| 65 to 74 Years | 4 (66.7%) | 0 (0.0%) |
| 75 Years and over | 3 (60.0%) | 0 (0.0%) |
Disability Class: Vision Difficulty
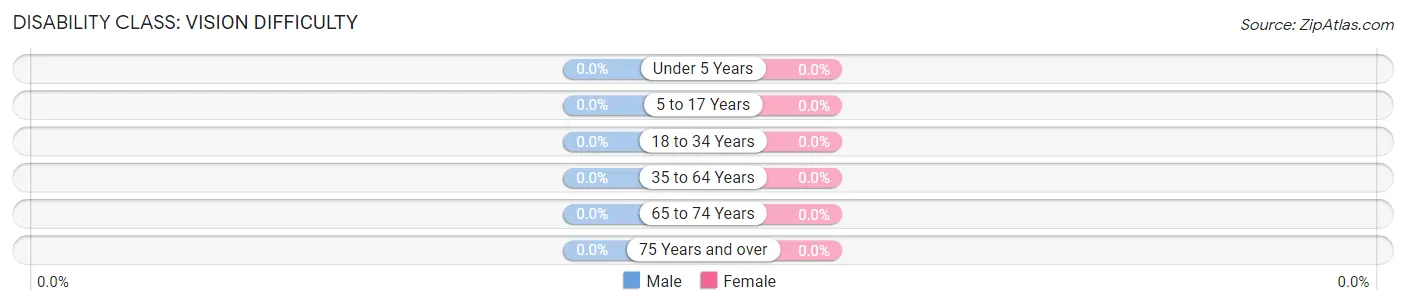
| Age Bracket | Male | Female |
| Under 5 Years | 0 (0.0%) | 0 (0.0%) |
| 5 to 17 Years | 0 (0.0%) | 0 (0.0%) |
| 18 to 34 Years | 0 (0.0%) | 0 (0.0%) |
| 35 to 64 Years | 0 (0.0%) | 0 (0.0%) |
| 65 to 74 Years | 0 (0.0%) | 0 (0.0%) |
| 75 Years and over | 0 (0.0%) | 0 (0.0%) |
Disability Class: Cognitive Difficulty
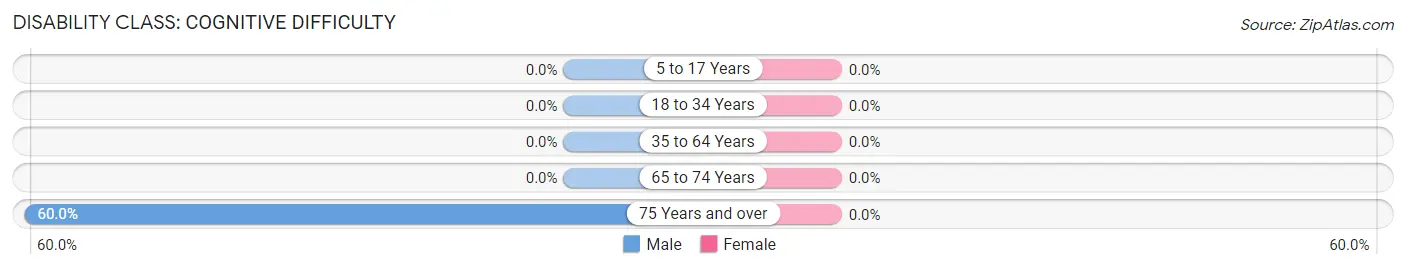
| Age Bracket | Male | Female |
| 5 to 17 Years | 0 (0.0%) | 0 (0.0%) |
| 18 to 34 Years | 0 (0.0%) | 0 (0.0%) |
| 35 to 64 Years | 0 (0.0%) | 0 (0.0%) |
| 65 to 74 Years | 0 (0.0%) | 0 (0.0%) |
| 75 Years and over | 3 (60.0%) | 0 (0.0%) |
Disability Class: Ambulatory Difficulty
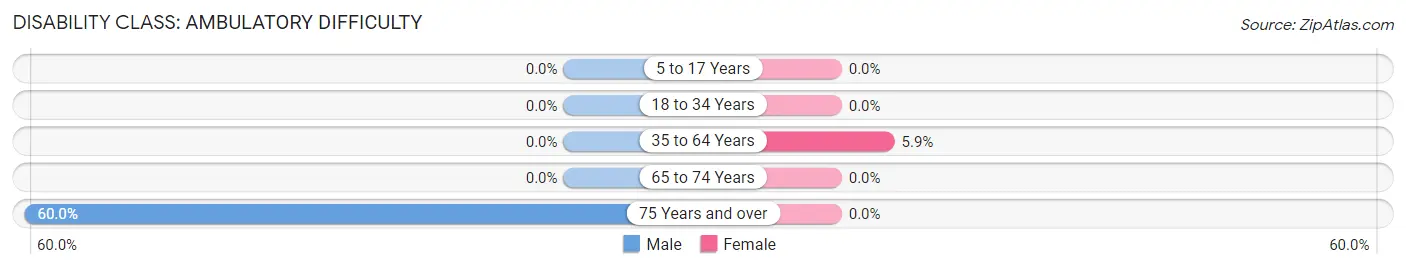
| Age Bracket | Male | Female |
| 5 to 17 Years | 0 (0.0%) | 0 (0.0%) |
| 18 to 34 Years | 0 (0.0%) | 0 (0.0%) |
| 35 to 64 Years | 0 (0.0%) | 1 (5.9%) |
| 65 to 74 Years | 0 (0.0%) | 0 (0.0%) |
| 75 Years and over | 3 (60.0%) | 0 (0.0%) |
Disability Class: Self-Care Difficulty
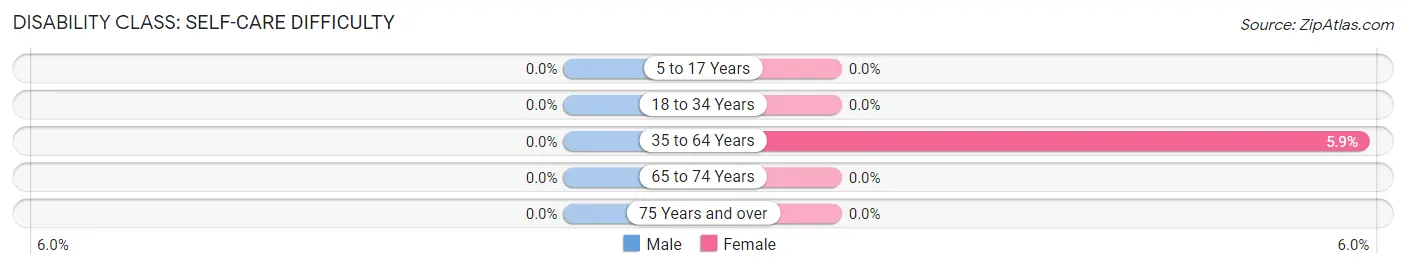
| Age Bracket | Male | Female |
| 5 to 17 Years | 0 (0.0%) | 0 (0.0%) |
| 18 to 34 Years | 0 (0.0%) | 0 (0.0%) |
| 35 to 64 Years | 0 (0.0%) | 1 (5.9%) |
| 65 to 74 Years | 0 (0.0%) | 0 (0.0%) |
| 75 Years and over | 0 (0.0%) | 0 (0.0%) |
Technology Access in Berwyn
Computing Device Access in Berwyn
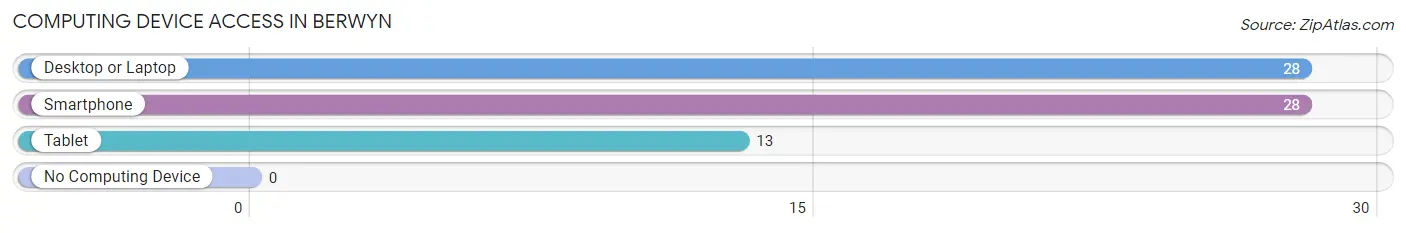
| Device Type | # Households | % Households |
| Desktop or Laptop | 28 | 84.9% |
| Smartphone | 28 | 84.9% |
| Tablet | 13 | 39.4% |
| No Computing Device | 0 | 0.0% |
| Total | 33 | 100.0% |
Internet Access in Berwyn
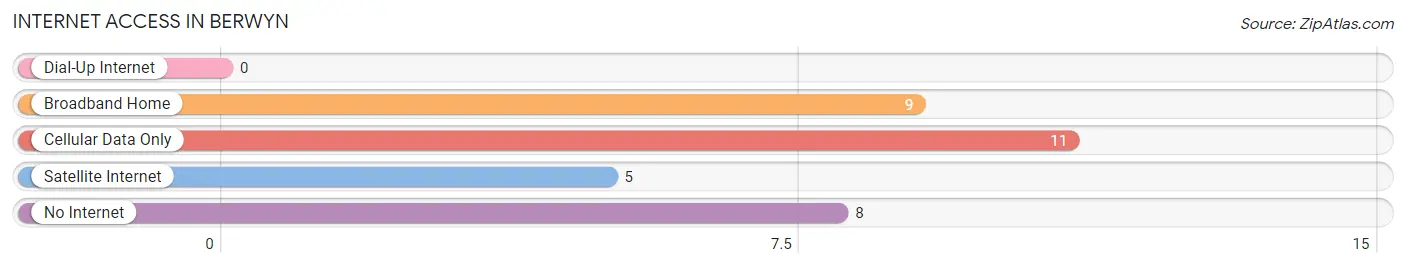
| Internet Type | # Households | % Households |
| Dial-Up Internet | 0 | 0.0% |
| Broadband Home | 9 | 27.3% |
| Cellular Data Only | 11 | 33.3% |
| Satellite Internet | 5 | 15.1% |
| No Internet | 8 | 24.2% |
| Total | 33 | 100.0% |
Berwyn Summary
Berwyn, Nebraska is a small village located in Custer County, Nebraska. It is situated in the Sandhills region of the state, and is surrounded by rolling hills and grasslands. The village has a population of approximately 200 people, and is located about 25 miles south of Broken Bow, the county seat.
History
Berwyn was founded in 1887 by a group of settlers from the nearby town of Ansley. The settlers were looking for a place to settle and start a new life, and Berwyn seemed to fit the bill. The town was named after Berwyn, Illinois, the hometown of one of the settlers.
The first settlers in Berwyn were mostly farmers and ranchers, and the town quickly grew to become a thriving agricultural community. The town was incorporated in 1891, and the first post office was established in 1892.
In the early 1900s, Berwyn was a bustling little town with a population of over 500 people. The town had a bank, a hotel, a general store, a blacksmith shop, a livery stable, and several other businesses.
The town also had a school, which was built in 1901. The school was a one-room schoolhouse, and it served the students of Berwyn until it was closed in the 1950s.
Geography
Berwyn is located in the Sandhills region of Nebraska, and is surrounded by rolling hills and grasslands. The town is situated in the middle of Custer County, and is about 25 miles south of Broken Bow, the county seat.
The town is located at an elevation of 2,400 feet, and has an average annual temperature of 54 degrees Fahrenheit. The town receives an average of 20 inches of precipitation each year, and has an average of 150 days of sunshine each year.
Economy
The economy of Berwyn is largely based on agriculture. The town is home to several farms and ranches, and the surrounding area is used for grazing cattle and growing crops.
The town also has a few small businesses, including a general store, a gas station, and a restaurant. The town also has a post office, and a few other small businesses.
Demographics
As of the 2010 census, the population of Berwyn was 200 people. The town is predominantly white, with 95.5% of the population being white. The median household income in Berwyn is $37,500, and the median age is 44.
Conclusion
Berwyn, Nebraska is a small village located in Custer County, Nebraska. It is situated in the Sandhills region of the state, and is surrounded by rolling hills and grasslands. The village has a population of approximately 200 people, and is located about 25 miles south of Broken Bow, the county seat. The economy of Berwyn is largely based on agriculture, and the town is home to several farms and ranches. The town also has a few small businesses, including a general store, a gas station, and a restaurant. The town is predominantly white, with 95.5% of the population being white. The median household income in Berwyn is $37,500, and the median age is 44.
Common Questions
What is Per Capita Income in Berwyn?
Per Capita income in Berwyn is $23,332.
What is the Median Family Income in Berwyn?
Median Family Income in Berwyn is $60,000.
What is the Median Household income in Berwyn?
Median Household Income in Berwyn is $43,125.
What is Inequality or Gini Index in Berwyn?
Inequality or Gini Index in Berwyn is 0.35.
What is the Total Population of Berwyn?
Total Population of Berwyn is 75.
What is the Total Male Population of Berwyn?
Total Male Population of Berwyn is 29.
What is the Total Female Population of Berwyn?
Total Female Population of Berwyn is 46.
What is the Ratio of Males per 100 Females in Berwyn?
There are 63.04 Males per 100 Females in Berwyn.
What is the Ratio of Females per 100 Males in Berwyn?
There are 158.62 Females per 100 Males in Berwyn.
What is the Median Population Age in Berwyn?
Median Population Age in Berwyn is 42.3 Years.
What is the Average Family Size in Berwyn
Average Family Size in Berwyn is 2.6 People.
What is the Average Household Size in Berwyn
Average Household Size in Berwyn is 2.3 People.
How Large is the Labor Force in Berwyn?
There are 48 People in the Labor Forcein in Berwyn.
What is the Percentage of People in the Labor Force in Berwyn?
70.6% of People are in the Labor Force in Berwyn.