Chisholm, ME Map & Demographics
Chisholm Map
Chisholm Overview
$31,115
PER CAPITA INCOME
$90,938
AVG FAMILY INCOME
$58,750
AVG HOUSEHOLD INCOME
6.8%
WAGE / INCOME GAP [ % ]
93.2¢/ $1
WAGE / INCOME GAP [ $ ]
0.33
INEQUALITY / GINI INDEX
1,074
TOTAL POPULATION
591
MALE POPULATION
483
FEMALE POPULATION
122.36
MALES / 100 FEMALES
81.73
FEMALES / 100 MALES
48.3
MEDIAN AGE
3.6
AVG FAMILY SIZE
2.7
AVG HOUSEHOLD SIZE
790
LABOR FORCE [ PEOPLE ]
75.0%
PERCENT IN LABOR FORCE
6.3%
UNEMPLOYMENT RATE
Income in Chisholm
Income Overview in Chisholm
Per Capita Income in Chisholm is $31,115, while median incomes of families and households are $90,938 and $58,750 respectively.
| Characteristic | Number | Measure |
| Per Capita Income | 1,074 | $31,115 |
| Median Family Income | 233 | $90,938 |
| Mean Family Income | 233 | $88,783 |
| Median Household Income | 393 | $58,750 |
| Mean Household Income | 393 | $72,141 |
| Income Deficit | 233 | $0 |
| Wage / Income Gap (%) | 1,074 | 6.85% |
| Wage / Income Gap ($) | 1,074 | 93.15¢ per $1 |
| Gini / Inequality Index | 1,074 | 0.33 |
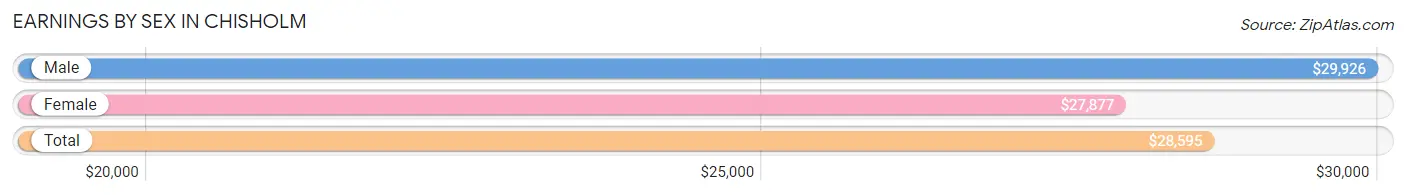
Earnings by Sex in Chisholm
Average Earnings in Chisholm are $28,595, $29,926 for men and $27,877 for women, a difference of 6.9%.
| Sex | Number | Average Earnings |
| Male | 462 (56.2%) | $29,926 |
| Female | 360 (43.8%) | $27,877 |
| Total | 822 (100.0%) | $28,595 |
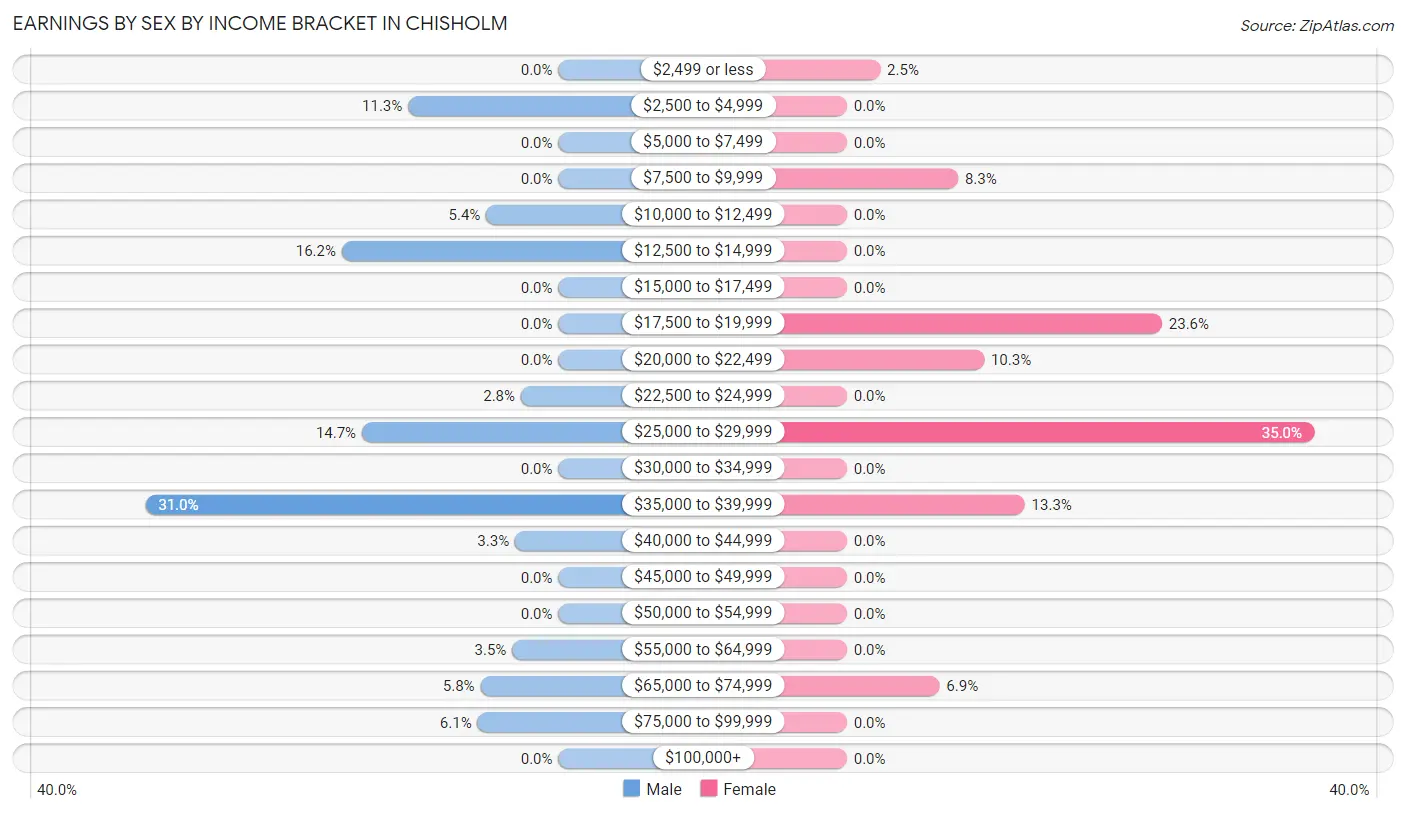
Earnings by Sex by Income Bracket in Chisholm
The most common earnings brackets in Chisholm are $35,000 to $39,999 for men (143 | 30.9%) and $25,000 to $29,999 for women (126 | 35.0%).
| Income | Male | Female |
| $2,499 or less | 0 (0.0%) | 9 (2.5%) |
| $2,500 to $4,999 | 52 (11.3%) | 0 (0.0%) |
| $5,000 to $7,499 | 0 (0.0%) | 0 (0.0%) |
| $7,500 to $9,999 | 0 (0.0%) | 30 (8.3%) |
| $10,000 to $12,499 | 25 (5.4%) | 0 (0.0%) |
| $12,500 to $14,999 | 75 (16.2%) | 0 (0.0%) |
| $15,000 to $17,499 | 0 (0.0%) | 0 (0.0%) |
| $17,500 to $19,999 | 0 (0.0%) | 85 (23.6%) |
| $20,000 to $22,499 | 0 (0.0%) | 37 (10.3%) |
| $22,500 to $24,999 | 13 (2.8%) | 0 (0.0%) |
| $25,000 to $29,999 | 68 (14.7%) | 126 (35.0%) |
| $30,000 to $34,999 | 0 (0.0%) | 0 (0.0%) |
| $35,000 to $39,999 | 143 (30.9%) | 48 (13.3%) |
| $40,000 to $44,999 | 15 (3.3%) | 0 (0.0%) |
| $45,000 to $49,999 | 0 (0.0%) | 0 (0.0%) |
| $50,000 to $54,999 | 0 (0.0%) | 0 (0.0%) |
| $55,000 to $64,999 | 16 (3.5%) | 0 (0.0%) |
| $65,000 to $74,999 | 27 (5.8%) | 25 (6.9%) |
| $75,000 to $99,999 | 28 (6.1%) | 0 (0.0%) |
| $100,000+ | 0 (0.0%) | 0 (0.0%) |
| Total | 462 (100.0%) | 360 (100.0%) |
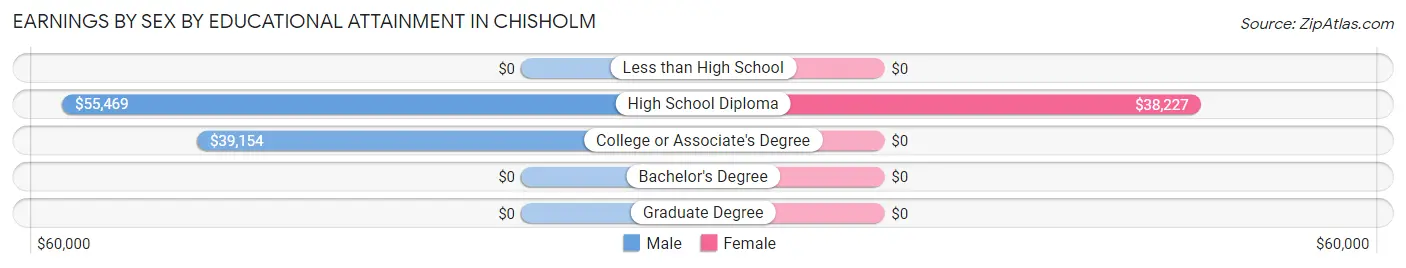
Earnings by Sex by Educational Attainment in Chisholm
Average earnings in Chisholm are $38,794 for men and $29,157 for women, a difference of 24.8%. Men with an educational attainment of high school diploma enjoy the highest average annual earnings of $55,469, while those with college or associate's degree education earn the least with $39,154. Women with an educational attainment of high school diploma earn the most with the average annual earnings of $38,227, while those with high school diploma education have the smallest earnings of $38,227.
| Educational Attainment | Male Income | Female Income |
| Less than High School | - | - |
| High School Diploma | $55,469 | $38,227 |
| College or Associate's Degree | $39,154 | $0 |
| Bachelor's Degree | - | - |
| Graduate Degree | - | - |
| Total | $38,794 | $29,157 |
Family Income in Chisholm
Family Income Brackets in Chisholm
According to the Chisholm family income data, there are 85 families falling into the $50,000 to $74,999 income range, which is the most common income bracket and makes up 36.5% of all families.
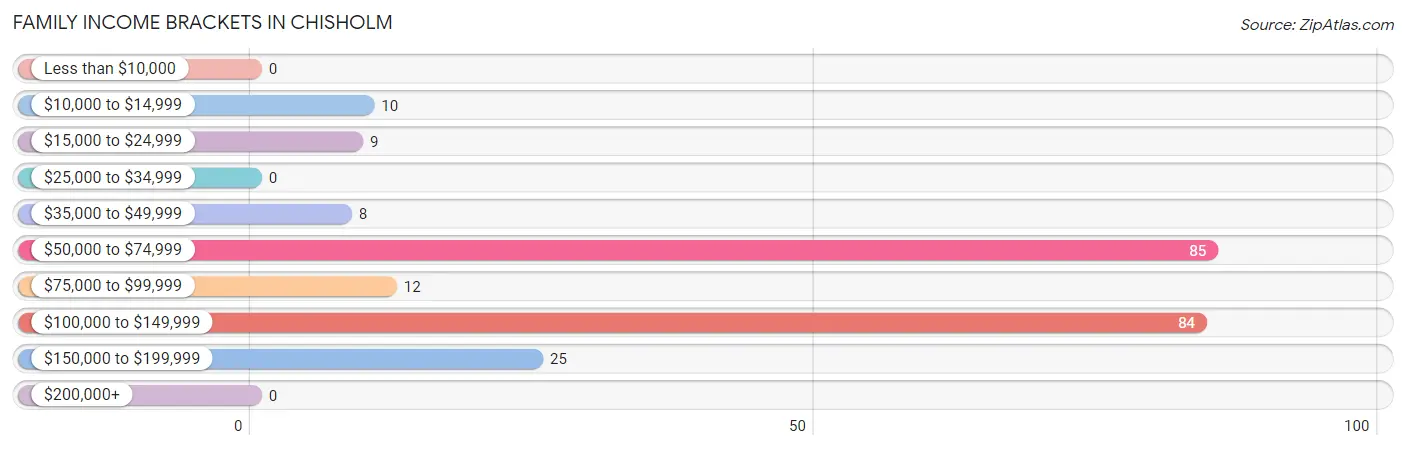
| Income Bracket | # Families | % Families |
| Less than $10,000 | 0 | 0.0% |
| $10,000 to $14,999 | 10 | 4.3% |
| $15,000 to $24,999 | 9 | 3.9% |
| $25,000 to $34,999 | 0 | 0.0% |
| $35,000 to $49,999 | 8 | 3.4% |
| $50,000 to $74,999 | 85 | 36.5% |
| $75,000 to $99,999 | 12 | 5.2% |
| $100,000 to $149,999 | 84 | 36.1% |
| $150,000 to $199,999 | 25 | 10.7% |
| $200,000+ | 0 | 0.0% |
Family Income by Famaliy Size in Chisholm
2-person families (116 | 49.8%) account for the highest median family income in Chisholm with $56,639 per family, while 2-person families (116 | 49.8%) have the highest median income of $28,320 per family member.
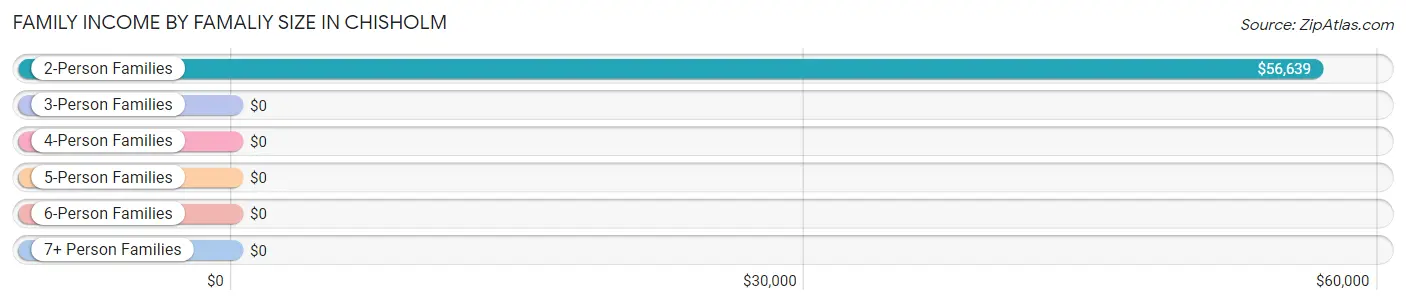
| Income Bracket | # Families | Median Income |
| 2-Person Families | 116 (49.8%) | $56,639 |
| 3-Person Families | 17 (7.3%) | $0 |
| 4-Person Families | 100 (42.9%) | $0 |
| 5-Person Families | 0 (0.0%) | $0 |
| 6-Person Families | 0 (0.0%) | $0 |
| 7+ Person Families | 0 (0.0%) | $0 |
| Total | 233 (100.0%) | $90,938 |
Family Income by Number of Earners in Chisholm
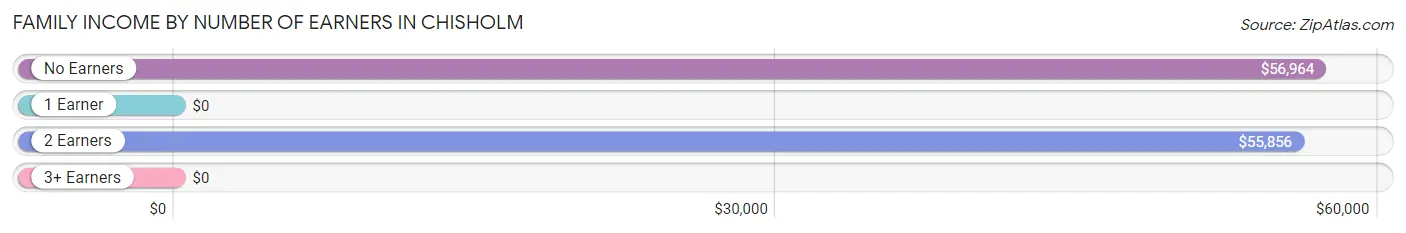
| Number of Earners | # Families | Median Income |
| No Earners | 47 (20.2%) | $56,964 |
| 1 Earner | 15 (6.4%) | $0 |
| 2 Earners | 71 (30.5%) | $55,856 |
| 3+ Earners | 100 (42.9%) | $0 |
| Total | 233 (100.0%) | $90,938 |
Household Income in Chisholm
Household Income Brackets in Chisholm
With 173 households falling in the category, the $50,000 to $74,999 income range is the most frequent in Chisholm, accounting for 44.0% of all households.
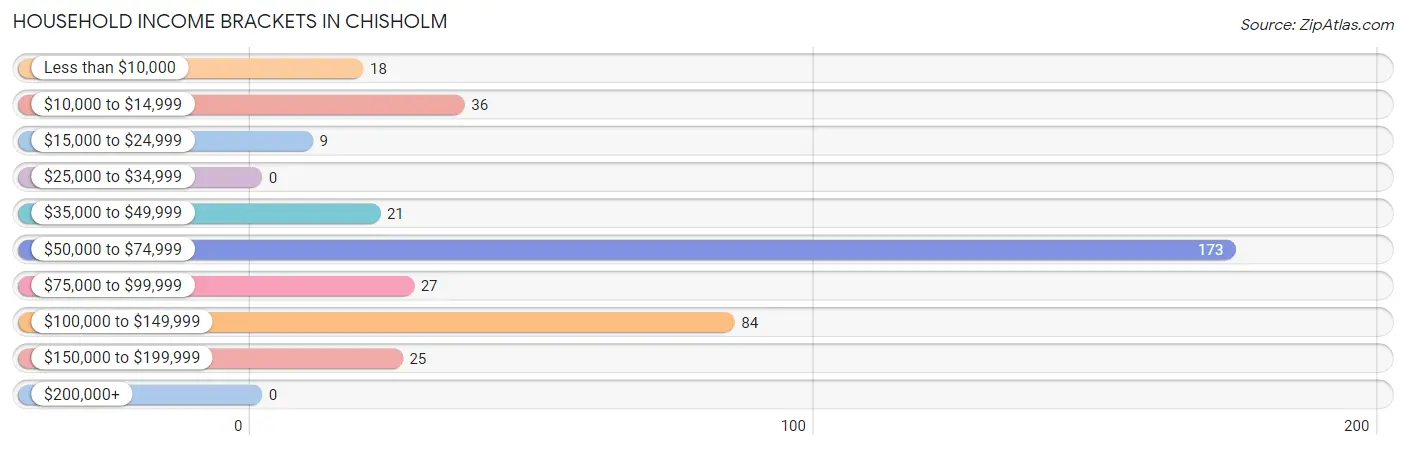
| Income Bracket | # Households | % Households |
| Less than $10,000 | 18 | 4.6% |
| $10,000 to $14,999 | 36 | 9.2% |
| $15,000 to $24,999 | 9 | 2.3% |
| $25,000 to $34,999 | 0 | 0.0% |
| $35,000 to $49,999 | 21 | 5.3% |
| $50,000 to $74,999 | 173 | 44.0% |
| $75,000 to $99,999 | 27 | 6.9% |
| $100,000 to $149,999 | 84 | 21.4% |
| $150,000 to $199,999 | 25 | 6.4% |
| $200,000+ | 0 | 0.0% |
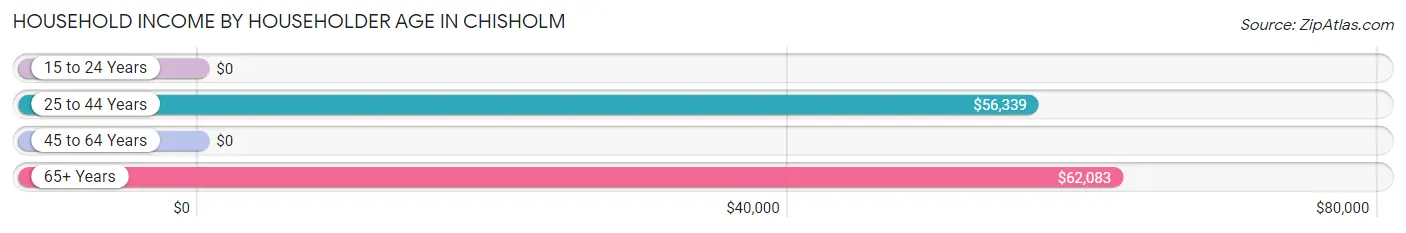
Household Income by Householder Age in Chisholm
The median household income in Chisholm is $58,750, with the highest median household income of $62,083 found in the 65+ years age bracket for the primary householder. A total of 112 households (28.5%) fall into this category. Meanwhile, the 15 to 24 years age bracket for the primary householder has the lowest median household income of $0, with 80 households (20.4%) in this group.
| Income Bracket | # Households | Median Income |
| 15 to 24 Years | 80 (20.4%) | $0 |
| 25 to 44 Years | 119 (30.3%) | $56,339 |
| 45 to 64 Years | 82 (20.9%) | $0 |
| 65+ Years | 112 (28.5%) | $62,083 |
| Total | 393 (100.0%) | $58,750 |
Poverty in Chisholm
Income Below Poverty by Sex and Age in Chisholm
With 6.7% poverty level for males and 15.9% for females among the residents of Chisholm, 35 to 44 year old males and 35 to 44 year old females are the most vulnerable to poverty, with 9 males (100.0%) and 9 females (100.0%) in their respective age groups living below the poverty level.
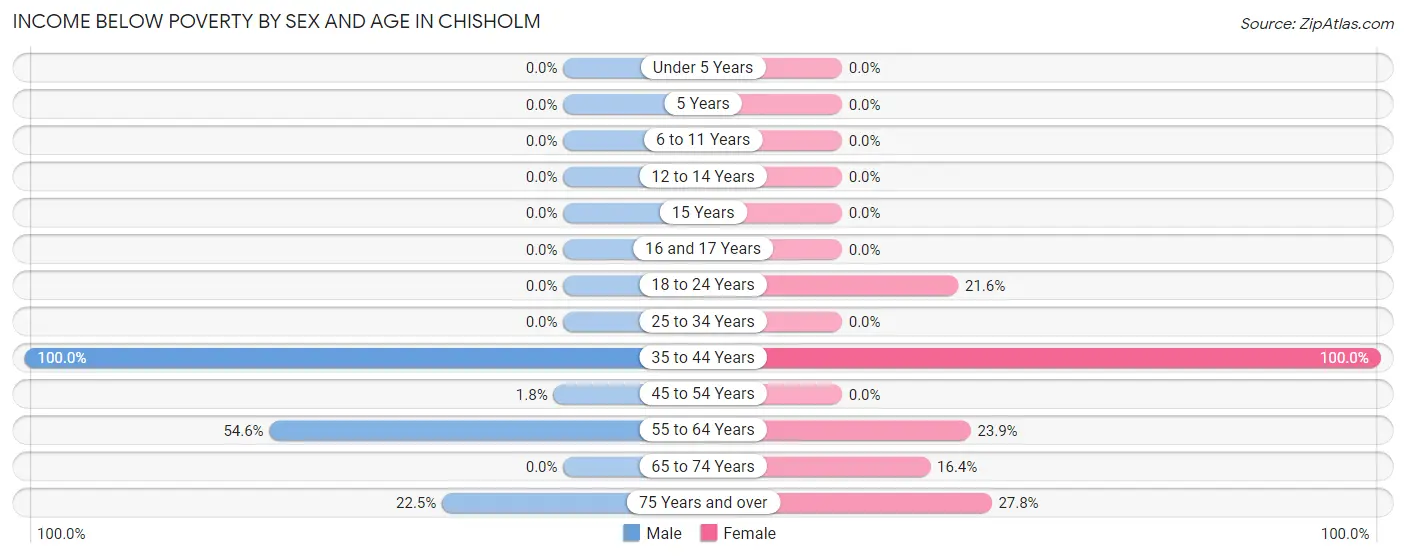
| Age Bracket | Male | Female |
| Under 5 Years | 0 (0.0%) | 0 (0.0%) |
| 5 Years | 0 (0.0%) | 0 (0.0%) |
| 6 to 11 Years | 0 (0.0%) | 0 (0.0%) |
| 12 to 14 Years | 0 (0.0%) | 0 (0.0%) |
| 15 Years | 0 (0.0%) | 0 (0.0%) |
| 16 and 17 Years | 0 (0.0%) | 0 (0.0%) |
| 18 to 24 Years | 0 (0.0%) | 30 (21.6%) |
| 25 to 34 Years | 0 (0.0%) | 0 (0.0%) |
| 35 to 44 Years | 9 (100.0%) | 9 (100.0%) |
| 45 to 54 Years | 3 (1.8%) | 0 (0.0%) |
| 55 to 64 Years | 18 (54.5%) | 16 (23.9%) |
| 65 to 74 Years | 0 (0.0%) | 10 (16.4%) |
| 75 Years and over | 9 (22.5%) | 10 (27.8%) |
| Total | 39 (6.7%) | 75 (15.9%) |
Income Above Poverty by Sex and Age in Chisholm
According to the poverty statistics in Chisholm, males aged 18 to 24 years and females aged 25 to 34 years are the age groups that are most secure financially, with 100.0% of males and 100.0% of females in these age groups living above the poverty line.
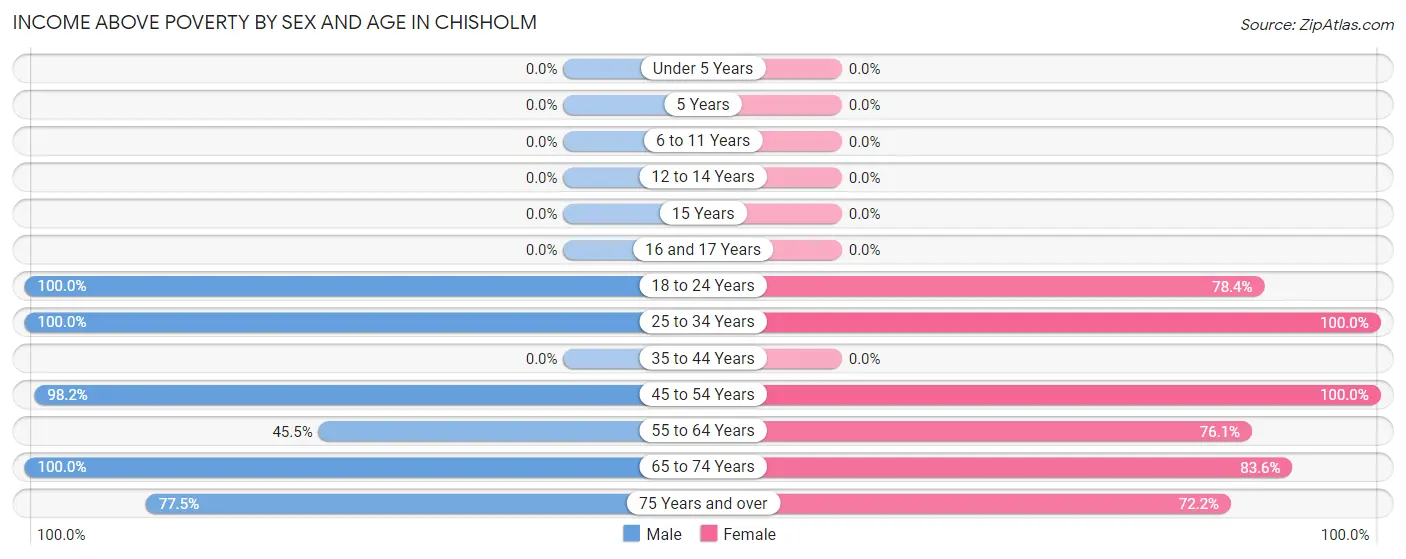
| Age Bracket | Male | Female |
| Under 5 Years | 0 (0.0%) | 0 (0.0%) |
| 5 Years | 0 (0.0%) | 0 (0.0%) |
| 6 to 11 Years | 0 (0.0%) | 0 (0.0%) |
| 12 to 14 Years | 0 (0.0%) | 0 (0.0%) |
| 15 Years | 0 (0.0%) | 0 (0.0%) |
| 16 and 17 Years | 0 (0.0%) | 0 (0.0%) |
| 18 to 24 Years | 152 (100.0%) | 109 (78.4%) |
| 25 to 34 Years | 142 (100.0%) | 10 (100.0%) |
| 35 to 44 Years | 0 (0.0%) | 0 (0.0%) |
| 45 to 54 Years | 161 (98.2%) | 151 (100.0%) |
| 55 to 64 Years | 15 (45.5%) | 51 (76.1%) |
| 65 to 74 Years | 40 (100.0%) | 51 (83.6%) |
| 75 Years and over | 31 (77.5%) | 26 (72.2%) |
| Total | 541 (93.3%) | 398 (84.1%) |
Income Below Poverty Among Married-Couple Families in Chisholm
The poverty statistics for married-couple families in Chisholm show that 8.4% or 19 of the total 225 families live below the poverty line. Families with no children have the highest poverty rate of 8.4%, comprising of 19 families. On the other hand, families with no children have the lowest poverty rate of 8.4%, which includes 19 families.
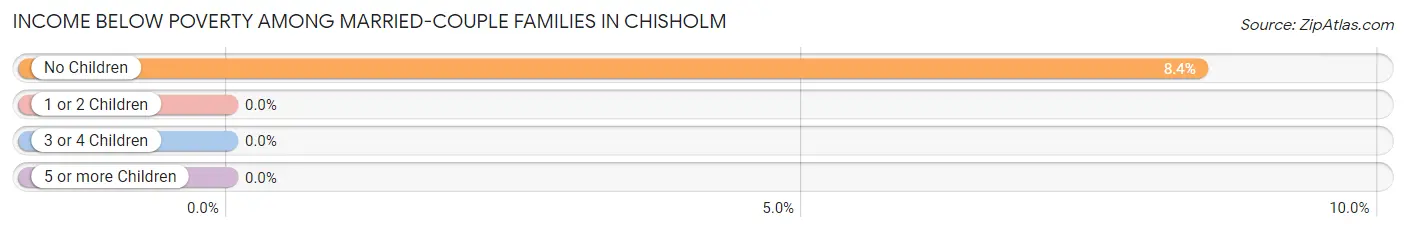
| Children | Above Poverty | Below Poverty |
| No Children | 206 (91.6%) | 19 (8.4%) |
| 1 or 2 Children | 0 (0.0%) | 0 (0.0%) |
| 3 or 4 Children | 0 (0.0%) | 0 (0.0%) |
| 5 or more Children | 0 (0.0%) | 0 (0.0%) |
| Total | 206 (91.6%) | 19 (8.4%) |
Income Below Poverty Among Single-Parent Households in Chisholm
| Children | Single Father | Single Mother |
| No Children | 0 (0.0%) | 0 (0.0%) |
| 1 or 2 Children | 0 (0.0%) | 0 (0.0%) |
| 3 or 4 Children | 0 (0.0%) | 0 (0.0%) |
| 5 or more Children | 0 (0.0%) | 0 (0.0%) |
| Total | 0 (0.0%) | 0 (0.0%) |
Income Below Poverty Among Married-Couple vs Single-Parent Households in Chisholm
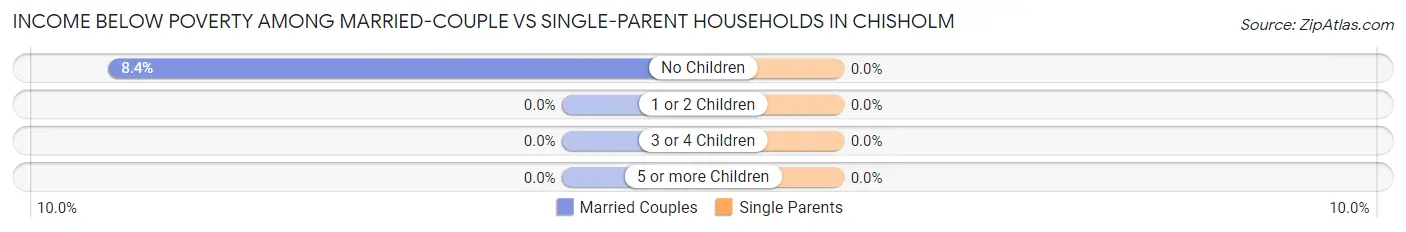
| Children | Married-Couple Families | Single-Parent Households |
| No Children | 19 (8.4%) | 0 (0.0%) |
| 1 or 2 Children | 0 (0.0%) | 0 (0.0%) |
| 3 or 4 Children | 0 (0.0%) | 0 (0.0%) |
| 5 or more Children | 0 (0.0%) | 0 (0.0%) |
| Total | 19 (8.4%) | 0 (0.0%) |
Race in Chisholm
The most populous races in Chisholm are White / Caucasian (1,032 | 96.1%), Two or more Races (35 | 3.3%), and Asian (7 | 0.6%).
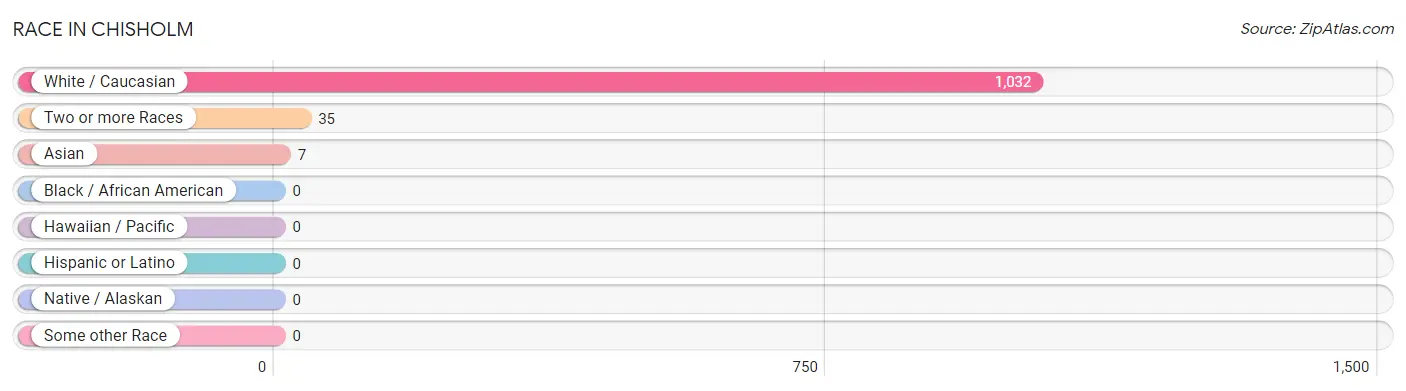
| Race | # Population | % Population |
| Asian | 7 | 0.6% |
| Black / African American | 0 | 0.0% |
| Hawaiian / Pacific | 0 | 0.0% |
| Hispanic or Latino | 0 | 0.0% |
| Native / Alaskan | 0 | 0.0% |
| White / Caucasian | 1,032 | 96.1% |
| Two or more Races | 35 | 3.3% |
| Some other Race | 0 | 0.0% |
| Total | 1,074 | 100.0% |
Ancestry in Chisholm
The most populous ancestries reported in Chisholm are American (199 | 18.5%), English (148 | 13.8%), French Canadian (123 | 11.5%), German (79 | 7.4%), and Italian (64 | 6.0%), together accounting for 57.1% of all Chisholm residents.
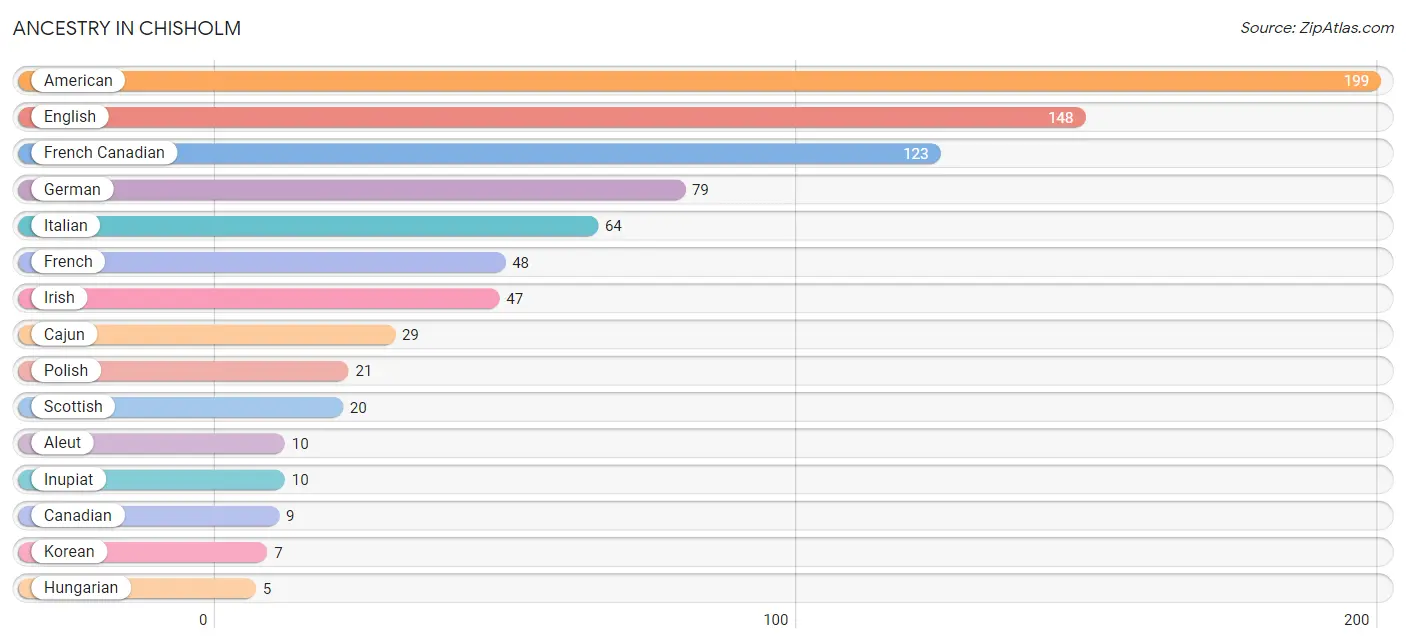
| Ancestry | # Population | % Population |
| Aleut | 10 | 0.9% |
| American | 199 | 18.5% |
| Cajun | 29 | 2.7% |
| Canadian | 9 | 0.8% |
| English | 148 | 13.8% |
| French | 48 | 4.5% |
| French American Indian | 3 | 0.3% |
| French Canadian | 123 | 11.5% |
| German | 79 | 7.4% |
| Hungarian | 5 | 0.5% |
| Inupiat | 10 | 0.9% |
| Irish | 47 | 4.4% |
| Italian | 64 | 6.0% |
| Korean | 7 | 0.6% |
| Polish | 21 | 2.0% |
| Scottish | 20 | 1.9% | View All 16 Rows |
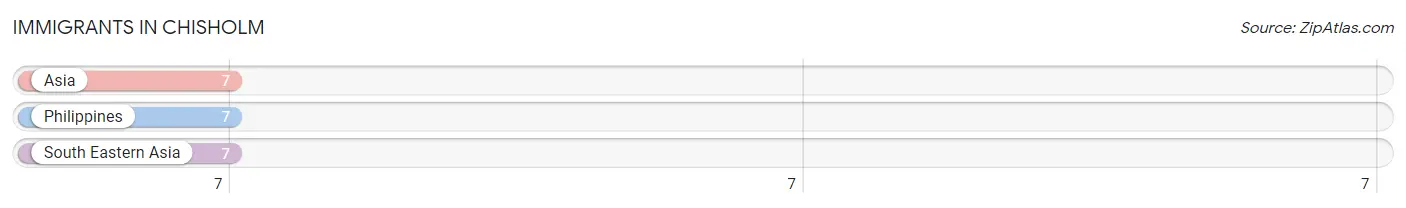
Immigrants in Chisholm
The most numerous immigrant groups reported in Chisholm came from Asia (7 | 0.6%), Philippines (7 | 0.6%), and South Eastern Asia (7 | 0.6%), together accounting for 1.9% of all Chisholm residents.
| Immigration Origin | # Population | % Population |
| Asia | 7 | 0.6% |
| Philippines | 7 | 0.6% |
| South Eastern Asia | 7 | 0.6% | View All 3 Rows |
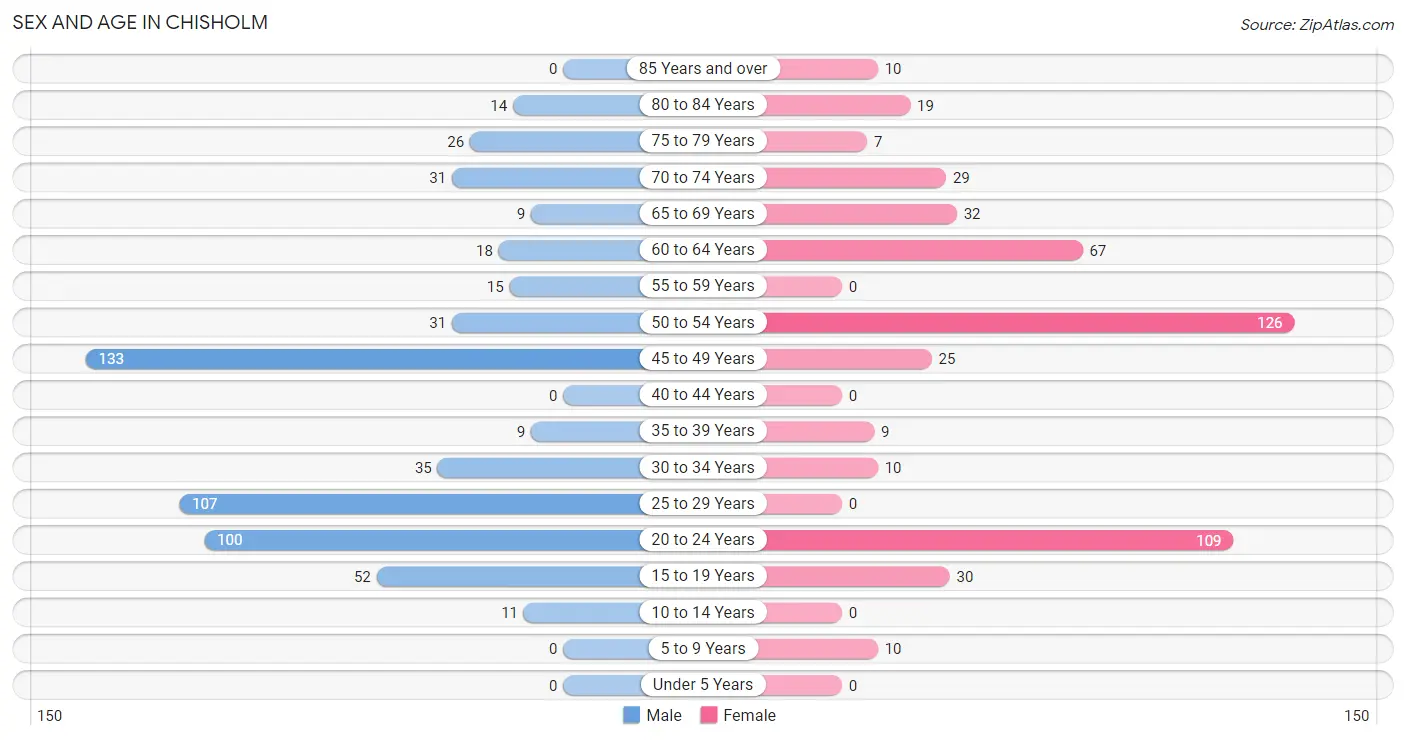
Sex and Age in Chisholm
Sex and Age in Chisholm
The most populous age groups in Chisholm are 45 to 49 Years (133 | 22.5%) for men and 50 to 54 Years (126 | 26.1%) for women.
| Age Bracket | Male | Female |
| Under 5 Years | 0 (0.0%) | 0 (0.0%) |
| 5 to 9 Years | 0 (0.0%) | 10 (2.1%) |
| 10 to 14 Years | 11 (1.9%) | 0 (0.0%) |
| 15 to 19 Years | 52 (8.8%) | 30 (6.2%) |
| 20 to 24 Years | 100 (16.9%) | 109 (22.6%) |
| 25 to 29 Years | 107 (18.1%) | 0 (0.0%) |
| 30 to 34 Years | 35 (5.9%) | 10 (2.1%) |
| 35 to 39 Years | 9 (1.5%) | 9 (1.9%) |
| 40 to 44 Years | 0 (0.0%) | 0 (0.0%) |
| 45 to 49 Years | 133 (22.5%) | 25 (5.2%) |
| 50 to 54 Years | 31 (5.2%) | 126 (26.1%) |
| 55 to 59 Years | 15 (2.5%) | 0 (0.0%) |
| 60 to 64 Years | 18 (3.0%) | 67 (13.9%) |
| 65 to 69 Years | 9 (1.5%) | 32 (6.6%) |
| 70 to 74 Years | 31 (5.2%) | 29 (6.0%) |
| 75 to 79 Years | 26 (4.4%) | 7 (1.5%) |
| 80 to 84 Years | 14 (2.4%) | 19 (3.9%) |
| 85 Years and over | 0 (0.0%) | 10 (2.1%) |
| Total | 591 (100.0%) | 483 (100.0%) |
Families and Households in Chisholm
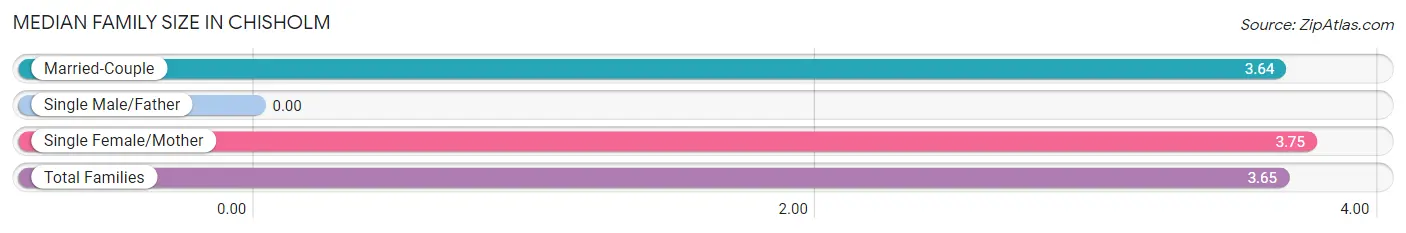
Median Family Size in Chisholm
| Family Type | # Families | Family Size |
| Married-Couple | 225 (96.6%) | 3.64 |
| Single Male/Father | 0 (0.0%) | - |
| Single Female/Mother | 8 (3.4%) | 3.75 |
| Total Families | 233 (100.0%) | 3.65 |
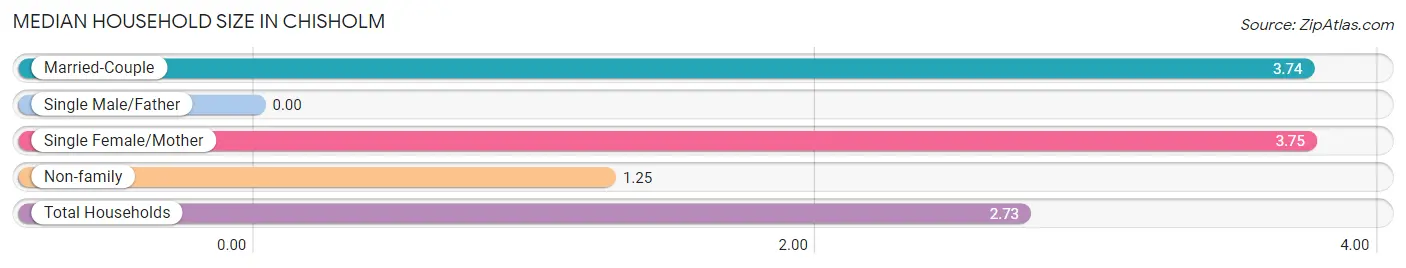
Median Household Size in Chisholm
| Household Type | # Households | Household Size |
| Married-Couple | 225 (57.3%) | 3.74 |
| Single Male/Father | 0 (0.0%) | - |
| Single Female/Mother | 8 (2.0%) | 3.75 |
| Non-family | 160 (40.7%) | 1.25 |
| Total Households | 393 (100.0%) | 2.73 |
Household Size by Marriage Status in Chisholm
Out of a total of 393 households in Chisholm, 233 (59.3%) are family households, while 160 (40.7%) are nonfamily households. The most numerous type of family households are 2-person households, comprising 116, and the most common type of nonfamily households are 1-person households, comprising 123.
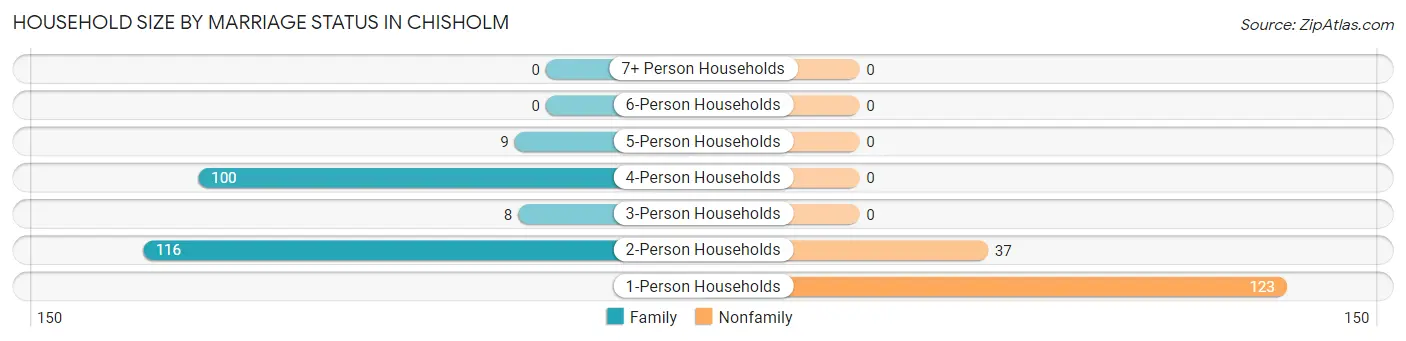
| Household Size | Family Households | Nonfamily Households |
| 1-Person Households | - | 123 (31.3%) |
| 2-Person Households | 116 (29.5%) | 37 (9.4%) |
| 3-Person Households | 8 (2.0%) | 0 (0.0%) |
| 4-Person Households | 100 (25.5%) | 0 (0.0%) |
| 5-Person Households | 9 (2.3%) | 0 (0.0%) |
| 6-Person Households | 0 (0.0%) | 0 (0.0%) |
| 7+ Person Households | 0 (0.0%) | 0 (0.0%) |
| Total | 233 (59.3%) | 160 (40.7%) |
Female Fertility in Chisholm
Fertility by Age in Chisholm
| Age Bracket | Women with Births | Births / 1,000 Women |
| 15 to 19 years | 0 (0.0%) | 0.0 |
| 20 to 34 years | 0 (0.0%) | 0.0 |
| 35 to 50 years | 0 (0.0%) | 0.0 |
| Total | 0 (0.0%) | 0.0 |
Fertility by Age by Marriage Status in Chisholm
| Age Bracket | Married | Unmarried |
| 15 to 19 years | 0 (0.0%) | 0 (0.0%) |
| 20 to 34 years | 0 (0.0%) | 0 (0.0%) |
| 35 to 50 years | 0 (0.0%) | 0 (0.0%) |
| Total | 0 (0.0%) | 0 (0.0%) |
Fertility by Education in Chisholm
| Educational Attainment | Women with Births | Births / 1,000 Women |
| Less than High School | 0 (0.0%) | 0.0 |
| High School Diploma | 0 (0.0%) | 0.0 |
| College or Associate's Degree | 0 (0.0%) | 0.0 |
| Bachelor's Degree | 0 (0.0%) | 0.0 |
| Graduate Degree | 0 (0.0%) | 0.0 |
| Total | 0 (0.0%) | 0.0 |
Fertility by Education by Marriage Status in Chisholm
| Educational Attainment | Married | Unmarried |
| Less than High School | 0 (0.0%) | 0 (0.0%) |
| High School Diploma | 0 (0.0%) | 0 (0.0%) |
| College or Associate's Degree | 0 (0.0%) | 0 (0.0%) |
| Bachelor's Degree | 0 (0.0%) | 0 (0.0%) |
| Graduate Degree | 0 (0.0%) | 0 (0.0%) |
| Total | 0 (0.0%) | 0 (0.0%) |
Employment Characteristics in Chisholm
Employment by Class of Employer in Chisholm
Among the 740 employed individuals in Chisholm, private company employees (535 | 72.3%), not-for-profit organizations (180 | 24.3%), and local government employees (25 | 3.4%) make up the most common classes of employment.
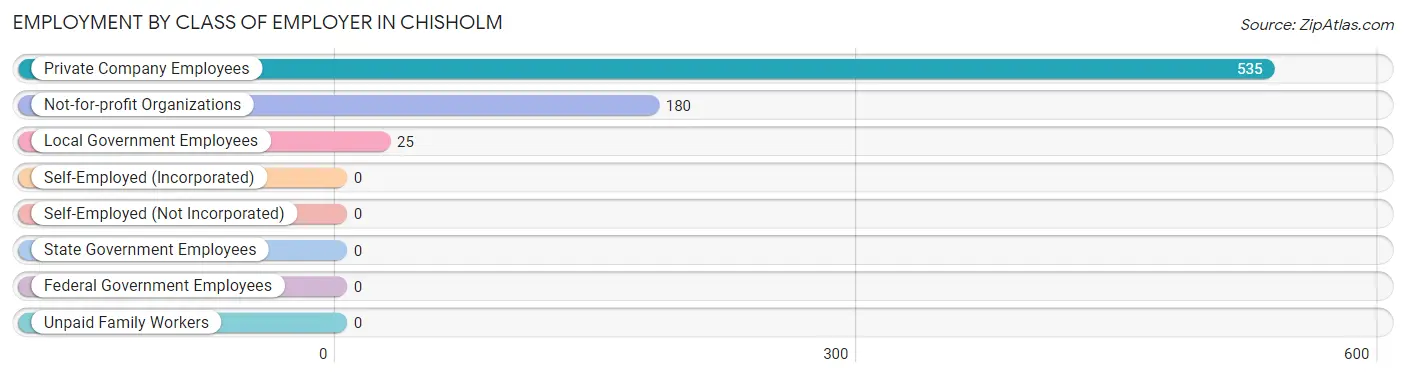
| Employer Class | # Employees | % Employees |
| Private Company Employees | 535 | 72.3% |
| Self-Employed (Incorporated) | 0 | 0.0% |
| Self-Employed (Not Incorporated) | 0 | 0.0% |
| Not-for-profit Organizations | 180 | 24.3% |
| Local Government Employees | 25 | 3.4% |
| State Government Employees | 0 | 0.0% |
| Federal Government Employees | 0 | 0.0% |
| Unpaid Family Workers | 0 | 0.0% |
| Total | 740 | 100.0% |
Employment Status by Age in Chisholm
According to the labor force statistics for Chisholm, out of the total population over 16 years of age (1,053), 75.0% or 790 individuals are in the labor force, with 6.3% or 50 of them unemployed. The age group with the highest labor force participation rate is 20 to 24 years, with 100.0% or 209 individuals in the labor force. Within the labor force, the 16 to 19 years age range has the highest percentage of unemployed individuals, with 100.0% or 30 of them being unemployed.
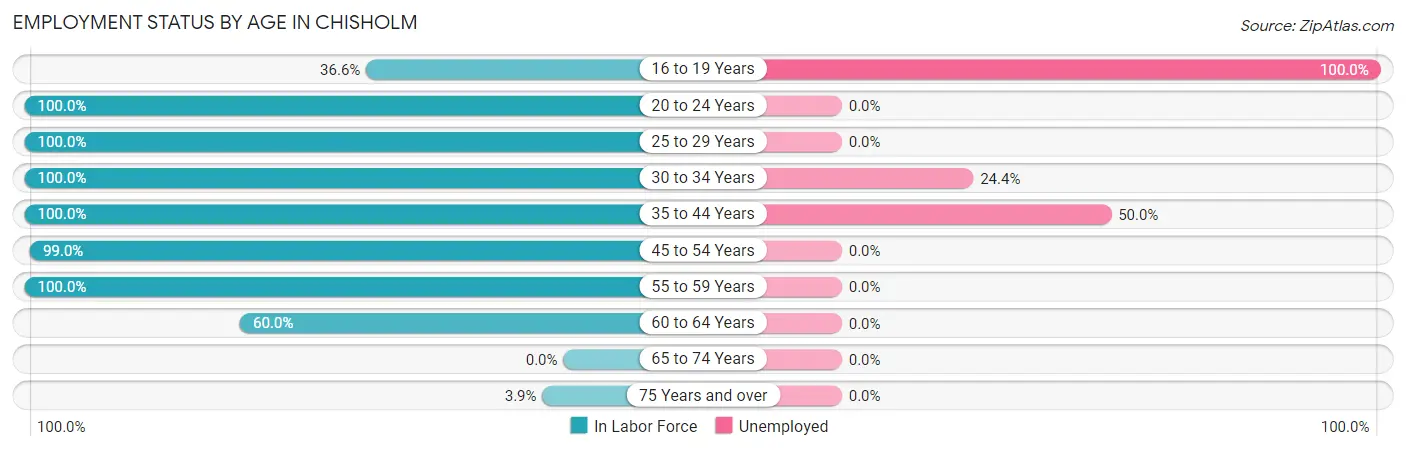
| Age Bracket | In Labor Force | Unemployed |
| 16 to 19 Years | 30 (36.6%) | 30 (100.0%) |
| 20 to 24 Years | 209 (100.0%) | 0 (0.0%) |
| 25 to 29 Years | 107 (100.0%) | 0 (0.0%) |
| 30 to 34 Years | 45 (100.0%) | 11 (24.4%) |
| 35 to 44 Years | 18 (100.0%) | 9 (50.0%) |
| 45 to 54 Years | 312 (99.0%) | 0 (0.0%) |
| 55 to 59 Years | 15 (100.0%) | 0 (0.0%) |
| 60 to 64 Years | 51 (60.0%) | 0 (0.0%) |
| 65 to 74 Years | 0 (0.0%) | 0 (0.0%) |
| 75 Years and over | 3 (3.9%) | 0 (0.0%) |
| Total | 790 (75.0%) | 50 (6.3%) |
Employment Status by Educational Attainment in Chisholm
According to labor force statistics for Chisholm, 93.7% of individuals (548) out of the total population between 25 and 64 years of age (585) are in the labor force, with 3.6% or 20 of them being unemployed. The group with the highest labor force participation rate are those with the educational attainment of college / associate degree, with 100.0% or 176 individuals in the labor force. Within the labor force, individuals with high school diploma education have the highest percentage of unemployment, with 12.7% or 20 of them being unemployed.
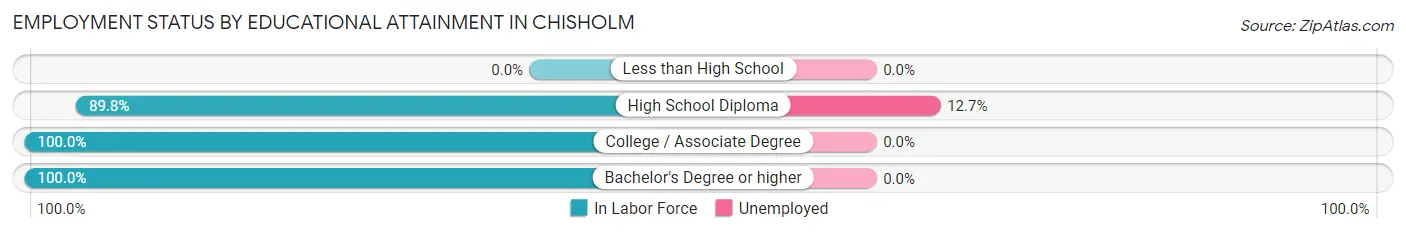
| Educational Attainment | In Labor Force | Unemployed |
| Less than High School | 0 (0.0%) | 0 (0.0%) |
| High School Diploma | 158 (89.8%) | 22 (12.7%) |
| College / Associate Degree | 176 (100.0%) | 0 (0.0%) |
| Bachelor's Degree or higher | 214 (100.0%) | 0 (0.0%) |
| Total | 548 (93.7%) | 21 (3.6%) |
Employment Occupations by Sex in Chisholm
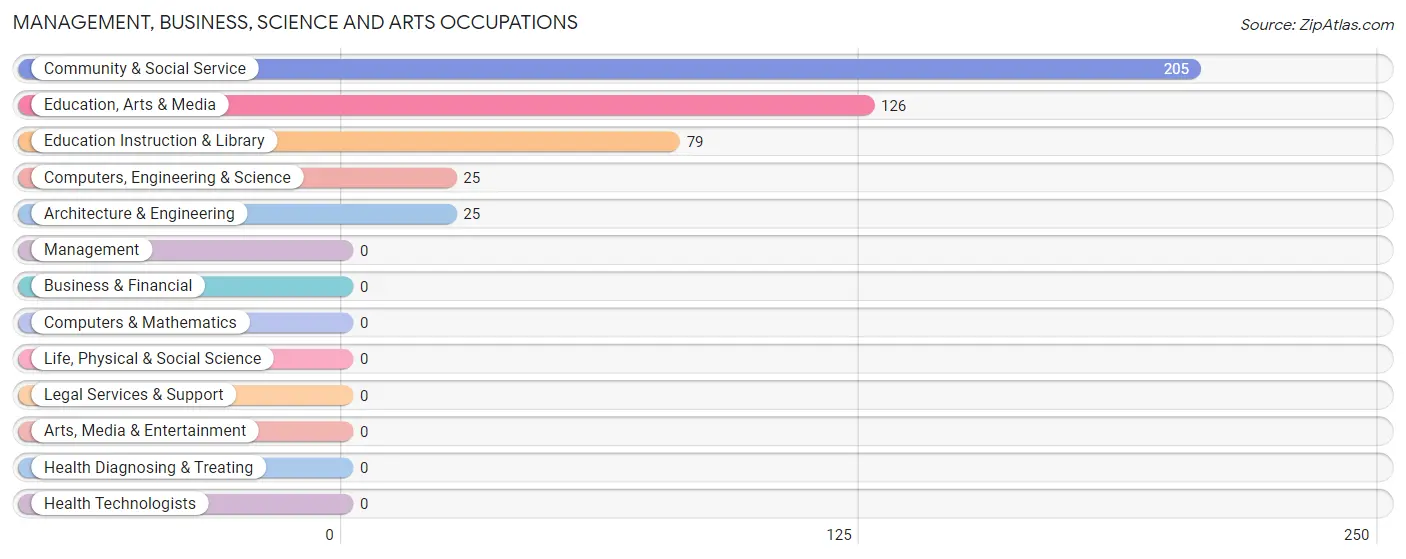
Management, Business, Science and Arts Occupations
The most common Management, Business, Science and Arts occupations in Chisholm are Community & Social Service (205 | 27.7%), Education, Arts & Media (126 | 17.0%), Education Instruction & Library (79 | 10.7%), Computers, Engineering & Science (25 | 3.4%), and Architecture & Engineering (25 | 3.4%).
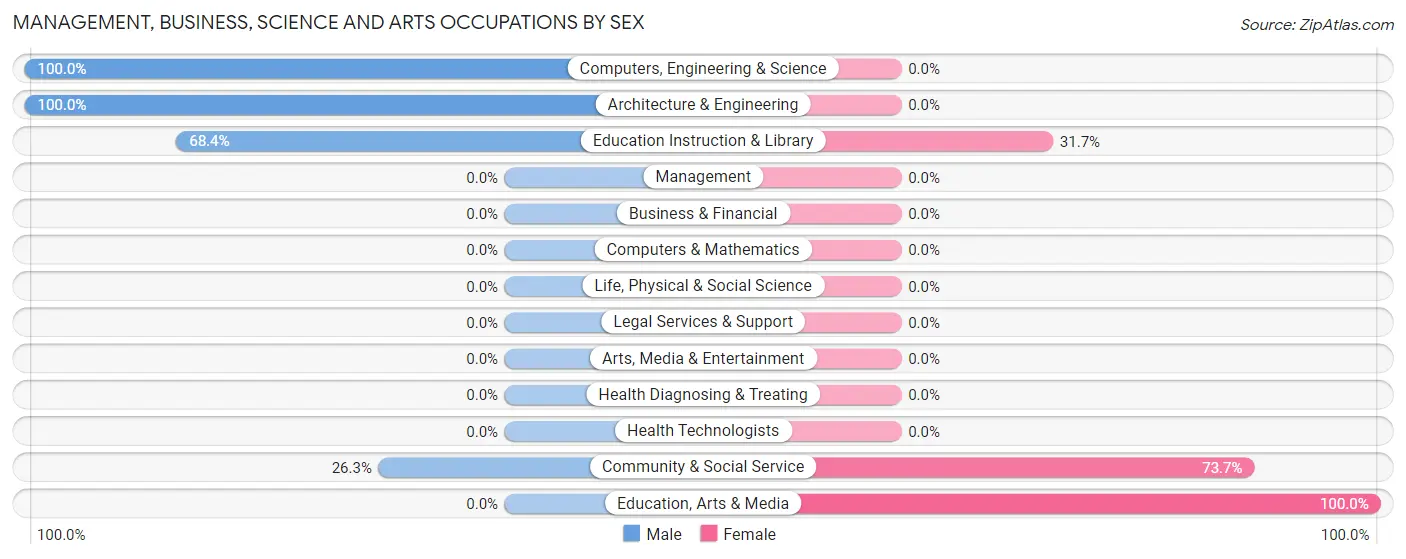
Management, Business, Science and Arts Occupations by Sex
Within the Management, Business, Science and Arts occupations in Chisholm, the most male-oriented occupations are Computers, Engineering & Science (100.0%), Architecture & Engineering (100.0%), and Education Instruction & Library (68.3%), while the most female-oriented occupations are Education, Arts & Media (100.0%), Community & Social Service (73.7%), and Education Instruction & Library (31.7%).
| Occupation | Male | Female |
| Management | 0 (0.0%) | 0 (0.0%) |
| Business & Financial | 0 (0.0%) | 0 (0.0%) |
| Computers, Engineering & Science | 25 (100.0%) | 0 (0.0%) |
| Computers & Mathematics | 0 (0.0%) | 0 (0.0%) |
| Architecture & Engineering | 25 (100.0%) | 0 (0.0%) |
| Life, Physical & Social Science | 0 (0.0%) | 0 (0.0%) |
| Community & Social Service | 54 (26.3%) | 151 (73.7%) |
| Education, Arts & Media | 0 (0.0%) | 126 (100.0%) |
| Legal Services & Support | 0 (0.0%) | 0 (0.0%) |
| Education Instruction & Library | 54 (68.3%) | 25 (31.7%) |
| Arts, Media & Entertainment | 0 (0.0%) | 0 (0.0%) |
| Health Diagnosing & Treating | 0 (0.0%) | 0 (0.0%) |
| Health Technologists | 0 (0.0%) | 0 (0.0%) |
| Total (Category) | 79 (34.4%) | 151 (65.6%) |
| Total (Overall) | 410 (55.4%) | 330 (44.6%) |
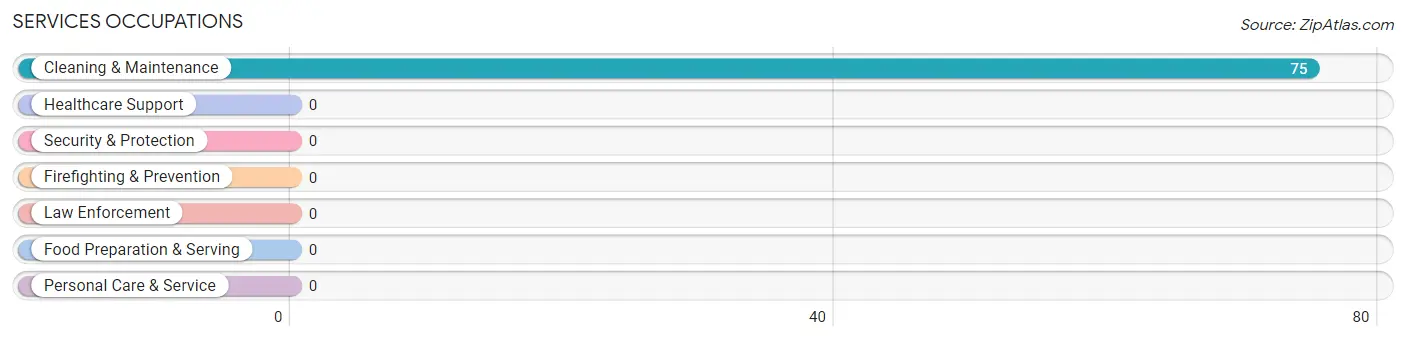
Services Occupations
The most common Services occupations in Chisholm are , and Cleaning & Maintenance (75 | 10.1%).
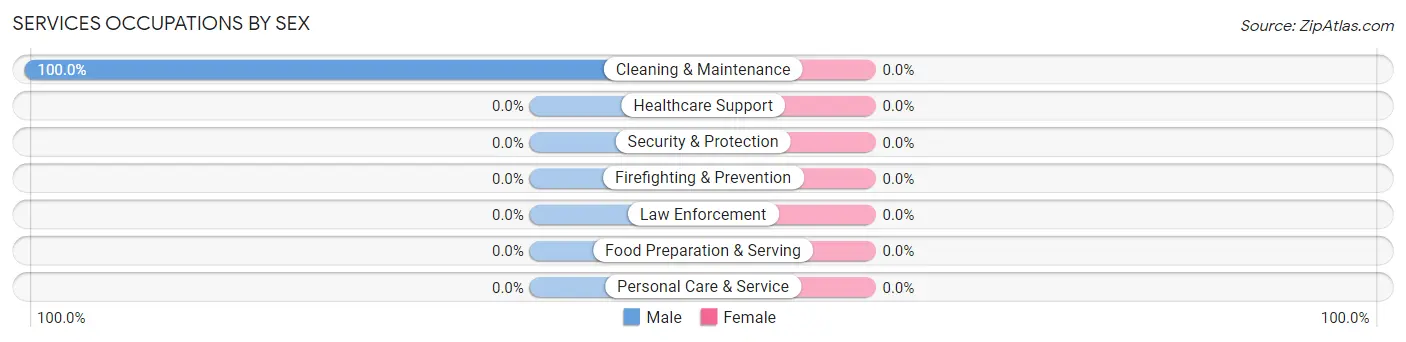
Services Occupations by Sex
| Occupation | Male | Female |
| Healthcare Support | 0 (0.0%) | 0 (0.0%) |
| Security & Protection | 0 (0.0%) | 0 (0.0%) |
| Firefighting & Prevention | 0 (0.0%) | 0 (0.0%) |
| Law Enforcement | 0 (0.0%) | 0 (0.0%) |
| Food Preparation & Serving | 0 (0.0%) | 0 (0.0%) |
| Cleaning & Maintenance | 75 (100.0%) | 0 (0.0%) |
| Personal Care & Service | 0 (0.0%) | 0 (0.0%) |
| Total (Category) | 75 (100.0%) | 0 (0.0%) |
| Total (Overall) | 410 (55.4%) | 330 (44.6%) |
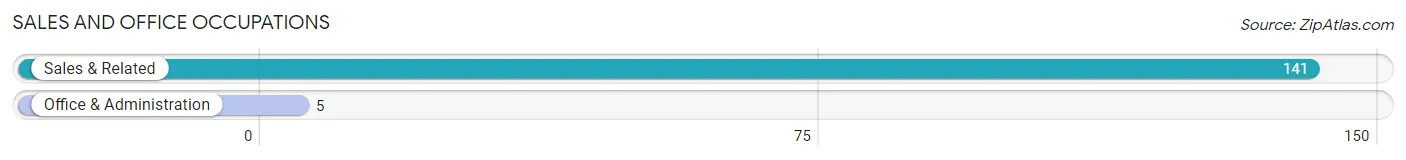
Sales and Office Occupations
The most common Sales and Office occupations in Chisholm are Sales & Related (141 | 19.1%), and Office & Administration (5 | 0.7%).
Sales and Office Occupations by Sex
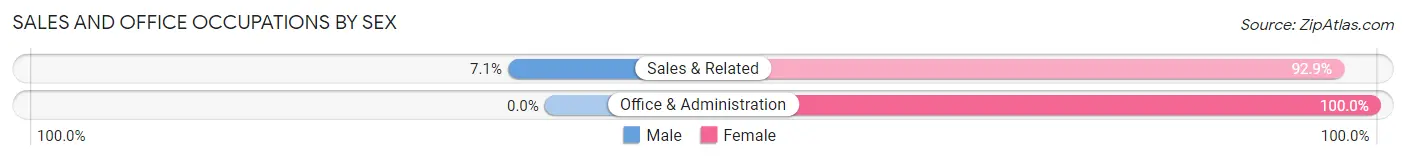
| Occupation | Male | Female |
| Sales & Related | 10 (7.1%) | 131 (92.9%) |
| Office & Administration | 0 (0.0%) | 5 (100.0%) |
| Total (Category) | 10 (6.9%) | 136 (93.1%) |
| Total (Overall) | 410 (55.4%) | 330 (44.6%) |
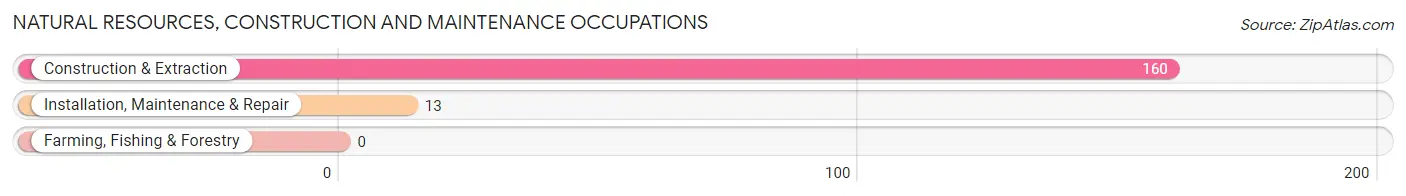
Natural Resources, Construction and Maintenance Occupations
The most common Natural Resources, Construction and Maintenance occupations in Chisholm are Construction & Extraction (160 | 21.6%), and Installation, Maintenance & Repair (13 | 1.8%).
Natural Resources, Construction and Maintenance Occupations by Sex
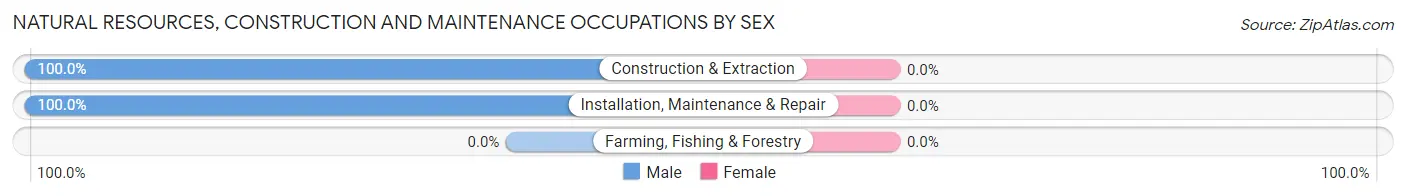
| Occupation | Male | Female |
| Farming, Fishing & Forestry | 0 (0.0%) | 0 (0.0%) |
| Construction & Extraction | 160 (100.0%) | 0 (0.0%) |
| Installation, Maintenance & Repair | 13 (100.0%) | 0 (0.0%) |
| Total (Category) | 173 (100.0%) | 0 (0.0%) |
| Total (Overall) | 410 (55.4%) | 330 (44.6%) |
Production, Transportation and Moving Occupations
The most common Production, Transportation and Moving occupations in Chisholm are Production (85 | 11.5%), and Material Moving (31 | 4.2%).
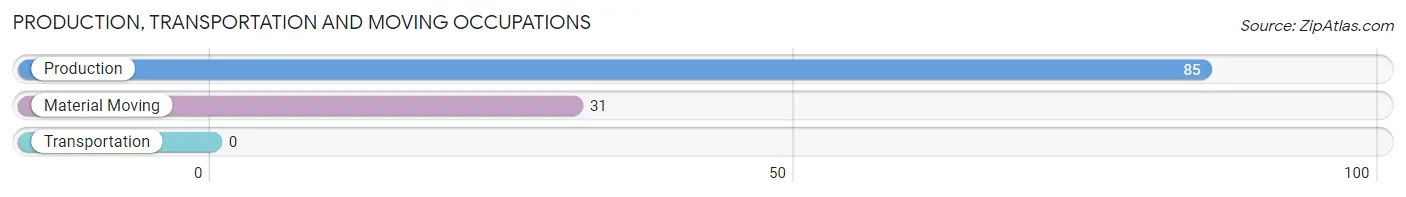
Production, Transportation and Moving Occupations by Sex
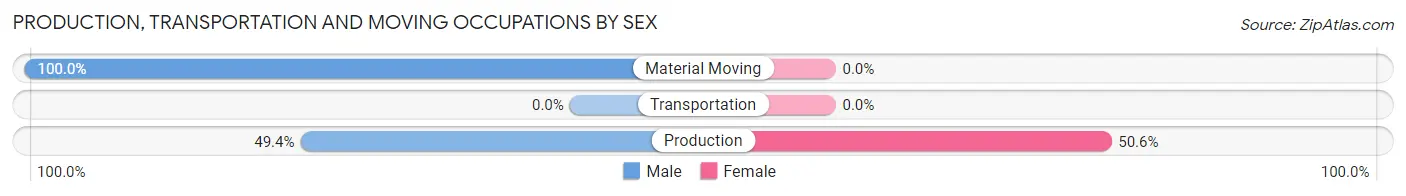
| Occupation | Male | Female |
| Production | 42 (49.4%) | 43 (50.6%) |
| Transportation | 0 (0.0%) | 0 (0.0%) |
| Material Moving | 31 (100.0%) | 0 (0.0%) |
| Total (Category) | 73 (62.9%) | 43 (37.1%) |
| Total (Overall) | 410 (55.4%) | 330 (44.6%) |
Employment Industries by Sex in Chisholm
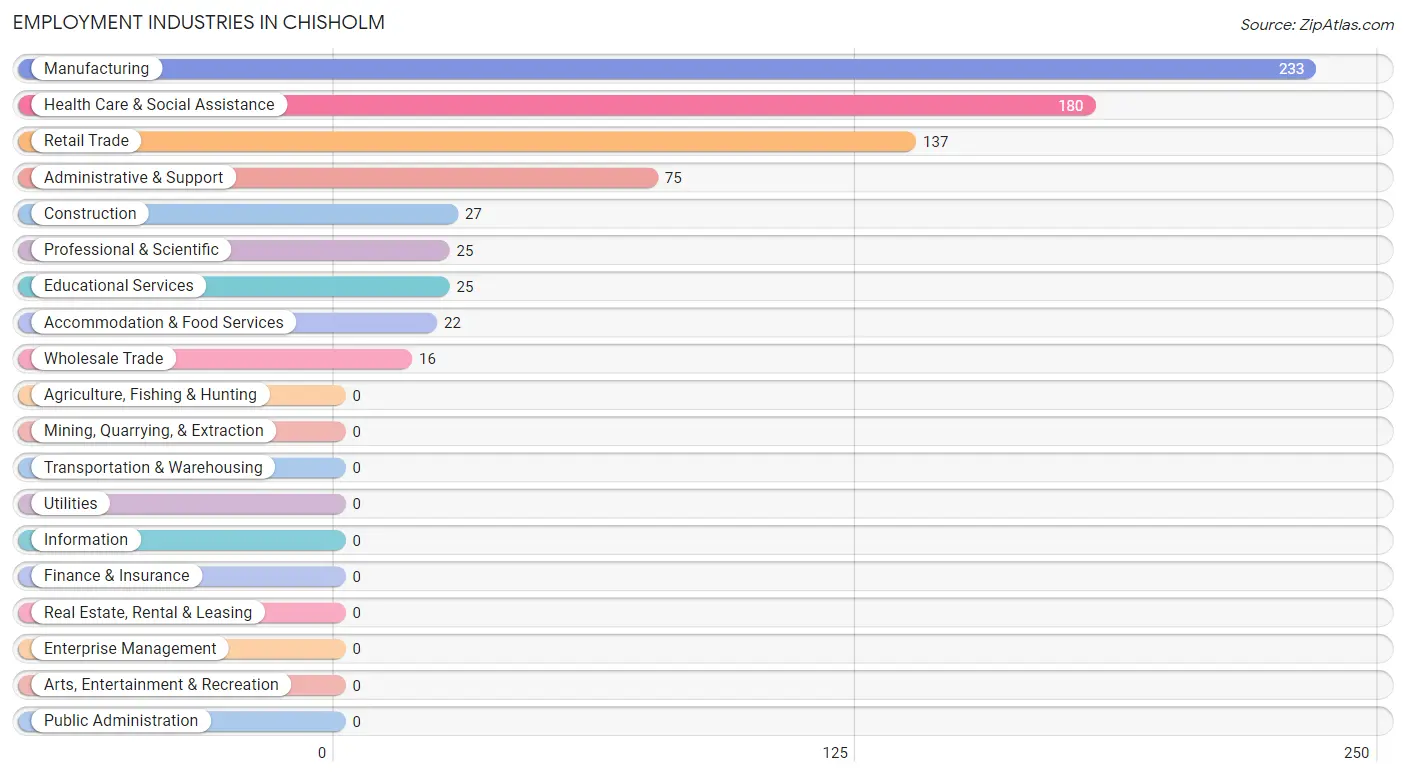
Employment Industries in Chisholm
The major employment industries in Chisholm include Manufacturing (233 | 31.5%), Health Care & Social Assistance (180 | 24.3%), Retail Trade (137 | 18.5%), Administrative & Support (75 | 10.1%), and Construction (27 | 3.6%).
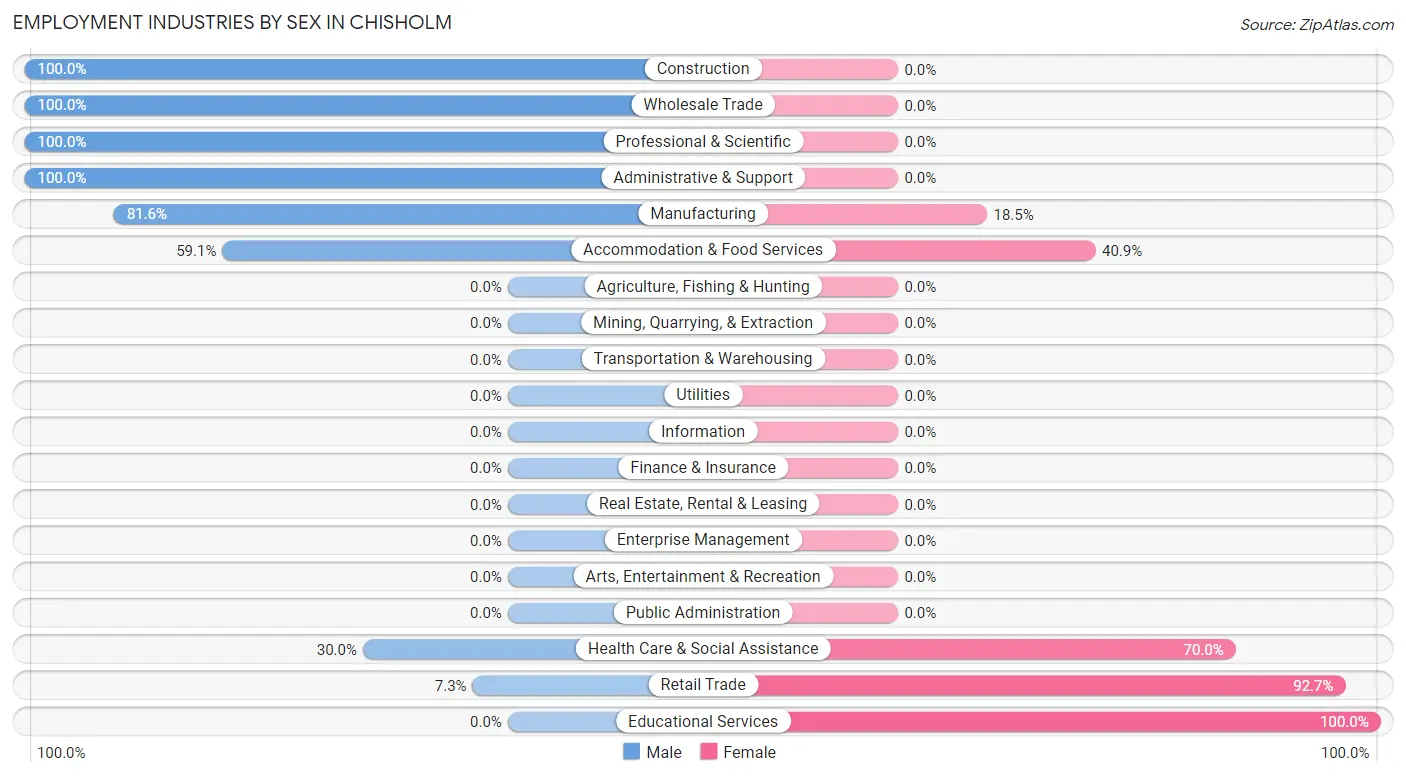
Employment Industries by Sex in Chisholm
The Chisholm industries that see more men than women are Construction (100.0%), Wholesale Trade (100.0%), and Professional & Scientific (100.0%), whereas the industries that tend to have a higher number of women are Educational Services (100.0%), Retail Trade (92.7%), and Health Care & Social Assistance (70.0%).
| Industry | Male | Female |
| Agriculture, Fishing & Hunting | 0 (0.0%) | 0 (0.0%) |
| Mining, Quarrying, & Extraction | 0 (0.0%) | 0 (0.0%) |
| Construction | 27 (100.0%) | 0 (0.0%) |
| Manufacturing | 190 (81.6%) | 43 (18.4%) |
| Wholesale Trade | 16 (100.0%) | 0 (0.0%) |
| Retail Trade | 10 (7.3%) | 127 (92.7%) |
| Transportation & Warehousing | 0 (0.0%) | 0 (0.0%) |
| Utilities | 0 (0.0%) | 0 (0.0%) |
| Information | 0 (0.0%) | 0 (0.0%) |
| Finance & Insurance | 0 (0.0%) | 0 (0.0%) |
| Real Estate, Rental & Leasing | 0 (0.0%) | 0 (0.0%) |
| Professional & Scientific | 25 (100.0%) | 0 (0.0%) |
| Enterprise Management | 0 (0.0%) | 0 (0.0%) |
| Administrative & Support | 75 (100.0%) | 0 (0.0%) |
| Educational Services | 0 (0.0%) | 25 (100.0%) |
| Health Care & Social Assistance | 54 (30.0%) | 126 (70.0%) |
| Arts, Entertainment & Recreation | 0 (0.0%) | 0 (0.0%) |
| Accommodation & Food Services | 13 (59.1%) | 9 (40.9%) |
| Public Administration | 0 (0.0%) | 0 (0.0%) |
| Total | 410 (55.4%) | 330 (44.6%) |
Education in Chisholm
School Enrollment in Chisholm
The most common levels of schooling among the 51 students in Chisholm are college / undergraduate (30 | 58.8%), middle school (11 | 21.6%), and elementary school (10 | 19.6%).
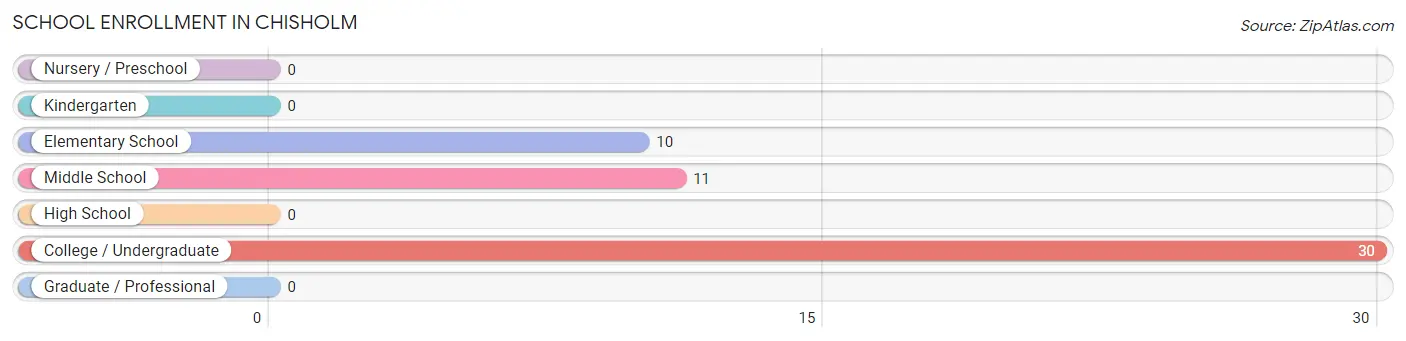
| School Level | # Students | % Students |
| Nursery / Preschool | 0 | 0.0% |
| Kindergarten | 0 | 0.0% |
| Elementary School | 10 | 19.6% |
| Middle School | 11 | 21.6% |
| High School | 0 | 0.0% |
| College / Undergraduate | 30 | 58.8% |
| Graduate / Professional | 0 | 0.0% |
| Total | 51 | 100.0% |
School Enrollment by Age by Funding Source in Chisholm
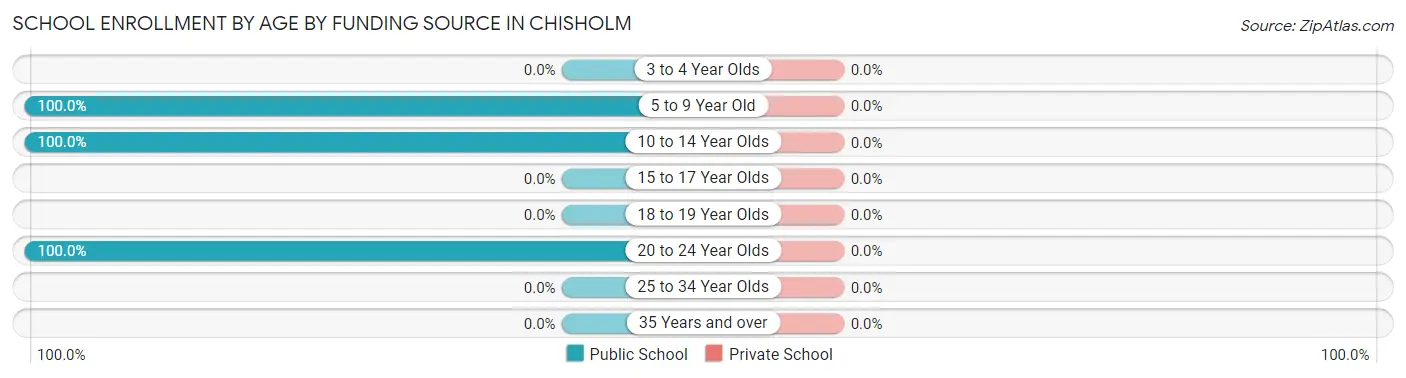
| Age Bracket | Public School | Private School |
| 3 to 4 Year Olds | 0 (0.0%) | 0 (0.0%) |
| 5 to 9 Year Old | 10 (100.0%) | 0 (0.0%) |
| 10 to 14 Year Olds | 11 (100.0%) | 0 (0.0%) |
| 15 to 17 Year Olds | 0 (0.0%) | 0 (0.0%) |
| 18 to 19 Year Olds | 0 (0.0%) | 0 (0.0%) |
| 20 to 24 Year Olds | 30 (100.0%) | 0 (0.0%) |
| 25 to 34 Year Olds | 0 (0.0%) | 0 (0.0%) |
| 35 Years and over | 0 (0.0%) | 0 (0.0%) |
| Total | 51 (100.0%) | 0 (0.0%) |
Educational Attainment by Field of Study in Chisholm
Education (205 | 54.4%), psychology (126 | 33.4%), physical & health sciences (10 | 2.6%), science & technology (10 | 2.6%), and business (9 | 2.4%) are the most common fields of study among 377 individuals in Chisholm who have obtained a bachelor's degree or higher.
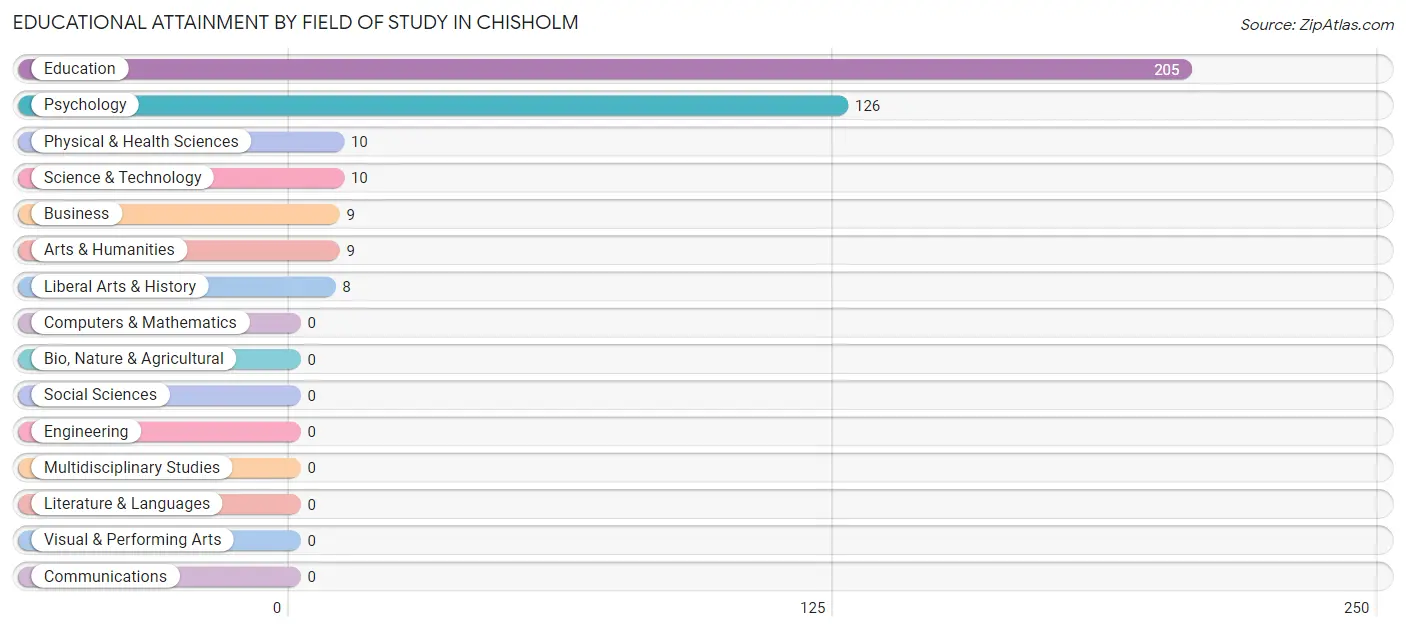
| Field of Study | # Graduates | % Graduates |
| Computers & Mathematics | 0 | 0.0% |
| Bio, Nature & Agricultural | 0 | 0.0% |
| Physical & Health Sciences | 10 | 2.6% |
| Psychology | 126 | 33.4% |
| Social Sciences | 0 | 0.0% |
| Engineering | 0 | 0.0% |
| Multidisciplinary Studies | 0 | 0.0% |
| Science & Technology | 10 | 2.6% |
| Business | 9 | 2.4% |
| Education | 205 | 54.4% |
| Literature & Languages | 0 | 0.0% |
| Liberal Arts & History | 8 | 2.1% |
| Visual & Performing Arts | 0 | 0.0% |
| Communications | 0 | 0.0% |
| Arts & Humanities | 9 | 2.4% |
| Total | 377 | 100.0% |
Transportation & Commute in Chisholm
Vehicle Availability by Sex in Chisholm
The most prevalent vehicle ownership categories in Chisholm are males with 5 or more vehicles (208, accounting for 50.7%) and females with 5 or more vehicles (201, making up 63.0%).
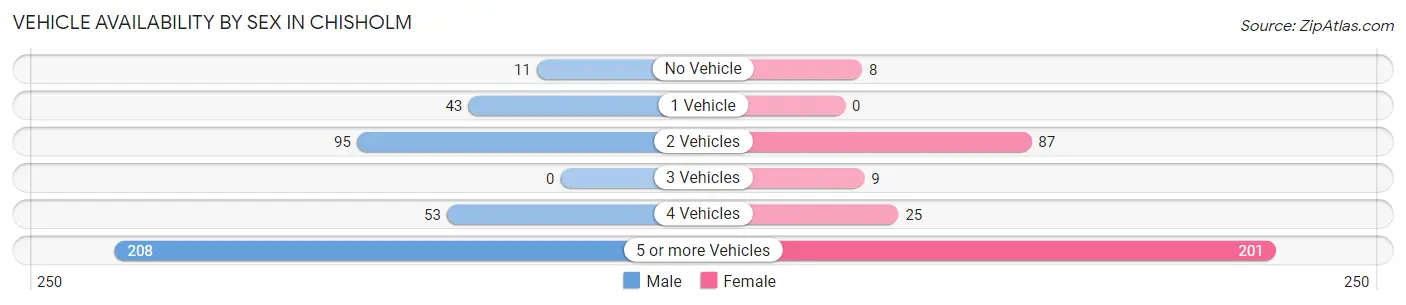
| Vehicles Available | Male | Female |
| No Vehicle | 11 (2.7%) | 8 (2.4%) |
| 1 Vehicle | 43 (10.5%) | 0 (0.0%) |
| 2 Vehicles | 95 (23.2%) | 87 (26.4%) |
| 3 Vehicles | 0 (0.0%) | 9 (2.7%) |
| 4 Vehicles | 53 (12.9%) | 25 (7.6%) |
| 5 or more Vehicles | 208 (50.7%) | 201 (60.9%) |
| Total | 410 (100.0%) | 330 (100.0%) |
Commute Time in Chisholm
The most frequently occuring commute durations in Chisholm are 30 to 34 minutes (424 commuters, 61.8%), 10 to 14 minutes (108 commuters, 15.7%), and 25 to 29 minutes (48 commuters, 7.0%).
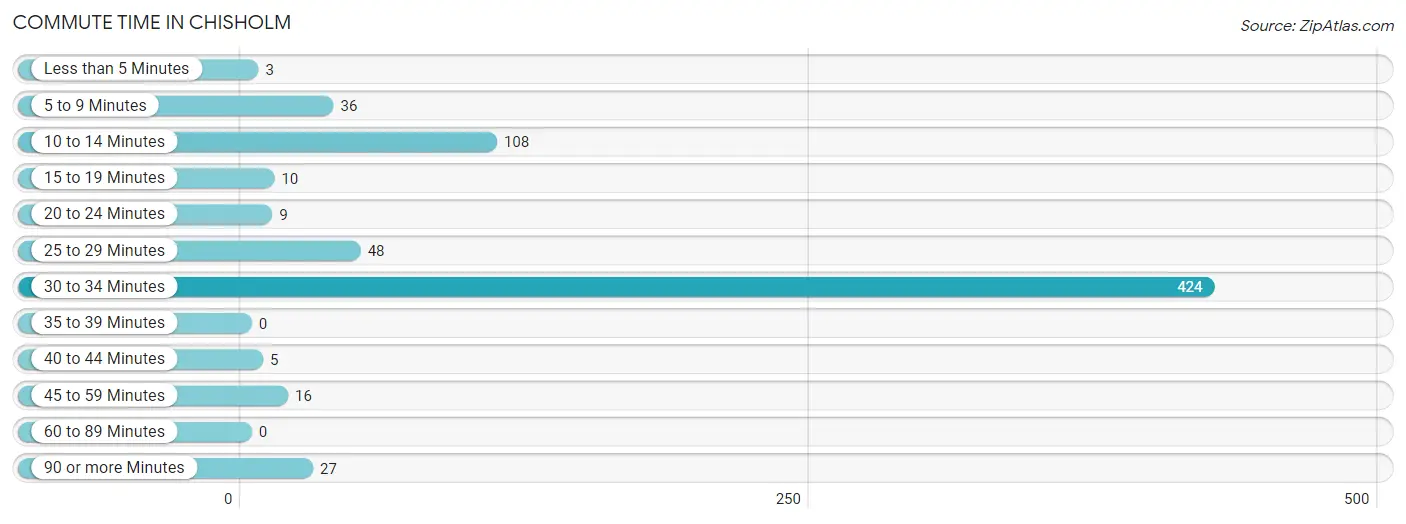
| Commute Time | # Commuters | % Commuters |
| Less than 5 Minutes | 3 | 0.4% |
| 5 to 9 Minutes | 36 | 5.2% |
| 10 to 14 Minutes | 108 | 15.7% |
| 15 to 19 Minutes | 10 | 1.5% |
| 20 to 24 Minutes | 9 | 1.3% |
| 25 to 29 Minutes | 48 | 7.0% |
| 30 to 34 Minutes | 424 | 61.8% |
| 35 to 39 Minutes | 0 | 0.0% |
| 40 to 44 Minutes | 5 | 0.7% |
| 45 to 59 Minutes | 16 | 2.3% |
| 60 to 89 Minutes | 0 | 0.0% |
| 90 or more Minutes | 27 | 3.9% |
Commute Time by Sex in Chisholm
The most common commute times in Chisholm are 30 to 34 minutes (223 commuters, 62.6%) for males and 30 to 34 minutes (201 commuters, 60.9%) for females.
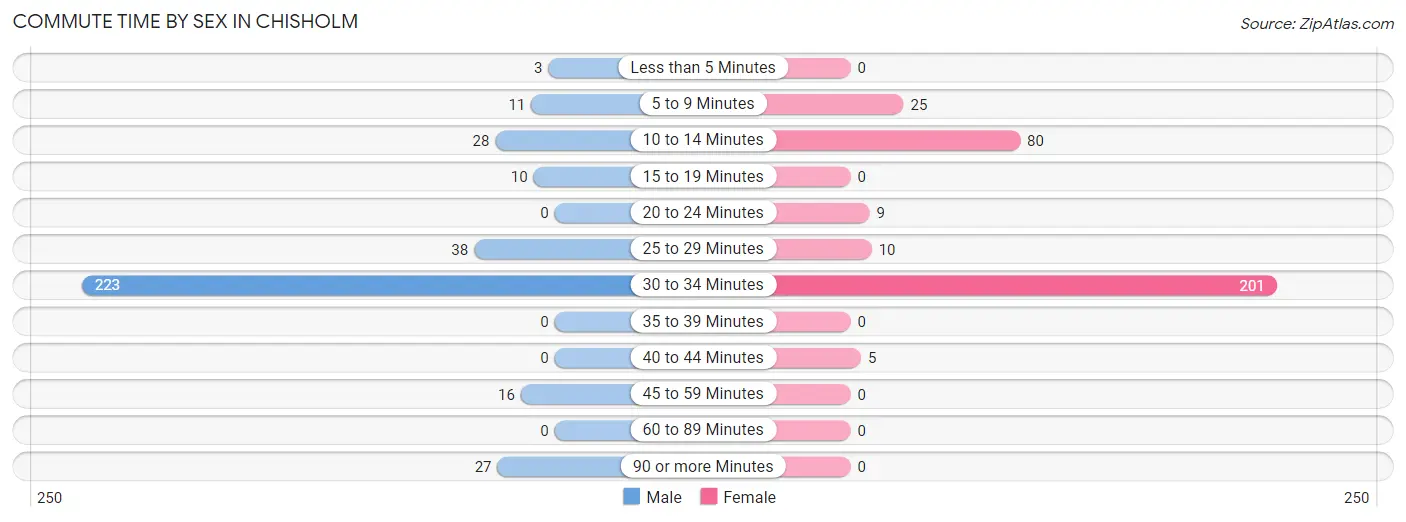
| Commute Time | Male | Female |
| Less than 5 Minutes | 3 (0.8%) | 0 (0.0%) |
| 5 to 9 Minutes | 11 (3.1%) | 25 (7.6%) |
| 10 to 14 Minutes | 28 (7.9%) | 80 (24.2%) |
| 15 to 19 Minutes | 10 (2.8%) | 0 (0.0%) |
| 20 to 24 Minutes | 0 (0.0%) | 9 (2.7%) |
| 25 to 29 Minutes | 38 (10.7%) | 10 (3.0%) |
| 30 to 34 Minutes | 223 (62.6%) | 201 (60.9%) |
| 35 to 39 Minutes | 0 (0.0%) | 0 (0.0%) |
| 40 to 44 Minutes | 0 (0.0%) | 5 (1.5%) |
| 45 to 59 Minutes | 16 (4.5%) | 0 (0.0%) |
| 60 to 89 Minutes | 0 (0.0%) | 0 (0.0%) |
| 90 or more Minutes | 27 (7.6%) | 0 (0.0%) |
Time of Departure to Work by Sex in Chisholm
The most frequent times of departure to work in Chisholm are 5:30 AM to 5:59 AM (261, 73.3%) for males and 7:30 AM to 7:59 AM (269, 81.5%) for females.
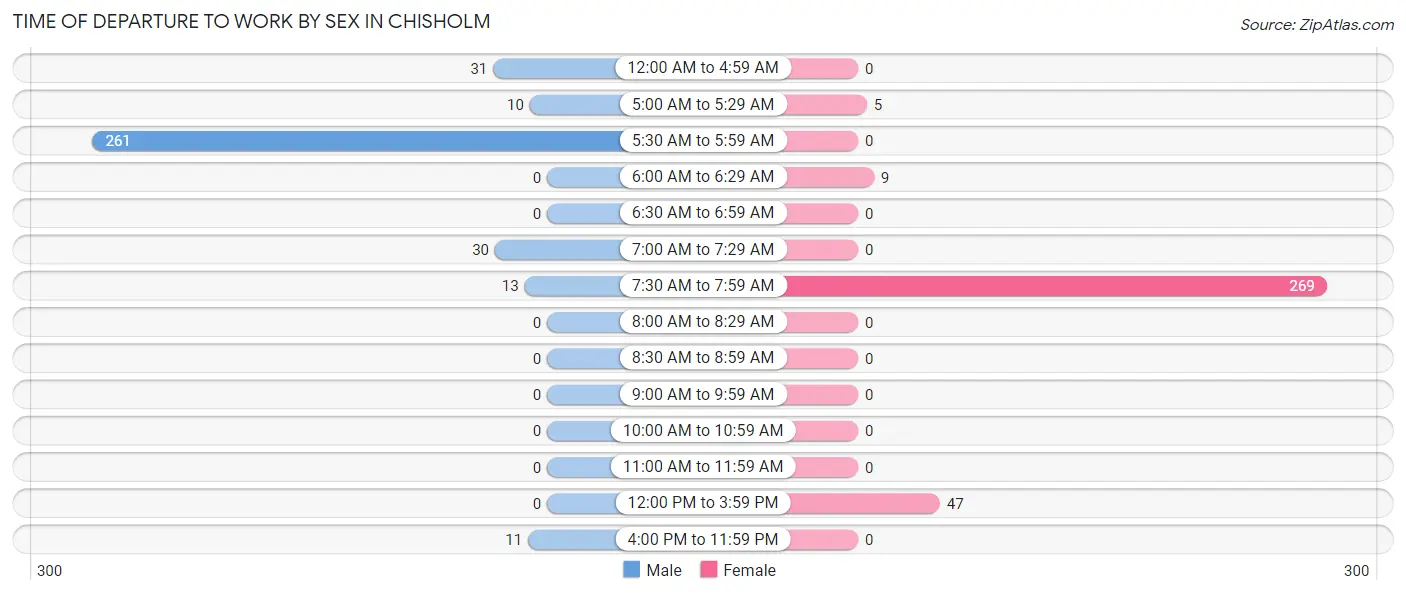
| Time of Departure | Male | Female |
| 12:00 AM to 4:59 AM | 31 (8.7%) | 0 (0.0%) |
| 5:00 AM to 5:29 AM | 10 (2.8%) | 5 (1.5%) |
| 5:30 AM to 5:59 AM | 261 (73.3%) | 0 (0.0%) |
| 6:00 AM to 6:29 AM | 0 (0.0%) | 9 (2.7%) |
| 6:30 AM to 6:59 AM | 0 (0.0%) | 0 (0.0%) |
| 7:00 AM to 7:29 AM | 30 (8.4%) | 0 (0.0%) |
| 7:30 AM to 7:59 AM | 13 (3.6%) | 269 (81.5%) |
| 8:00 AM to 8:29 AM | 0 (0.0%) | 0 (0.0%) |
| 8:30 AM to 8:59 AM | 0 (0.0%) | 0 (0.0%) |
| 9:00 AM to 9:59 AM | 0 (0.0%) | 0 (0.0%) |
| 10:00 AM to 10:59 AM | 0 (0.0%) | 0 (0.0%) |
| 11:00 AM to 11:59 AM | 0 (0.0%) | 0 (0.0%) |
| 12:00 PM to 3:59 PM | 0 (0.0%) | 47 (14.2%) |
| 4:00 PM to 11:59 PM | 11 (3.1%) | 0 (0.0%) |
| Total | 356 (100.0%) | 330 (100.0%) |
Housing Occupancy in Chisholm
Occupancy by Ownership in Chisholm
Of the total 393 dwellings in Chisholm, owner-occupied units account for 214 (54.4%), while renter-occupied units make up 179 (45.6%).
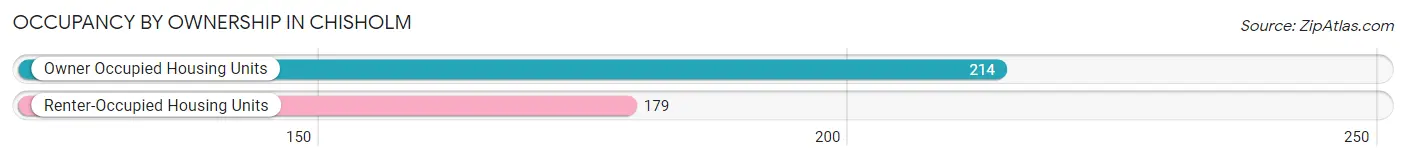
| Occupancy | # Housing Units | % Housing Units |
| Owner Occupied Housing Units | 214 | 54.4% |
| Renter-Occupied Housing Units | 179 | 45.6% |
| Total Occupied Housing Units | 393 | 100.0% |
Occupancy by Household Size in Chisholm
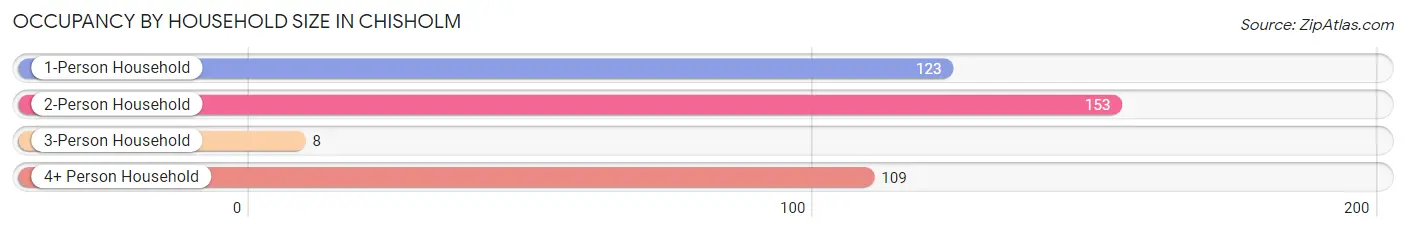
| Household Size | # Housing Units | % Housing Units |
| 1-Person Household | 123 | 31.3% |
| 2-Person Household | 153 | 38.9% |
| 3-Person Household | 8 | 2.0% |
| 4+ Person Household | 109 | 27.7% |
| Total Housing Units | 393 | 100.0% |
Occupancy by Ownership by Household Size in Chisholm
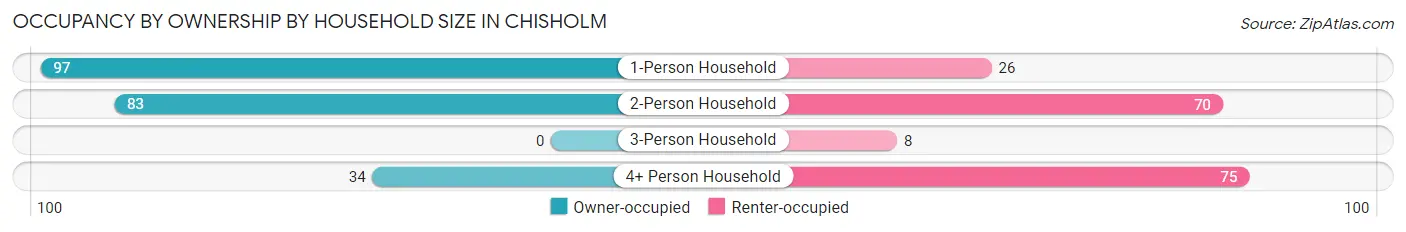
| Household Size | Owner-occupied | Renter-occupied |
| 1-Person Household | 97 (78.9%) | 26 (21.1%) |
| 2-Person Household | 83 (54.2%) | 70 (45.8%) |
| 3-Person Household | 0 (0.0%) | 8 (100.0%) |
| 4+ Person Household | 34 (31.2%) | 75 (68.8%) |
| Total Housing Units | 214 (54.4%) | 179 (45.6%) |
Occupancy by Educational Attainment in Chisholm
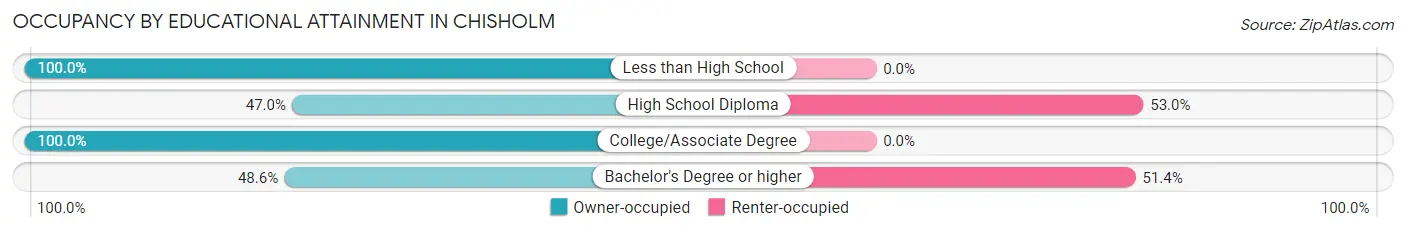
| Household Size | Owner-occupied | Renter-occupied |
| Less than High School | 16 (100.0%) | 0 (0.0%) |
| High School Diploma | 111 (47.0%) | 125 (53.0%) |
| College/Associate Degree | 36 (100.0%) | 0 (0.0%) |
| Bachelor's Degree or higher | 51 (48.6%) | 54 (51.4%) |
Occupancy by Age of Householder in Chisholm
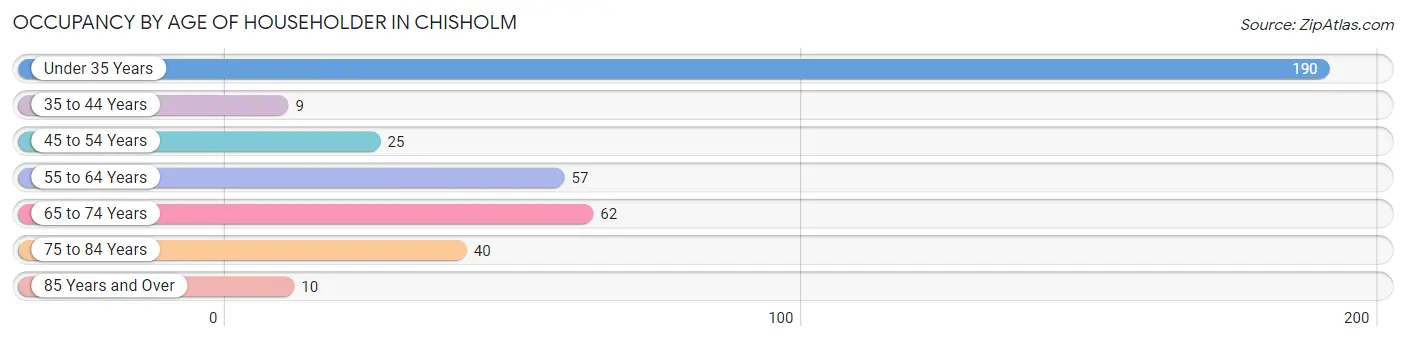
| Age Bracket | # Households | % Households |
| Under 35 Years | 190 | 48.3% |
| 35 to 44 Years | 9 | 2.3% |
| 45 to 54 Years | 25 | 6.4% |
| 55 to 64 Years | 57 | 14.5% |
| 65 to 74 Years | 62 | 15.8% |
| 75 to 84 Years | 40 | 10.2% |
| 85 Years and Over | 10 | 2.5% |
| Total | 393 | 100.0% |
Housing Finances in Chisholm
Median Income by Occupancy in Chisholm
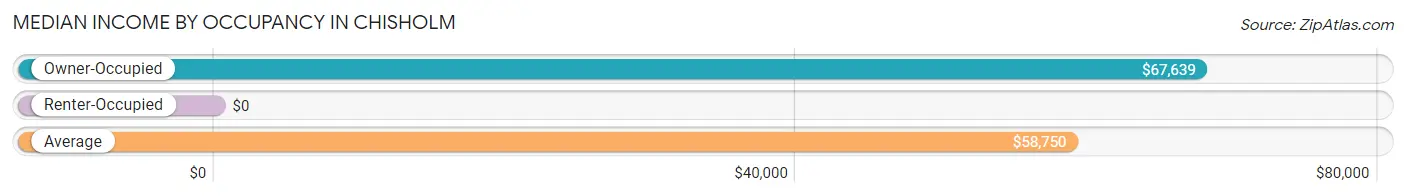
| Occupancy Type | # Households | Median Income |
| Owner-Occupied | 214 (54.4%) | $67,639 |
| Renter-Occupied | 179 (45.6%) | $0 |
| Average | 393 (100.0%) | $58,750 |
Occupancy by Householder Income Bracket in Chisholm
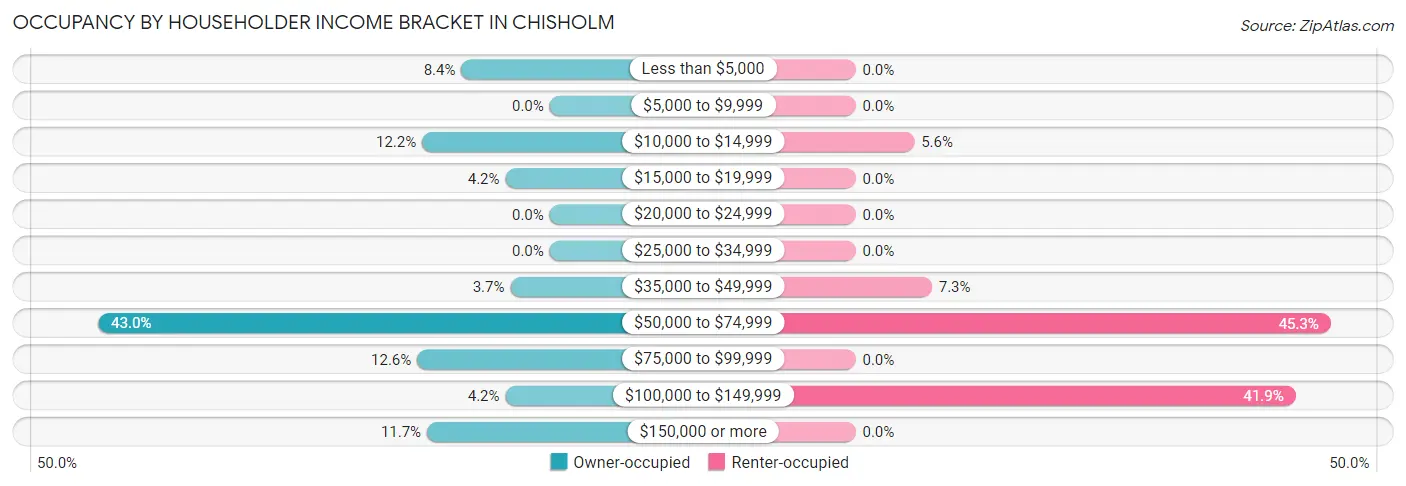
| Income Bracket | Owner-occupied | Renter-occupied |
| Less than $5,000 | 18 (8.4%) | 0 (0.0%) |
| $5,000 to $9,999 | 0 (0.0%) | 0 (0.0%) |
| $10,000 to $14,999 | 26 (12.1%) | 10 (5.6%) |
| $15,000 to $19,999 | 9 (4.2%) | 0 (0.0%) |
| $20,000 to $24,999 | 0 (0.0%) | 0 (0.0%) |
| $25,000 to $34,999 | 0 (0.0%) | 0 (0.0%) |
| $35,000 to $49,999 | 8 (3.7%) | 13 (7.3%) |
| $50,000 to $74,999 | 92 (43.0%) | 81 (45.3%) |
| $75,000 to $99,999 | 27 (12.6%) | 0 (0.0%) |
| $100,000 to $149,999 | 9 (4.2%) | 75 (41.9%) |
| $150,000 or more | 25 (11.7%) | 0 (0.0%) |
| Total | 214 (100.0%) | 179 (100.0%) |
Monthly Housing Cost Tiers in Chisholm
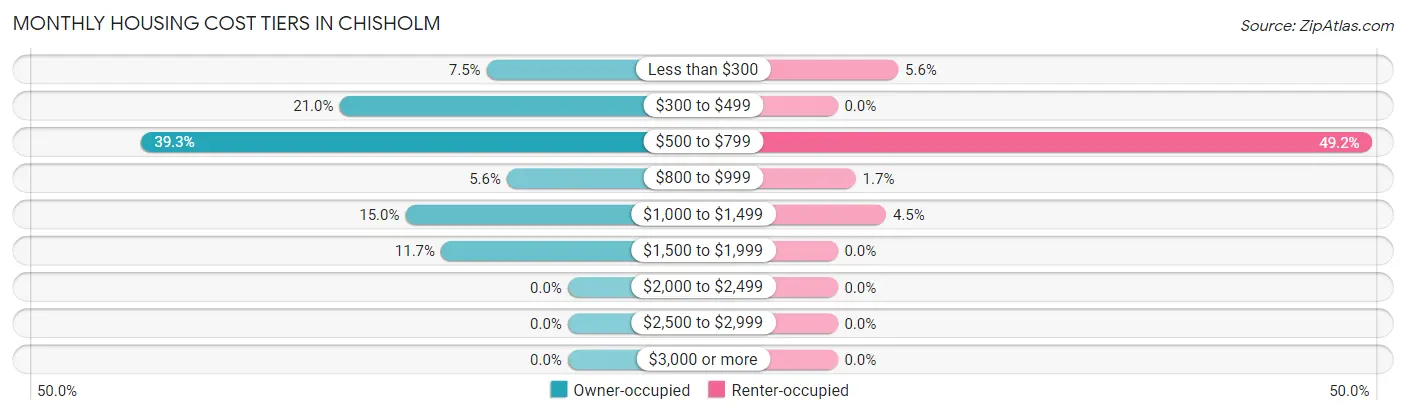
| Monthly Cost | Owner-occupied | Renter-occupied |
| Less than $300 | 16 (7.5%) | 10 (5.6%) |
| $300 to $499 | 45 (21.0%) | 0 (0.0%) |
| $500 to $799 | 84 (39.3%) | 88 (49.2%) |
| $800 to $999 | 12 (5.6%) | 3 (1.7%) |
| $1,000 to $1,499 | 32 (14.9%) | 8 (4.5%) |
| $1,500 to $1,999 | 25 (11.7%) | 0 (0.0%) |
| $2,000 to $2,499 | 0 (0.0%) | 0 (0.0%) |
| $2,500 to $2,999 | 0 (0.0%) | 0 (0.0%) |
| $3,000 or more | 0 (0.0%) | 0 (0.0%) |
| Total | 214 (100.0%) | 179 (100.0%) |
Physical Housing Characteristics in Chisholm
Housing Structures in Chisholm
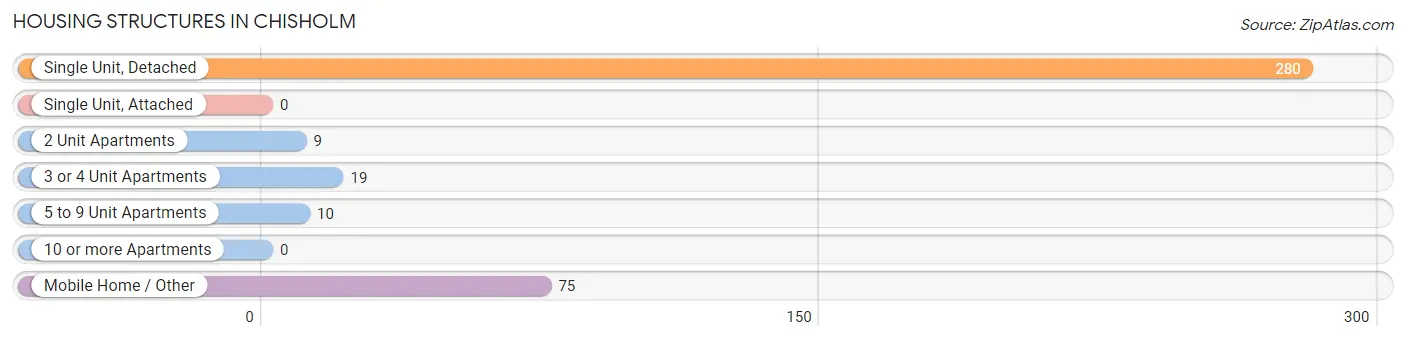
| Structure Type | # Housing Units | % Housing Units |
| Single Unit, Detached | 280 | 71.3% |
| Single Unit, Attached | 0 | 0.0% |
| 2 Unit Apartments | 9 | 2.3% |
| 3 or 4 Unit Apartments | 19 | 4.8% |
| 5 to 9 Unit Apartments | 10 | 2.5% |
| 10 or more Apartments | 0 | 0.0% |
| Mobile Home / Other | 75 | 19.1% |
| Total | 393 | 100.0% |
Housing Structures by Occupancy in Chisholm
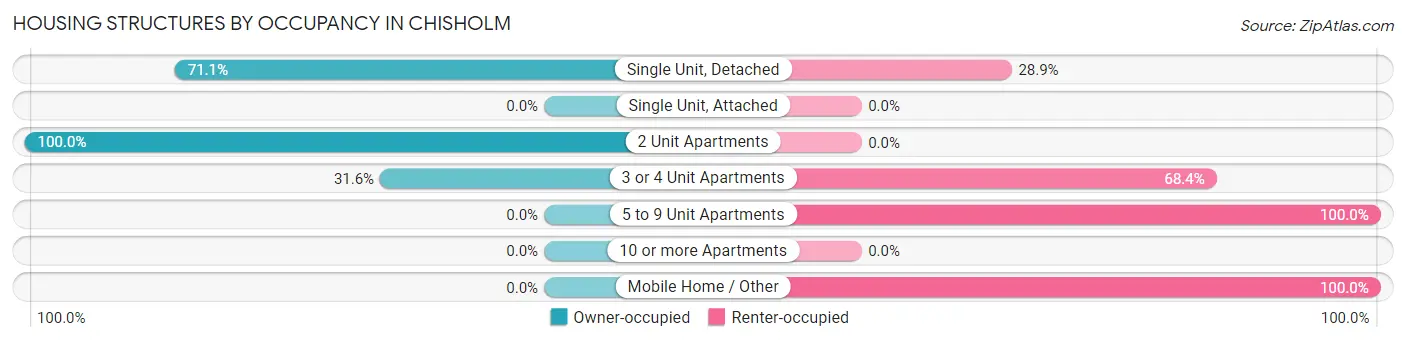
| Structure Type | Owner-occupied | Renter-occupied |
| Single Unit, Detached | 199 (71.1%) | 81 (28.9%) |
| Single Unit, Attached | 0 (0.0%) | 0 (0.0%) |
| 2 Unit Apartments | 9 (100.0%) | 0 (0.0%) |
| 3 or 4 Unit Apartments | 6 (31.6%) | 13 (68.4%) |
| 5 to 9 Unit Apartments | 0 (0.0%) | 10 (100.0%) |
| 10 or more Apartments | 0 (0.0%) | 0 (0.0%) |
| Mobile Home / Other | 0 (0.0%) | 75 (100.0%) |
| Total | 214 (54.4%) | 179 (45.6%) |
Housing Structures by Number of Rooms in Chisholm
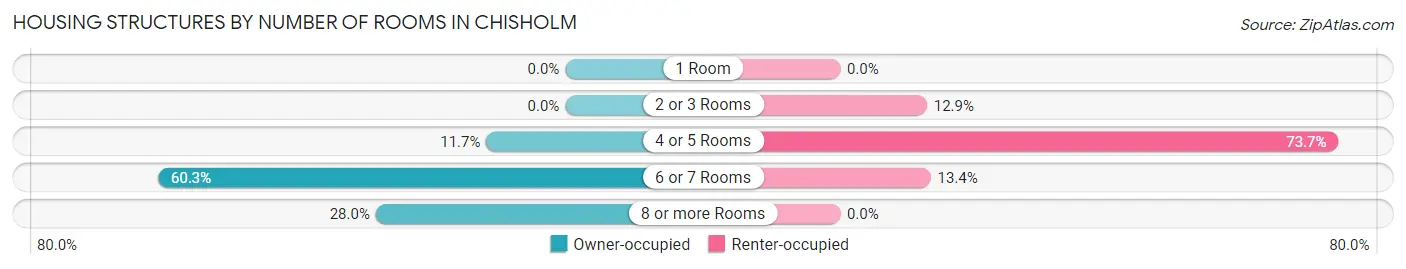
| Number of Rooms | Owner-occupied | Renter-occupied |
| 1 Room | 0 (0.0%) | 0 (0.0%) |
| 2 or 3 Rooms | 0 (0.0%) | 23 (12.9%) |
| 4 or 5 Rooms | 25 (11.7%) | 132 (73.7%) |
| 6 or 7 Rooms | 129 (60.3%) | 24 (13.4%) |
| 8 or more Rooms | 60 (28.0%) | 0 (0.0%) |
| Total | 214 (100.0%) | 179 (100.0%) |
Housing Structure by Heating Type in Chisholm
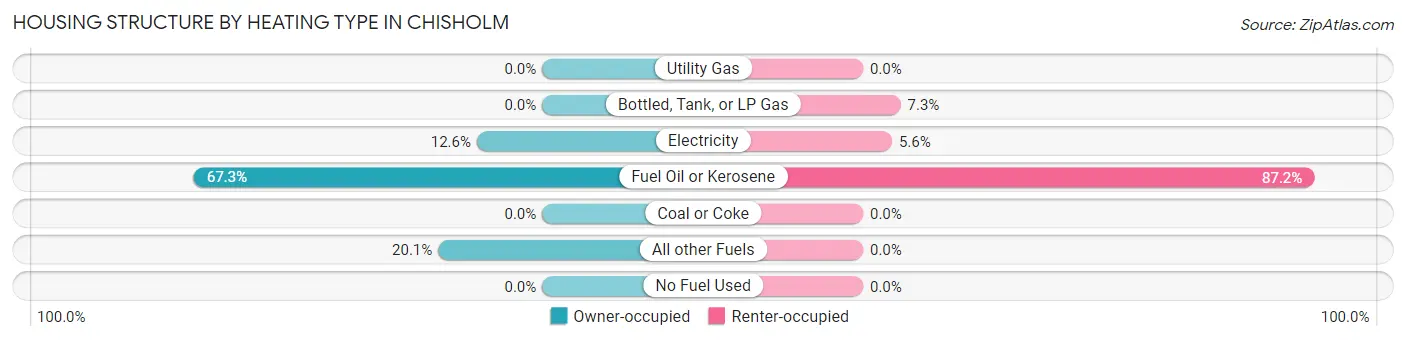
| Heating Type | Owner-occupied | Renter-occupied |
| Utility Gas | 0 (0.0%) | 0 (0.0%) |
| Bottled, Tank, or LP Gas | 0 (0.0%) | 13 (7.3%) |
| Electricity | 27 (12.6%) | 10 (5.6%) |
| Fuel Oil or Kerosene | 144 (67.3%) | 156 (87.2%) |
| Coal or Coke | 0 (0.0%) | 0 (0.0%) |
| All other Fuels | 43 (20.1%) | 0 (0.0%) |
| No Fuel Used | 0 (0.0%) | 0 (0.0%) |
| Total | 214 (100.0%) | 179 (100.0%) |
Household Vehicle Usage in Chisholm
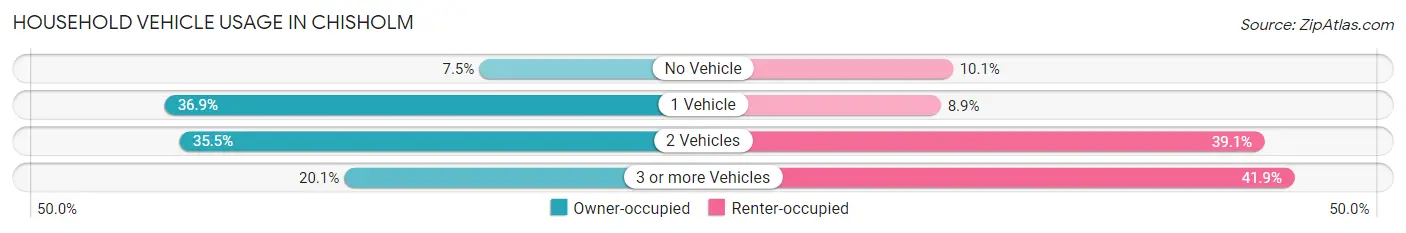
| Vehicles per Household | Owner-occupied | Renter-occupied |
| No Vehicle | 16 (7.5%) | 18 (10.1%) |
| 1 Vehicle | 79 (36.9%) | 16 (8.9%) |
| 2 Vehicles | 76 (35.5%) | 70 (39.1%) |
| 3 or more Vehicles | 43 (20.1%) | 75 (41.9%) |
| Total | 214 (100.0%) | 179 (100.0%) |
Real Estate & Mortgages in Chisholm
Real Estate and Mortgage Overview in Chisholm
| Characteristic | Without Mortgage | With Mortgage |
| Housing Units | 120 | 94 |
| Median Property Value | $90,800 | $0 |
| Median Household Income | $53,833 | $25 |
| Monthly Housing Costs | $495 | $0 |
| Real Estate Taxes | $1,467 | $18 |
Property Value by Mortgage Status in Chisholm
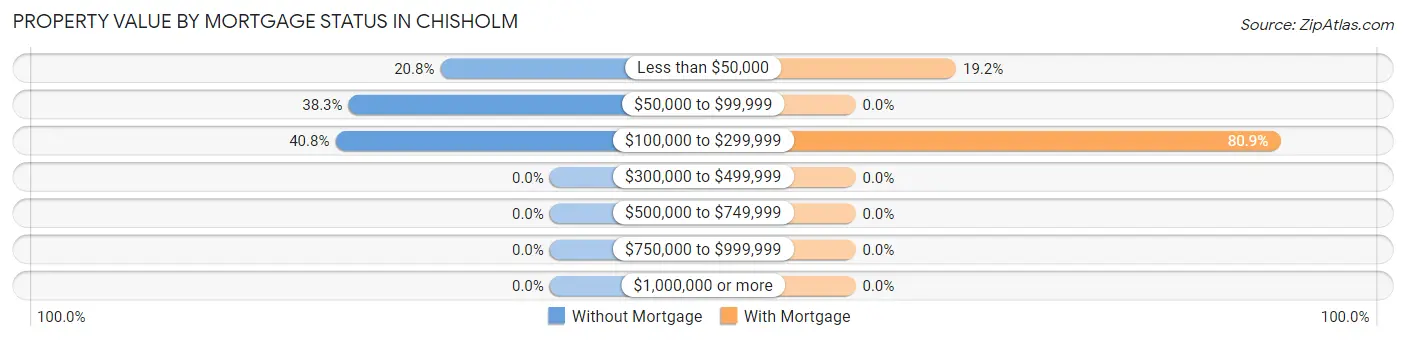
| Property Value | Without Mortgage | With Mortgage |
| Less than $50,000 | 25 (20.8%) | 18 (19.2%) |
| $50,000 to $99,999 | 46 (38.3%) | 0 (0.0%) |
| $100,000 to $299,999 | 49 (40.8%) | 76 (80.8%) |
| $300,000 to $499,999 | 0 (0.0%) | 0 (0.0%) |
| $500,000 to $749,999 | 0 (0.0%) | 0 (0.0%) |
| $750,000 to $999,999 | 0 (0.0%) | 0 (0.0%) |
| $1,000,000 or more | 0 (0.0%) | 0 (0.0%) |
| Total | 120 (100.0%) | 94 (100.0%) |
Household Income by Mortgage Status in Chisholm
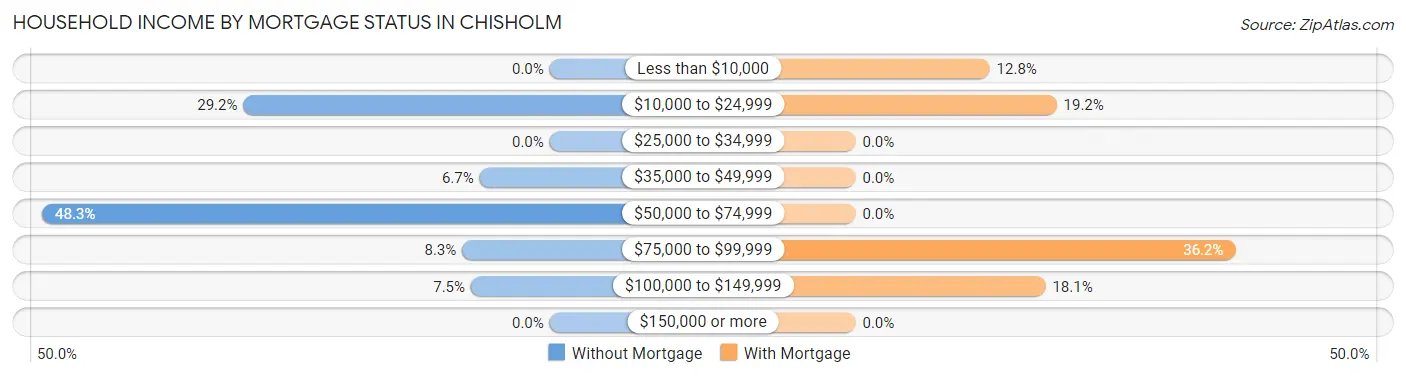
| Household Income | Without Mortgage | With Mortgage |
| Less than $10,000 | 0 (0.0%) | 12 (12.8%) |
| $10,000 to $24,999 | 35 (29.2%) | 18 (19.2%) |
| $25,000 to $34,999 | 0 (0.0%) | 0 (0.0%) |
| $35,000 to $49,999 | 8 (6.7%) | 0 (0.0%) |
| $50,000 to $74,999 | 58 (48.3%) | 0 (0.0%) |
| $75,000 to $99,999 | 10 (8.3%) | 34 (36.2%) |
| $100,000 to $149,999 | 9 (7.5%) | 17 (18.1%) |
| $150,000 or more | 0 (0.0%) | 0 (0.0%) |
| Total | 120 (100.0%) | 94 (100.0%) |
Property Value to Household Income Ratio in Chisholm
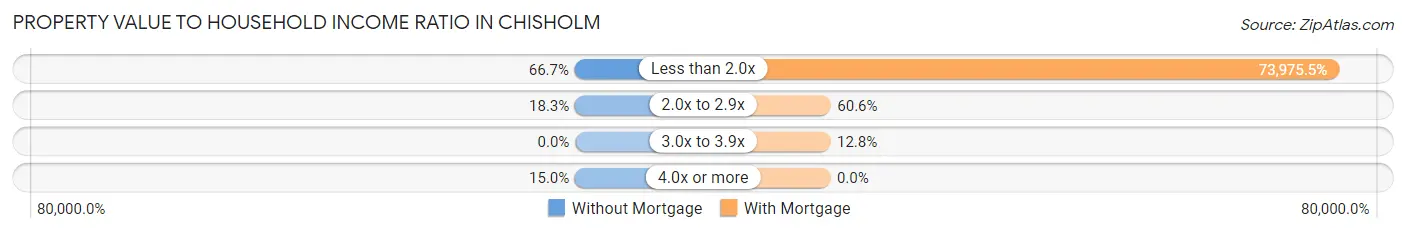
| Value-to-Income Ratio | Without Mortgage | With Mortgage |
| Less than 2.0x | 80 (66.7%) | 69,537 (73,975.5%) |
| 2.0x to 2.9x | 22 (18.3%) | 57 (60.6%) |
| 3.0x to 3.9x | 0 (0.0%) | 12 (12.8%) |
| 4.0x or more | 18 (15.0%) | 0 (0.0%) |
| Total | 120 (100.0%) | 94 (100.0%) |
Real Estate Taxes by Mortgage Status in Chisholm
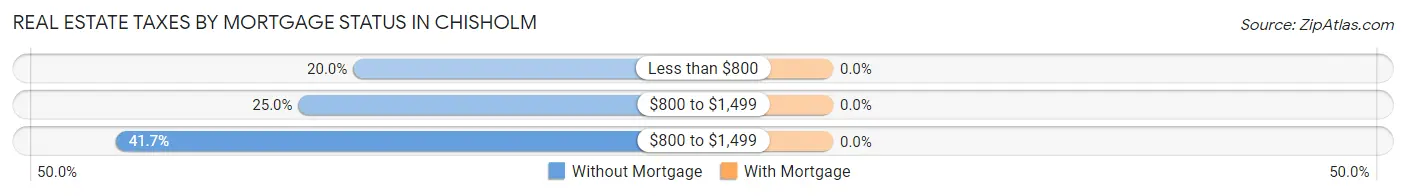
| Property Taxes | Without Mortgage | With Mortgage |
| Less than $800 | 24 (20.0%) | 0 (0.0%) |
| $800 to $1,499 | 30 (25.0%) | 0 (0.0%) |
| $800 to $1,499 | 50 (41.7%) | 0 (0.0%) |
| Total | 120 (100.0%) | 94 (100.0%) |
Health & Disability in Chisholm
Health Insurance Coverage by Age in Chisholm
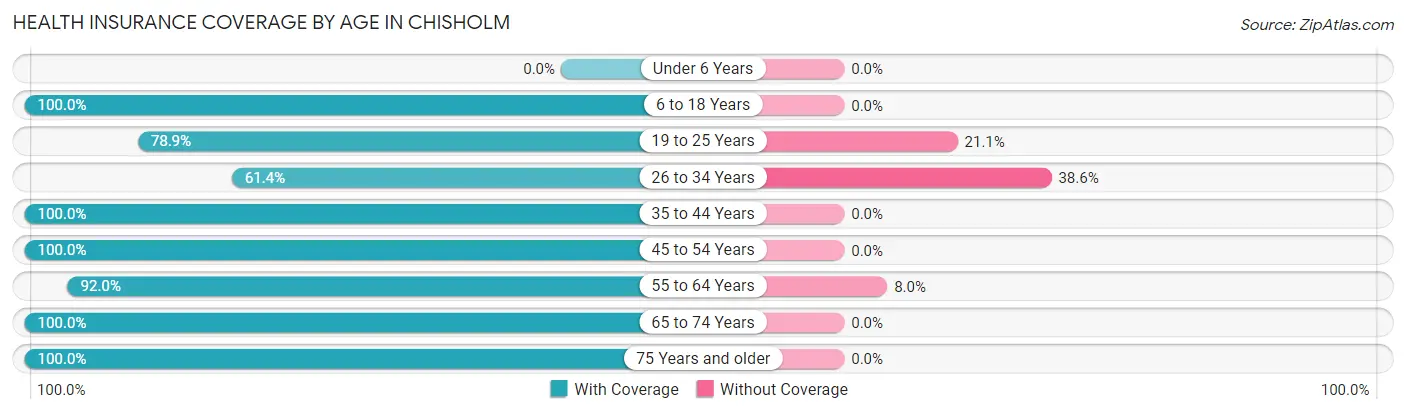
| Age Bracket | With Coverage | Without Coverage |
| Under 6 Years | 0 (0.0%) | 0 (0.0%) |
| 6 to 18 Years | 21 (100.0%) | 0 (0.0%) |
| 19 to 25 Years | 280 (78.9%) | 75 (21.1%) |
| 26 to 34 Years | 54 (61.4%) | 34 (38.6%) |
| 35 to 44 Years | 18 (100.0%) | 0 (0.0%) |
| 45 to 54 Years | 315 (100.0%) | 0 (0.0%) |
| 55 to 64 Years | 92 (92.0%) | 8 (8.0%) |
| 65 to 74 Years | 101 (100.0%) | 0 (0.0%) |
| 75 Years and older | 76 (100.0%) | 0 (0.0%) |
| Total | 957 (89.1%) | 117 (10.9%) |
Health Insurance Coverage by Citizenship Status in Chisholm
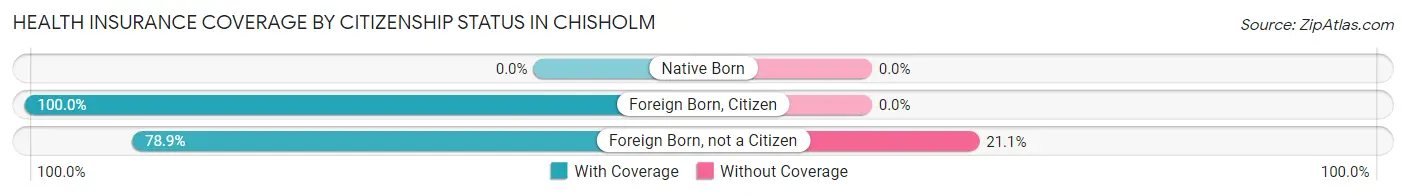
| Citizenship Status | With Coverage | Without Coverage |
| Native Born | 0 (0.0%) | 0 (0.0%) |
| Foreign Born, Citizen | 21 (100.0%) | 0 (0.0%) |
| Foreign Born, not a Citizen | 280 (78.9%) | 75 (21.1%) |
Health Insurance Coverage by Household Income in Chisholm
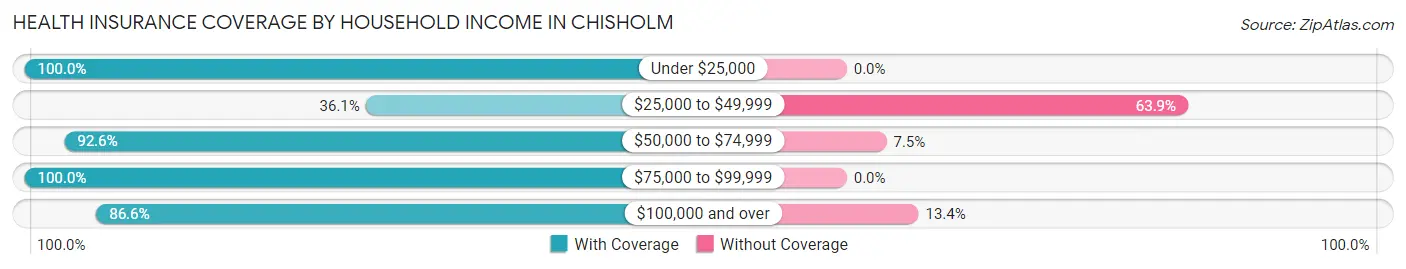
| Household Income | With Coverage | Without Coverage |
| Under $25,000 | 132 (100.0%) | 0 (0.0%) |
| $25,000 to $49,999 | 13 (36.1%) | 23 (63.9%) |
| $50,000 to $74,999 | 236 (92.5%) | 19 (7.4%) |
| $75,000 to $99,999 | 90 (100.0%) | 0 (0.0%) |
| $100,000 and over | 483 (86.6%) | 75 (13.4%) |
Public vs Private Health Insurance Coverage by Age in Chisholm
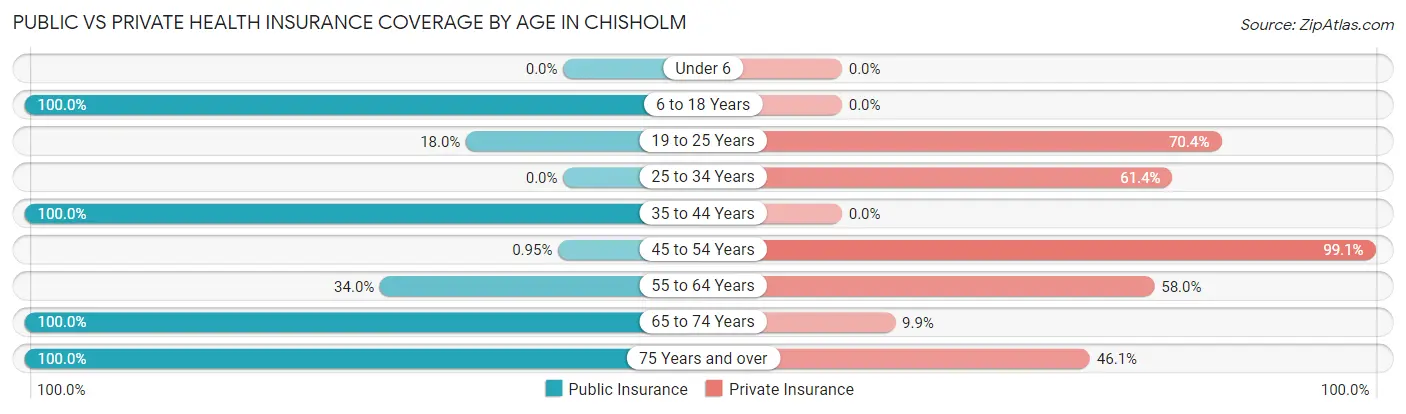
| Age Bracket | Public Insurance | Private Insurance |
| Under 6 | 0 (0.0%) | 0 (0.0%) |
| 6 to 18 Years | 21 (100.0%) | 0 (0.0%) |
| 19 to 25 Years | 64 (18.0%) | 250 (70.4%) |
| 25 to 34 Years | 0 (0.0%) | 54 (61.4%) |
| 35 to 44 Years | 18 (100.0%) | 0 (0.0%) |
| 45 to 54 Years | 3 (0.9%) | 312 (99.1%) |
| 55 to 64 Years | 34 (34.0%) | 58 (58.0%) |
| 65 to 74 Years | 101 (100.0%) | 10 (9.9%) |
| 75 Years and over | 76 (100.0%) | 35 (46.1%) |
| Total | 317 (29.5%) | 719 (66.9%) |
Disability Status by Sex by Age in Chisholm
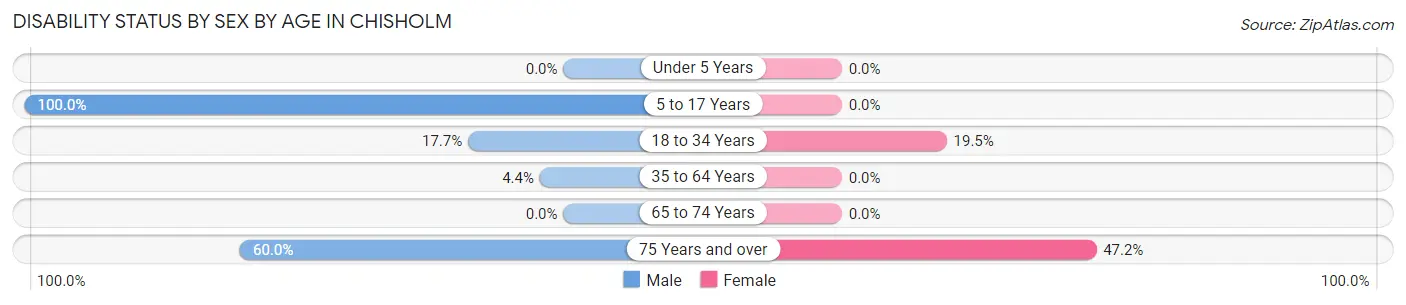
| Age Bracket | Male | Female |
| Under 5 Years | 0 (0.0%) | 0 (0.0%) |
| 5 to 17 Years | 11 (100.0%) | 0 (0.0%) |
| 18 to 34 Years | 52 (17.7%) | 29 (19.5%) |
| 35 to 64 Years | 9 (4.4%) | 0 (0.0%) |
| 65 to 74 Years | 0 (0.0%) | 0 (0.0%) |
| 75 Years and over | 24 (60.0%) | 17 (47.2%) |
Disability Class by Sex by Age in Chisholm
Disability Class: Hearing Difficulty
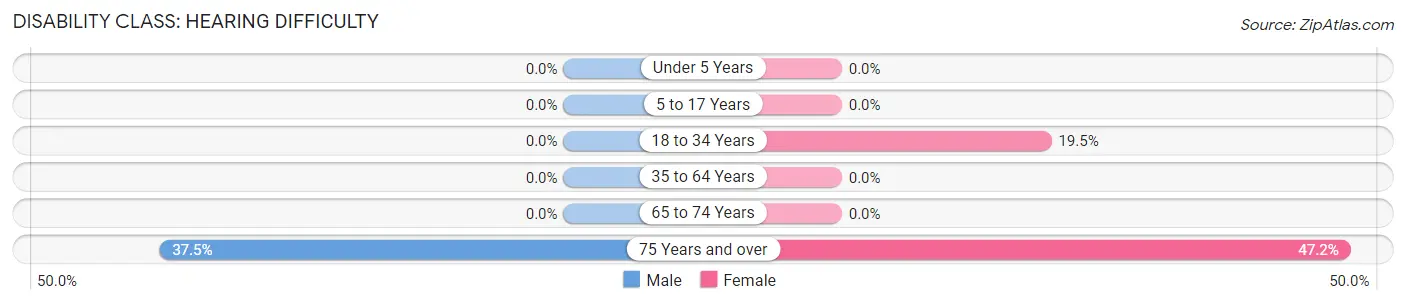
| Age Bracket | Male | Female |
| Under 5 Years | 0 (0.0%) | 0 (0.0%) |
| 5 to 17 Years | 0 (0.0%) | 0 (0.0%) |
| 18 to 34 Years | 0 (0.0%) | 29 (19.5%) |
| 35 to 64 Years | 0 (0.0%) | 0 (0.0%) |
| 65 to 74 Years | 0 (0.0%) | 0 (0.0%) |
| 75 Years and over | 15 (37.5%) | 17 (47.2%) |
Disability Class: Vision Difficulty
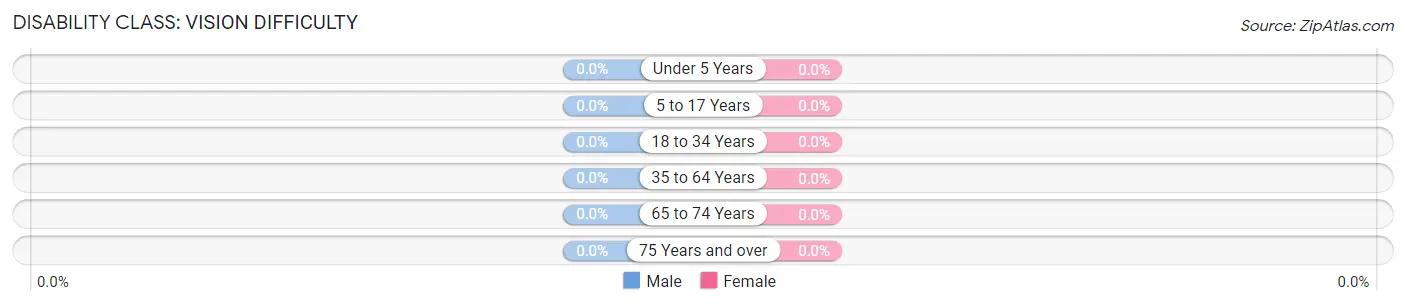
| Age Bracket | Male | Female |
| Under 5 Years | 0 (0.0%) | 0 (0.0%) |
| 5 to 17 Years | 0 (0.0%) | 0 (0.0%) |
| 18 to 34 Years | 0 (0.0%) | 0 (0.0%) |
| 35 to 64 Years | 0 (0.0%) | 0 (0.0%) |
| 65 to 74 Years | 0 (0.0%) | 0 (0.0%) |
| 75 Years and over | 0 (0.0%) | 0 (0.0%) |
Disability Class: Cognitive Difficulty
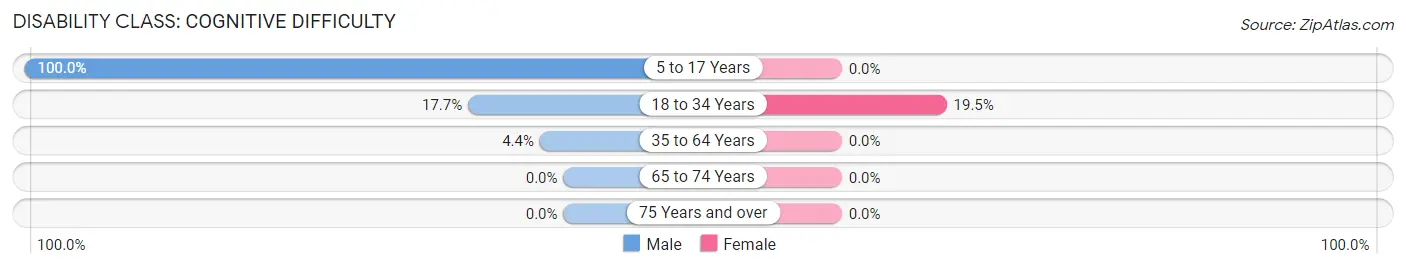
| Age Bracket | Male | Female |
| 5 to 17 Years | 11 (100.0%) | 0 (0.0%) |
| 18 to 34 Years | 52 (17.7%) | 29 (19.5%) |
| 35 to 64 Years | 9 (4.4%) | 0 (0.0%) |
| 65 to 74 Years | 0 (0.0%) | 0 (0.0%) |
| 75 Years and over | 0 (0.0%) | 0 (0.0%) |
Disability Class: Ambulatory Difficulty
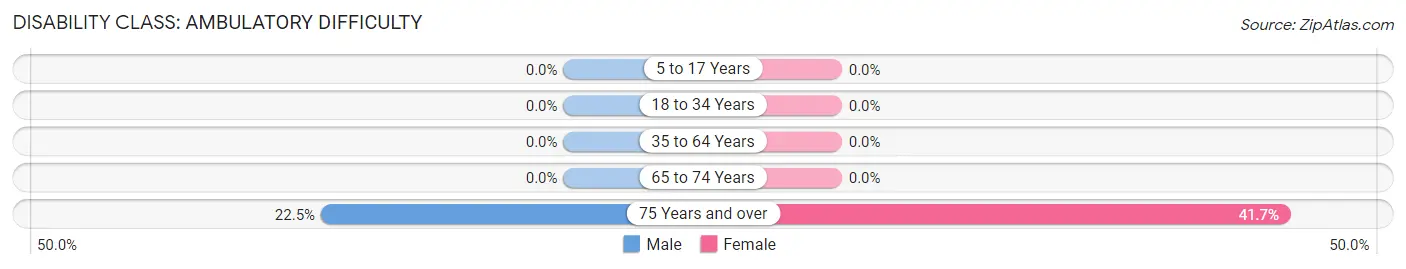
| Age Bracket | Male | Female |
| 5 to 17 Years | 0 (0.0%) | 0 (0.0%) |
| 18 to 34 Years | 0 (0.0%) | 0 (0.0%) |
| 35 to 64 Years | 0 (0.0%) | 0 (0.0%) |
| 65 to 74 Years | 0 (0.0%) | 0 (0.0%) |
| 75 Years and over | 9 (22.5%) | 15 (41.7%) |
Disability Class: Self-Care Difficulty
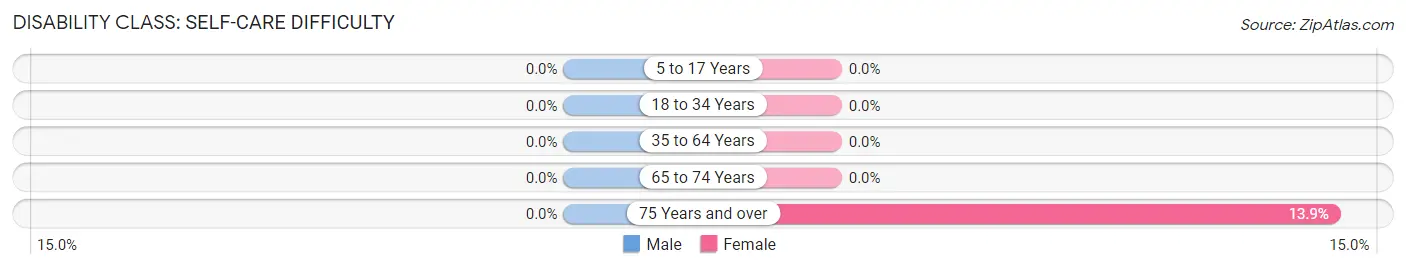
| Age Bracket | Male | Female |
| 5 to 17 Years | 0 (0.0%) | 0 (0.0%) |
| 18 to 34 Years | 0 (0.0%) | 0 (0.0%) |
| 35 to 64 Years | 0 (0.0%) | 0 (0.0%) |
| 65 to 74 Years | 0 (0.0%) | 0 (0.0%) |
| 75 Years and over | 0 (0.0%) | 5 (13.9%) |
Technology Access in Chisholm
Computing Device Access in Chisholm
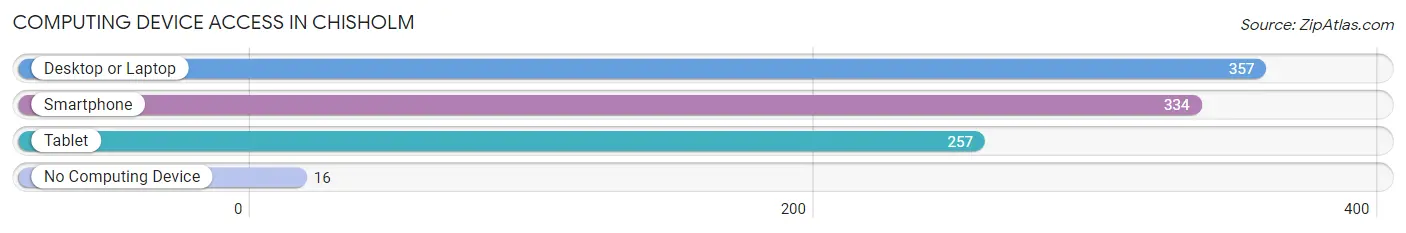
| Device Type | # Households | % Households |
| Desktop or Laptop | 357 | 90.8% |
| Smartphone | 334 | 85.0% |
| Tablet | 257 | 65.4% |
| No Computing Device | 16 | 4.1% |
| Total | 393 | 100.0% |
Internet Access in Chisholm
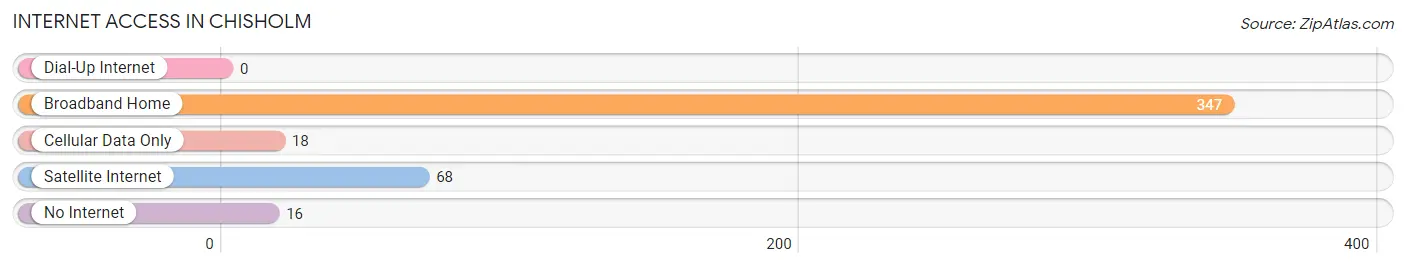
| Internet Type | # Households | % Households |
| Dial-Up Internet | 0 | 0.0% |
| Broadband Home | 347 | 88.3% |
| Cellular Data Only | 18 | 4.6% |
| Satellite Internet | 68 | 17.3% |
| No Internet | 16 | 4.1% |
| Total | 393 | 100.0% |
Chisholm Summary
Chisholm, Maine is a small town located in the northern part of the state, in Aroostook County. It is situated on the banks of the Aroostook River, and is bordered by the towns of Presque Isle, Caribou, and Limestone. The town was first settled in 1820, and was incorporated in 1837.
History
The first settlers of Chisholm were of French-Canadian descent, and the town was originally known as “St. John’s”. The name was changed to Chisholm in 1837, after the first settler, John Chisholm. The town was primarily a farming community, and the main crops were potatoes, oats, and hay. In the late 1800s, the town began to develop a lumber industry, and by the early 1900s, it had become the largest lumber producer in the state.
The town was also home to a number of small businesses, including a grist mill, a sawmill, a blacksmith shop, and a general store. In the early 1900s, the town also had a hotel, a post office, and a school.
Geography
Chisholm is located in the northern part of Maine, in Aroostook County. It is situated on the banks of the Aroostook River, and is bordered by the towns of Presque Isle, Caribou, and Limestone. The town covers an area of approximately 11 square miles, and has a population of approximately 1,500 people.
The town is located in a rural area, and is surrounded by forests and farmland. The terrain is mostly flat, with some rolling hills. The climate is generally cold and snowy in the winter, and mild and humid in the summer.
Economy
The economy of Chisholm is primarily based on agriculture and forestry. The town is home to a number of small farms, and the main crops are potatoes, oats, and hay. The town also has a number of small businesses, including a grist mill, a sawmill, a blacksmith shop, and a general store.
The town is also home to a number of small manufacturing companies, including a furniture factory, a paper mill, and a woodworking shop. The town also has a number of small retail stores, including a grocery store, a hardware store, and a clothing store.
Demographics
As of the 2010 census, the population of Chisholm was 1,521. The racial makeup of the town was 97.3% White, 0.7% African American, 0.2% Native American, 0.2% Asian, 0.1% Pacific Islander, 0.3% from other races, and 1.3% from two or more races. Hispanic or Latino of any race were 1.2% of the population.
The median household income in Chisholm was $37,917, and the median family income was $45,625. The per capita income was $18,945. About 11.2% of families and 14.2% of the population were below the poverty line, including 18.2% of those under age 18 and 8.3% of those age 65 or over.
The town is served by the Aroostook County School District, and the town has one elementary school, one middle school, and one high school. The town also has a public library, a fire department, and a police department.
Common Questions
What is Per Capita Income in Chisholm?
Per Capita income in Chisholm is $31,115.
What is the Median Family Income in Chisholm?
Median Family Income in Chisholm is $90,938.
What is the Median Household income in Chisholm?
Median Household Income in Chisholm is $58,750.
What is Income or Wage Gap in Chisholm?
Income or Wage Gap in Chisholm is 6.8%.
Women in Chisholm earn 93.2 cents for every dollar earned by a man.
What is Inequality or Gini Index in Chisholm?
Inequality or Gini Index in Chisholm is 0.33.
What is the Total Population of Chisholm?
Total Population of Chisholm is 1,074.
What is the Total Male Population of Chisholm?
Total Male Population of Chisholm is 591.
What is the Total Female Population of Chisholm?
Total Female Population of Chisholm is 483.
What is the Ratio of Males per 100 Females in Chisholm?
There are 122.36 Males per 100 Females in Chisholm.
What is the Ratio of Females per 100 Males in Chisholm?
There are 81.73 Females per 100 Males in Chisholm.
What is the Median Population Age in Chisholm?
Median Population Age in Chisholm is 48.3 Years.
What is the Average Family Size in Chisholm
Average Family Size in Chisholm is 3.6 People.
What is the Average Household Size in Chisholm
Average Household Size in Chisholm is 2.7 People.
How Large is the Labor Force in Chisholm?
There are 790 People in the Labor Forcein in Chisholm.
What is the Percentage of People in the Labor Force in Chisholm?
75.0% of People are in the Labor Force in Chisholm.
What is the Unemployment Rate in Chisholm?
Unemployment Rate in Chisholm is 6.3%.