Ualapue, HI Map & Demographics
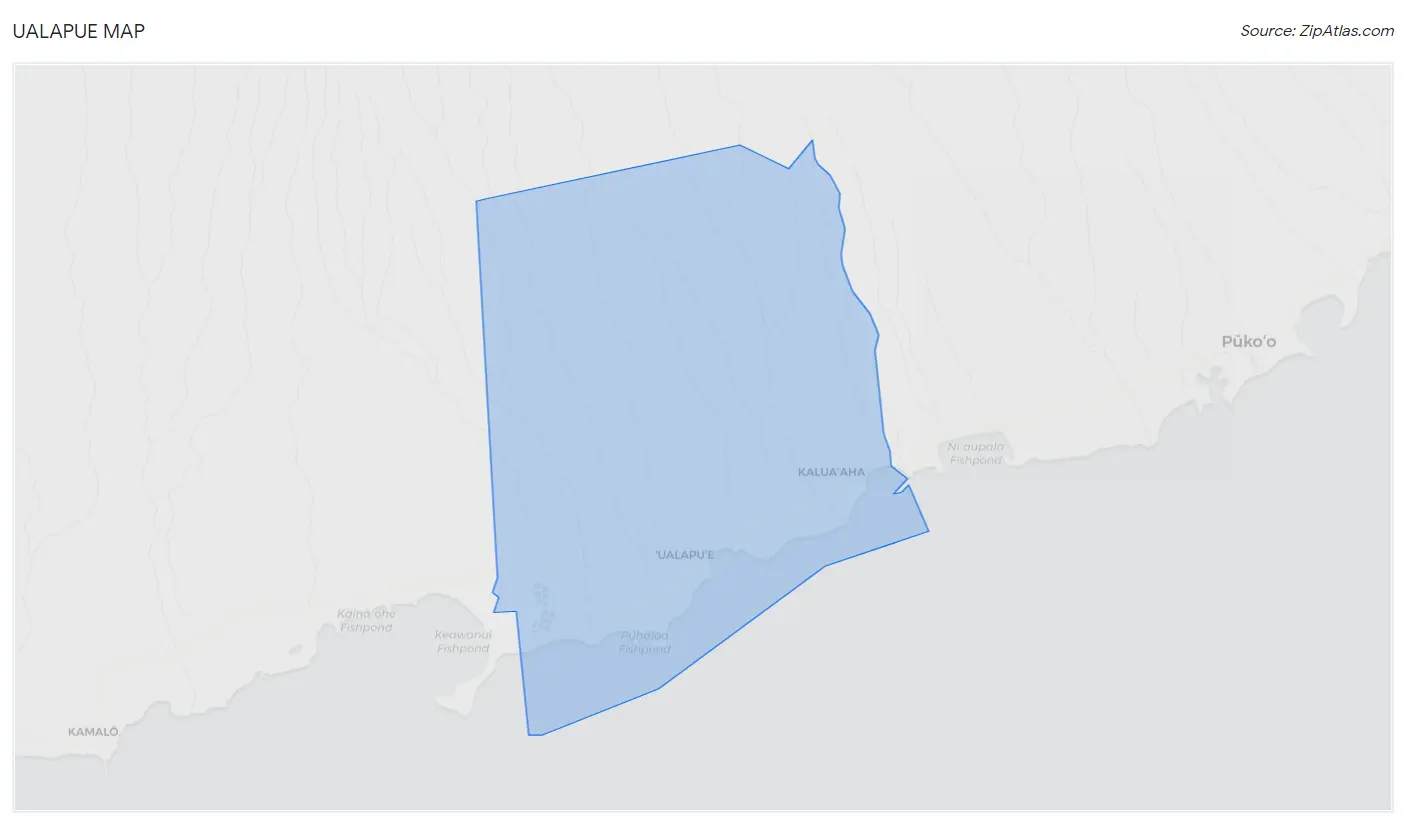
Ualapue Map
Ualapue Overview
$33,038
PER CAPITA INCOME
$85,893
AVG FAMILY INCOME
$54,457
AVG HOUSEHOLD INCOME
20.6%
WAGE / INCOME GAP [ % ]
79.4¢/ $1
WAGE / INCOME GAP [ $ ]
0.40
INEQUALITY / GINI INDEX
480
TOTAL POPULATION
234
MALE POPULATION
246
FEMALE POPULATION
95.12
MALES / 100 FEMALES
105.13
FEMALES / 100 MALES
42.3
MEDIAN AGE
3.2
AVG FAMILY SIZE
2.4
AVG HOUSEHOLD SIZE
194
LABOR FORCE [ PEOPLE ]
51.9%
PERCENT IN LABOR FORCE
Income in Ualapue
Income Overview in Ualapue
Per Capita Income in Ualapue is $33,038, while median incomes of families and households are $85,893 and $54,457 respectively.
| Characteristic | Number | Measure |
| Per Capita Income | 480 | $33,038 |
| Median Family Income | 119 | $85,893 |
| Mean Family Income | 119 | $95,714 |
| Median Household Income | 204 | $54,457 |
| Mean Household Income | 204 | $75,342 |
| Income Deficit | 119 | $0 |
| Wage / Income Gap (%) | 480 | 20.61% |
| Wage / Income Gap ($) | 480 | 79.39¢ per $1 |
| Gini / Inequality Index | 480 | 0.40 |
Earnings by Sex in Ualapue
Average Earnings in Ualapue are $38,333, $47,500 for men and $37,708 for women, a difference of 20.6%.
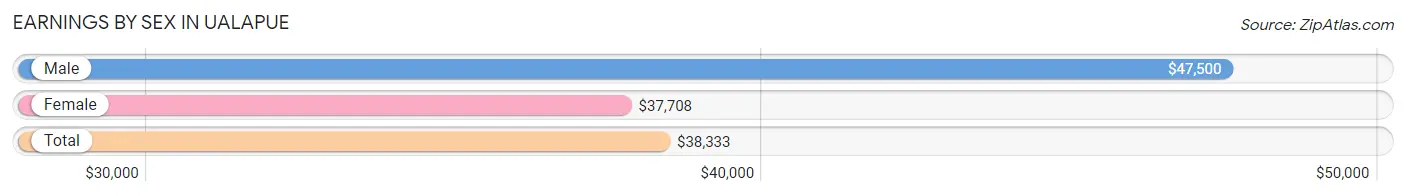
| Sex | Number | Average Earnings |
| Male | 80 (40.8%) | $47,500 |
| Female | 116 (59.2%) | $37,708 |
| Total | 196 (100.0%) | $38,333 |
Earnings by Sex by Income Bracket in Ualapue
The most common earnings brackets in Ualapue are $45,000 to $49,999 for men (15 | 18.8%) and $30,000 to $34,999 for women (30 | 25.9%).
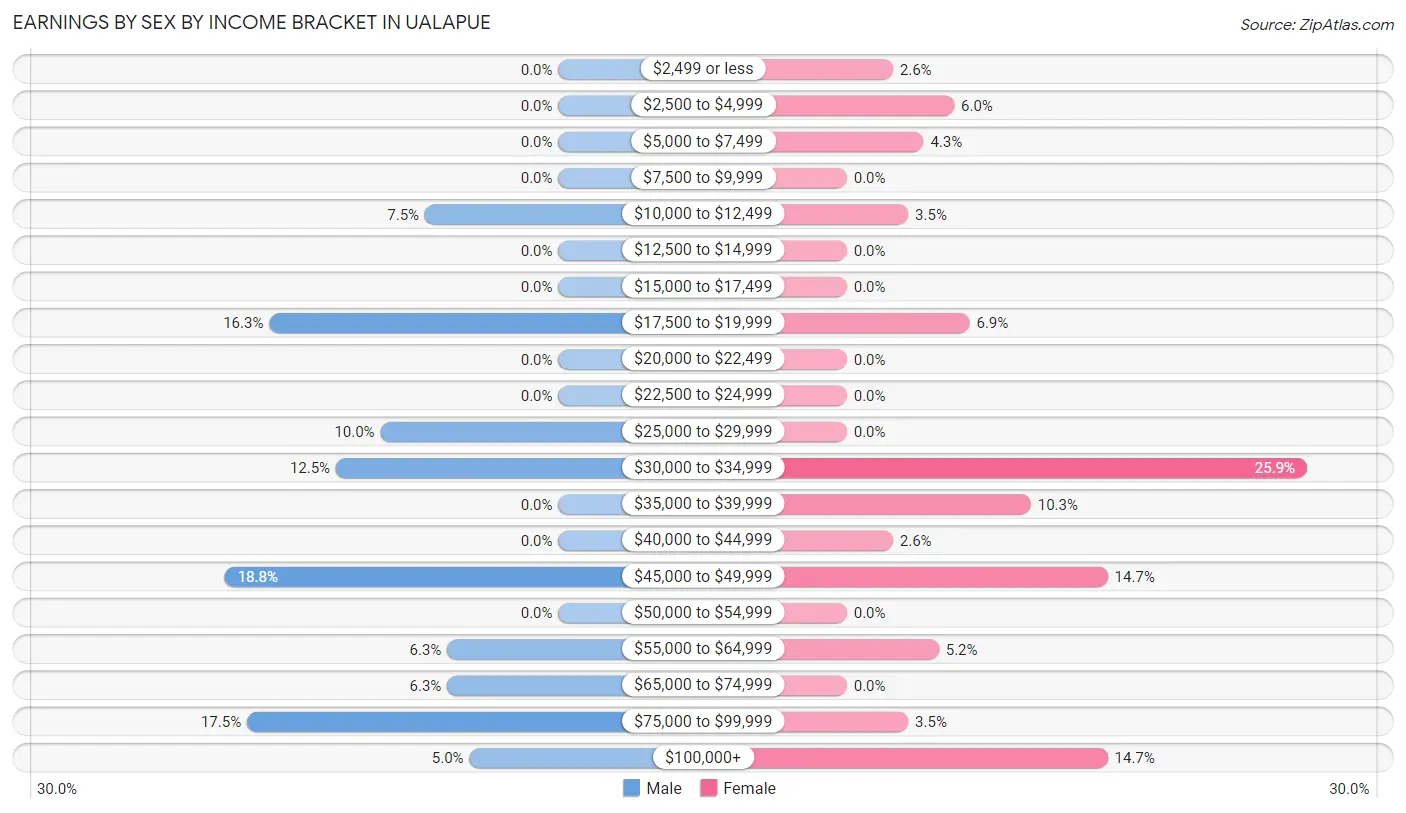
| Income | Male | Female |
| $2,499 or less | 0 (0.0%) | 3 (2.6%) |
| $2,500 to $4,999 | 0 (0.0%) | 7 (6.0%) |
| $5,000 to $7,499 | 0 (0.0%) | 5 (4.3%) |
| $7,500 to $9,999 | 0 (0.0%) | 0 (0.0%) |
| $10,000 to $12,499 | 6 (7.5%) | 4 (3.5%) |
| $12,500 to $14,999 | 0 (0.0%) | 0 (0.0%) |
| $15,000 to $17,499 | 0 (0.0%) | 0 (0.0%) |
| $17,500 to $19,999 | 13 (16.3%) | 8 (6.9%) |
| $20,000 to $22,499 | 0 (0.0%) | 0 (0.0%) |
| $22,500 to $24,999 | 0 (0.0%) | 0 (0.0%) |
| $25,000 to $29,999 | 8 (10.0%) | 0 (0.0%) |
| $30,000 to $34,999 | 10 (12.5%) | 30 (25.9%) |
| $35,000 to $39,999 | 0 (0.0%) | 12 (10.3%) |
| $40,000 to $44,999 | 0 (0.0%) | 3 (2.6%) |
| $45,000 to $49,999 | 15 (18.8%) | 17 (14.7%) |
| $50,000 to $54,999 | 0 (0.0%) | 0 (0.0%) |
| $55,000 to $64,999 | 5 (6.2%) | 6 (5.2%) |
| $65,000 to $74,999 | 5 (6.2%) | 0 (0.0%) |
| $75,000 to $99,999 | 14 (17.5%) | 4 (3.5%) |
| $100,000+ | 4 (5.0%) | 17 (14.7%) |
| Total | 80 (100.0%) | 116 (100.0%) |
Earnings by Sex by Educational Attainment in Ualapue
Average earnings in Ualapue are $47,500 for men and $34,286 for women, a difference of 27.8%. Men with an educational attainment of college or associate's degree enjoy the highest average annual earnings of $47,604, while those with college or associate's degree education earn the least with $47,604. Women with an educational attainment of graduate degree earn the most with the average annual earnings of $118,125, while those with high school diploma education have the smallest earnings of $34,500.
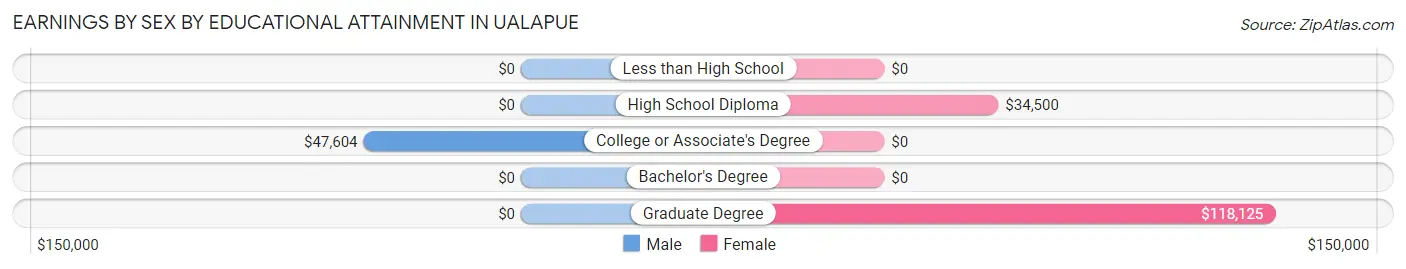
| Educational Attainment | Male Income | Female Income |
| Less than High School | - | - |
| High School Diploma | - | - |
| College or Associate's Degree | $47,604 | $0 |
| Bachelor's Degree | - | - |
| Graduate Degree | - | - |
| Total | $47,500 | $34,286 |
Family Income in Ualapue
Family Income Brackets in Ualapue
According to the Ualapue family income data, there are 28 families falling into the $100,000 to $149,999 income range, which is the most common income bracket and makes up 23.5% of all families. Conversely, the $15,000 to $24,999 income bracket is the least frequent group with only 1 families (0.8%) belonging to this category.
| Income Bracket | # Families | % Families |
| Less than $10,000 | 5 | 4.2% |
| $10,000 to $14,999 | 5 | 4.2% |
| $15,000 to $24,999 | 1 | 0.8% |
| $25,000 to $34,999 | 17 | 14.3% |
| $35,000 to $49,999 | 14 | 11.8% |
| $50,000 to $74,999 | 12 | 10.1% |
| $75,000 to $99,999 | 17 | 14.3% |
| $100,000 to $149,999 | 28 | 23.5% |
| $150,000 to $199,999 | 16 | 13.4% |
| $200,000+ | 4 | 3.4% |
Family Income by Famaliy Size in Ualapue
5-person families (17 | 14.3%) account for the highest median family income in Ualapue with $135,568 per family, while 2-person families (76 | 63.9%) have the highest median income of $35,750 per family member.
| Income Bracket | # Families | Median Income |
| 2-Person Families | 76 (63.9%) | $71,500 |
| 3-Person Families | 5 (4.2%) | $0 |
| 4-Person Families | 18 (15.1%) | $91,875 |
| 5-Person Families | 17 (14.3%) | $135,568 |
| 6-Person Families | 0 (0.0%) | $0 |
| 7+ Person Families | 3 (2.5%) | $0 |
| Total | 119 (100.0%) | $85,893 |
Family Income by Number of Earners in Ualapue
| Number of Earners | # Families | Median Income |
| No Earners | 30 (25.2%) | $0 |
| 1 Earner | 47 (39.5%) | $0 |
| 2 Earners | 35 (29.4%) | $90,417 |
| 3+ Earners | 7 (5.9%) | $0 |
| Total | 119 (100.0%) | $85,893 |
Household Income in Ualapue
Household Income Brackets in Ualapue
With 47 households falling in the category, the $50,000 to $74,999 income range is the most frequent in Ualapue, accounting for 23.0% of all households. In contrast, only 4 households (2.0%) fall into the $200,000+ income bracket, making it the least populous group.
| Income Bracket | # Households | % Households |
| Less than $10,000 | 6 | 2.9% |
| $10,000 to $14,999 | 5 | 2.5% |
| $15,000 to $24,999 | 21 | 10.3% |
| $25,000 to $34,999 | 28 | 13.7% |
| $35,000 to $49,999 | 21 | 10.3% |
| $50,000 to $74,999 | 47 | 23.0% |
| $75,000 to $99,999 | 26 | 12.7% |
| $100,000 to $149,999 | 30 | 14.7% |
| $150,000 to $199,999 | 16 | 7.8% |
| $200,000+ | 4 | 2.0% |
Household Income by Householder Age in Ualapue
The median household income in Ualapue is $54,457, with the highest median household income of $70,250 found in the 25 to 44 years age bracket for the primary householder. A total of 59 households (28.9%) fall into this category.
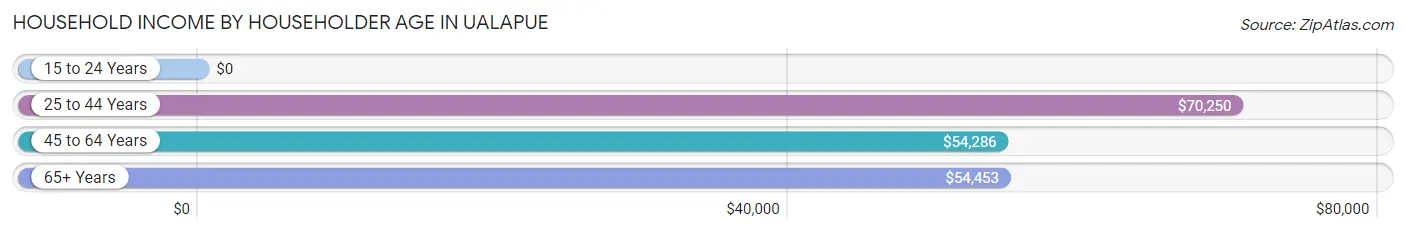
| Income Bracket | # Households | Median Income |
| 15 to 24 Years | 0 (0.0%) | $0 |
| 25 to 44 Years | 59 (28.9%) | $70,250 |
| 45 to 64 Years | 72 (35.3%) | $54,286 |
| 65+ Years | 73 (35.8%) | $54,453 |
| Total | 204 (100.0%) | $54,457 |
Poverty in Ualapue
Income Below Poverty by Sex and Age in Ualapue
With 7.7% poverty level for males and 6.9% for females among the residents of Ualapue, 12 to 14 year old males and 35 to 44 year old females are the most vulnerable to poverty, with 6 males (60.0%) and 4 females (16.0%) in their respective age groups living below the poverty level.
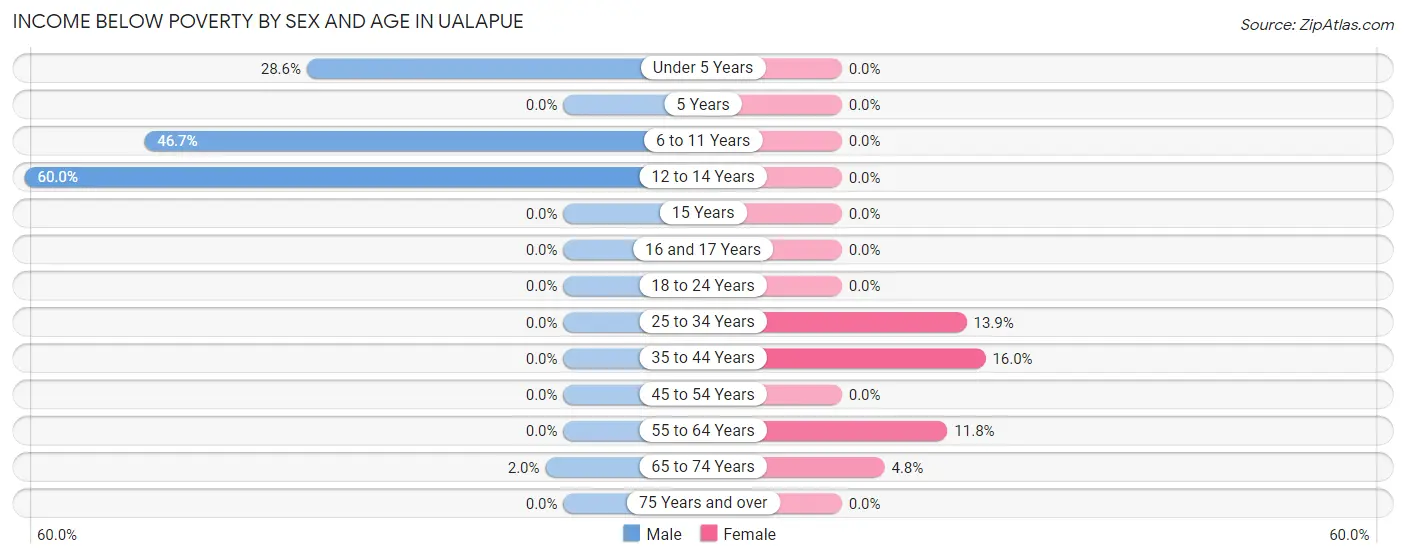
| Age Bracket | Male | Female |
| Under 5 Years | 4 (28.6%) | 0 (0.0%) |
| 5 Years | 0 (0.0%) | 0 (0.0%) |
| 6 to 11 Years | 7 (46.7%) | 0 (0.0%) |
| 12 to 14 Years | 6 (60.0%) | 0 (0.0%) |
| 15 Years | 0 (0.0%) | 0 (0.0%) |
| 16 and 17 Years | 0 (0.0%) | 0 (0.0%) |
| 18 to 24 Years | 0 (0.0%) | 0 (0.0%) |
| 25 to 34 Years | 0 (0.0%) | 5 (13.9%) |
| 35 to 44 Years | 0 (0.0%) | 4 (16.0%) |
| 45 to 54 Years | 0 (0.0%) | 0 (0.0%) |
| 55 to 64 Years | 0 (0.0%) | 6 (11.8%) |
| 65 to 74 Years | 1 (2.0%) | 2 (4.8%) |
| 75 Years and over | 0 (0.0%) | 0 (0.0%) |
| Total | 18 (7.7%) | 17 (6.9%) |
Income Above Poverty by Sex and Age in Ualapue
According to the poverty statistics in Ualapue, males aged 5 years and females aged under 5 years are the age groups that are most secure financially, with 100.0% of males and 100.0% of females in these age groups living above the poverty line.
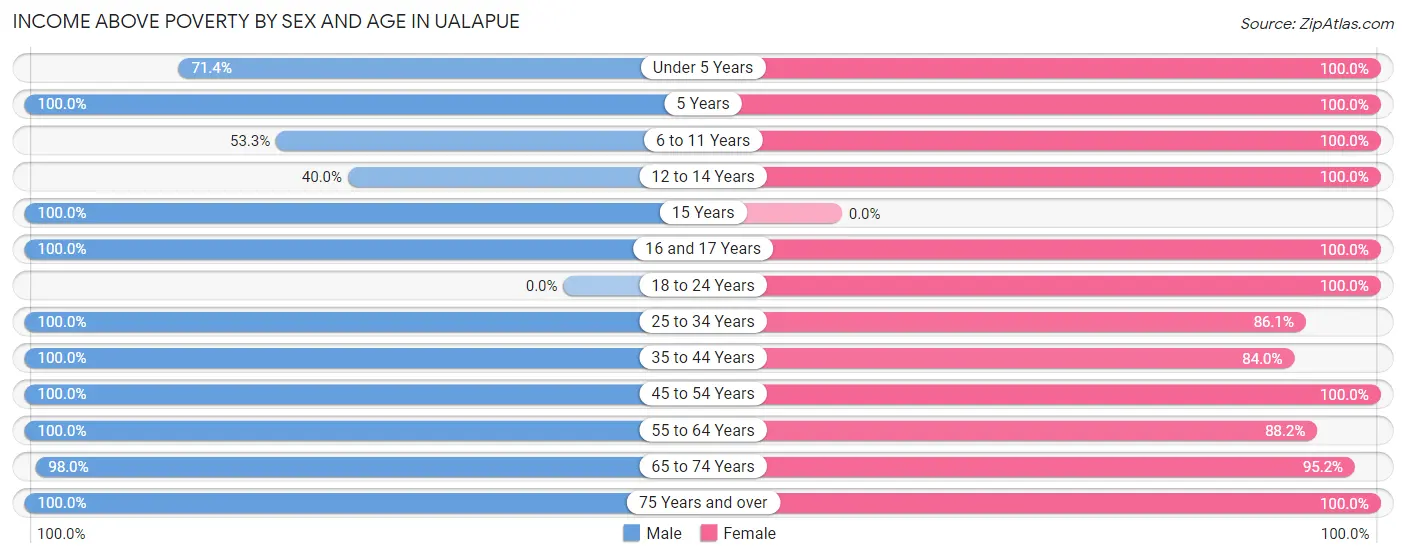
| Age Bracket | Male | Female |
| Under 5 Years | 10 (71.4%) | 19 (100.0%) |
| 5 Years | 3 (100.0%) | 11 (100.0%) |
| 6 to 11 Years | 8 (53.3%) | 9 (100.0%) |
| 12 to 14 Years | 4 (40.0%) | 12 (100.0%) |
| 15 Years | 13 (100.0%) | 0 (0.0%) |
| 16 and 17 Years | 18 (100.0%) | 6 (100.0%) |
| 18 to 24 Years | 0 (0.0%) | 9 (100.0%) |
| 25 to 34 Years | 34 (100.0%) | 31 (86.1%) |
| 35 to 44 Years | 11 (100.0%) | 21 (84.0%) |
| 45 to 54 Years | 7 (100.0%) | 19 (100.0%) |
| 55 to 64 Years | 14 (100.0%) | 45 (88.2%) |
| 65 to 74 Years | 49 (98.0%) | 40 (95.2%) |
| 75 Years and over | 45 (100.0%) | 7 (100.0%) |
| Total | 216 (92.3%) | 229 (93.1%) |
Income Below Poverty Among Married-Couple Families in Ualapue
The poverty statistics for married-couple families in Ualapue show that 1.0% or 1 of the total 97 families live below the poverty line. Families with no children have the highest poverty rate of 1.5%, comprising of 1 families. On the other hand, families with 1 or 2 children have the lowest poverty rate of 0.0%, which includes 0 families.
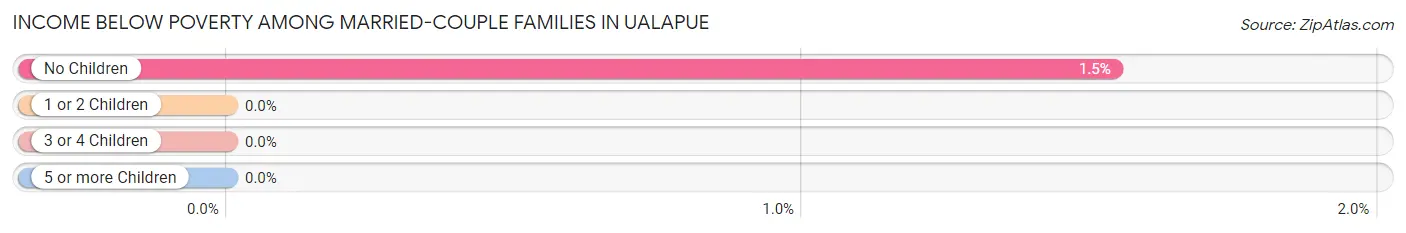
| Children | Above Poverty | Below Poverty |
| No Children | 64 (98.5%) | 1 (1.5%) |
| 1 or 2 Children | 15 (100.0%) | 0 (0.0%) |
| 3 or 4 Children | 14 (100.0%) | 0 (0.0%) |
| 5 or more Children | 3 (100.0%) | 0 (0.0%) |
| Total | 96 (99.0%) | 1 (1.0%) |
Income Below Poverty Among Single-Parent Households in Ualapue
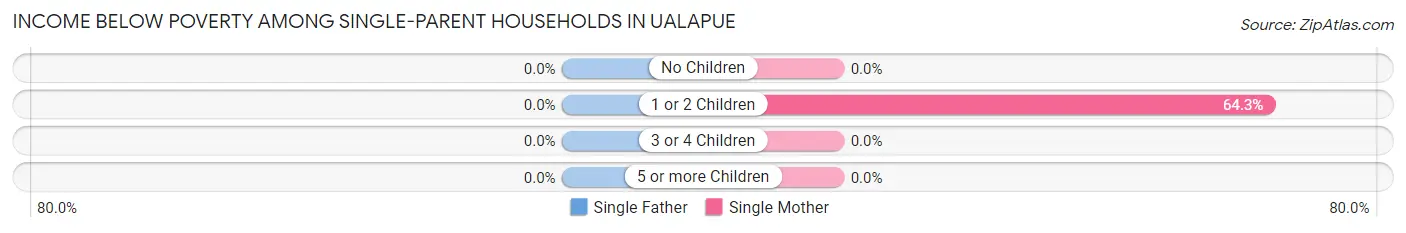
| Children | Single Father | Single Mother |
| No Children | 0 (0.0%) | 0 (0.0%) |
| 1 or 2 Children | 0 (0.0%) | 9 (64.3%) |
| 3 or 4 Children | 0 (0.0%) | 0 (0.0%) |
| 5 or more Children | 0 (0.0%) | 0 (0.0%) |
| Total | 0 (0.0%) | 9 (45.0%) |
Income Below Poverty Among Married-Couple vs Single-Parent Households in Ualapue
The poverty data for Ualapue shows that 1 of the married-couple family households (1.0%) and 9 of the single-parent households (40.9%) are living below the poverty level. Within the married-couple family households, those with no children have the highest poverty rate, with 1 households (1.5%) falling below the poverty line. Among the single-parent households, those with 1 or 2 children have the highest poverty rate, with 9 household (56.2%) living below poverty.
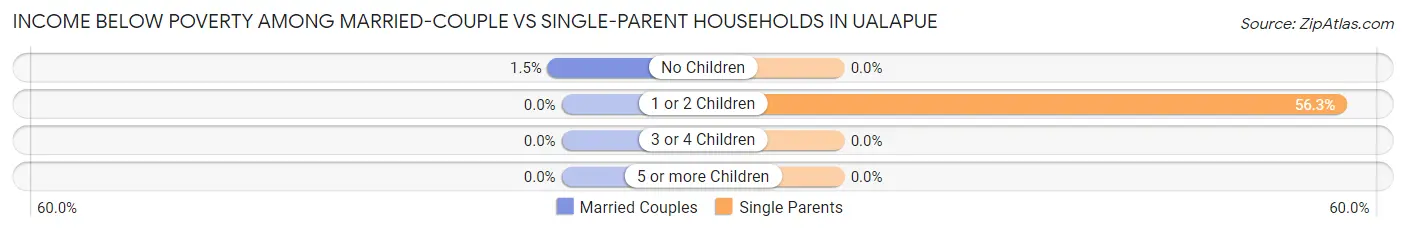
| Children | Married-Couple Families | Single-Parent Households |
| No Children | 1 (1.5%) | 0 (0.0%) |
| 1 or 2 Children | 0 (0.0%) | 9 (56.2%) |
| 3 or 4 Children | 0 (0.0%) | 0 (0.0%) |
| 5 or more Children | 0 (0.0%) | 0 (0.0%) |
| Total | 1 (1.0%) | 9 (40.9%) |
Race in Ualapue
The most populous races in Ualapue are Two or more Races (153 | 31.9%), Hawaiian / Pacific (150 | 31.2%), and White / Caucasian (140 | 29.2%).
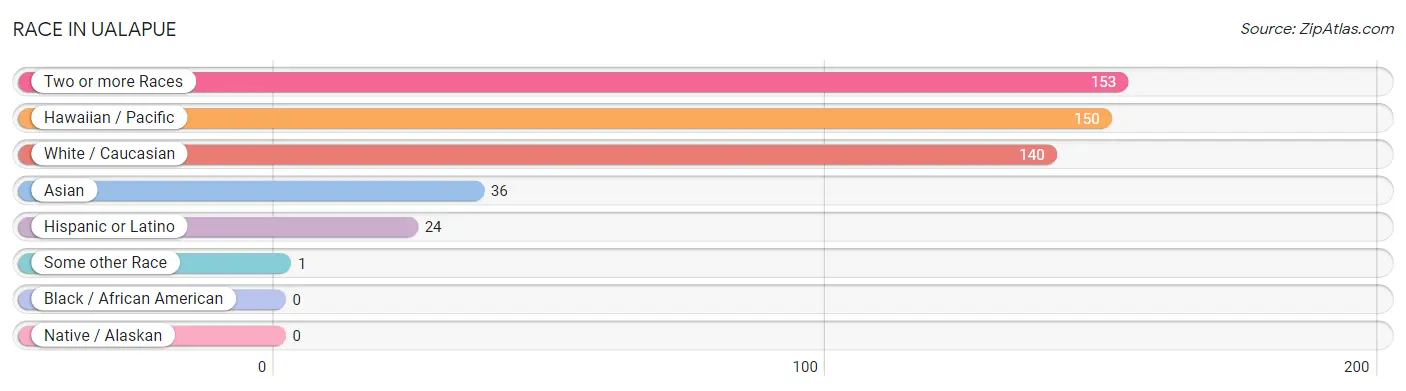
| Race | # Population | % Population |
| Asian | 36 | 7.5% |
| Black / African American | 0 | 0.0% |
| Hawaiian / Pacific | 150 | 31.2% |
| Hispanic or Latino | 24 | 5.0% |
| Native / Alaskan | 0 | 0.0% |
| White / Caucasian | 140 | 29.2% |
| Two or more Races | 153 | 31.9% |
| Some other Race | 1 | 0.2% |
| Total | 480 | 100.0% |
Ancestry in Ualapue
The most populous ancestries reported in Ualapue are Native Hawaiian (289 | 60.2%), Indian (Asian) (62 | 12.9%), Korean (48 | 10.0%), Irish (24 | 5.0%), and Bhutanese (23 | 4.8%), together accounting for 92.9% of all Ualapue residents.
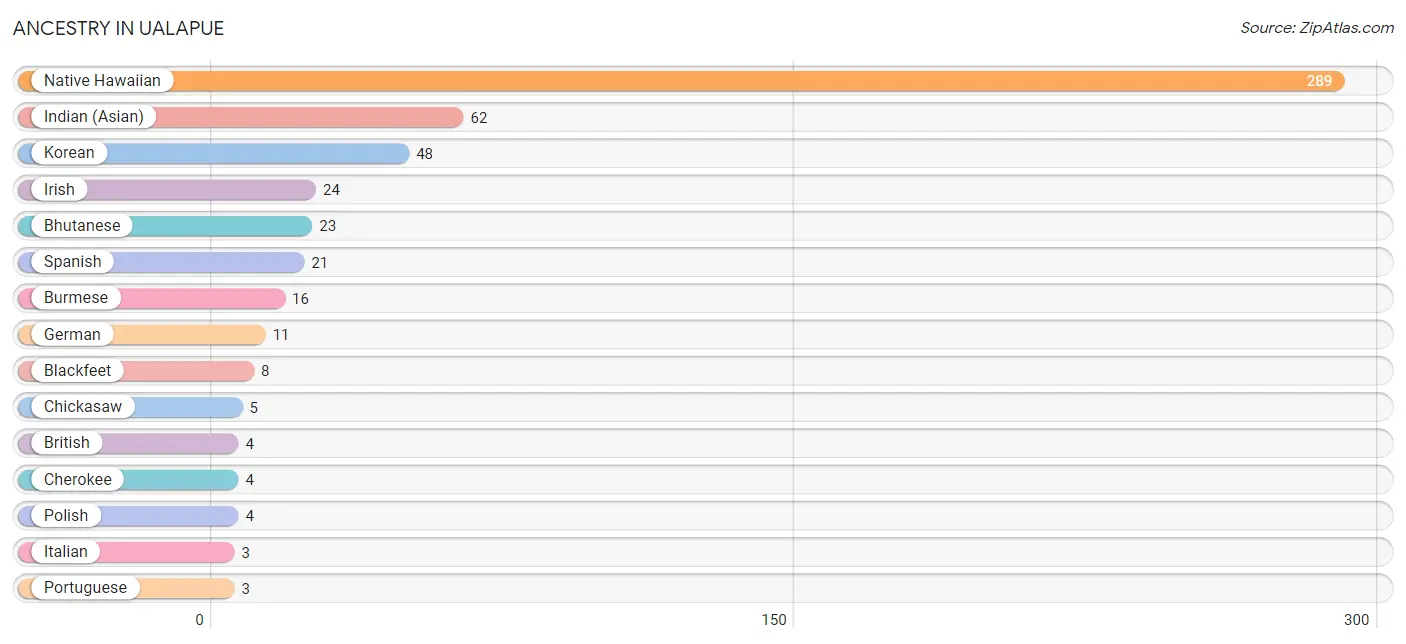
| Ancestry | # Population | % Population |
| Bhutanese | 23 | 4.8% |
| Blackfeet | 8 | 1.7% |
| British | 4 | 0.8% |
| Burmese | 16 | 3.3% |
| Cambodian | 2 | 0.4% |
| Cherokee | 4 | 0.8% |
| Chickasaw | 5 | 1.0% |
| English | 2 | 0.4% |
| Finnish | 2 | 0.4% |
| German | 11 | 2.3% |
| Indian (Asian) | 62 | 12.9% |
| Irish | 24 | 5.0% |
| Italian | 3 | 0.6% |
| Korean | 48 | 10.0% |
| Mexican | 1 | 0.2% |
| Native Hawaiian | 289 | 60.2% |
| Polish | 4 | 0.8% |
| Portuguese | 3 | 0.6% |
| Spaniard | 2 | 0.4% |
| Spanish | 21 | 4.4% | View All 20 Rows |
Immigrants in Ualapue
The most numerous immigrant groups reported in Ualapue came from Asia (8 | 1.7%), Philippines (8 | 1.7%), South Eastern Asia (8 | 1.7%), Europe (6 | 1.3%), and Northern Europe (4 | 0.8%), together accounting for 7.1% of all Ualapue residents.
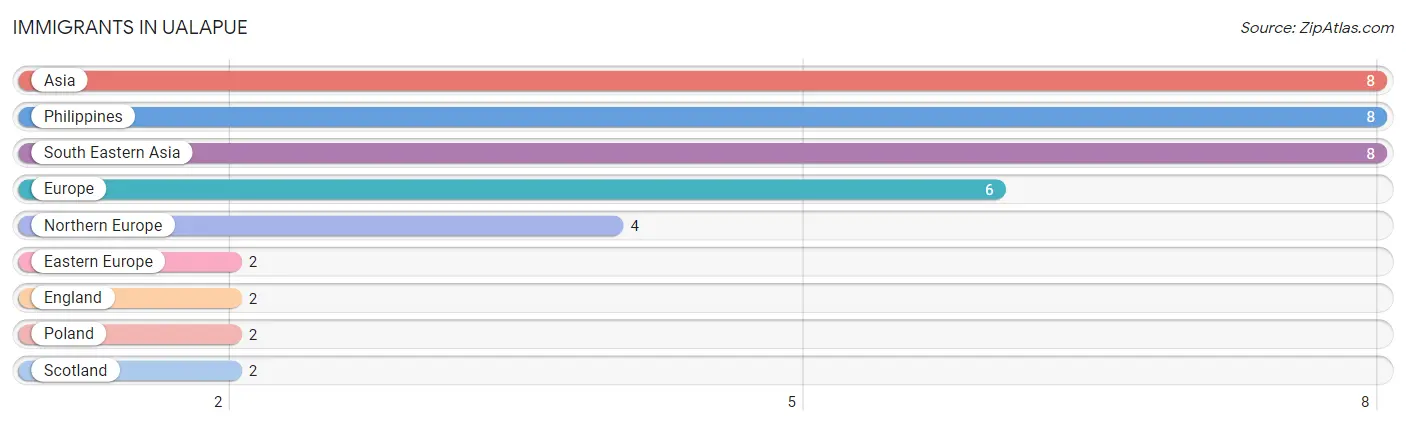
| Immigration Origin | # Population | % Population |
| Asia | 8 | 1.7% |
| Eastern Europe | 2 | 0.4% |
| England | 2 | 0.4% |
| Europe | 6 | 1.3% |
| Northern Europe | 4 | 0.8% |
| Philippines | 8 | 1.7% |
| Poland | 2 | 0.4% |
| Scotland | 2 | 0.4% |
| South Eastern Asia | 8 | 1.7% | View All 9 Rows |
Sex and Age in Ualapue
Sex and Age in Ualapue
The most populous age groups in Ualapue are 65 to 69 Years (43 | 18.4%) for men and 60 to 64 Years (37 | 15.0%) for women.
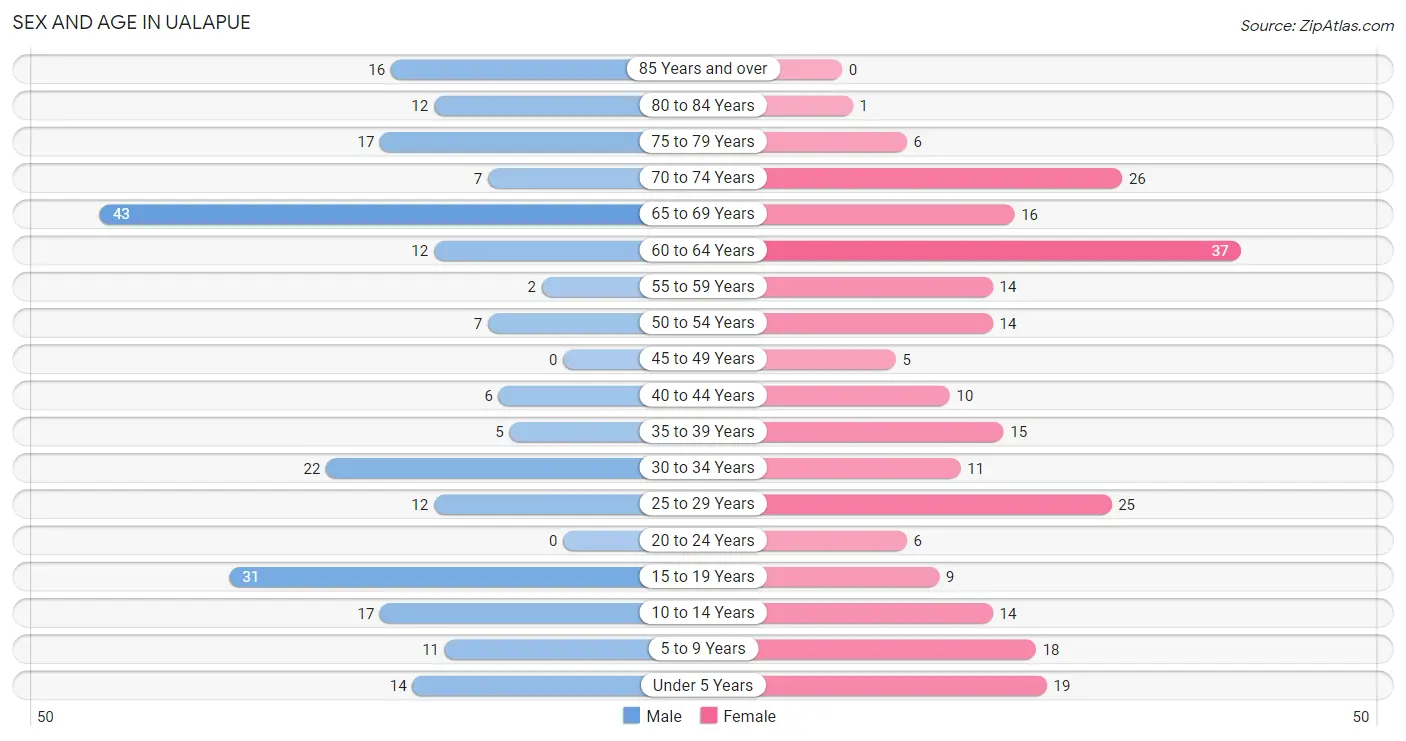
| Age Bracket | Male | Female |
| Under 5 Years | 14 (6.0%) | 19 (7.7%) |
| 5 to 9 Years | 11 (4.7%) | 18 (7.3%) |
| 10 to 14 Years | 17 (7.3%) | 14 (5.7%) |
| 15 to 19 Years | 31 (13.3%) | 9 (3.7%) |
| 20 to 24 Years | 0 (0.0%) | 6 (2.4%) |
| 25 to 29 Years | 12 (5.1%) | 25 (10.2%) |
| 30 to 34 Years | 22 (9.4%) | 11 (4.5%) |
| 35 to 39 Years | 5 (2.1%) | 15 (6.1%) |
| 40 to 44 Years | 6 (2.6%) | 10 (4.1%) |
| 45 to 49 Years | 0 (0.0%) | 5 (2.0%) |
| 50 to 54 Years | 7 (3.0%) | 14 (5.7%) |
| 55 to 59 Years | 2 (0.9%) | 14 (5.7%) |
| 60 to 64 Years | 12 (5.1%) | 37 (15.0%) |
| 65 to 69 Years | 43 (18.4%) | 16 (6.5%) |
| 70 to 74 Years | 7 (3.0%) | 26 (10.6%) |
| 75 to 79 Years | 17 (7.3%) | 6 (2.4%) |
| 80 to 84 Years | 12 (5.1%) | 1 (0.4%) |
| 85 Years and over | 16 (6.8%) | 0 (0.0%) |
| Total | 234 (100.0%) | 246 (100.0%) |
Families and Households in Ualapue
Median Family Size in Ualapue
The median family size in Ualapue is 3.21 persons per family, with single male/father families (2 | 1.7%) accounting for the largest median family size of 7 persons per family. On the other hand, single female/mother families (20 | 16.8%) represent the smallest median family size with 2.25 persons per family.
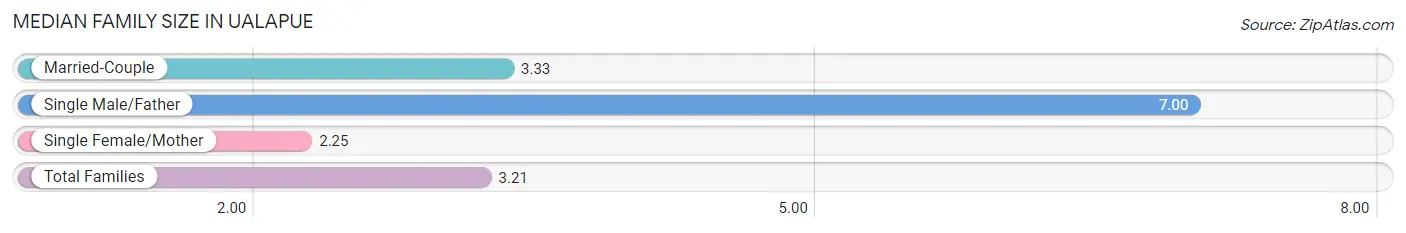
| Family Type | # Families | Family Size |
| Married-Couple | 97 (81.5%) | 3.33 |
| Single Male/Father | 2 (1.7%) | 7.00 |
| Single Female/Mother | 20 (16.8%) | 2.25 |
| Total Families | 119 (100.0%) | 3.21 |
Median Household Size in Ualapue
The median household size in Ualapue is 2.35 persons per household, with single male/father households (2 | 1.0%) accounting for the largest median household size of 7 persons per household. non-family households (85 | 41.7%) represent the smallest median household size with 1.08 persons per household.
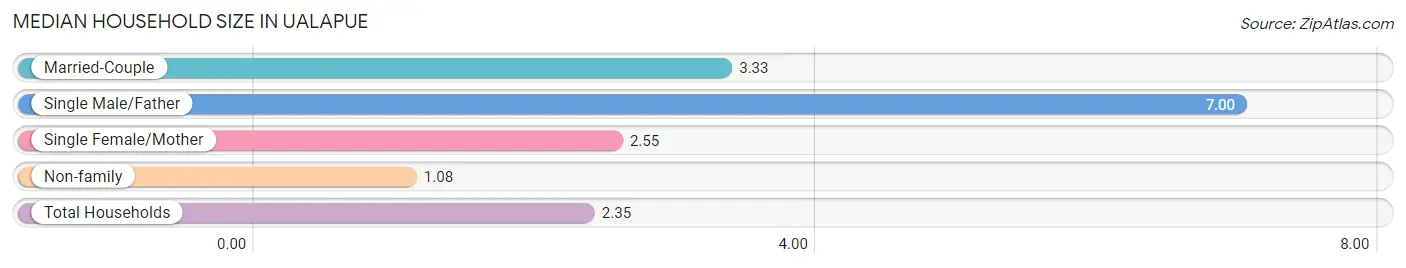
| Household Type | # Households | Household Size |
| Married-Couple | 97 (47.5%) | 3.33 |
| Single Male/Father | 2 (1.0%) | 7.00 |
| Single Female/Mother | 20 (9.8%) | 2.55 |
| Non-family | 85 (41.7%) | 1.08 |
| Total Households | 204 (100.0%) | 2.35 |
Household Size by Marriage Status in Ualapue
Out of a total of 204 households in Ualapue, 119 (58.3%) are family households, while 85 (41.7%) are nonfamily households. The most numerous type of family households are 2-person households, comprising 76, and the most common type of nonfamily households are 1-person households, comprising 80.
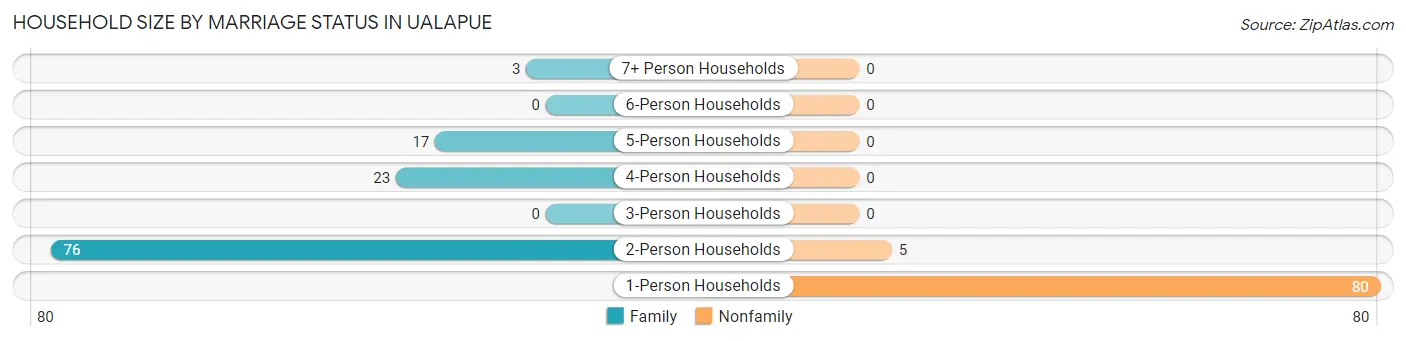
| Household Size | Family Households | Nonfamily Households |
| 1-Person Households | - | 80 (39.2%) |
| 2-Person Households | 76 (37.2%) | 5 (2.5%) |
| 3-Person Households | 0 (0.0%) | 0 (0.0%) |
| 4-Person Households | 23 (11.3%) | 0 (0.0%) |
| 5-Person Households | 17 (8.3%) | 0 (0.0%) |
| 6-Person Households | 0 (0.0%) | 0 (0.0%) |
| 7+ Person Households | 3 (1.5%) | 0 (0.0%) |
| Total | 119 (58.3%) | 85 (41.7%) |
Female Fertility in Ualapue
Fertility by Age in Ualapue
Average fertility rate in Ualapue is 68.0 births per 1,000 women. Women in the age bracket of 15 to 19 years have the highest fertility rate with 333.0 births per 1,000 women. Women in the age bracket of 15 to 19 years acount for 50.0% of all women with births.
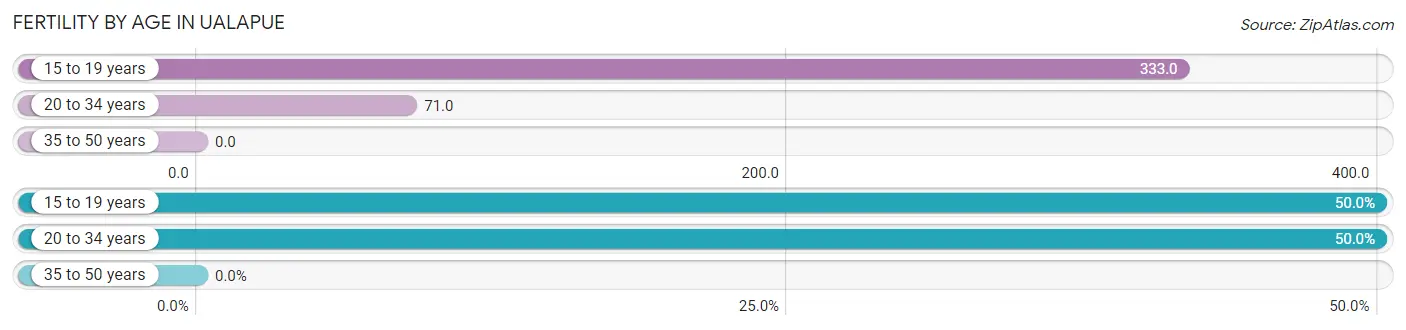
| Age Bracket | Women with Births | Births / 1,000 Women |
| 15 to 19 years | 3 (50.0%) | 333.0 |
| 20 to 34 years | 3 (50.0%) | 71.0 |
| 35 to 50 years | 0 (0.0%) | 0.0 |
| Total | 6 (100.0%) | 68.0 |
Fertility by Age by Marriage Status in Ualapue
50.0% of women with births (6) in Ualapue are married. The highest percentage of unmarried women with births falls into 15 to 19 years age bracket with 100.0% of them unmarried at the time of birth, while the lowest percentage of unmarried women with births belong to 20 to 34 years age bracket with 0.0% of them unmarried.
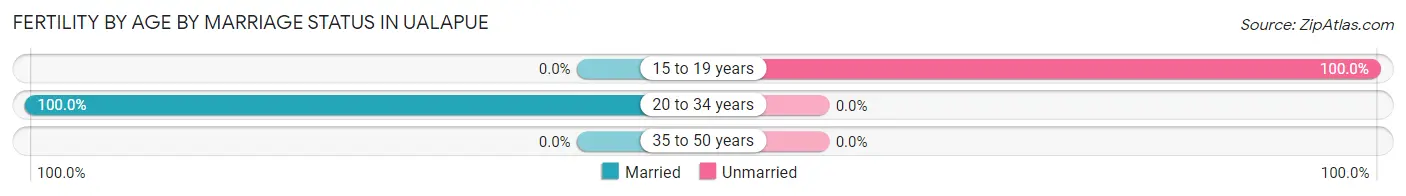
| Age Bracket | Married | Unmarried |
| 15 to 19 years | 0 (0.0%) | 3 (100.0%) |
| 20 to 34 years | 3 (100.0%) | 0 (0.0%) |
| 35 to 50 years | 0 (0.0%) | 0 (0.0%) |
| Total | 3 (50.0%) | 3 (50.0%) |
Fertility by Education in Ualapue
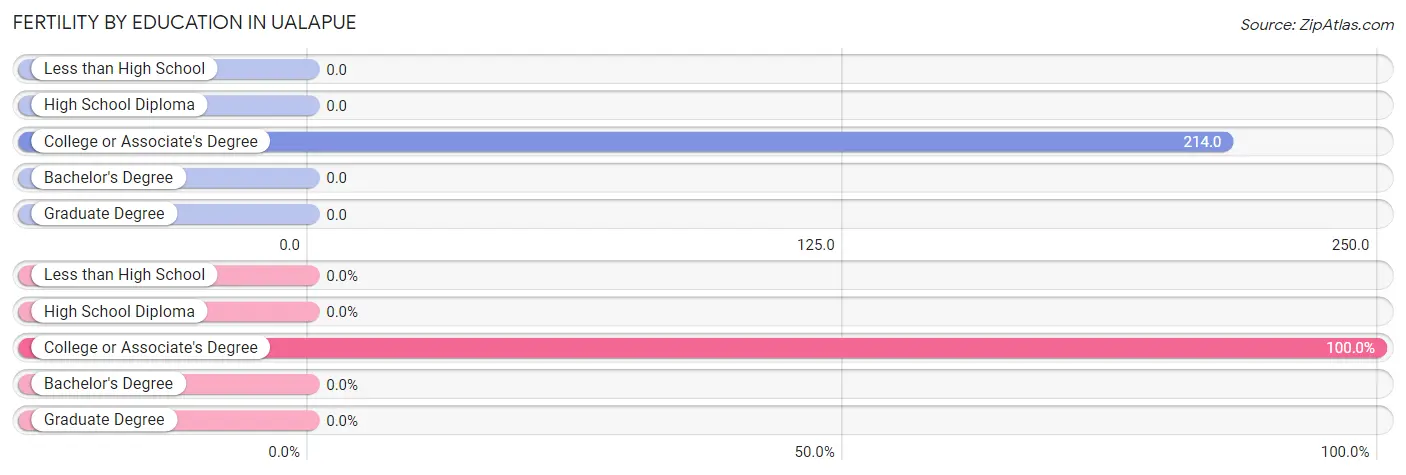
| Educational Attainment | Women with Births | Births / 1,000 Women |
| Less than High School | 0 (0.0%) | 0.0 |
| High School Diploma | 0 (0.0%) | 0.0 |
| College or Associate's Degree | 6 (100.0%) | 214.0 |
| Bachelor's Degree | 0 (0.0%) | 0.0 |
| Graduate Degree | 0 (0.0%) | 0.0 |
| Total | 6 (100.0%) | 68.0 |
Fertility by Education by Marriage Status in Ualapue
50.0% of women with births in Ualapue are unmarried. Women with the educational attainment of college or associate's degree are most likely to be married with 50.0% of them married at childbirth, while women with the educational attainment of college or associate's degree are least likely to be married with 50.0% of them unmarried at childbirth.
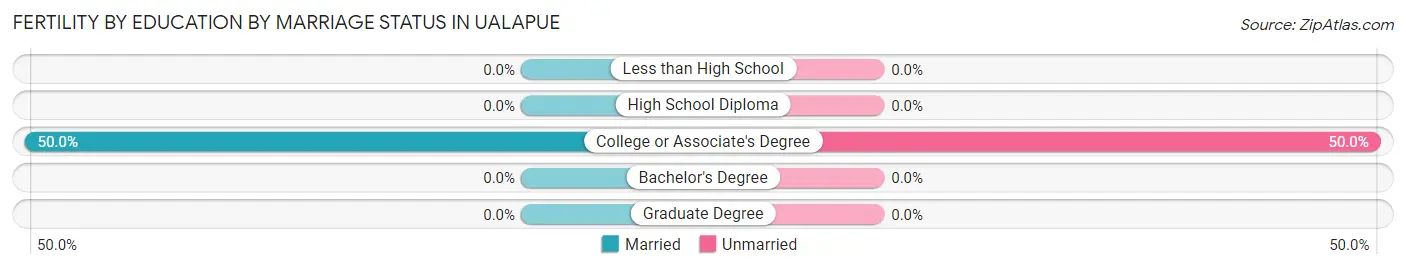
| Educational Attainment | Married | Unmarried |
| Less than High School | 0 (0.0%) | 0 (0.0%) |
| High School Diploma | 0 (0.0%) | 0 (0.0%) |
| College or Associate's Degree | 3 (50.0%) | 3 (50.0%) |
| Bachelor's Degree | 0 (0.0%) | 0 (0.0%) |
| Graduate Degree | 0 (0.0%) | 0 (0.0%) |
| Total | 3 (50.0%) | 3 (50.0%) |
Employment Characteristics in Ualapue
Employment by Class of Employer in Ualapue
Among the 194 employed individuals in Ualapue, private company employees (81 | 41.7%), state government employees (42 | 21.6%), and local government employees (34 | 17.5%) make up the most common classes of employment.
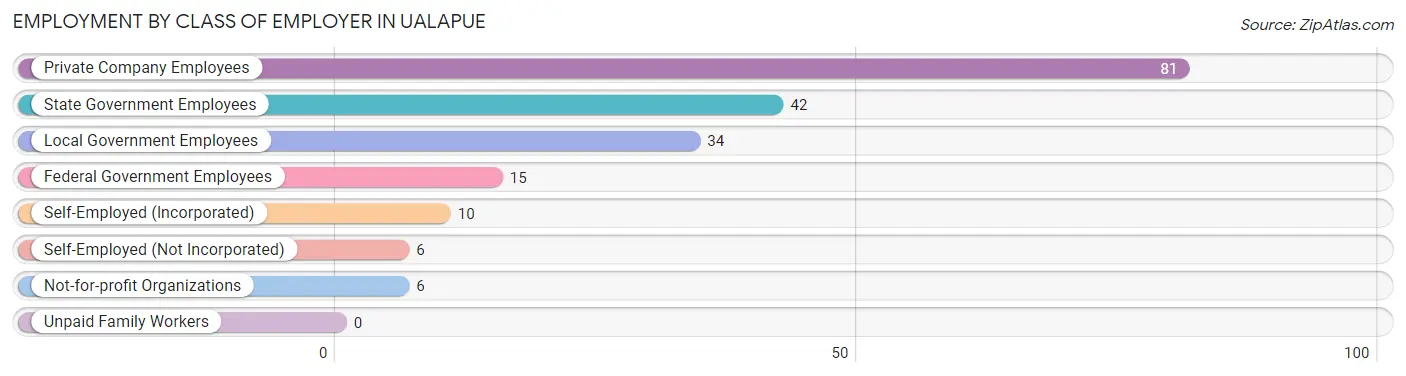
| Employer Class | # Employees | % Employees |
| Private Company Employees | 81 | 41.7% |
| Self-Employed (Incorporated) | 10 | 5.1% |
| Self-Employed (Not Incorporated) | 6 | 3.1% |
| Not-for-profit Organizations | 6 | 3.1% |
| Local Government Employees | 34 | 17.5% |
| State Government Employees | 42 | 21.6% |
| Federal Government Employees | 15 | 7.7% |
| Unpaid Family Workers | 0 | 0.0% |
| Total | 194 | 100.0% |
Employment Status by Age in Ualapue
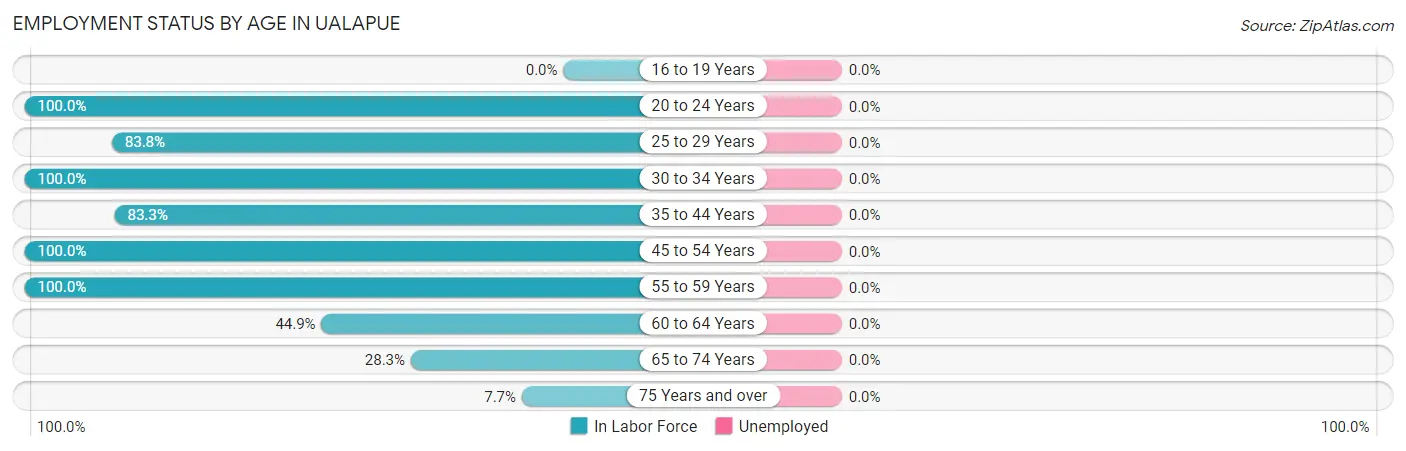
| Age Bracket | In Labor Force | Unemployed |
| 16 to 19 Years | 0 (0.0%) | 0 (0.0%) |
| 20 to 24 Years | 6 (100.0%) | 0 (0.0%) |
| 25 to 29 Years | 31 (83.8%) | 0 (0.0%) |
| 30 to 34 Years | 33 (100.0%) | 0 (0.0%) |
| 35 to 44 Years | 30 (83.3%) | 0 (0.0%) |
| 45 to 54 Years | 26 (100.0%) | 0 (0.0%) |
| 55 to 59 Years | 16 (100.0%) | 0 (0.0%) |
| 60 to 64 Years | 22 (44.9%) | 0 (0.0%) |
| 65 to 74 Years | 26 (28.3%) | 0 (0.0%) |
| 75 Years and over | 4 (7.7%) | 0 (0.0%) |
| Total | 194 (51.9%) | 0 (0.0%) |
Employment Status by Educational Attainment in Ualapue
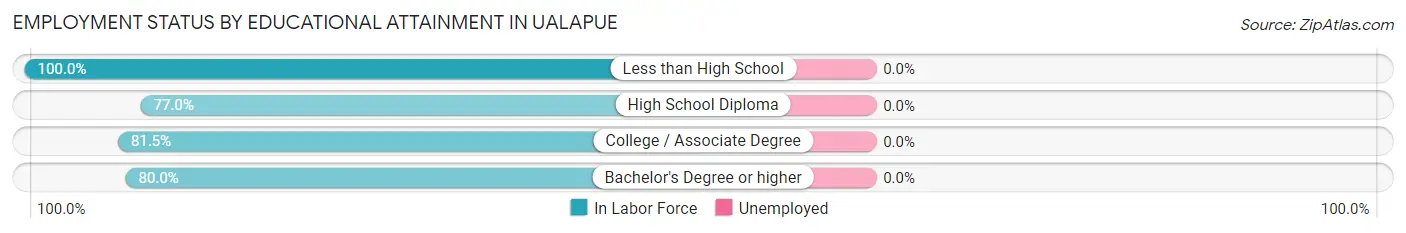
| Educational Attainment | In Labor Force | Unemployed |
| Less than High School | 4 (100.0%) | 0 (0.0%) |
| High School Diploma | 47 (77.0%) | 0 (0.0%) |
| College / Associate Degree | 75 (81.5%) | 0 (0.0%) |
| Bachelor's Degree or higher | 32 (80.0%) | 0 (0.0%) |
| Total | 158 (80.2%) | 0 (0.0%) |
Employment Occupations by Sex in Ualapue
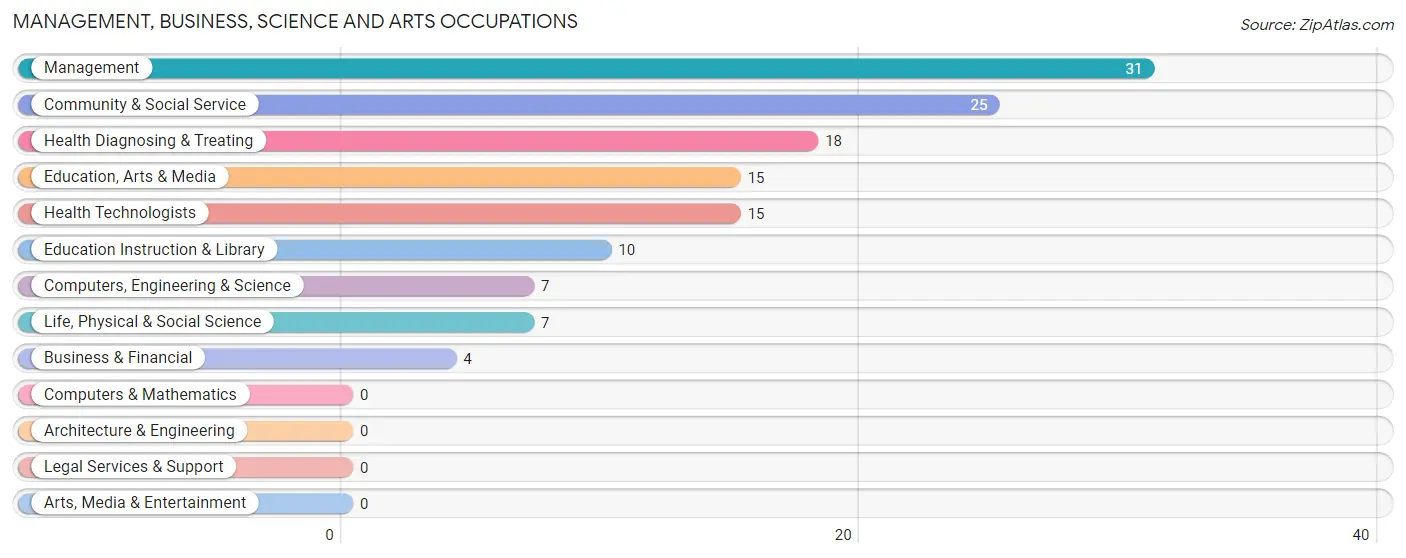
Management, Business, Science and Arts Occupations
The most common Management, Business, Science and Arts occupations in Ualapue are Management (31 | 16.4%), Community & Social Service (25 | 13.2%), Health Diagnosing & Treating (18 | 9.5%), Education, Arts & Media (15 | 7.9%), and Health Technologists (15 | 7.9%).
Management, Business, Science and Arts Occupations by Sex
Within the Management, Business, Science and Arts occupations in Ualapue, the most male-oriented occupations are Computers, Engineering & Science (100.0%), Life, Physical & Social Science (100.0%), and Education, Arts & Media (33.3%), while the most female-oriented occupations are Business & Financial (100.0%), Health Diagnosing & Treating (100.0%), and Health Technologists (100.0%).
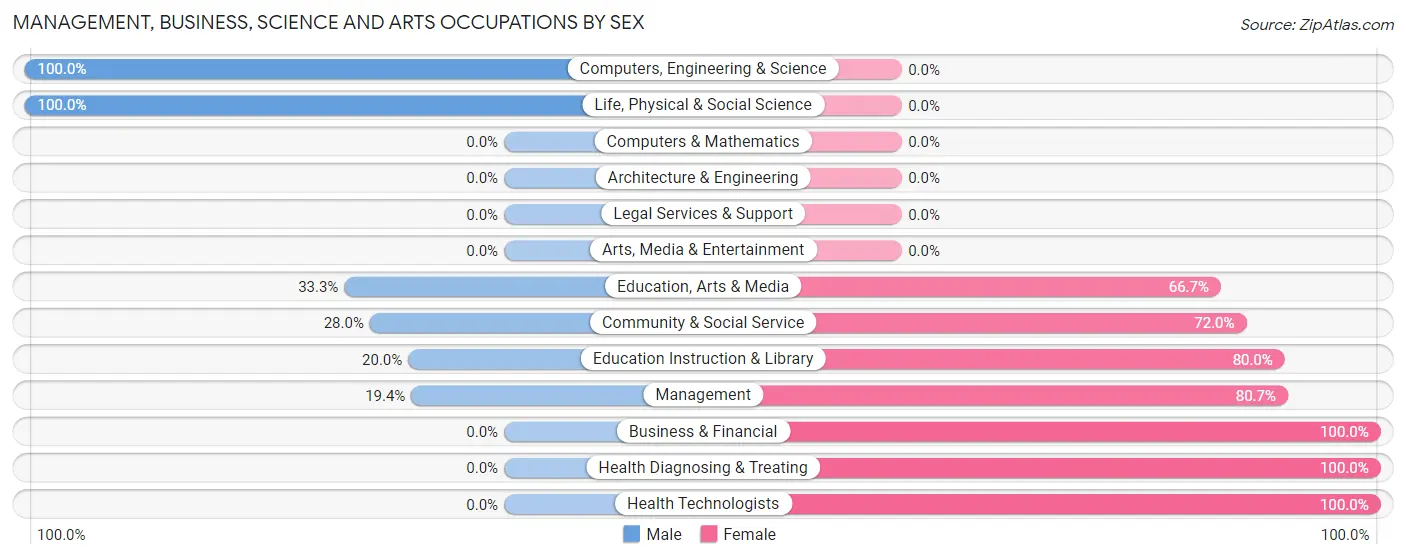
| Occupation | Male | Female |
| Management | 6 (19.4%) | 25 (80.6%) |
| Business & Financial | 0 (0.0%) | 4 (100.0%) |
| Computers, Engineering & Science | 7 (100.0%) | 0 (0.0%) |
| Computers & Mathematics | 0 (0.0%) | 0 (0.0%) |
| Architecture & Engineering | 0 (0.0%) | 0 (0.0%) |
| Life, Physical & Social Science | 7 (100.0%) | 0 (0.0%) |
| Community & Social Service | 7 (28.0%) | 18 (72.0%) |
| Education, Arts & Media | 5 (33.3%) | 10 (66.7%) |
| Legal Services & Support | 0 (0.0%) | 0 (0.0%) |
| Education Instruction & Library | 2 (20.0%) | 8 (80.0%) |
| Arts, Media & Entertainment | 0 (0.0%) | 0 (0.0%) |
| Health Diagnosing & Treating | 0 (0.0%) | 18 (100.0%) |
| Health Technologists | 0 (0.0%) | 15 (100.0%) |
| Total (Category) | 20 (23.5%) | 65 (76.5%) |
| Total (Overall) | 75 (39.7%) | 114 (60.3%) |
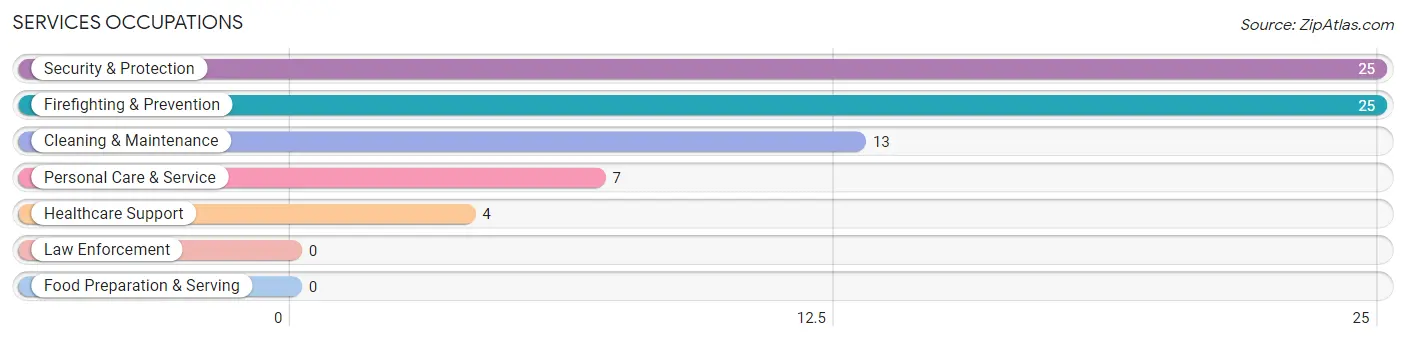
Services Occupations
The most common Services occupations in Ualapue are Security & Protection (25 | 13.2%), Firefighting & Prevention (25 | 13.2%), Cleaning & Maintenance (13 | 6.9%), Personal Care & Service (7 | 3.7%), and Healthcare Support (4 | 2.1%).
Services Occupations by Sex
Within the Services occupations in Ualapue, the most male-oriented occupations are Cleaning & Maintenance (100.0%), Personal Care & Service (100.0%), and Security & Protection (80.0%), while the most female-oriented occupations are Healthcare Support (100.0%), Security & Protection (20.0%), and Firefighting & Prevention (20.0%).
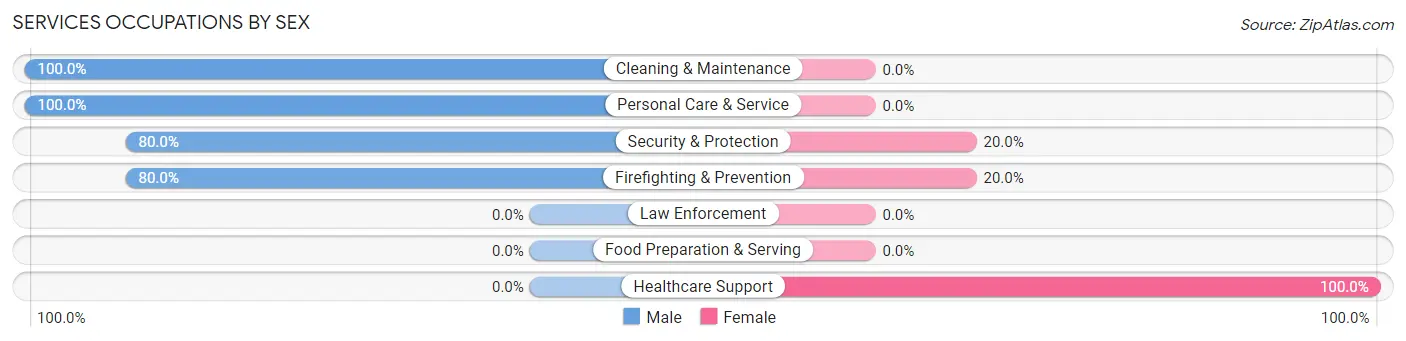
| Occupation | Male | Female |
| Healthcare Support | 0 (0.0%) | 4 (100.0%) |
| Security & Protection | 20 (80.0%) | 5 (20.0%) |
| Firefighting & Prevention | 20 (80.0%) | 5 (20.0%) |
| Law Enforcement | 0 (0.0%) | 0 (0.0%) |
| Food Preparation & Serving | 0 (0.0%) | 0 (0.0%) |
| Cleaning & Maintenance | 13 (100.0%) | 0 (0.0%) |
| Personal Care & Service | 7 (100.0%) | 0 (0.0%) |
| Total (Category) | 40 (81.6%) | 9 (18.4%) |
| Total (Overall) | 75 (39.7%) | 114 (60.3%) |
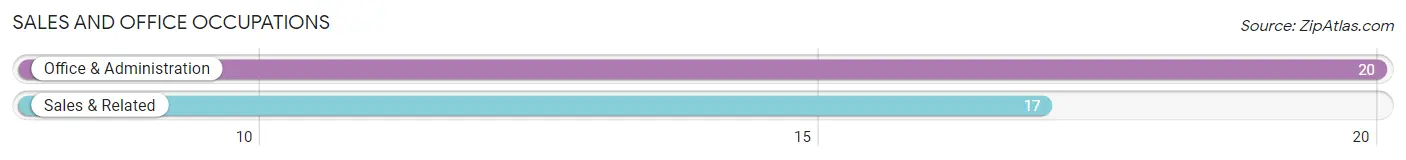
Sales and Office Occupations
The most common Sales and Office occupations in Ualapue are Office & Administration (20 | 10.6%), and Sales & Related (17 | 9.0%).
Sales and Office Occupations by Sex
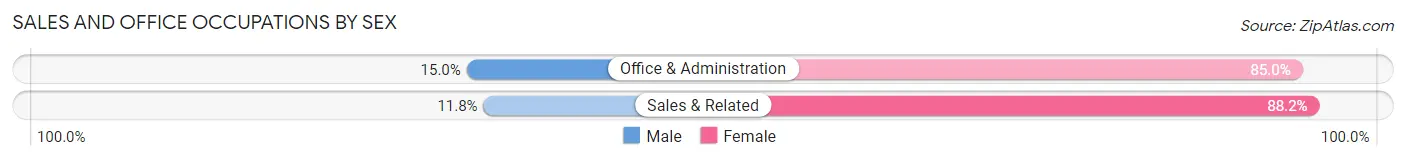
| Occupation | Male | Female |
| Sales & Related | 2 (11.8%) | 15 (88.2%) |
| Office & Administration | 3 (15.0%) | 17 (85.0%) |
| Total (Category) | 5 (13.5%) | 32 (86.5%) |
| Total (Overall) | 75 (39.7%) | 114 (60.3%) |
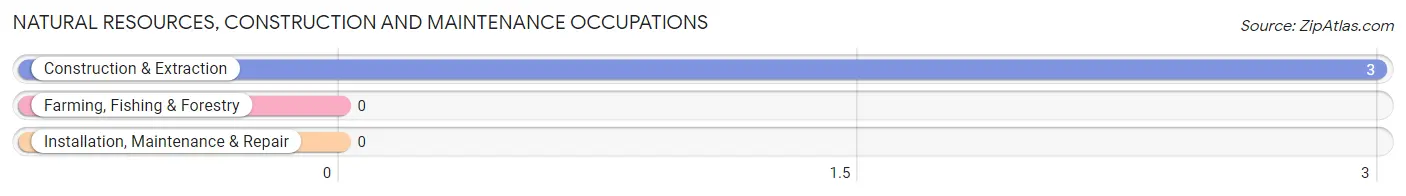
Natural Resources, Construction and Maintenance Occupations
The most common Natural Resources, Construction and Maintenance occupations in Ualapue are , and Construction & Extraction (3 | 1.6%).
Natural Resources, Construction and Maintenance Occupations by Sex
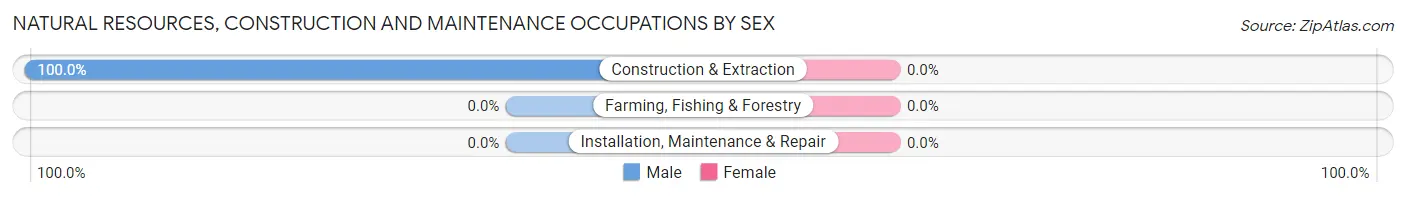
| Occupation | Male | Female |
| Farming, Fishing & Forestry | 0 (0.0%) | 0 (0.0%) |
| Construction & Extraction | 3 (100.0%) | 0 (0.0%) |
| Installation, Maintenance & Repair | 0 (0.0%) | 0 (0.0%) |
| Total (Category) | 3 (100.0%) | 0 (0.0%) |
| Total (Overall) | 75 (39.7%) | 114 (60.3%) |
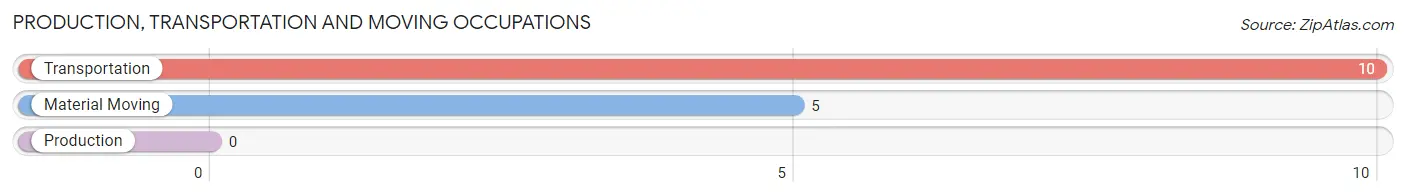
Production, Transportation and Moving Occupations
The most common Production, Transportation and Moving occupations in Ualapue are Transportation (10 | 5.3%), and Material Moving (5 | 2.6%).
Production, Transportation and Moving Occupations by Sex
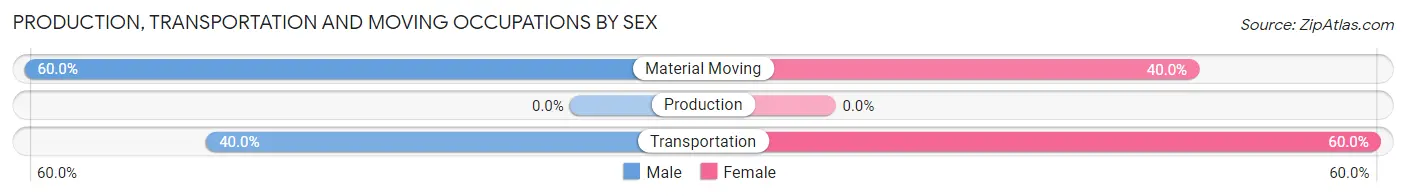
| Occupation | Male | Female |
| Production | 0 (0.0%) | 0 (0.0%) |
| Transportation | 4 (40.0%) | 6 (60.0%) |
| Material Moving | 3 (60.0%) | 2 (40.0%) |
| Total (Category) | 7 (46.7%) | 8 (53.3%) |
| Total (Overall) | 75 (39.7%) | 114 (60.3%) |
Employment Industries by Sex in Ualapue
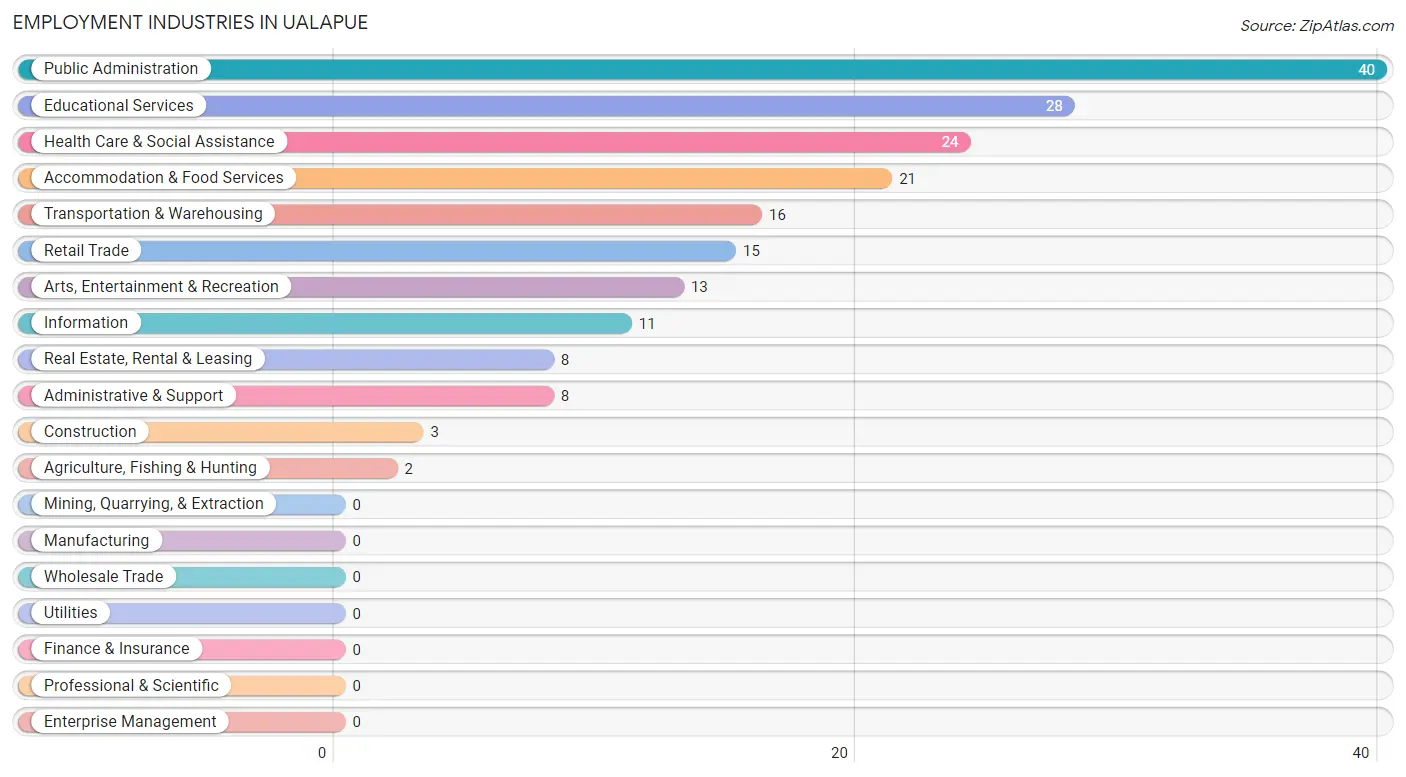
Employment Industries in Ualapue
The major employment industries in Ualapue include Public Administration (40 | 21.2%), Educational Services (28 | 14.8%), Health Care & Social Assistance (24 | 12.7%), Accommodation & Food Services (21 | 11.1%), and Transportation & Warehousing (16 | 8.5%).
Employment Industries by Sex in Ualapue
The Ualapue industries that see more men than women are Construction (100.0%), Arts, Entertainment & Recreation (100.0%), and Transportation & Warehousing (81.2%), whereas the industries that tend to have a higher number of women are Agriculture, Fishing & Hunting (100.0%), Information (100.0%), and Administrative & Support (100.0%).
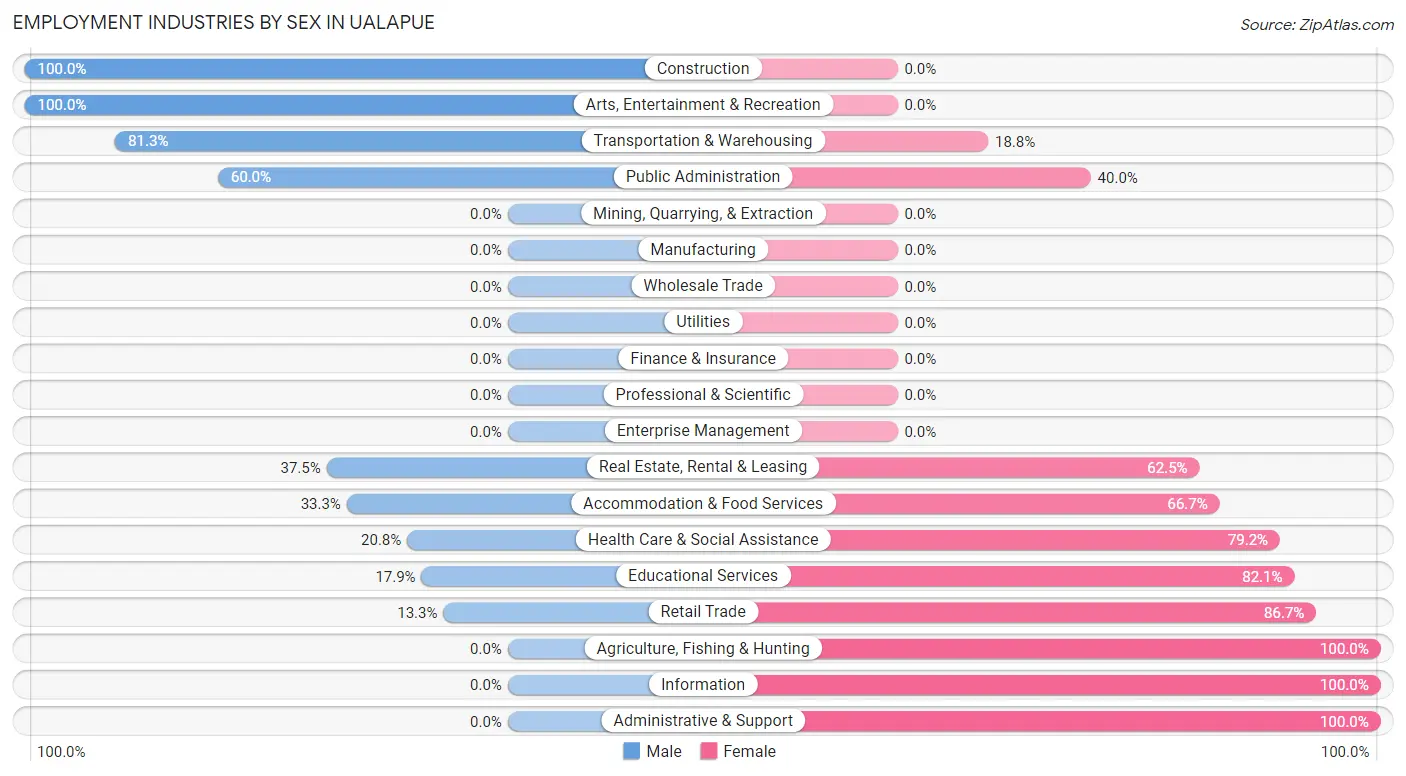
| Industry | Male | Female |
| Agriculture, Fishing & Hunting | 0 (0.0%) | 2 (100.0%) |
| Mining, Quarrying, & Extraction | 0 (0.0%) | 0 (0.0%) |
| Construction | 3 (100.0%) | 0 (0.0%) |
| Manufacturing | 0 (0.0%) | 0 (0.0%) |
| Wholesale Trade | 0 (0.0%) | 0 (0.0%) |
| Retail Trade | 2 (13.3%) | 13 (86.7%) |
| Transportation & Warehousing | 13 (81.2%) | 3 (18.8%) |
| Utilities | 0 (0.0%) | 0 (0.0%) |
| Information | 0 (0.0%) | 11 (100.0%) |
| Finance & Insurance | 0 (0.0%) | 0 (0.0%) |
| Real Estate, Rental & Leasing | 3 (37.5%) | 5 (62.5%) |
| Professional & Scientific | 0 (0.0%) | 0 (0.0%) |
| Enterprise Management | 0 (0.0%) | 0 (0.0%) |
| Administrative & Support | 0 (0.0%) | 8 (100.0%) |
| Educational Services | 5 (17.9%) | 23 (82.1%) |
| Health Care & Social Assistance | 5 (20.8%) | 19 (79.2%) |
| Arts, Entertainment & Recreation | 13 (100.0%) | 0 (0.0%) |
| Accommodation & Food Services | 7 (33.3%) | 14 (66.7%) |
| Public Administration | 24 (60.0%) | 16 (40.0%) |
| Total | 75 (39.7%) | 114 (60.3%) |
Education in Ualapue
School Enrollment in Ualapue
The most common levels of schooling among the 145 students in Ualapue are high school (53 | 36.5%), college / undergraduate (31 | 21.4%), and kindergarten (15 | 10.3%).

| School Level | # Students | % Students |
| Nursery / Preschool | 6 | 4.1% |
| Kindergarten | 15 | 10.3% |
| Elementary School | 10 | 6.9% |
| Middle School | 15 | 10.3% |
| High School | 53 | 36.5% |
| College / Undergraduate | 31 | 21.4% |
| Graduate / Professional | 15 | 10.3% |
| Total | 145 | 100.0% |
School Enrollment by Age by Funding Source in Ualapue
Out of a total of 145 students who are enrolled in schools in Ualapue, 22 (15.2%) attend a private institution, while the remaining 123 (84.8%) are enrolled in public schools. The age group of 3 to 4 year olds has the highest likelihood of being enrolled in private schools, with 2 (100.0% in the age bracket) enrolled. Conversely, the age group of 10 to 14 year olds has the lowest likelihood of being enrolled in a private school, with 31 (100.0% in the age bracket) attending a public institution.
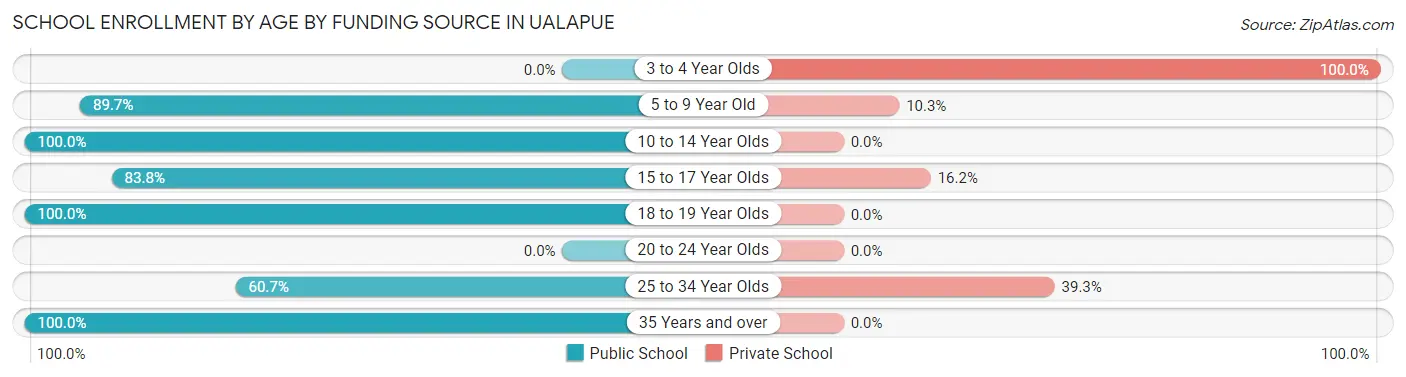
| Age Bracket | Public School | Private School |
| 3 to 4 Year Olds | 0 (0.0%) | 2 (100.0%) |
| 5 to 9 Year Old | 26 (89.7%) | 3 (10.3%) |
| 10 to 14 Year Olds | 31 (100.0%) | 0 (0.0%) |
| 15 to 17 Year Olds | 31 (83.8%) | 6 (16.2%) |
| 18 to 19 Year Olds | 3 (100.0%) | 0 (0.0%) |
| 20 to 24 Year Olds | 0 (0.0%) | 0 (0.0%) |
| 25 to 34 Year Olds | 17 (60.7%) | 11 (39.3%) |
| 35 Years and over | 15 (100.0%) | 0 (0.0%) |
| Total | 123 (84.8%) | 22 (15.2%) |
Educational Attainment by Field of Study in Ualapue
Business (27 | 22.9%), literature & languages (16 | 13.6%), social sciences (12 | 10.2%), liberal arts & history (11 | 9.3%), and science & technology (10 | 8.5%) are the most common fields of study among 118 individuals in Ualapue who have obtained a bachelor's degree or higher.
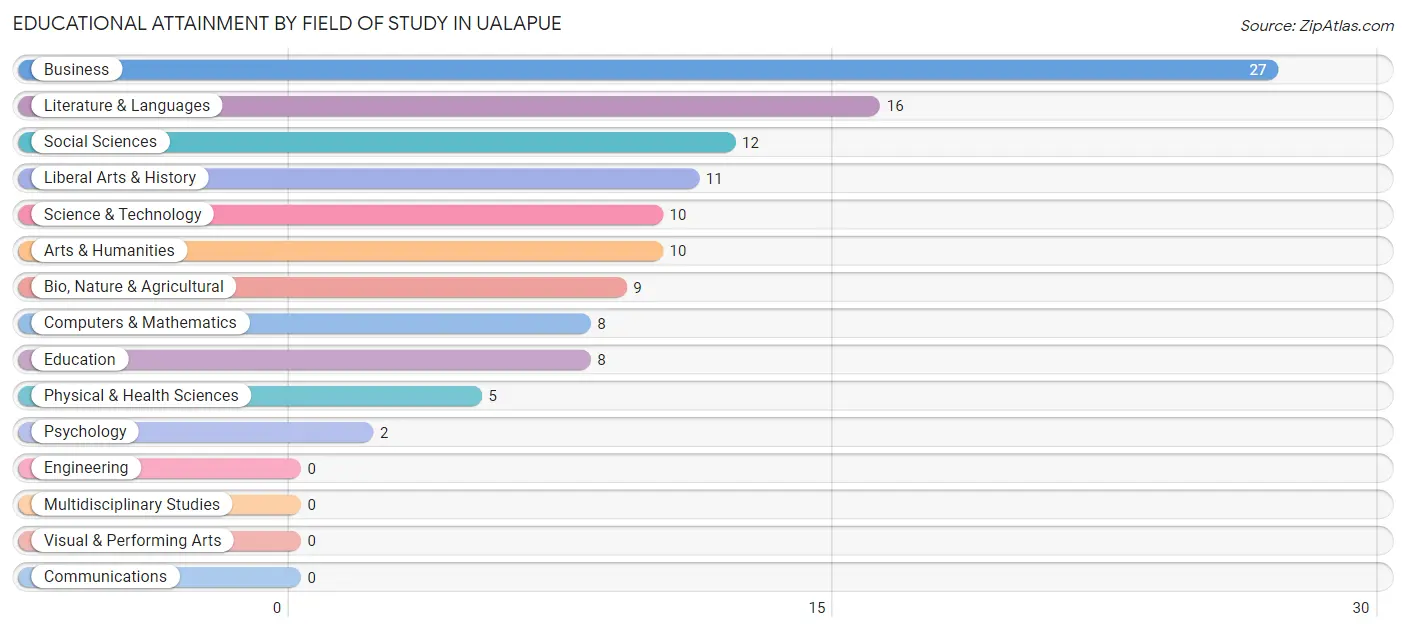
| Field of Study | # Graduates | % Graduates |
| Computers & Mathematics | 8 | 6.8% |
| Bio, Nature & Agricultural | 9 | 7.6% |
| Physical & Health Sciences | 5 | 4.2% |
| Psychology | 2 | 1.7% |
| Social Sciences | 12 | 10.2% |
| Engineering | 0 | 0.0% |
| Multidisciplinary Studies | 0 | 0.0% |
| Science & Technology | 10 | 8.5% |
| Business | 27 | 22.9% |
| Education | 8 | 6.8% |
| Literature & Languages | 16 | 13.6% |
| Liberal Arts & History | 11 | 9.3% |
| Visual & Performing Arts | 0 | 0.0% |
| Communications | 0 | 0.0% |
| Arts & Humanities | 10 | 8.5% |
| Total | 118 | 100.0% |
Transportation & Commute in Ualapue
Vehicle Availability by Sex in Ualapue
The most prevalent vehicle ownership categories in Ualapue are males with 2 vehicles (28, accounting for 35.0%) and females with 2 vehicles (36, making up 24.6%).
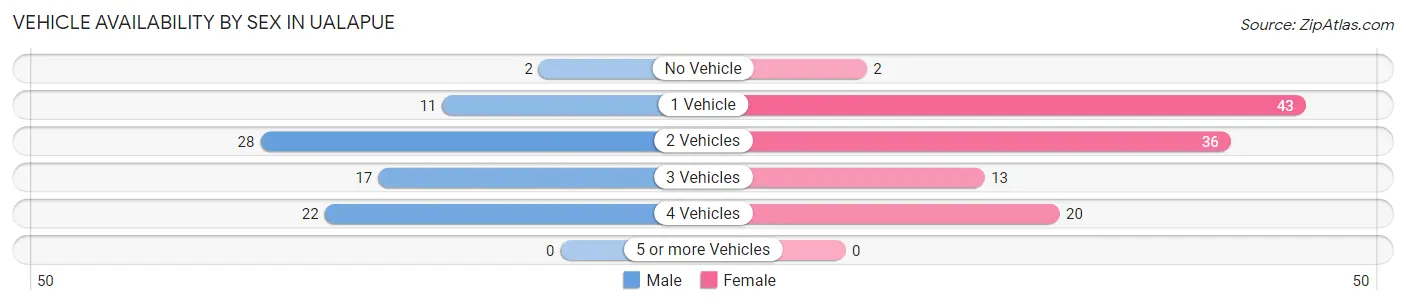
| Vehicles Available | Male | Female |
| No Vehicle | 2 (2.5%) | 2 (1.8%) |
| 1 Vehicle | 11 (13.8%) | 43 (37.7%) |
| 2 Vehicles | 28 (35.0%) | 36 (31.6%) |
| 3 Vehicles | 17 (21.2%) | 13 (11.4%) |
| 4 Vehicles | 22 (27.5%) | 20 (17.5%) |
| 5 or more Vehicles | 0 (0.0%) | 0 (0.0%) |
| Total | 80 (100.0%) | 114 (100.0%) |
Commute Time in Ualapue
The most frequently occuring commute durations in Ualapue are 20 to 24 minutes (55 commuters, 30.7%), 30 to 34 minutes (34 commuters, 19.0%), and 10 to 14 minutes (28 commuters, 15.6%).
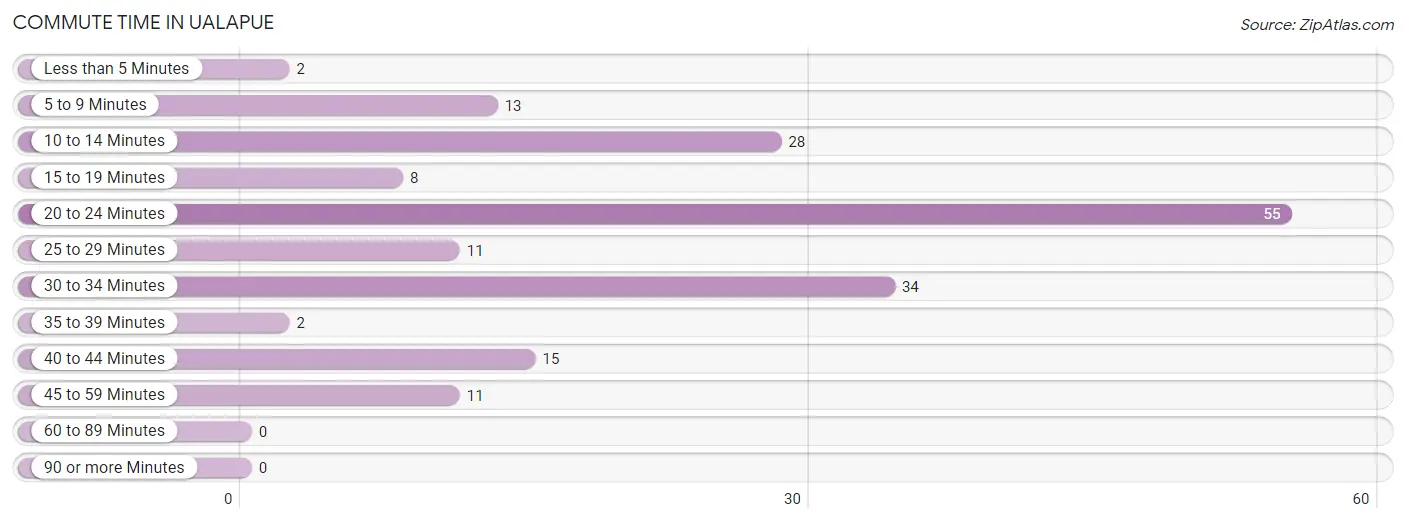
| Commute Time | # Commuters | % Commuters |
| Less than 5 Minutes | 2 | 1.1% |
| 5 to 9 Minutes | 13 | 7.3% |
| 10 to 14 Minutes | 28 | 15.6% |
| 15 to 19 Minutes | 8 | 4.5% |
| 20 to 24 Minutes | 55 | 30.7% |
| 25 to 29 Minutes | 11 | 6.1% |
| 30 to 34 Minutes | 34 | 19.0% |
| 35 to 39 Minutes | 2 | 1.1% |
| 40 to 44 Minutes | 15 | 8.4% |
| 45 to 59 Minutes | 11 | 6.1% |
| 60 to 89 Minutes | 0 | 0.0% |
| 90 or more Minutes | 0 | 0.0% |
Commute Time by Sex in Ualapue
The most common commute times in Ualapue are 20 to 24 minutes (23 commuters, 28.7%) for males and 20 to 24 minutes (32 commuters, 32.3%) for females.
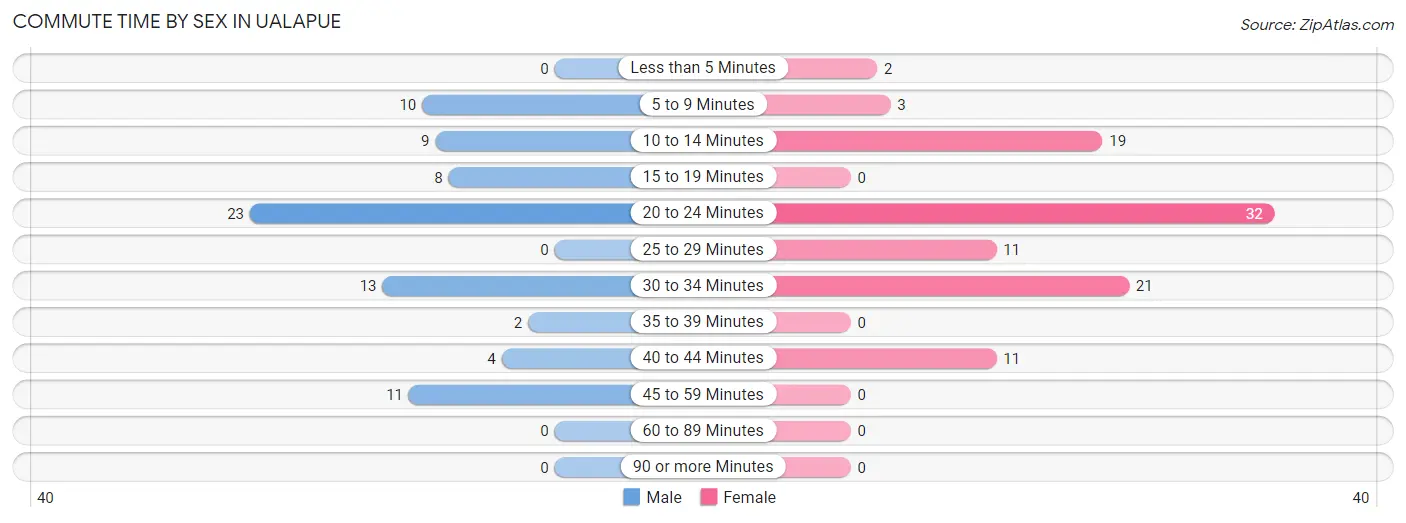
| Commute Time | Male | Female |
| Less than 5 Minutes | 0 (0.0%) | 2 (2.0%) |
| 5 to 9 Minutes | 10 (12.5%) | 3 (3.0%) |
| 10 to 14 Minutes | 9 (11.3%) | 19 (19.2%) |
| 15 to 19 Minutes | 8 (10.0%) | 0 (0.0%) |
| 20 to 24 Minutes | 23 (28.7%) | 32 (32.3%) |
| 25 to 29 Minutes | 0 (0.0%) | 11 (11.1%) |
| 30 to 34 Minutes | 13 (16.3%) | 21 (21.2%) |
| 35 to 39 Minutes | 2 (2.5%) | 0 (0.0%) |
| 40 to 44 Minutes | 4 (5.0%) | 11 (11.1%) |
| 45 to 59 Minutes | 11 (13.8%) | 0 (0.0%) |
| 60 to 89 Minutes | 0 (0.0%) | 0 (0.0%) |
| 90 or more Minutes | 0 (0.0%) | 0 (0.0%) |
Time of Departure to Work by Sex in Ualapue
The most frequent times of departure to work in Ualapue are 6:30 AM to 6:59 AM (28, 35.0%) for males and 6:30 AM to 6:59 AM (27, 27.3%) for females.
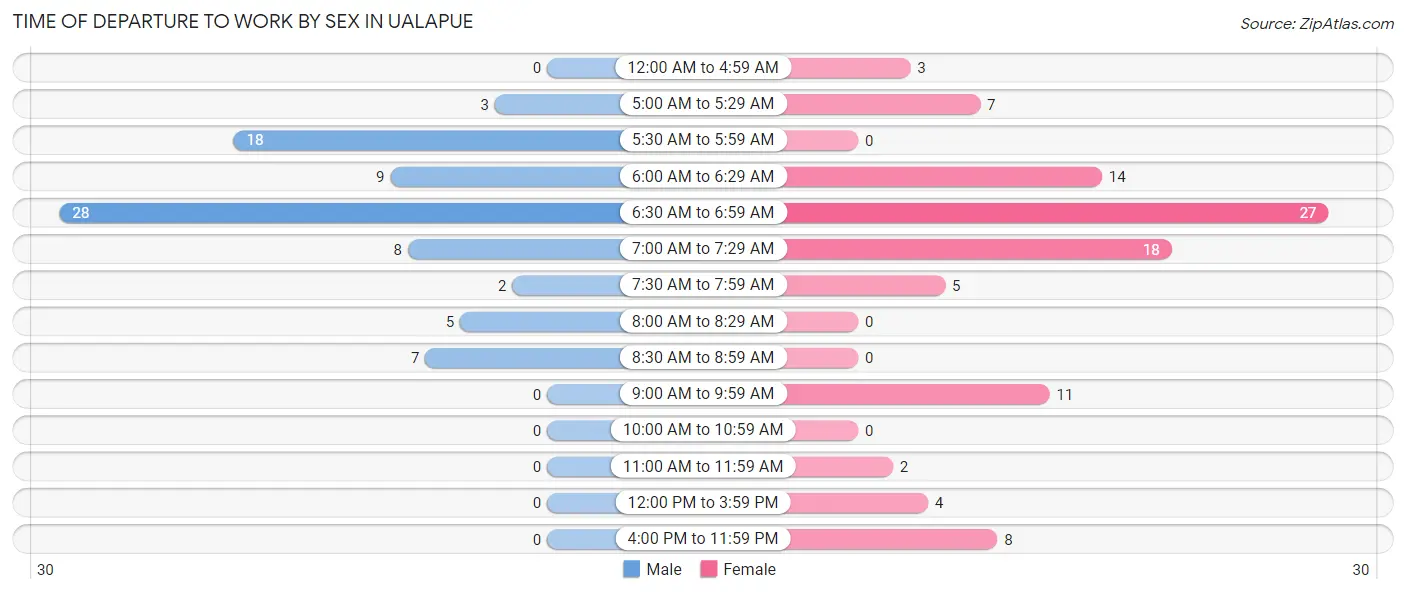
| Time of Departure | Male | Female |
| 12:00 AM to 4:59 AM | 0 (0.0%) | 3 (3.0%) |
| 5:00 AM to 5:29 AM | 3 (3.7%) | 7 (7.1%) |
| 5:30 AM to 5:59 AM | 18 (22.5%) | 0 (0.0%) |
| 6:00 AM to 6:29 AM | 9 (11.3%) | 14 (14.1%) |
| 6:30 AM to 6:59 AM | 28 (35.0%) | 27 (27.3%) |
| 7:00 AM to 7:29 AM | 8 (10.0%) | 18 (18.2%) |
| 7:30 AM to 7:59 AM | 2 (2.5%) | 5 (5.1%) |
| 8:00 AM to 8:29 AM | 5 (6.2%) | 0 (0.0%) |
| 8:30 AM to 8:59 AM | 7 (8.7%) | 0 (0.0%) |
| 9:00 AM to 9:59 AM | 0 (0.0%) | 11 (11.1%) |
| 10:00 AM to 10:59 AM | 0 (0.0%) | 0 (0.0%) |
| 11:00 AM to 11:59 AM | 0 (0.0%) | 2 (2.0%) |
| 12:00 PM to 3:59 PM | 0 (0.0%) | 4 (4.0%) |
| 4:00 PM to 11:59 PM | 0 (0.0%) | 8 (8.1%) |
| Total | 80 (100.0%) | 99 (100.0%) |
Housing Occupancy in Ualapue
Occupancy by Ownership in Ualapue
Of the total 204 dwellings in Ualapue, owner-occupied units account for 149 (73.0%), while renter-occupied units make up 55 (27.0%).
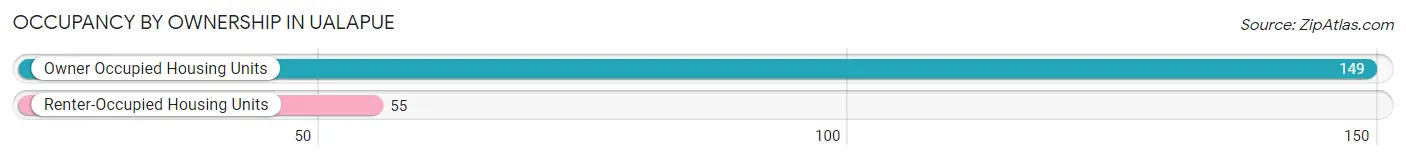
| Occupancy | # Housing Units | % Housing Units |
| Owner Occupied Housing Units | 149 | 73.0% |
| Renter-Occupied Housing Units | 55 | 27.0% |
| Total Occupied Housing Units | 204 | 100.0% |
Occupancy by Household Size in Ualapue
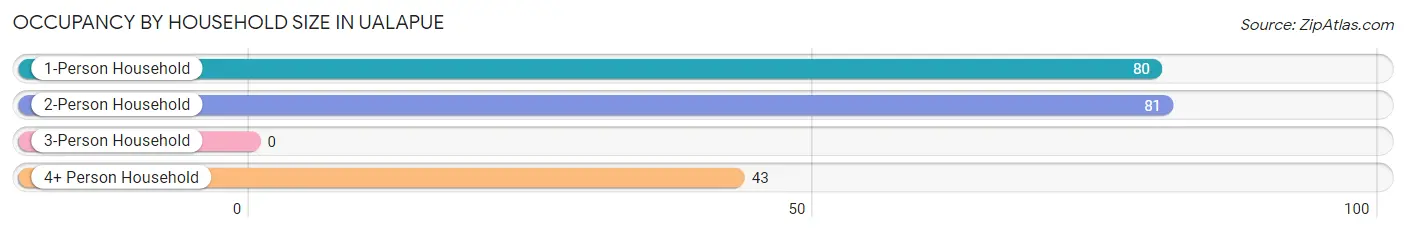
| Household Size | # Housing Units | % Housing Units |
| 1-Person Household | 80 | 39.2% |
| 2-Person Household | 81 | 39.7% |
| 3-Person Household | 0 | 0.0% |
| 4+ Person Household | 43 | 21.1% |
| Total Housing Units | 204 | 100.0% |
Occupancy by Ownership by Household Size in Ualapue
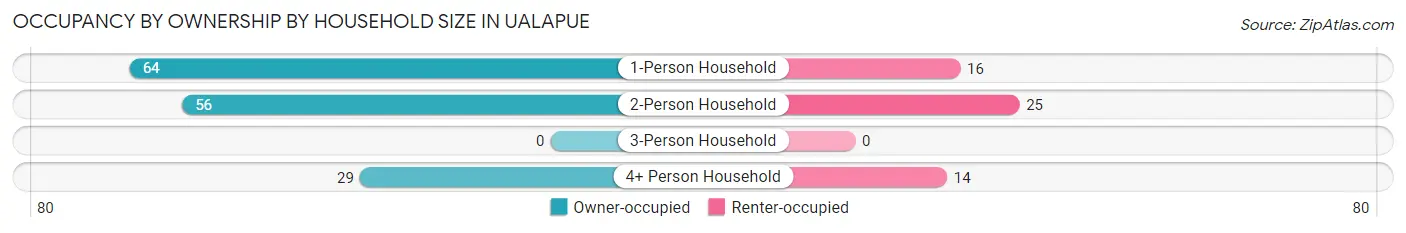
| Household Size | Owner-occupied | Renter-occupied |
| 1-Person Household | 64 (80.0%) | 16 (20.0%) |
| 2-Person Household | 56 (69.1%) | 25 (30.9%) |
| 3-Person Household | 0 (0.0%) | 0 (0.0%) |
| 4+ Person Household | 29 (67.4%) | 14 (32.6%) |
| Total Housing Units | 149 (73.0%) | 55 (27.0%) |
Occupancy by Educational Attainment in Ualapue
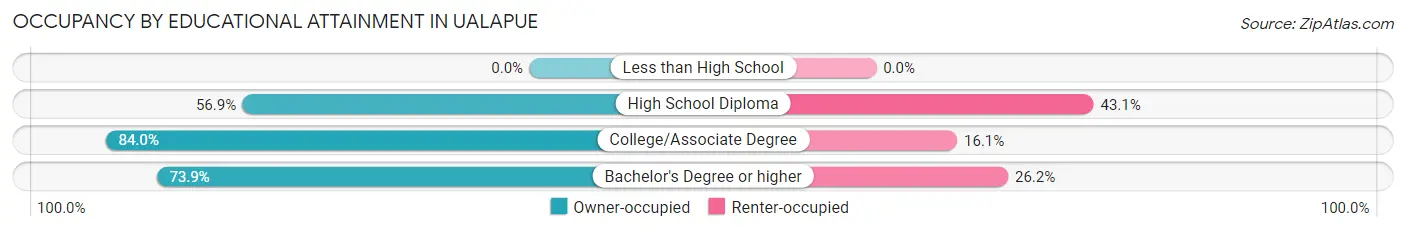
| Household Size | Owner-occupied | Renter-occupied |
| Less than High School | 0 (0.0%) | 0 (0.0%) |
| High School Diploma | 33 (56.9%) | 25 (43.1%) |
| College/Associate Degree | 68 (84.0%) | 13 (16.1%) |
| Bachelor's Degree or higher | 48 (73.9%) | 17 (26.2%) |
Occupancy by Age of Householder in Ualapue
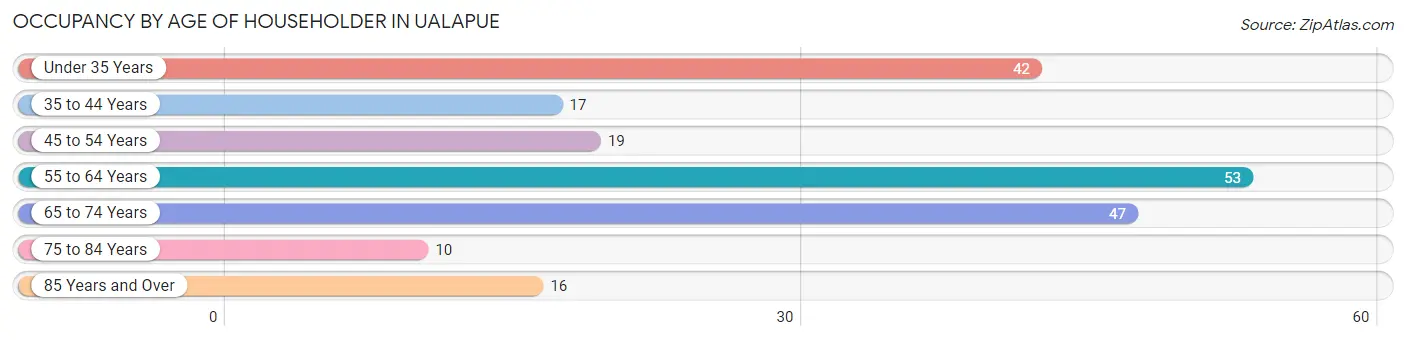
| Age Bracket | # Households | % Households |
| Under 35 Years | 42 | 20.6% |
| 35 to 44 Years | 17 | 8.3% |
| 45 to 54 Years | 19 | 9.3% |
| 55 to 64 Years | 53 | 26.0% |
| 65 to 74 Years | 47 | 23.0% |
| 75 to 84 Years | 10 | 4.9% |
| 85 Years and Over | 16 | 7.8% |
| Total | 204 | 100.0% |
Housing Finances in Ualapue
Median Income by Occupancy in Ualapue
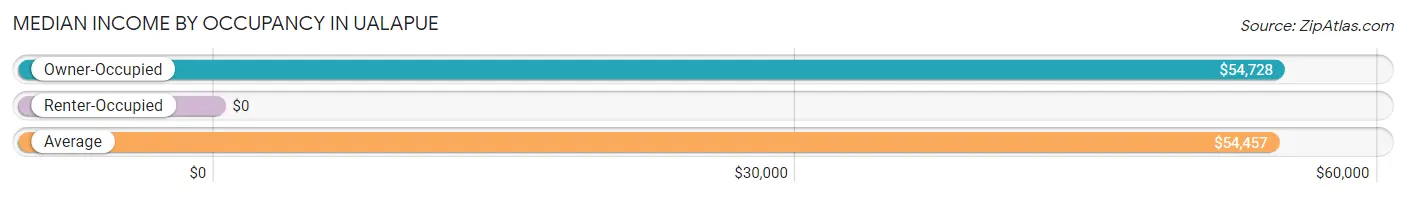
| Occupancy Type | # Households | Median Income |
| Owner-Occupied | 149 (73.0%) | $54,728 |
| Renter-Occupied | 55 (27.0%) | $0 |
| Average | 204 (100.0%) | $54,457 |
Occupancy by Householder Income Bracket in Ualapue
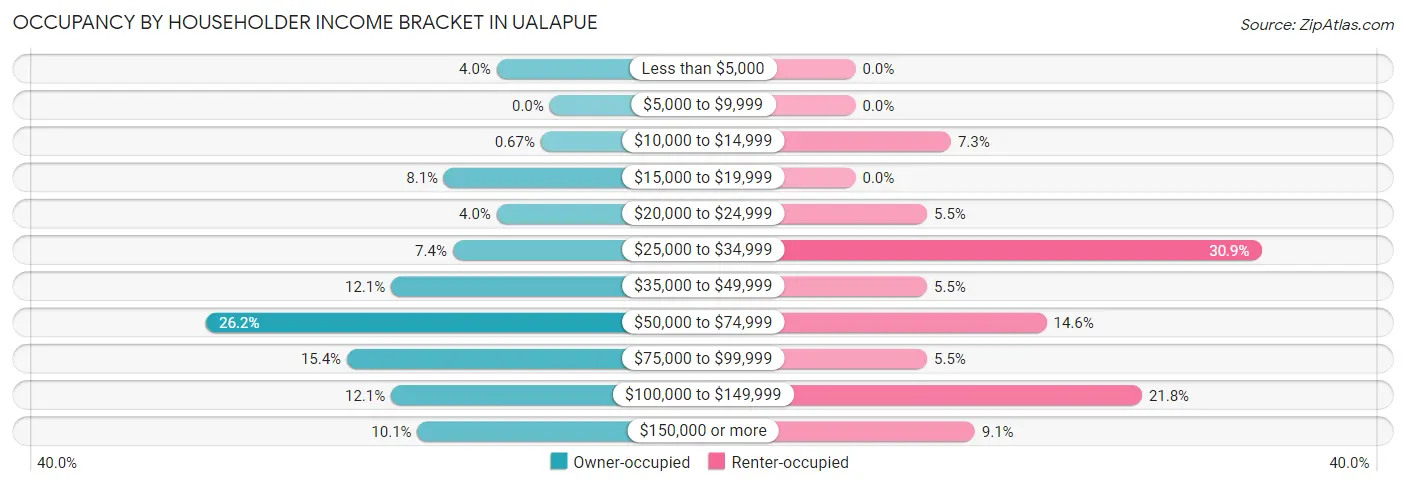
| Income Bracket | Owner-occupied | Renter-occupied |
| Less than $5,000 | 6 (4.0%) | 0 (0.0%) |
| $5,000 to $9,999 | 0 (0.0%) | 0 (0.0%) |
| $10,000 to $14,999 | 1 (0.7%) | 4 (7.3%) |
| $15,000 to $19,999 | 12 (8.1%) | 0 (0.0%) |
| $20,000 to $24,999 | 6 (4.0%) | 3 (5.4%) |
| $25,000 to $34,999 | 11 (7.4%) | 17 (30.9%) |
| $35,000 to $49,999 | 18 (12.1%) | 3 (5.4%) |
| $50,000 to $74,999 | 39 (26.2%) | 8 (14.5%) |
| $75,000 to $99,999 | 23 (15.4%) | 3 (5.4%) |
| $100,000 to $149,999 | 18 (12.1%) | 12 (21.8%) |
| $150,000 or more | 15 (10.1%) | 5 (9.1%) |
| Total | 149 (100.0%) | 55 (100.0%) |
Monthly Housing Cost Tiers in Ualapue
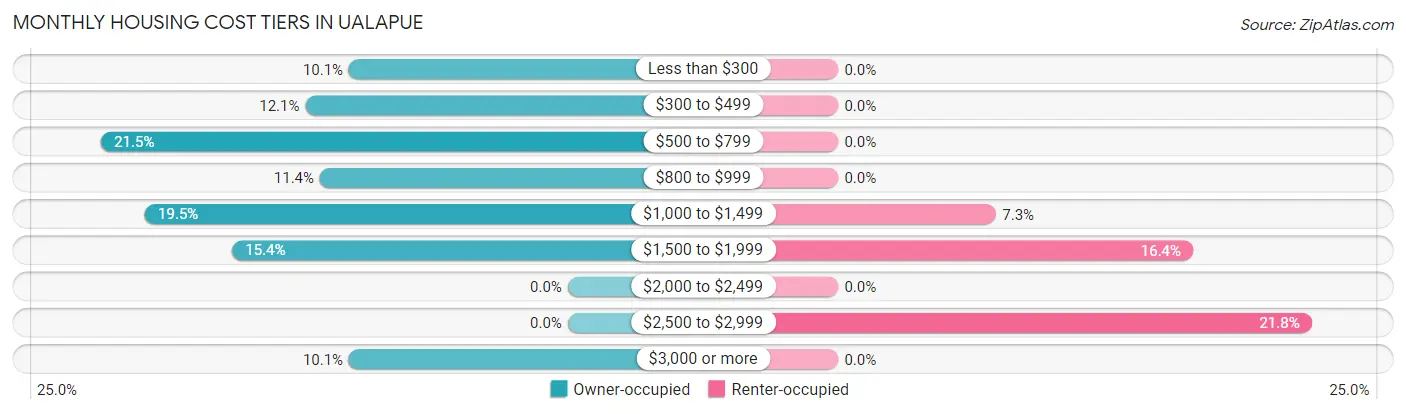
| Monthly Cost | Owner-occupied | Renter-occupied |
| Less than $300 | 15 (10.1%) | 0 (0.0%) |
| $300 to $499 | 18 (12.1%) | 0 (0.0%) |
| $500 to $799 | 32 (21.5%) | 0 (0.0%) |
| $800 to $999 | 17 (11.4%) | 0 (0.0%) |
| $1,000 to $1,499 | 29 (19.5%) | 4 (7.3%) |
| $1,500 to $1,999 | 23 (15.4%) | 9 (16.4%) |
| $2,000 to $2,499 | 0 (0.0%) | 0 (0.0%) |
| $2,500 to $2,999 | 0 (0.0%) | 12 (21.8%) |
| $3,000 or more | 15 (10.1%) | 0 (0.0%) |
| Total | 149 (100.0%) | 55 (100.0%) |
Physical Housing Characteristics in Ualapue
Housing Structures in Ualapue
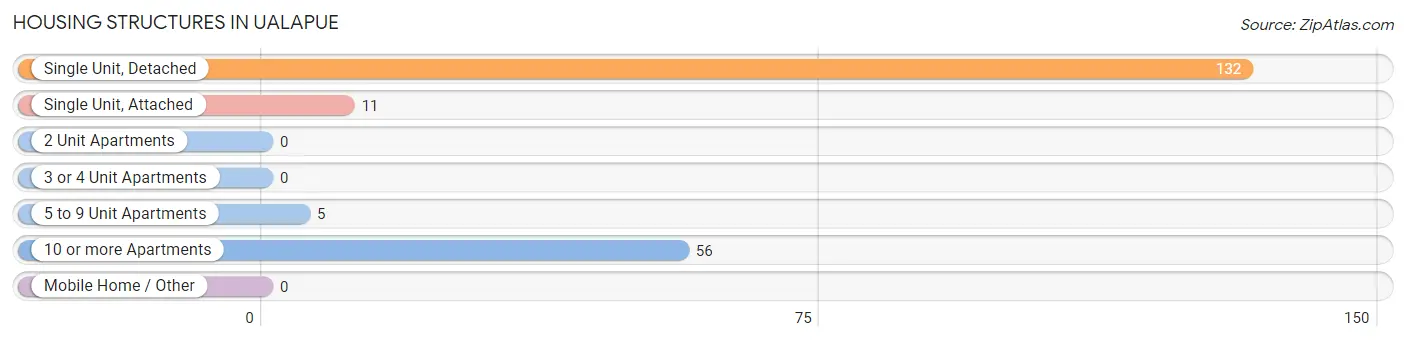
| Structure Type | # Housing Units | % Housing Units |
| Single Unit, Detached | 132 | 64.7% |
| Single Unit, Attached | 11 | 5.4% |
| 2 Unit Apartments | 0 | 0.0% |
| 3 or 4 Unit Apartments | 0 | 0.0% |
| 5 to 9 Unit Apartments | 5 | 2.5% |
| 10 or more Apartments | 56 | 27.5% |
| Mobile Home / Other | 0 | 0.0% |
| Total | 204 | 100.0% |
Housing Structures by Occupancy in Ualapue
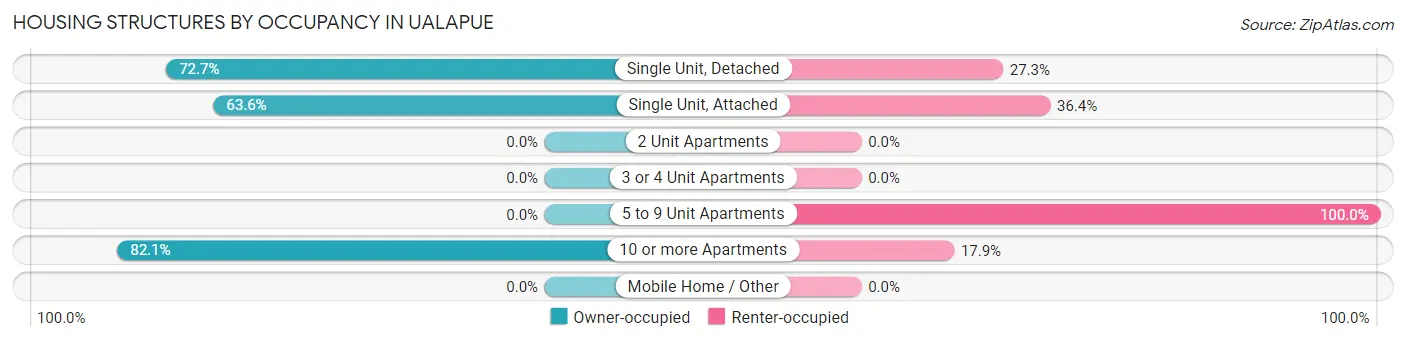
| Structure Type | Owner-occupied | Renter-occupied |
| Single Unit, Detached | 96 (72.7%) | 36 (27.3%) |
| Single Unit, Attached | 7 (63.6%) | 4 (36.4%) |
| 2 Unit Apartments | 0 (0.0%) | 0 (0.0%) |
| 3 or 4 Unit Apartments | 0 (0.0%) | 0 (0.0%) |
| 5 to 9 Unit Apartments | 0 (0.0%) | 5 (100.0%) |
| 10 or more Apartments | 46 (82.1%) | 10 (17.9%) |
| Mobile Home / Other | 0 (0.0%) | 0 (0.0%) |
| Total | 149 (73.0%) | 55 (27.0%) |
Housing Structures by Number of Rooms in Ualapue
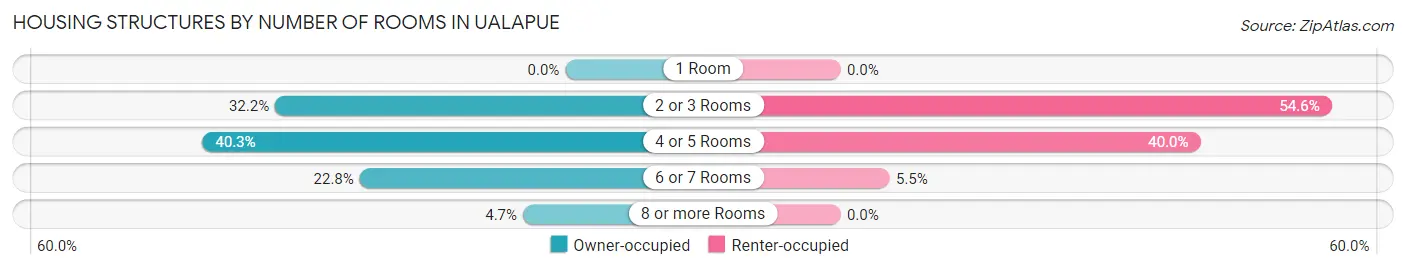
| Number of Rooms | Owner-occupied | Renter-occupied |
| 1 Room | 0 (0.0%) | 0 (0.0%) |
| 2 or 3 Rooms | 48 (32.2%) | 30 (54.5%) |
| 4 or 5 Rooms | 60 (40.3%) | 22 (40.0%) |
| 6 or 7 Rooms | 34 (22.8%) | 3 (5.4%) |
| 8 or more Rooms | 7 (4.7%) | 0 (0.0%) |
| Total | 149 (100.0%) | 55 (100.0%) |
Housing Structure by Heating Type in Ualapue
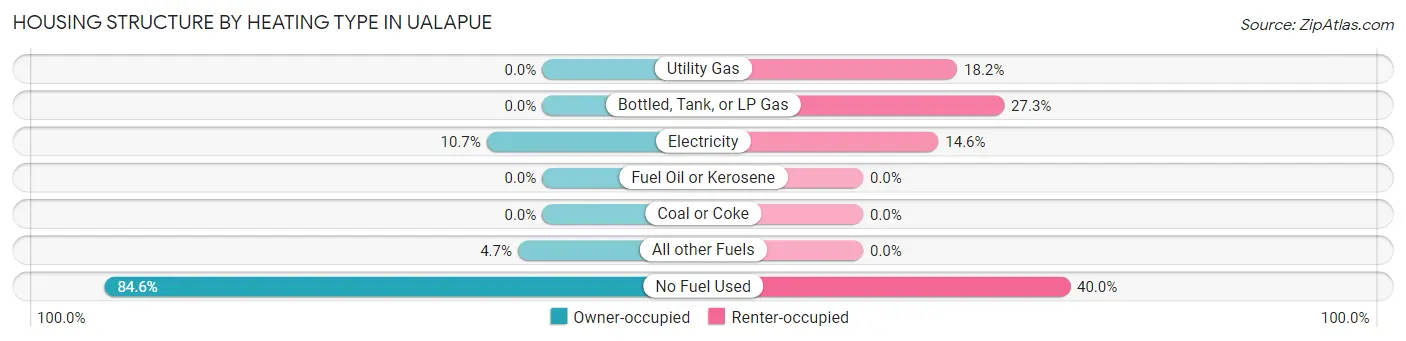
| Heating Type | Owner-occupied | Renter-occupied |
| Utility Gas | 0 (0.0%) | 10 (18.2%) |
| Bottled, Tank, or LP Gas | 0 (0.0%) | 15 (27.3%) |
| Electricity | 16 (10.7%) | 8 (14.5%) |
| Fuel Oil or Kerosene | 0 (0.0%) | 0 (0.0%) |
| Coal or Coke | 0 (0.0%) | 0 (0.0%) |
| All other Fuels | 7 (4.7%) | 0 (0.0%) |
| No Fuel Used | 126 (84.6%) | 22 (40.0%) |
| Total | 149 (100.0%) | 55 (100.0%) |
Household Vehicle Usage in Ualapue
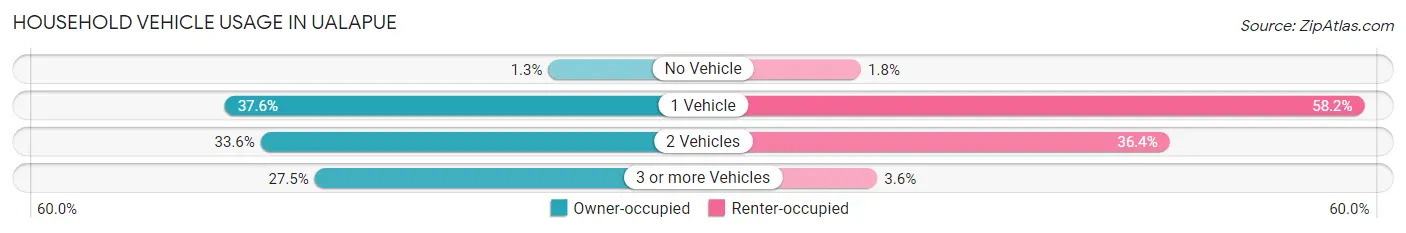
| Vehicles per Household | Owner-occupied | Renter-occupied |
| No Vehicle | 2 (1.3%) | 1 (1.8%) |
| 1 Vehicle | 56 (37.6%) | 32 (58.2%) |
| 2 Vehicles | 50 (33.6%) | 20 (36.4%) |
| 3 or more Vehicles | 41 (27.5%) | 2 (3.6%) |
| Total | 149 (100.0%) | 55 (100.0%) |
Real Estate & Mortgages in Ualapue
Real Estate and Mortgage Overview in Ualapue
| Characteristic | Without Mortgage | With Mortgage |
| Housing Units | 82 | 67 |
| Median Property Value | $193,800 | $402,300 |
| Median Household Income | $54,457 | $4 |
| Monthly Housing Costs | $620 | $15 |
| Real Estate Taxes | $763 | $2 |
Property Value by Mortgage Status in Ualapue
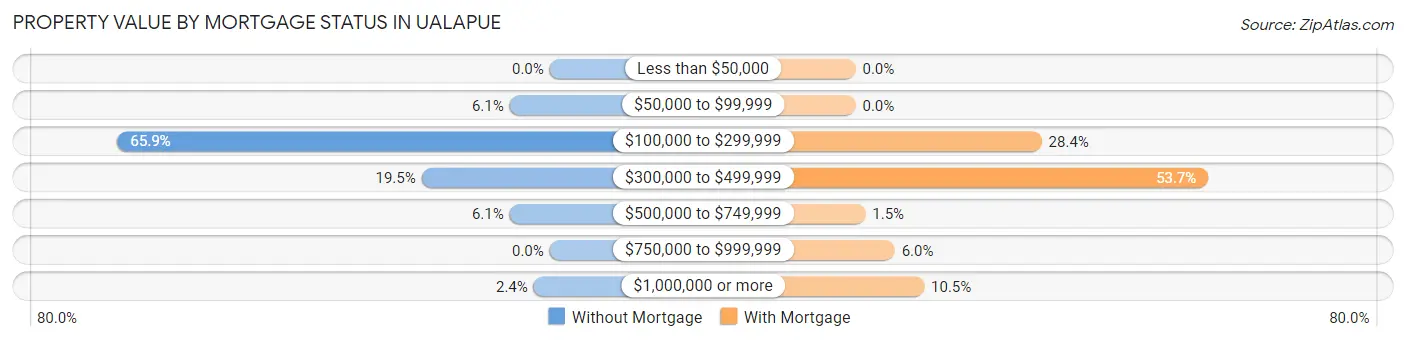
| Property Value | Without Mortgage | With Mortgage |
| Less than $50,000 | 0 (0.0%) | 0 (0.0%) |
| $50,000 to $99,999 | 5 (6.1%) | 0 (0.0%) |
| $100,000 to $299,999 | 54 (65.8%) | 19 (28.4%) |
| $300,000 to $499,999 | 16 (19.5%) | 36 (53.7%) |
| $500,000 to $749,999 | 5 (6.1%) | 1 (1.5%) |
| $750,000 to $999,999 | 0 (0.0%) | 4 (6.0%) |
| $1,000,000 or more | 2 (2.4%) | 7 (10.4%) |
| Total | 82 (100.0%) | 67 (100.0%) |
Household Income by Mortgage Status in Ualapue
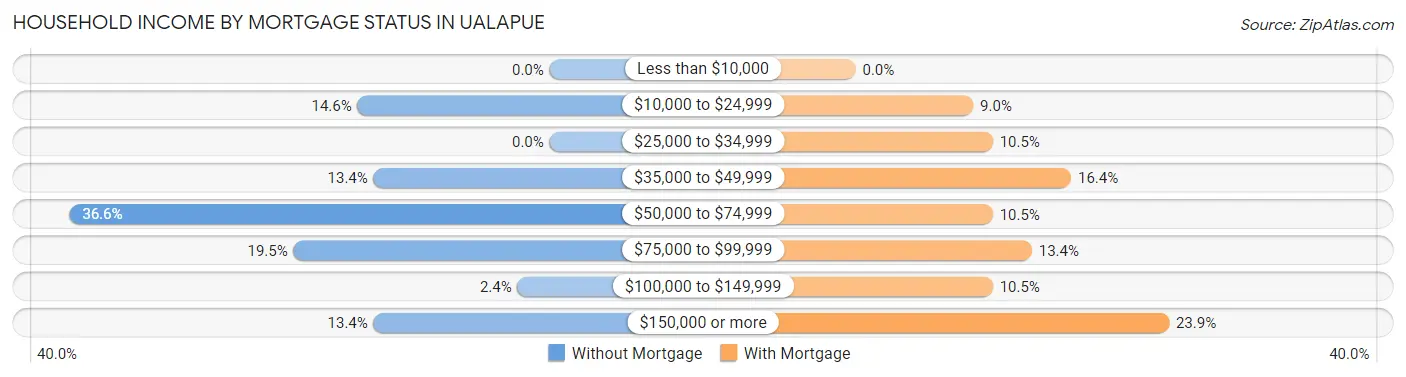
| Household Income | Without Mortgage | With Mortgage |
| Less than $10,000 | 0 (0.0%) | 0 (0.0%) |
| $10,000 to $24,999 | 12 (14.6%) | 6 (9.0%) |
| $25,000 to $34,999 | 0 (0.0%) | 7 (10.4%) |
| $35,000 to $49,999 | 11 (13.4%) | 11 (16.4%) |
| $50,000 to $74,999 | 30 (36.6%) | 7 (10.4%) |
| $75,000 to $99,999 | 16 (19.5%) | 9 (13.4%) |
| $100,000 to $149,999 | 2 (2.4%) | 7 (10.4%) |
| $150,000 or more | 11 (13.4%) | 16 (23.9%) |
| Total | 82 (100.0%) | 67 (100.0%) |
Property Value to Household Income Ratio in Ualapue
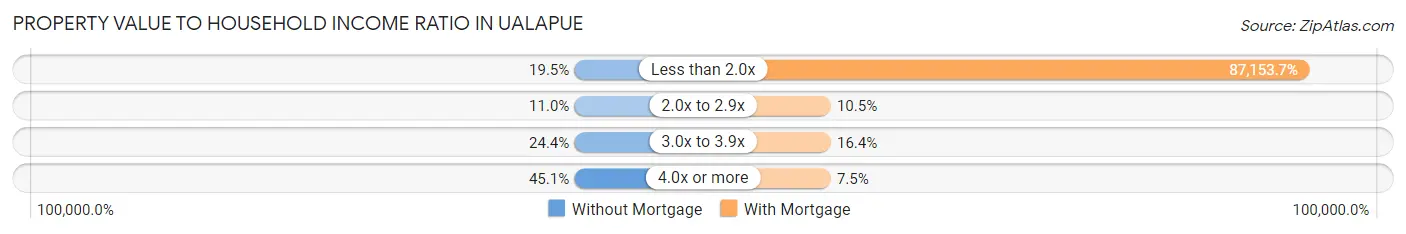
| Value-to-Income Ratio | Without Mortgage | With Mortgage |
| Less than 2.0x | 16 (19.5%) | 58,393 (87,153.7%) |
| 2.0x to 2.9x | 9 (11.0%) | 7 (10.4%) |
| 3.0x to 3.9x | 20 (24.4%) | 11 (16.4%) |
| 4.0x or more | 37 (45.1%) | 5 (7.5%) |
| Total | 82 (100.0%) | 67 (100.0%) |
Real Estate Taxes by Mortgage Status in Ualapue
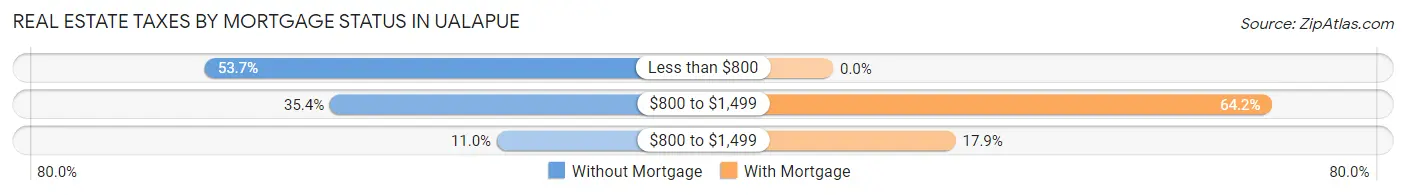
| Property Taxes | Without Mortgage | With Mortgage |
| Less than $800 | 44 (53.7%) | 0 (0.0%) |
| $800 to $1,499 | 29 (35.4%) | 43 (64.2%) |
| $800 to $1,499 | 9 (11.0%) | 12 (17.9%) |
| Total | 82 (100.0%) | 67 (100.0%) |
Health & Disability in Ualapue
Health Insurance Coverage by Age in Ualapue
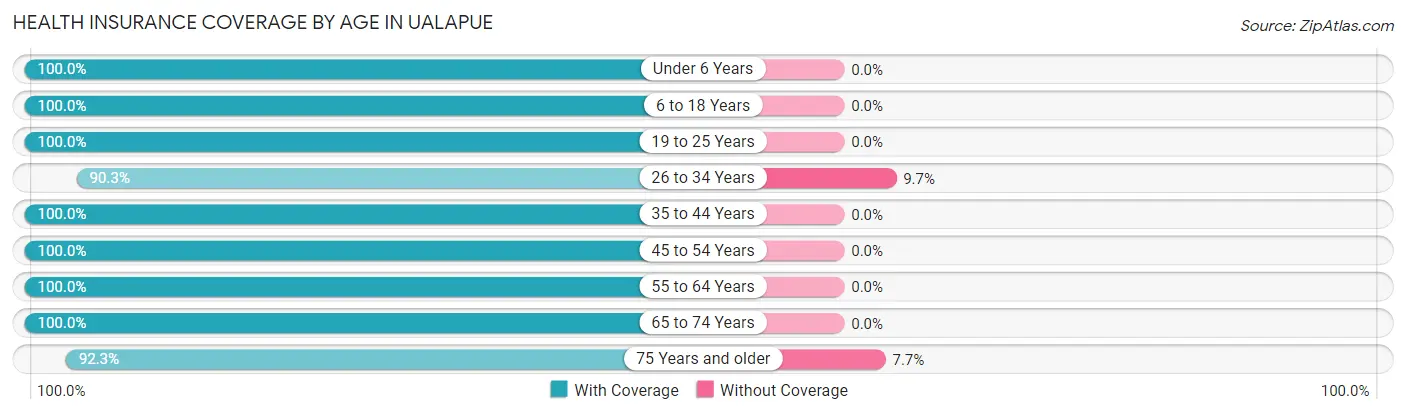
| Age Bracket | With Coverage | Without Coverage |
| Under 6 Years | 47 (100.0%) | 0 (0.0%) |
| 6 to 18 Years | 83 (100.0%) | 0 (0.0%) |
| 19 to 25 Years | 12 (100.0%) | 0 (0.0%) |
| 26 to 34 Years | 56 (90.3%) | 6 (9.7%) |
| 35 to 44 Years | 36 (100.0%) | 0 (0.0%) |
| 45 to 54 Years | 26 (100.0%) | 0 (0.0%) |
| 55 to 64 Years | 65 (100.0%) | 0 (0.0%) |
| 65 to 74 Years | 92 (100.0%) | 0 (0.0%) |
| 75 Years and older | 48 (92.3%) | 4 (7.7%) |
| Total | 465 (97.9%) | 10 (2.1%) |
Health Insurance Coverage by Citizenship Status in Ualapue
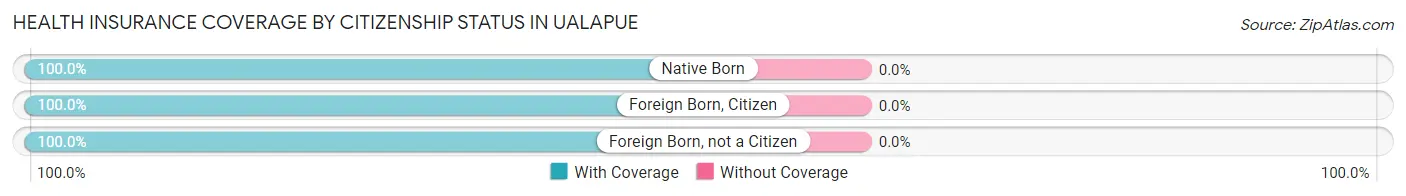
| Citizenship Status | With Coverage | Without Coverage |
| Native Born | 47 (100.0%) | 0 (0.0%) |
| Foreign Born, Citizen | 83 (100.0%) | 0 (0.0%) |
| Foreign Born, not a Citizen | 12 (100.0%) | 0 (0.0%) |
Health Insurance Coverage by Household Income in Ualapue
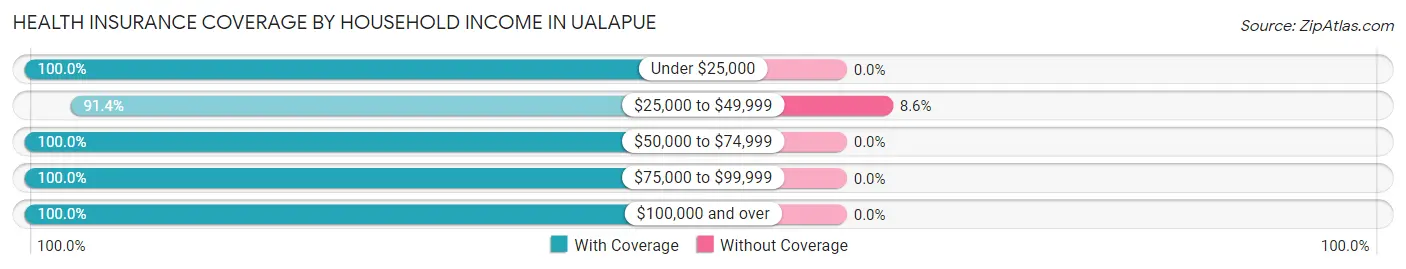
| Household Income | With Coverage | Without Coverage |
| Under $25,000 | 39 (100.0%) | 0 (0.0%) |
| $25,000 to $49,999 | 106 (91.4%) | 10 (8.6%) |
| $50,000 to $74,999 | 65 (100.0%) | 0 (0.0%) |
| $75,000 to $99,999 | 95 (100.0%) | 0 (0.0%) |
| $100,000 and over | 160 (100.0%) | 0 (0.0%) |
Public vs Private Health Insurance Coverage by Age in Ualapue
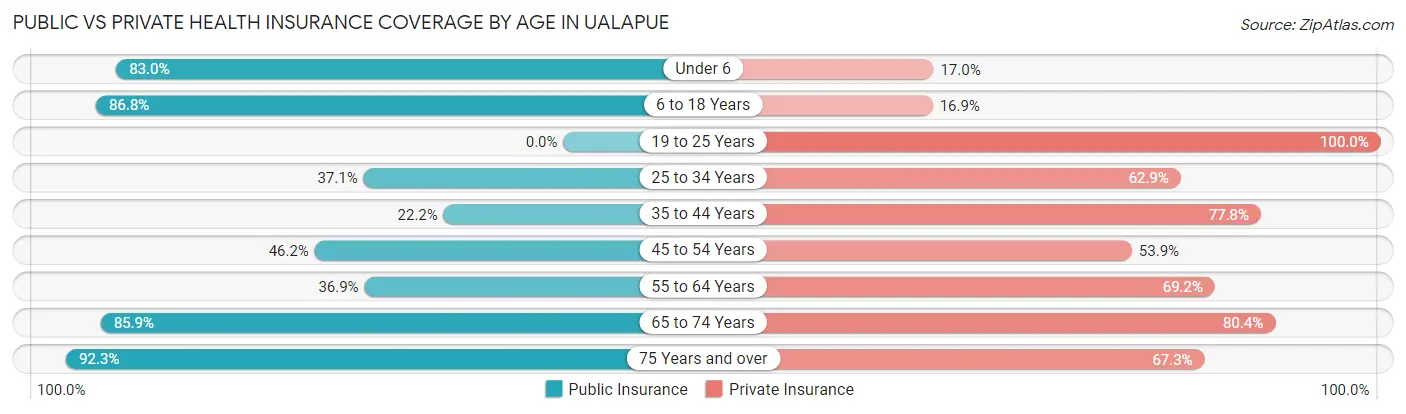
| Age Bracket | Public Insurance | Private Insurance |
| Under 6 | 39 (83.0%) | 8 (17.0%) |
| 6 to 18 Years | 72 (86.8%) | 14 (16.9%) |
| 19 to 25 Years | 0 (0.0%) | 12 (100.0%) |
| 25 to 34 Years | 23 (37.1%) | 39 (62.9%) |
| 35 to 44 Years | 8 (22.2%) | 28 (77.8%) |
| 45 to 54 Years | 12 (46.2%) | 14 (53.8%) |
| 55 to 64 Years | 24 (36.9%) | 45 (69.2%) |
| 65 to 74 Years | 79 (85.9%) | 74 (80.4%) |
| 75 Years and over | 48 (92.3%) | 35 (67.3%) |
| Total | 305 (64.2%) | 269 (56.6%) |
Disability Status by Sex by Age in Ualapue
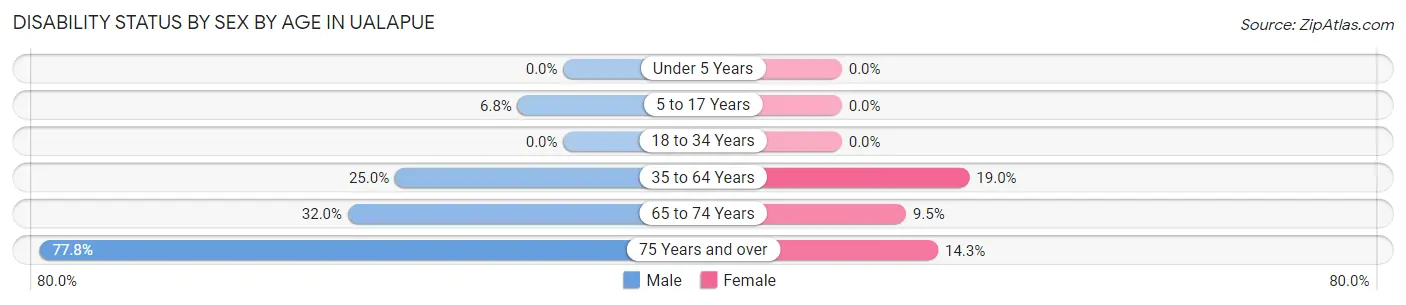
| Age Bracket | Male | Female |
| Under 5 Years | 0 (0.0%) | 0 (0.0%) |
| 5 to 17 Years | 4 (6.8%) | 0 (0.0%) |
| 18 to 34 Years | 0 (0.0%) | 0 (0.0%) |
| 35 to 64 Years | 8 (25.0%) | 18 (19.0%) |
| 65 to 74 Years | 16 (32.0%) | 4 (9.5%) |
| 75 Years and over | 35 (77.8%) | 1 (14.3%) |
Disability Class by Sex by Age in Ualapue
Disability Class: Hearing Difficulty
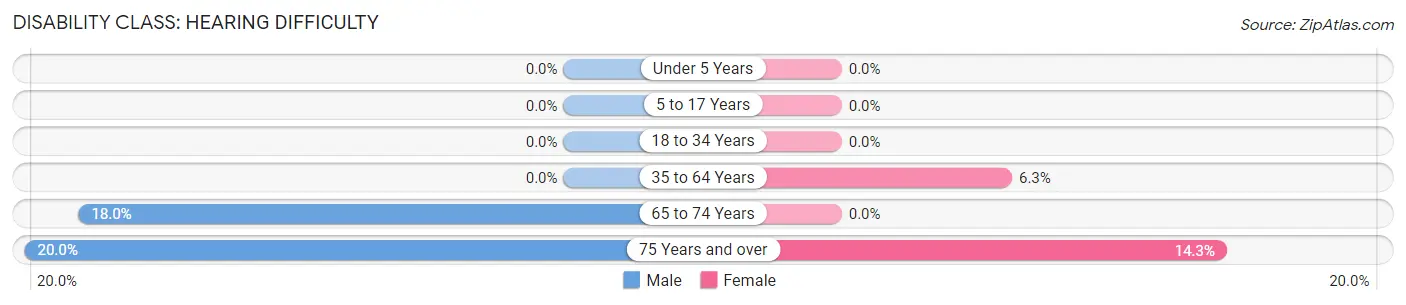
| Age Bracket | Male | Female |
| Under 5 Years | 0 (0.0%) | 0 (0.0%) |
| 5 to 17 Years | 0 (0.0%) | 0 (0.0%) |
| 18 to 34 Years | 0 (0.0%) | 0 (0.0%) |
| 35 to 64 Years | 0 (0.0%) | 6 (6.3%) |
| 65 to 74 Years | 9 (18.0%) | 0 (0.0%) |
| 75 Years and over | 9 (20.0%) | 1 (14.3%) |
Disability Class: Vision Difficulty
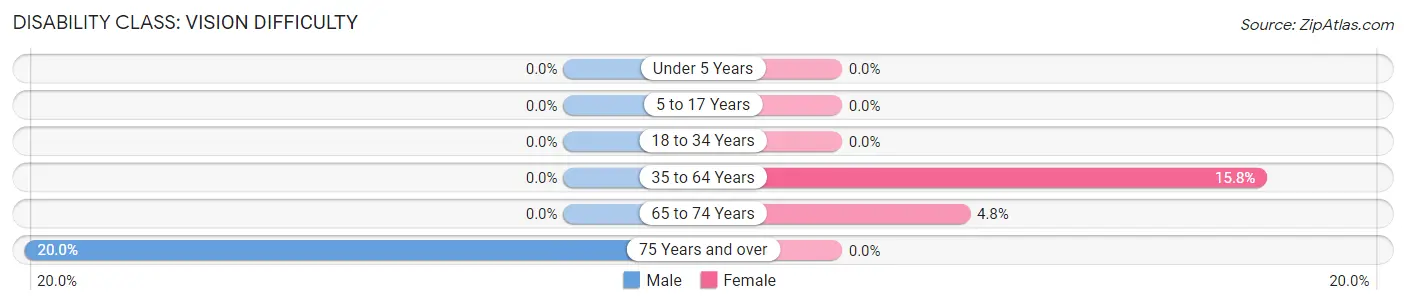
| Age Bracket | Male | Female |
| Under 5 Years | 0 (0.0%) | 0 (0.0%) |
| 5 to 17 Years | 0 (0.0%) | 0 (0.0%) |
| 18 to 34 Years | 0 (0.0%) | 0 (0.0%) |
| 35 to 64 Years | 0 (0.0%) | 15 (15.8%) |
| 65 to 74 Years | 0 (0.0%) | 2 (4.8%) |
| 75 Years and over | 9 (20.0%) | 0 (0.0%) |
Disability Class: Cognitive Difficulty
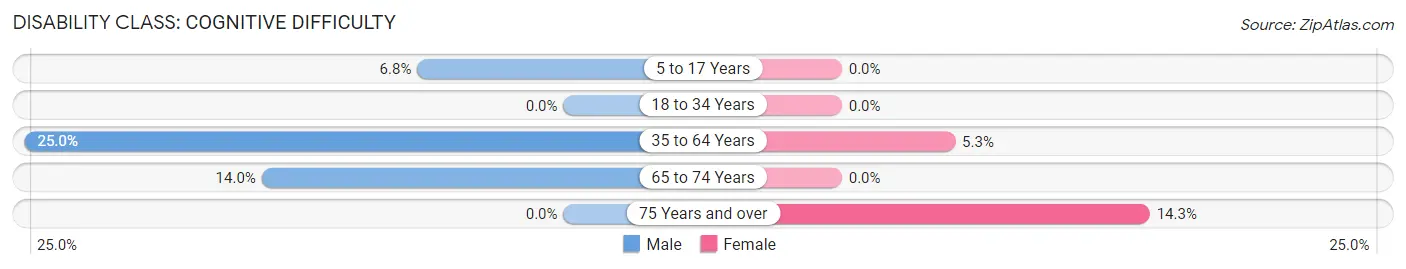
| Age Bracket | Male | Female |
| 5 to 17 Years | 4 (6.8%) | 0 (0.0%) |
| 18 to 34 Years | 0 (0.0%) | 0 (0.0%) |
| 35 to 64 Years | 8 (25.0%) | 5 (5.3%) |
| 65 to 74 Years | 7 (14.0%) | 0 (0.0%) |
| 75 Years and over | 0 (0.0%) | 1 (14.3%) |
Disability Class: Ambulatory Difficulty
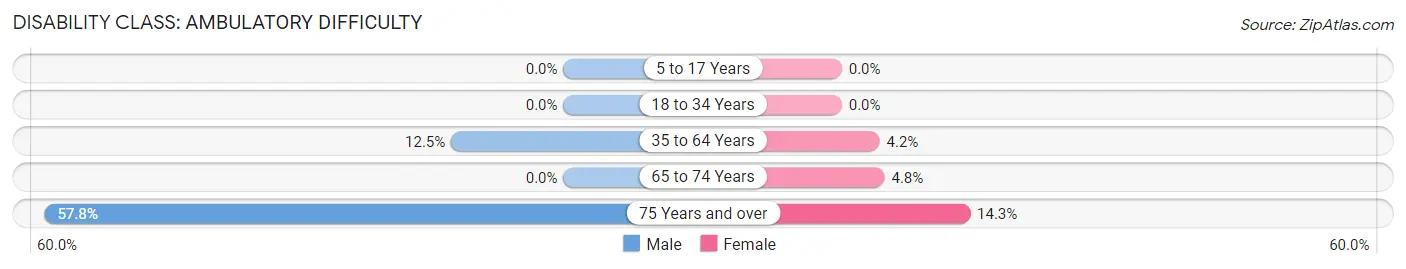
| Age Bracket | Male | Female |
| 5 to 17 Years | 0 (0.0%) | 0 (0.0%) |
| 18 to 34 Years | 0 (0.0%) | 0 (0.0%) |
| 35 to 64 Years | 4 (12.5%) | 4 (4.2%) |
| 65 to 74 Years | 0 (0.0%) | 2 (4.8%) |
| 75 Years and over | 26 (57.8%) | 1 (14.3%) |
Disability Class: Self-Care Difficulty
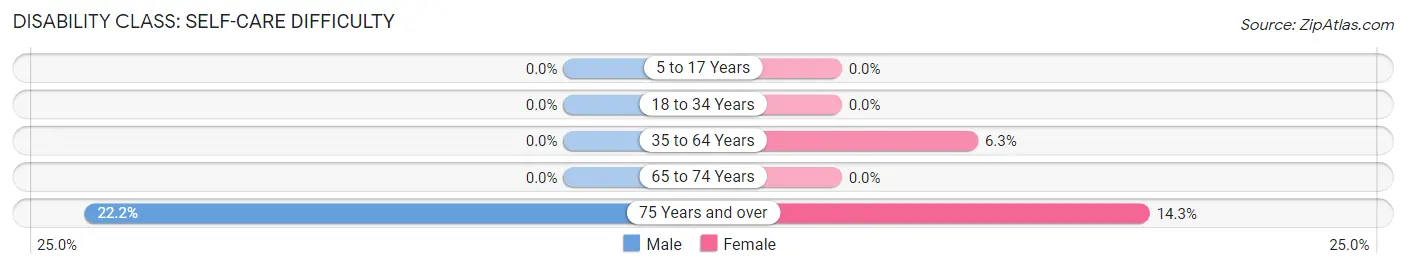
| Age Bracket | Male | Female |
| 5 to 17 Years | 0 (0.0%) | 0 (0.0%) |
| 18 to 34 Years | 0 (0.0%) | 0 (0.0%) |
| 35 to 64 Years | 0 (0.0%) | 6 (6.3%) |
| 65 to 74 Years | 0 (0.0%) | 0 (0.0%) |
| 75 Years and over | 10 (22.2%) | 1 (14.3%) |
Technology Access in Ualapue
Computing Device Access in Ualapue
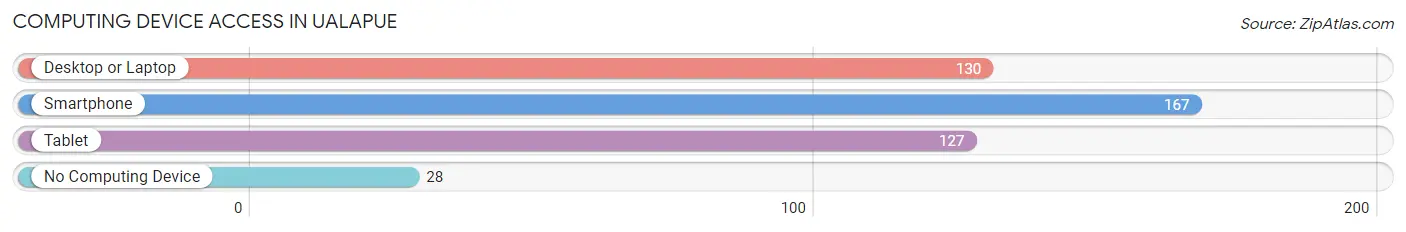
| Device Type | # Households | % Households |
| Desktop or Laptop | 130 | 63.7% |
| Smartphone | 167 | 81.9% |
| Tablet | 127 | 62.3% |
| No Computing Device | 28 | 13.7% |
| Total | 204 | 100.0% |
Internet Access in Ualapue
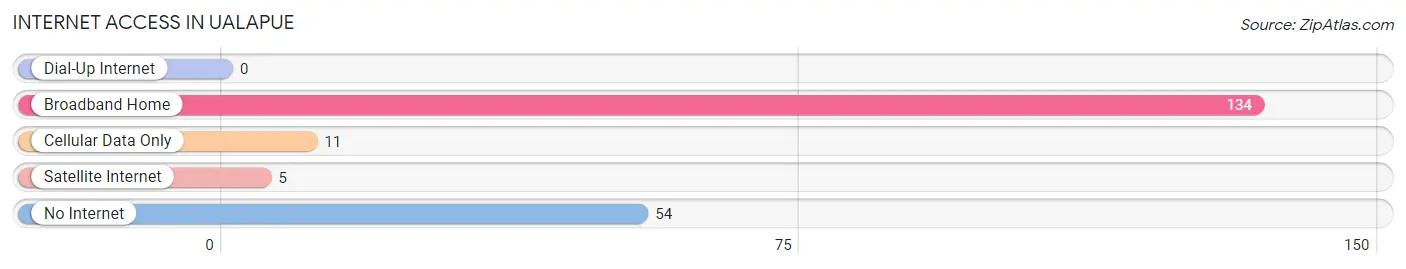
| Internet Type | # Households | % Households |
| Dial-Up Internet | 0 | 0.0% |
| Broadband Home | 134 | 65.7% |
| Cellular Data Only | 11 | 5.4% |
| Satellite Internet | 5 | 2.5% |
| No Internet | 54 | 26.5% |
| Total | 204 | 100.0% |
Ualapue Summary
Ualapue is a small unincorporated community located on the island of Molokai in the state of Hawaii. It is located in the southeastern part of the island, about 10 miles from the town of Kaunakakai. The population of Ualapue was estimated to be around 500 people in 2000.
History
Ualapue was first settled by Native Hawaiians in the late 1700s. The area was used for subsistence farming and fishing. In the early 1800s, the area was used for cattle ranching. In the late 1800s, the area was used for sugar cane production. The sugar cane industry was the main source of income for the area until the early 1900s when the industry declined.
In the early 1900s, the area was used for pineapple production. The pineapple industry was the main source of income for the area until the late 1970s when the industry declined.
In the late 1970s, the area was used for tourism. The area is now known for its beautiful beaches, hiking trails, and fishing.
Geography
Ualapue is located on the southeastern part of the island of Molokai. The area is surrounded by the Pacific Ocean to the east and the Molokai Channel to the south. The area is mostly flat with some rolling hills. The climate is tropical with temperatures ranging from 70 to 90 degrees Fahrenheit.
Economy
The economy of Ualapue is mainly based on tourism. The area is known for its beautiful beaches, hiking trails, and fishing. There are also several small businesses in the area such as restaurants, stores, and hotels.
Demographics
The population of Ualapue was estimated to be around 500 people in 2000. The majority of the population is Native Hawaiian. The median household income is around $30,000. The median age is around 40 years old. The majority of the population is employed in the tourism industry.
Common Questions
What is Per Capita Income in Ualapue?
Per Capita income in Ualapue is $33,038.
What is the Median Family Income in Ualapue?
Median Family Income in Ualapue is $85,893.
What is the Median Household income in Ualapue?
Median Household Income in Ualapue is $54,457.
What is Income or Wage Gap in Ualapue?
Income or Wage Gap in Ualapue is 20.6%.
Women in Ualapue earn 79.4 cents for every dollar earned by a man.
What is Inequality or Gini Index in Ualapue?
Inequality or Gini Index in Ualapue is 0.40.
What is the Total Population of Ualapue?
Total Population of Ualapue is 480.
What is the Total Male Population of Ualapue?
Total Male Population of Ualapue is 234.
What is the Total Female Population of Ualapue?
Total Female Population of Ualapue is 246.
What is the Ratio of Males per 100 Females in Ualapue?
There are 95.12 Males per 100 Females in Ualapue.
What is the Ratio of Females per 100 Males in Ualapue?
There are 105.13 Females per 100 Males in Ualapue.
What is the Median Population Age in Ualapue?
Median Population Age in Ualapue is 42.3 Years.
What is the Average Family Size in Ualapue
Average Family Size in Ualapue is 3.2 People.
What is the Average Household Size in Ualapue
Average Household Size in Ualapue is 2.4 People.
How Large is the Labor Force in Ualapue?
There are 194 People in the Labor Forcein in Ualapue.
What is the Percentage of People in the Labor Force in Ualapue?
51.9% of People are in the Labor Force in Ualapue.