Waikoloa Village, HI Map & Demographics
Waikoloa Village Map
Waikoloa Village Overview
$35,769
PER CAPITA INCOME
$105,806
AVG FAMILY INCOME
$103,135
AVG HOUSEHOLD INCOME
26.3%
WAGE / INCOME GAP [ % ]
73.7¢/ $1
WAGE / INCOME GAP [ $ ]
$12,012
FAMILY INCOME DEFICIT
0.34
INEQUALITY / GINI INDEX
7,418
TOTAL POPULATION
3,656
MALE POPULATION
3,762
FEMALE POPULATION
97.18
MALES / 100 FEMALES
102.90
FEMALES / 100 MALES
38.1
MEDIAN AGE
3.2
AVG FAMILY SIZE
2.9
AVG HOUSEHOLD SIZE
3,789
LABOR FORCE [ PEOPLE ]
67.4%
PERCENT IN LABOR FORCE
9.8%
UNEMPLOYMENT RATE
Income in Waikoloa Village
Income Overview in Waikoloa Village
Per Capita Income in Waikoloa Village is $35,769, while median incomes of families and households are $105,806 and $103,135 respectively.
| Characteristic | Number | Measure |
| Per Capita Income | 7,418 | $35,769 |
| Median Family Income | 1,969 | $105,806 |
| Mean Family Income | 1,969 | $108,481 |
| Median Household Income | 2,568 | $103,135 |
| Mean Household Income | 2,568 | $102,939 |
| Income Deficit | 1,969 | $12,012 |
| Wage / Income Gap (%) | 7,418 | 26.35% |
| Wage / Income Gap ($) | 7,418 | 73.65¢ per $1 |
| Gini / Inequality Index | 7,418 | 0.34 |
Earnings by Sex in Waikoloa Village
Average Earnings in Waikoloa Village are $41,741, $48,945 for men and $36,048 for women, a difference of 26.4%.
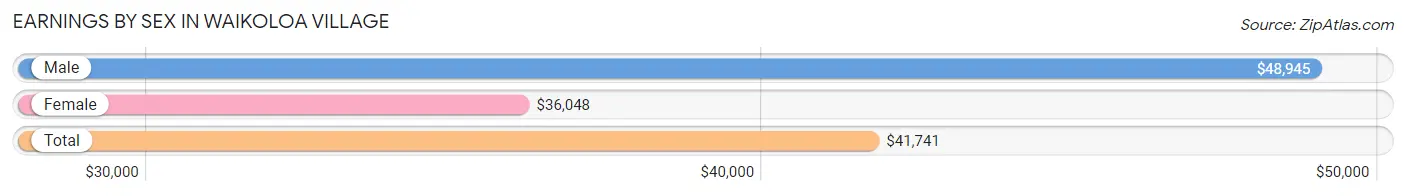
| Sex | Number | Average Earnings |
| Male | 2,113 (52.7%) | $48,945 |
| Female | 1,897 (47.3%) | $36,048 |
| Total | 4,010 (100.0%) | $41,741 |
Earnings by Sex by Income Bracket in Waikoloa Village
The most common earnings brackets in Waikoloa Village are $100,000+ for men (263 | 12.4%) and $35,000 to $39,999 for women (218 | 11.5%).
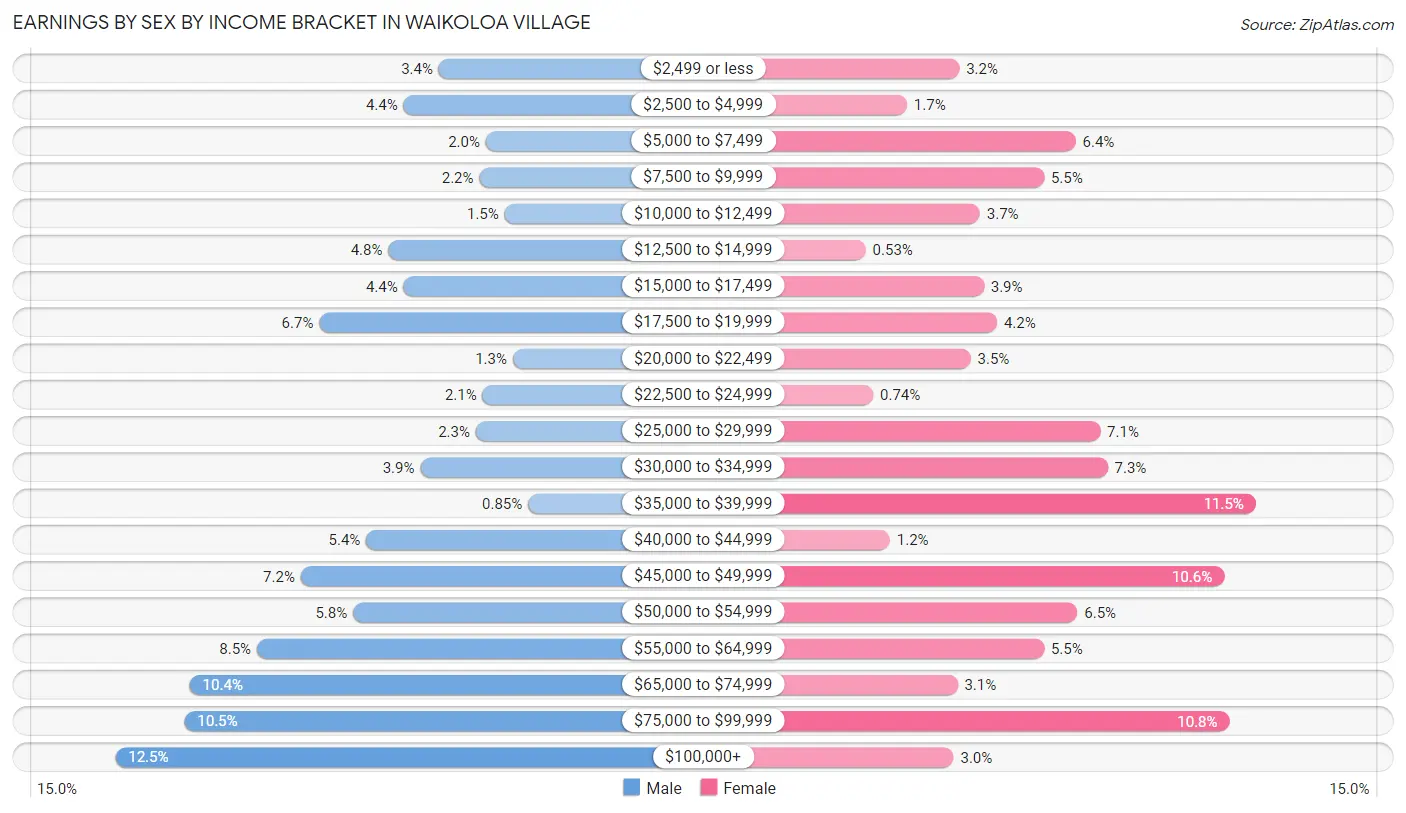
| Income | Male | Female |
| $2,499 or less | 71 (3.4%) | 60 (3.2%) |
| $2,500 to $4,999 | 92 (4.3%) | 32 (1.7%) |
| $5,000 to $7,499 | 43 (2.0%) | 122 (6.4%) |
| $7,500 to $9,999 | 47 (2.2%) | 105 (5.5%) |
| $10,000 to $12,499 | 32 (1.5%) | 71 (3.7%) |
| $12,500 to $14,999 | 101 (4.8%) | 10 (0.5%) |
| $15,000 to $17,499 | 92 (4.3%) | 73 (3.8%) |
| $17,500 to $19,999 | 142 (6.7%) | 80 (4.2%) |
| $20,000 to $22,499 | 27 (1.3%) | 66 (3.5%) |
| $22,500 to $24,999 | 45 (2.1%) | 14 (0.7%) |
| $25,000 to $29,999 | 49 (2.3%) | 135 (7.1%) |
| $30,000 to $34,999 | 82 (3.9%) | 139 (7.3%) |
| $35,000 to $39,999 | 18 (0.9%) | 218 (11.5%) |
| $40,000 to $44,999 | 114 (5.4%) | 23 (1.2%) |
| $45,000 to $49,999 | 153 (7.2%) | 201 (10.6%) |
| $50,000 to $54,999 | 122 (5.8%) | 123 (6.5%) |
| $55,000 to $64,999 | 179 (8.5%) | 105 (5.5%) |
| $65,000 to $74,999 | 219 (10.4%) | 59 (3.1%) |
| $75,000 to $99,999 | 222 (10.5%) | 204 (10.7%) |
| $100,000+ | 263 (12.4%) | 57 (3.0%) |
| Total | 2,113 (100.0%) | 1,897 (100.0%) |
Earnings by Sex by Educational Attainment in Waikoloa Village
Average earnings in Waikoloa Village are $52,873 for men and $35,947 for women, a difference of 32.0%. Men with an educational attainment of bachelor's degree enjoy the highest average annual earnings of $73,504, while those with college or associate's degree education earn the least with $45,139. Women with an educational attainment of graduate degree earn the most with the average annual earnings of $68,977, while those with college or associate's degree education have the smallest earnings of $22,284.
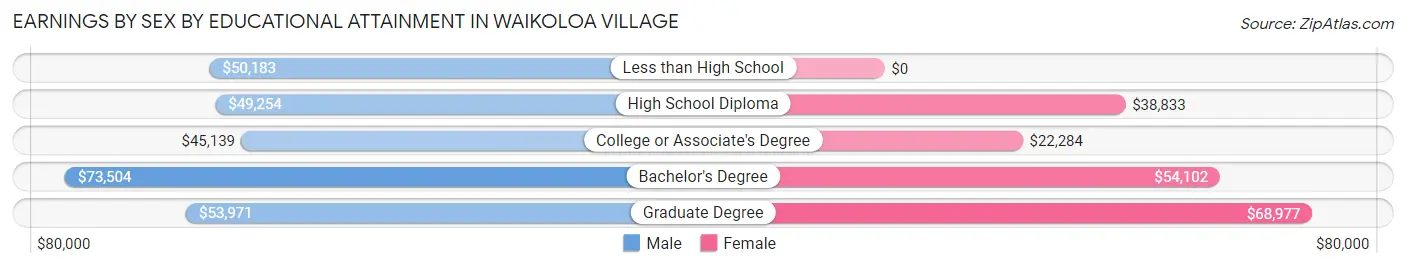
| Educational Attainment | Male Income | Female Income |
| Less than High School | $50,183 | $0 |
| High School Diploma | $49,254 | $38,833 |
| College or Associate's Degree | $45,139 | $22,284 |
| Bachelor's Degree | $73,504 | $54,102 |
| Graduate Degree | $53,971 | $68,977 |
| Total | $52,873 | $35,947 |
Family Income in Waikoloa Village
Family Income Brackets in Waikoloa Village
According to the Waikoloa Village family income data, there are 677 families falling into the $100,000 to $149,999 income range, which is the most common income bracket and makes up 34.4% of all families.
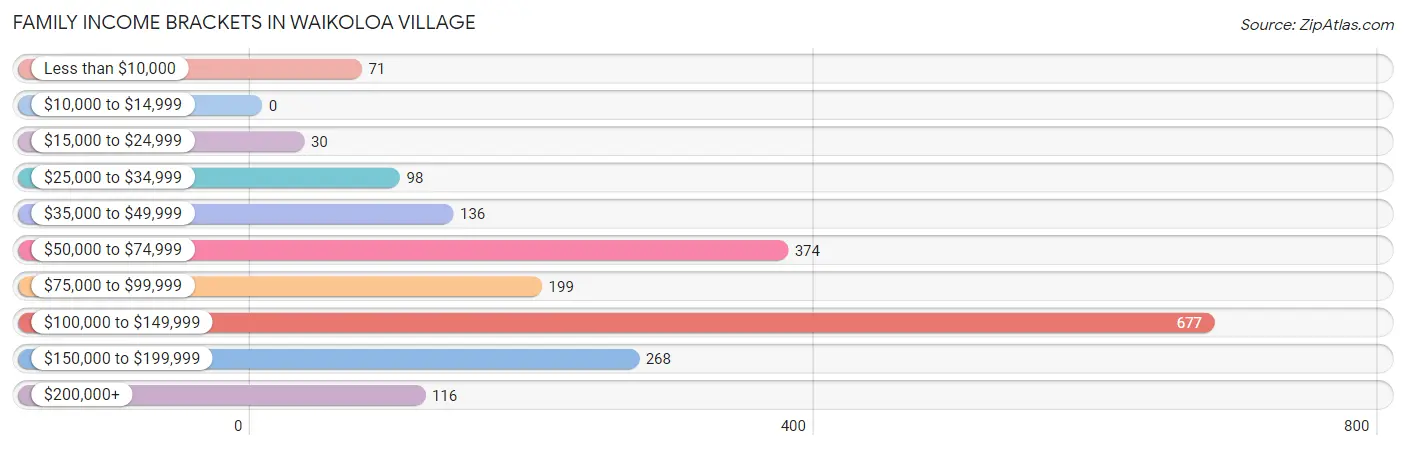
| Income Bracket | # Families | % Families |
| Less than $10,000 | 71 | 3.6% |
| $10,000 to $14,999 | 0 | 0.0% |
| $15,000 to $24,999 | 30 | 1.5% |
| $25,000 to $34,999 | 98 | 5.0% |
| $35,000 to $49,999 | 136 | 6.9% |
| $50,000 to $74,999 | 374 | 19.0% |
| $75,000 to $99,999 | 199 | 10.1% |
| $100,000 to $149,999 | 677 | 34.4% |
| $150,000 to $199,999 | 268 | 13.6% |
| $200,000+ | 116 | 5.9% |
Family Income by Famaliy Size in Waikoloa Village
5-person families (136 | 6.9%) account for the highest median family income in Waikoloa Village with $108,650 per family, while 2-person families (952 | 48.3%) have the highest median income of $44,982 per family member.
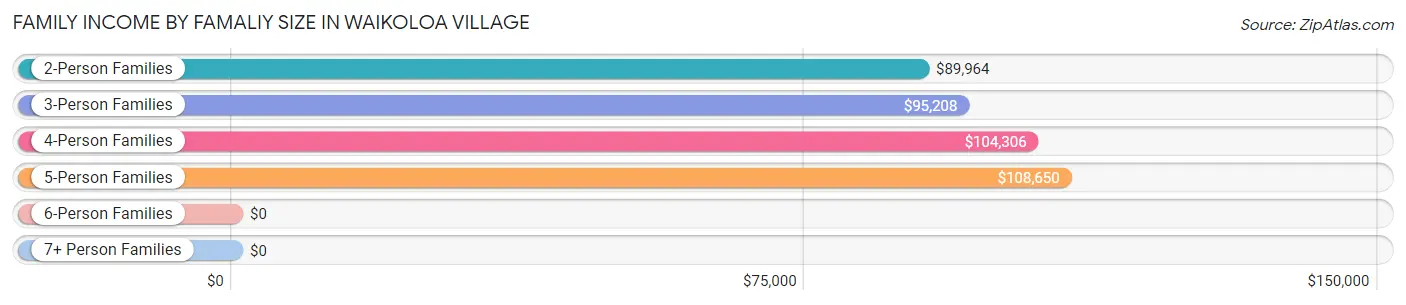
| Income Bracket | # Families | Median Income |
| 2-Person Families | 952 (48.3%) | $89,964 |
| 3-Person Families | 277 (14.1%) | $95,208 |
| 4-Person Families | 413 (21.0%) | $104,306 |
| 5-Person Families | 136 (6.9%) | $108,650 |
| 6-Person Families | 139 (7.1%) | $0 |
| 7+ Person Families | 52 (2.6%) | $0 |
| Total | 1,969 (100.0%) | $105,806 |
Family Income by Number of Earners in Waikoloa Village
The median family income in Waikoloa Village is $105,806, with families comprising 3+ earners (199) having the highest median family income of $160,216, while families with 1 earner (491) have the lowest median family income of $57,188, accounting for 10.1% and 24.9% of families, respectively.
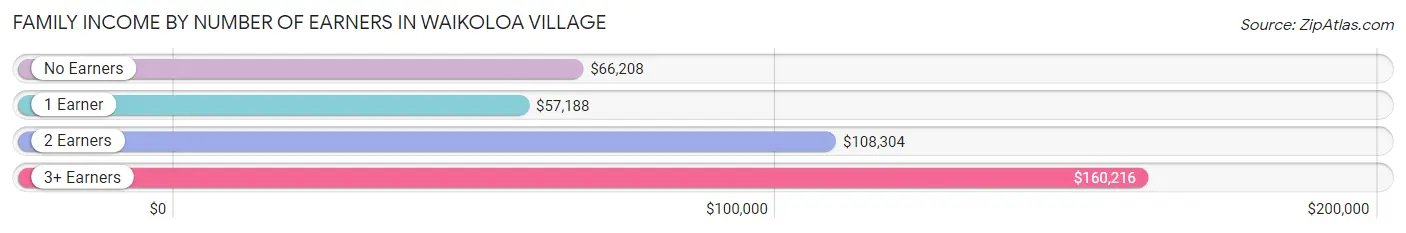
| Number of Earners | # Families | Median Income |
| No Earners | 277 (14.1%) | $66,208 |
| 1 Earner | 491 (24.9%) | $57,188 |
| 2 Earners | 1,002 (50.9%) | $108,304 |
| 3+ Earners | 199 (10.1%) | $160,216 |
| Total | 1,969 (100.0%) | $105,806 |
Household Income in Waikoloa Village
Household Income Brackets in Waikoloa Village
With 783 households falling in the category, the $100,000 to $149,999 income range is the most frequent in Waikoloa Village, accounting for 30.5% of all households. In contrast, only 3 households (0.1%) fall into the $10,000 to $14,999 income bracket, making it the least populous group.
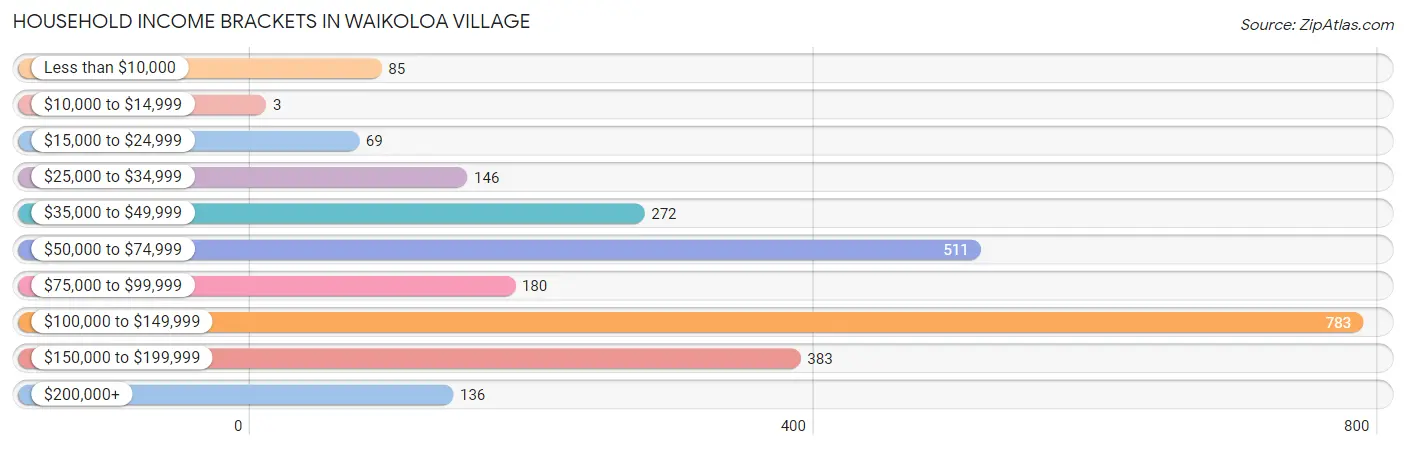
| Income Bracket | # Households | % Households |
| Less than $10,000 | 85 | 3.3% |
| $10,000 to $14,999 | 3 | 0.1% |
| $15,000 to $24,999 | 69 | 2.7% |
| $25,000 to $34,999 | 146 | 5.7% |
| $35,000 to $49,999 | 272 | 10.6% |
| $50,000 to $74,999 | 511 | 19.9% |
| $75,000 to $99,999 | 180 | 7.0% |
| $100,000 to $149,999 | 783 | 30.5% |
| $150,000 to $199,999 | 383 | 14.9% |
| $200,000+ | 136 | 5.3% |
Household Income by Householder Age in Waikoloa Village
The median household income in Waikoloa Village is $103,135, with the highest median household income of $108,973 found in the 25 to 44 years age bracket for the primary householder. A total of 991 households (38.6%) fall into this category.
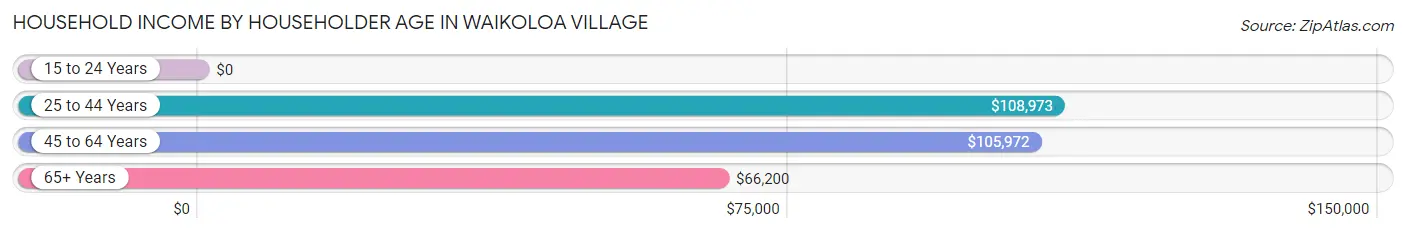
| Income Bracket | # Households | Median Income |
| 15 to 24 Years | 0 (0.0%) | $0 |
| 25 to 44 Years | 991 (38.6%) | $108,973 |
| 45 to 64 Years | 819 (31.9%) | $105,972 |
| 65+ Years | 758 (29.5%) | $66,200 |
| Total | 2,568 (100.0%) | $103,135 |
Poverty in Waikoloa Village
Income Below Poverty by Sex and Age in Waikoloa Village
With 11.9% poverty level for males and 10.4% for females among the residents of Waikoloa Village, 6 to 11 year old males and 6 to 11 year old females are the most vulnerable to poverty, with 169 males (48.6%) and 125 females (32.6%) in their respective age groups living below the poverty level.
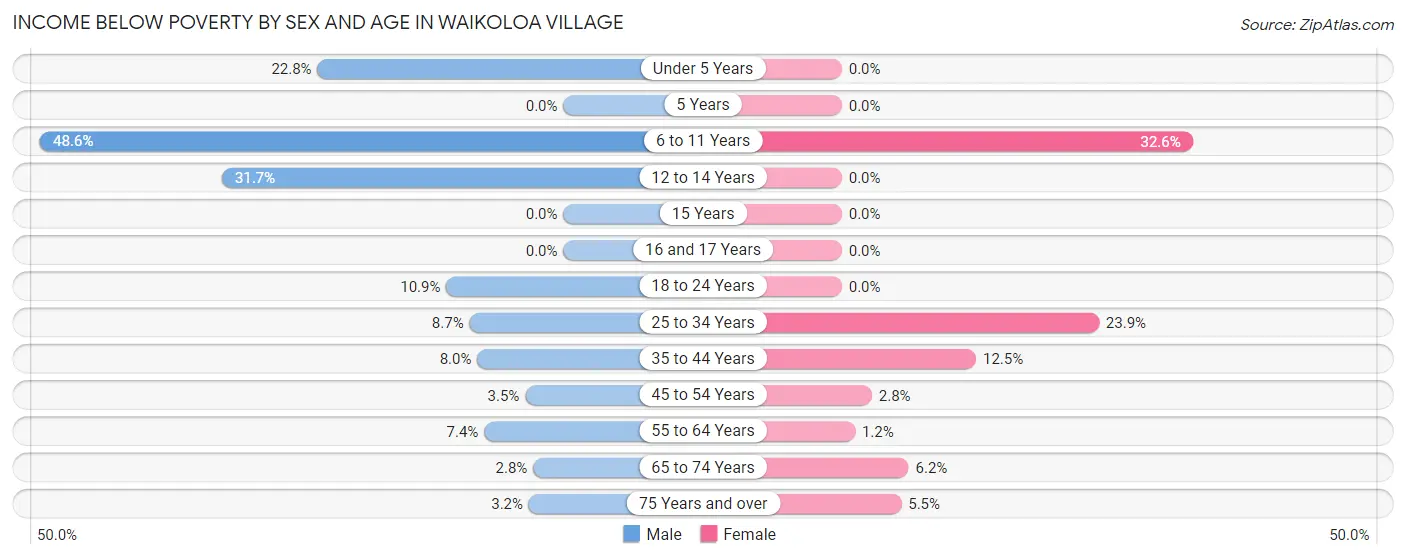
| Age Bracket | Male | Female |
| Under 5 Years | 55 (22.8%) | 0 (0.0%) |
| 5 Years | 0 (0.0%) | 0 (0.0%) |
| 6 to 11 Years | 169 (48.6%) | 125 (32.6%) |
| 12 to 14 Years | 45 (31.7%) | 0 (0.0%) |
| 15 Years | 0 (0.0%) | 0 (0.0%) |
| 16 and 17 Years | 0 (0.0%) | 0 (0.0%) |
| 18 to 24 Years | 19 (10.9%) | 0 (0.0%) |
| 25 to 34 Years | 29 (8.7%) | 126 (23.9%) |
| 35 to 44 Years | 50 (8.0%) | 82 (12.5%) |
| 45 to 54 Years | 14 (3.5%) | 10 (2.8%) |
| 55 to 64 Years | 33 (7.3%) | 5 (1.2%) |
| 65 to 74 Years | 12 (2.8%) | 25 (6.2%) |
| 75 Years and over | 9 (3.2%) | 10 (5.5%) |
| Total | 435 (11.9%) | 383 (10.4%) |
Income Above Poverty by Sex and Age in Waikoloa Village
According to the poverty statistics in Waikoloa Village, males aged 15 years and females aged under 5 years are the age groups that are most secure financially, with 100.0% of males and 100.0% of females in these age groups living above the poverty line.
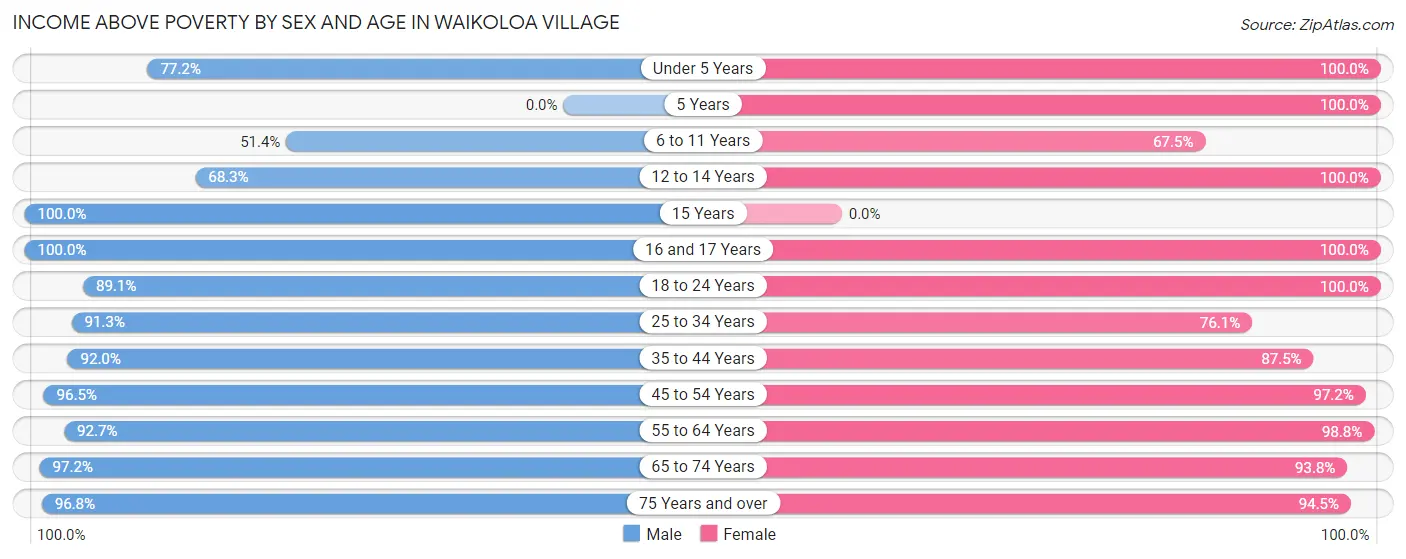
| Age Bracket | Male | Female |
| Under 5 Years | 186 (77.2%) | 283 (100.0%) |
| 5 Years | 0 (0.0%) | 68 (100.0%) |
| 6 to 11 Years | 179 (51.4%) | 259 (67.4%) |
| 12 to 14 Years | 97 (68.3%) | 213 (100.0%) |
| 15 Years | 19 (100.0%) | 0 (0.0%) |
| 16 and 17 Years | 202 (100.0%) | 134 (100.0%) |
| 18 to 24 Years | 156 (89.1%) | 60 (100.0%) |
| 25 to 34 Years | 304 (91.3%) | 402 (76.1%) |
| 35 to 44 Years | 576 (92.0%) | 576 (87.5%) |
| 45 to 54 Years | 381 (96.5%) | 348 (97.2%) |
| 55 to 64 Years | 416 (92.6%) | 405 (98.8%) |
| 65 to 74 Years | 417 (97.2%) | 378 (93.8%) |
| 75 Years and over | 272 (96.8%) | 171 (94.5%) |
| Total | 3,205 (88.0%) | 3,297 (89.6%) |
Income Below Poverty Among Married-Couple Families in Waikoloa Village
The poverty statistics for married-couple families in Waikoloa Village show that 3.3% or 55 of the total 1,659 families live below the poverty line. Families with 1 or 2 children have the highest poverty rate of 5.8%, comprising of 36 families. On the other hand, families with 3 or 4 children have the lowest poverty rate of 0.0%, which includes 0 families.
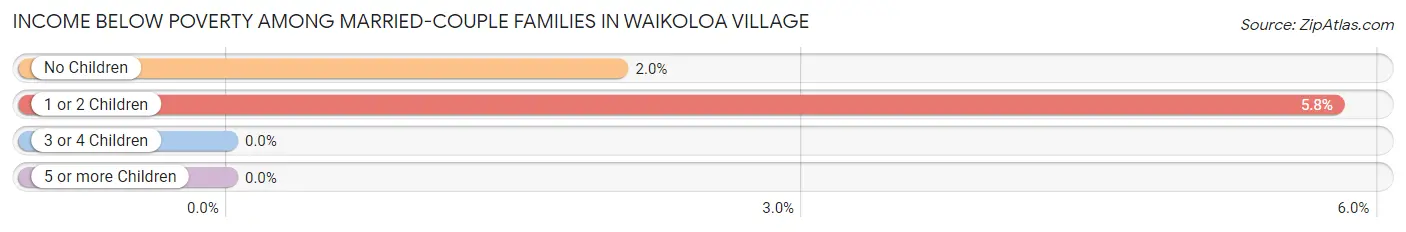
| Children | Above Poverty | Below Poverty |
| No Children | 913 (98.0%) | 19 (2.0%) |
| 1 or 2 Children | 587 (94.2%) | 36 (5.8%) |
| 3 or 4 Children | 104 (100.0%) | 0 (0.0%) |
| 5 or more Children | 0 (0.0%) | 0 (0.0%) |
| Total | 1,604 (96.7%) | 55 (3.3%) |
Income Below Poverty Among Single-Parent Households in Waikoloa Village
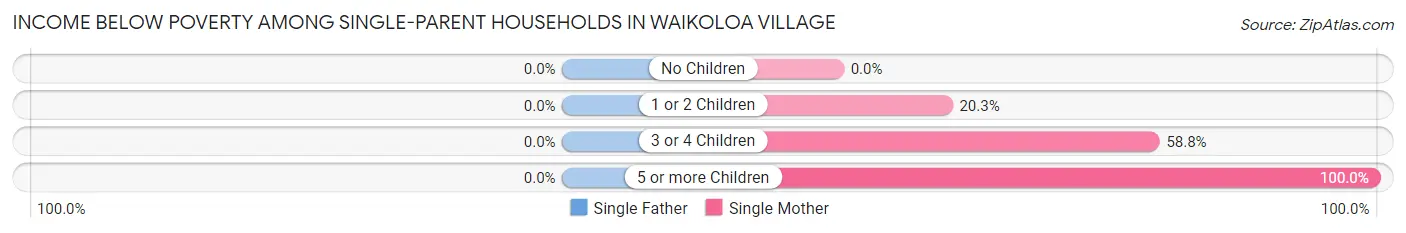
| Children | Single Father | Single Mother |
| No Children | 0 (0.0%) | 0 (0.0%) |
| 1 or 2 Children | 0 (0.0%) | 15 (20.3%) |
| 3 or 4 Children | 0 (0.0%) | 30 (58.8%) |
| 5 or more Children | 0 (0.0%) | 69 (100.0%) |
| Total | 0 (0.0%) | 114 (48.9%) |
Income Below Poverty Among Married-Couple vs Single-Parent Households in Waikoloa Village
The poverty data for Waikoloa Village shows that 55 of the married-couple family households (3.3%) and 114 of the single-parent households (36.8%) are living below the poverty level. Within the married-couple family households, those with 1 or 2 children have the highest poverty rate, with 36 households (5.8%) falling below the poverty line. Among the single-parent households, those with 5 or more children have the highest poverty rate, with 69 household (100.0%) living below poverty.

| Children | Married-Couple Families | Single-Parent Households |
| No Children | 19 (2.0%) | 0 (0.0%) |
| 1 or 2 Children | 36 (5.8%) | 15 (14.0%) |
| 3 or 4 Children | 0 (0.0%) | 30 (58.8%) |
| 5 or more Children | 0 (0.0%) | 69 (100.0%) |
| Total | 55 (3.3%) | 114 (36.8%) |
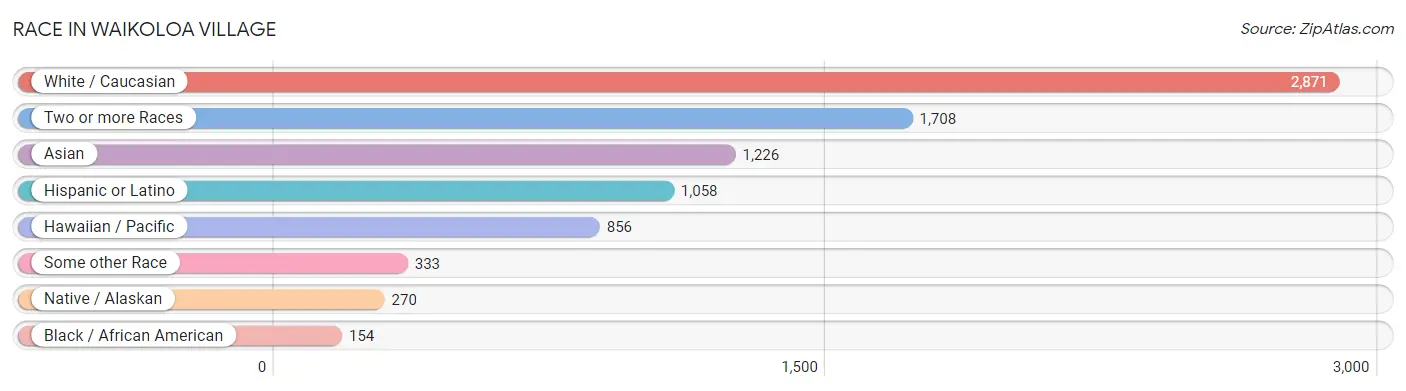
Race in Waikoloa Village
The most populous races in Waikoloa Village are White / Caucasian (2,871 | 38.7%), Two or more Races (1,708 | 23.0%), and Asian (1,226 | 16.5%).
| Race | # Population | % Population |
| Asian | 1,226 | 16.5% |
| Black / African American | 154 | 2.1% |
| Hawaiian / Pacific | 856 | 11.5% |
| Hispanic or Latino | 1,058 | 14.3% |
| Native / Alaskan | 270 | 3.6% |
| White / Caucasian | 2,871 | 38.7% |
| Two or more Races | 1,708 | 23.0% |
| Some other Race | 333 | 4.5% |
| Total | 7,418 | 100.0% |
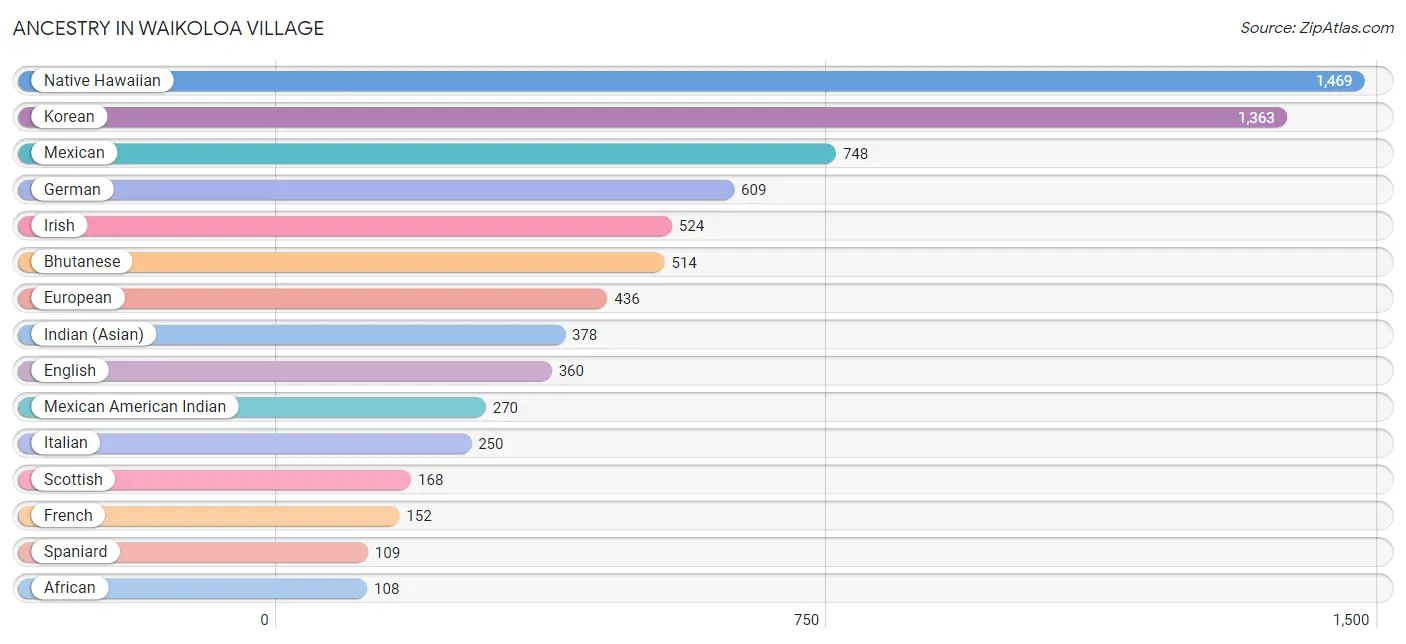
Ancestry in Waikoloa Village
The most populous ancestries reported in Waikoloa Village are Native Hawaiian (1,469 | 19.8%), Korean (1,363 | 18.4%), Mexican (748 | 10.1%), German (609 | 8.2%), and Irish (524 | 7.1%), together accounting for 63.5% of all Waikoloa Village residents.
| Ancestry | # Population | % Population |
| African | 108 | 1.5% |
| American | 67 | 0.9% |
| Arab | 12 | 0.2% |
| Argentinean | 18 | 0.2% |
| Armenian | 30 | 0.4% |
| Australian | 17 | 0.2% |
| Austrian | 11 | 0.2% |
| Bhutanese | 514 | 6.9% |
| Blackfeet | 13 | 0.2% |
| British | 8 | 0.1% |
| Burmese | 75 | 1.0% |
| Canadian | 42 | 0.6% |
| Central American | 72 | 1.0% |
| Dutch | 42 | 0.6% |
| Eastern European | 10 | 0.1% |
| English | 360 | 4.9% |
| European | 436 | 5.9% |
| French | 152 | 2.1% |
| German | 609 | 8.2% |
| Greek | 12 | 0.2% |
| Guatemalan | 26 | 0.4% |
| Hungarian | 38 | 0.5% |
| Indian (Asian) | 378 | 5.1% |
| Iranian | 19 | 0.3% |
| Irish | 524 | 7.1% |
| Italian | 250 | 3.4% |
| Korean | 1,363 | 18.4% |
| Laotian | 86 | 1.2% |
| Latvian | 29 | 0.4% |
| Malaysian | 31 | 0.4% |
| Mexican | 748 | 10.1% |
| Mexican American Indian | 270 | 3.6% |
| Native Hawaiian | 1,469 | 19.8% |
| Northern European | 32 | 0.4% |
| Norwegian | 10 | 0.1% |
| Panamanian | 46 | 0.6% |
| Polish | 12 | 0.2% |
| Portuguese | 94 | 1.3% |
| Puerto Rican | 71 | 1.0% |
| Romanian | 16 | 0.2% |
| Russian | 54 | 0.7% |
| Samoan | 29 | 0.4% |
| Scandinavian | 19 | 0.3% |
| Scotch-Irish | 15 | 0.2% |
| Scottish | 168 | 2.3% |
| Slovene | 4 | 0.1% |
| South American | 18 | 0.2% |
| Spaniard | 109 | 1.5% |
| Spanish | 9 | 0.1% |
| Sri Lankan | 32 | 0.4% |
| Subsaharan African | 108 | 1.5% |
| Swedish | 33 | 0.4% |
| Swiss | 10 | 0.1% |
| Thai | 31 | 0.4% |
| Welsh | 37 | 0.5% | View All 55 Rows |
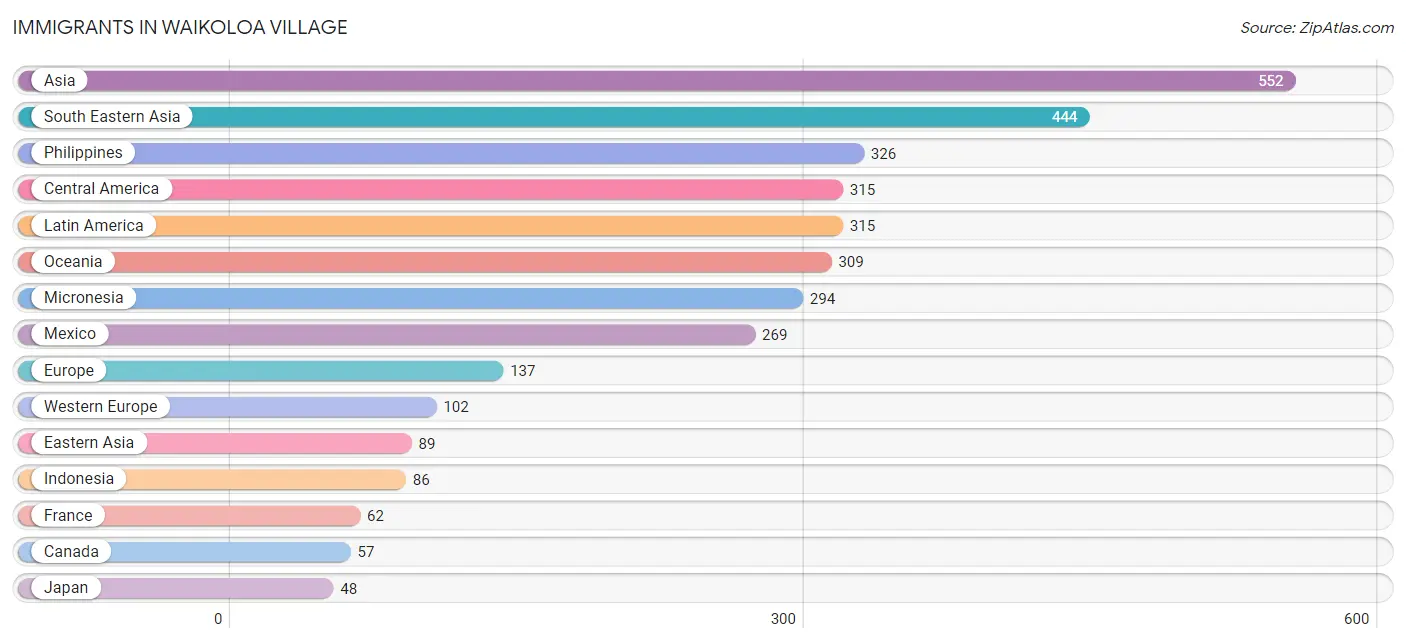
Immigrants in Waikoloa Village
The most numerous immigrant groups reported in Waikoloa Village came from Asia (552 | 7.4%), South Eastern Asia (444 | 6.0%), Philippines (326 | 4.4%), Central America (315 | 4.3%), and Latin America (315 | 4.3%), together accounting for 26.3% of all Waikoloa Village residents.
| Immigration Origin | # Population | % Population |
| Africa | 32 | 0.4% |
| Asia | 552 | 7.4% |
| Canada | 57 | 0.8% |
| Central America | 315 | 4.3% |
| China | 27 | 0.4% |
| Eastern Asia | 89 | 1.2% |
| Eastern Europe | 10 | 0.1% |
| England | 15 | 0.2% |
| Europe | 137 | 1.8% |
| France | 62 | 0.8% |
| Germany | 19 | 0.3% |
| Guatemala | 26 | 0.4% |
| Indonesia | 86 | 1.2% |
| Iran | 19 | 0.3% |
| Italy | 10 | 0.1% |
| Japan | 48 | 0.6% |
| Korea | 14 | 0.2% |
| Latin America | 315 | 4.3% |
| Mexico | 269 | 3.6% |
| Micronesia | 294 | 4.0% |
| Moldova | 10 | 0.1% |
| Netherlands | 21 | 0.3% |
| Northern Europe | 15 | 0.2% |
| Oceania | 309 | 4.2% |
| Panama | 20 | 0.3% |
| Philippines | 326 | 4.4% |
| South Africa | 32 | 0.4% |
| South Central Asia | 19 | 0.3% |
| South Eastern Asia | 444 | 6.0% |
| Southern Europe | 10 | 0.1% |
| Vietnam | 32 | 0.4% |
| Western Europe | 102 | 1.4% | View All 32 Rows |
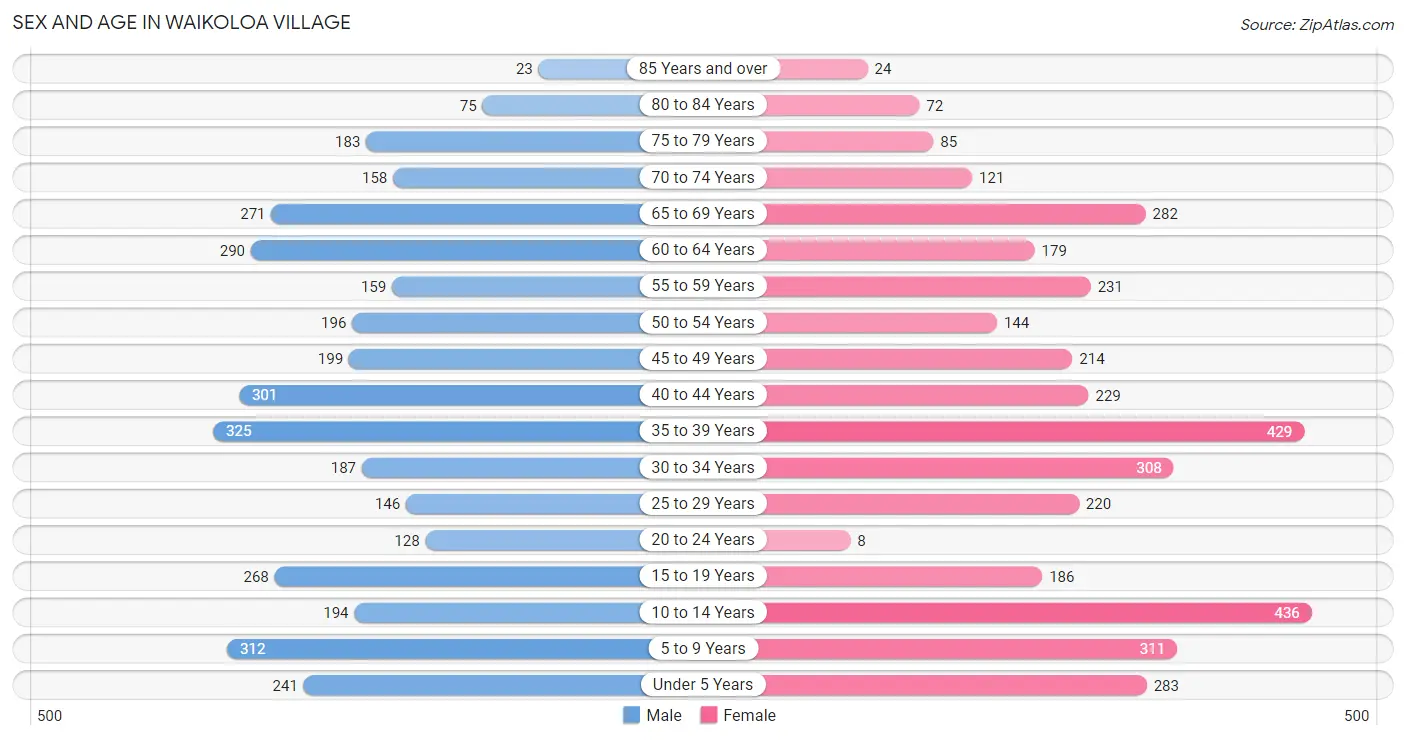
Sex and Age in Waikoloa Village
Sex and Age in Waikoloa Village
The most populous age groups in Waikoloa Village are 35 to 39 Years (325 | 8.9%) for men and 10 to 14 Years (436 | 11.6%) for women.
| Age Bracket | Male | Female |
| Under 5 Years | 241 (6.6%) | 283 (7.5%) |
| 5 to 9 Years | 312 (8.5%) | 311 (8.3%) |
| 10 to 14 Years | 194 (5.3%) | 436 (11.6%) |
| 15 to 19 Years | 268 (7.3%) | 186 (4.9%) |
| 20 to 24 Years | 128 (3.5%) | 8 (0.2%) |
| 25 to 29 Years | 146 (4.0%) | 220 (5.9%) |
| 30 to 34 Years | 187 (5.1%) | 308 (8.2%) |
| 35 to 39 Years | 325 (8.9%) | 429 (11.4%) |
| 40 to 44 Years | 301 (8.2%) | 229 (6.1%) |
| 45 to 49 Years | 199 (5.4%) | 214 (5.7%) |
| 50 to 54 Years | 196 (5.4%) | 144 (3.8%) |
| 55 to 59 Years | 159 (4.3%) | 231 (6.1%) |
| 60 to 64 Years | 290 (7.9%) | 179 (4.8%) |
| 65 to 69 Years | 271 (7.4%) | 282 (7.5%) |
| 70 to 74 Years | 158 (4.3%) | 121 (3.2%) |
| 75 to 79 Years | 183 (5.0%) | 85 (2.3%) |
| 80 to 84 Years | 75 (2.1%) | 72 (1.9%) |
| 85 Years and over | 23 (0.6%) | 24 (0.6%) |
| Total | 3,656 (100.0%) | 3,762 (100.0%) |
Families and Households in Waikoloa Village
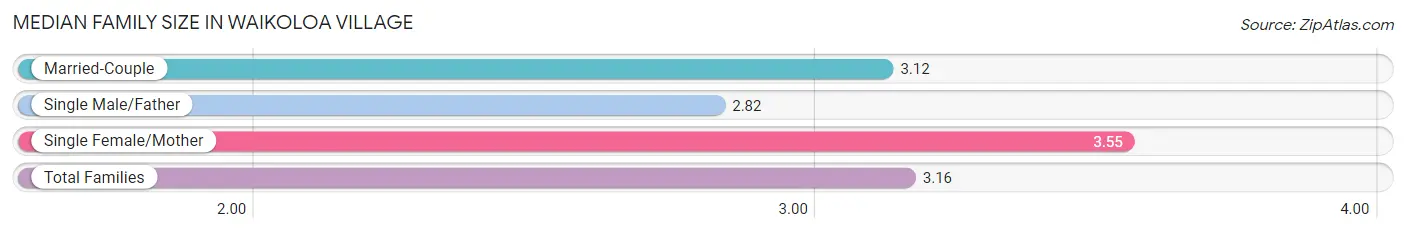
Median Family Size in Waikoloa Village
The median family size in Waikoloa Village is 3.16 persons per family, with single female/mother families (233 | 11.8%) accounting for the largest median family size of 3.55 persons per family. On the other hand, single male/father families (77 | 3.9%) represent the smallest median family size with 2.82 persons per family.
| Family Type | # Families | Family Size |
| Married-Couple | 1,659 (84.3%) | 3.12 |
| Single Male/Father | 77 (3.9%) | 2.82 |
| Single Female/Mother | 233 (11.8%) | 3.55 |
| Total Families | 1,969 (100.0%) | 3.16 |
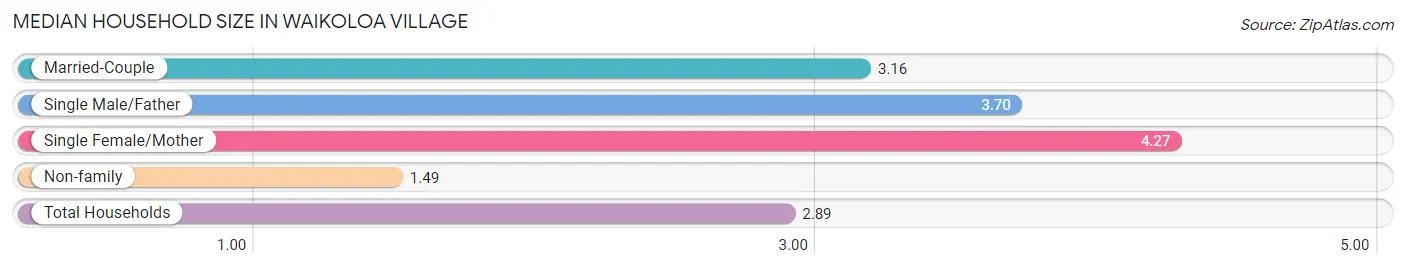
Median Household Size in Waikoloa Village
The median household size in Waikoloa Village is 2.89 persons per household, with single female/mother households (233 | 9.1%) accounting for the largest median household size of 4.27 persons per household. non-family households (599 | 23.3%) represent the smallest median household size with 1.49 persons per household.
| Household Type | # Households | Household Size |
| Married-Couple | 1,659 (64.6%) | 3.16 |
| Single Male/Father | 77 (3.0%) | 3.70 |
| Single Female/Mother | 233 (9.1%) | 4.27 |
| Non-family | 599 (23.3%) | 1.49 |
| Total Households | 2,568 (100.0%) | 2.89 |
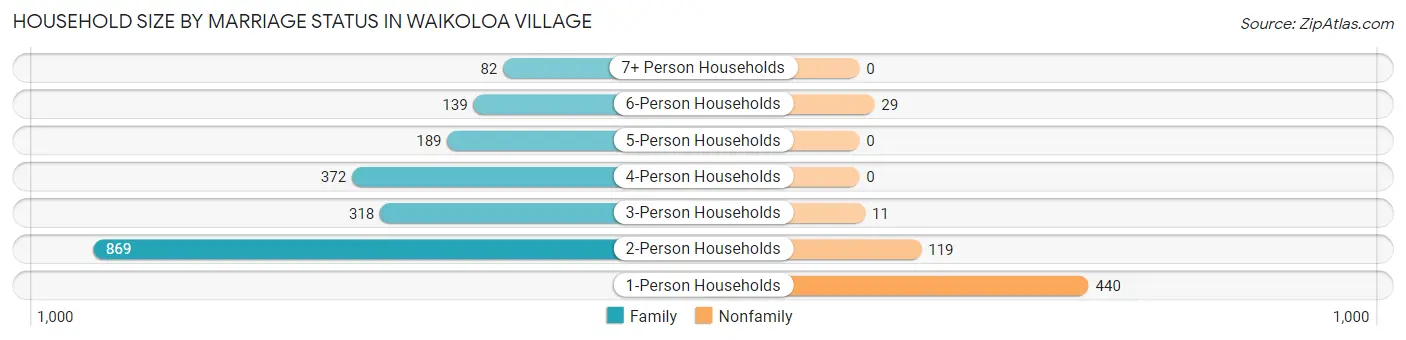
Household Size by Marriage Status in Waikoloa Village
Out of a total of 2,568 households in Waikoloa Village, 1,969 (76.7%) are family households, while 599 (23.3%) are nonfamily households. The most numerous type of family households are 2-person households, comprising 869, and the most common type of nonfamily households are 1-person households, comprising 440.
| Household Size | Family Households | Nonfamily Households |
| 1-Person Households | - | 440 (17.1%) |
| 2-Person Households | 869 (33.8%) | 119 (4.6%) |
| 3-Person Households | 318 (12.4%) | 11 (0.4%) |
| 4-Person Households | 372 (14.5%) | 0 (0.0%) |
| 5-Person Households | 189 (7.4%) | 0 (0.0%) |
| 6-Person Households | 139 (5.4%) | 29 (1.1%) |
| 7+ Person Households | 82 (3.2%) | 0 (0.0%) |
| Total | 1,969 (76.7%) | 599 (23.3%) |
Female Fertility in Waikoloa Village
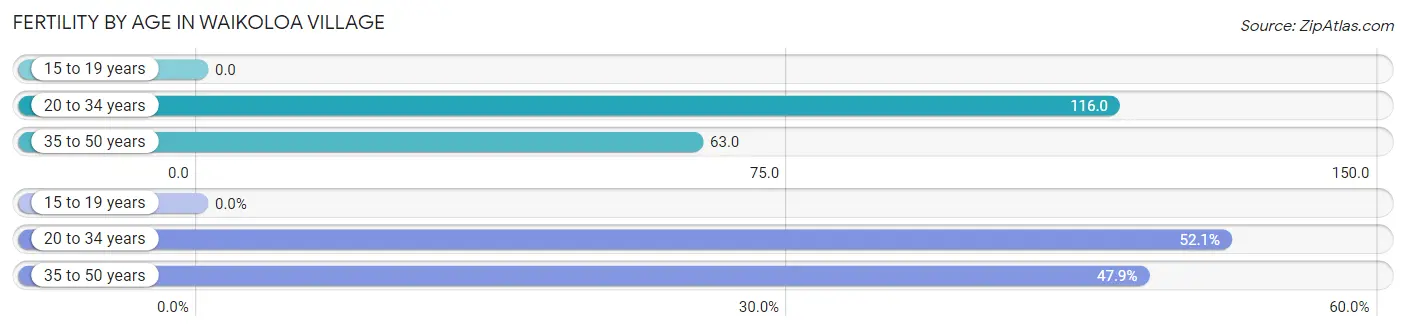
Fertility by Age in Waikoloa Village
Average fertility rate in Waikoloa Village is 73.0 births per 1,000 women. Women in the age bracket of 20 to 34 years have the highest fertility rate with 116.0 births per 1,000 women. Women in the age bracket of 20 to 34 years acount for 52.1% of all women with births.
| Age Bracket | Women with Births | Births / 1,000 Women |
| 15 to 19 years | 0 (0.0%) | 0.0 |
| 20 to 34 years | 62 (52.1%) | 116.0 |
| 35 to 50 years | 57 (47.9%) | 63.0 |
| Total | 119 (100.0%) | 73.0 |
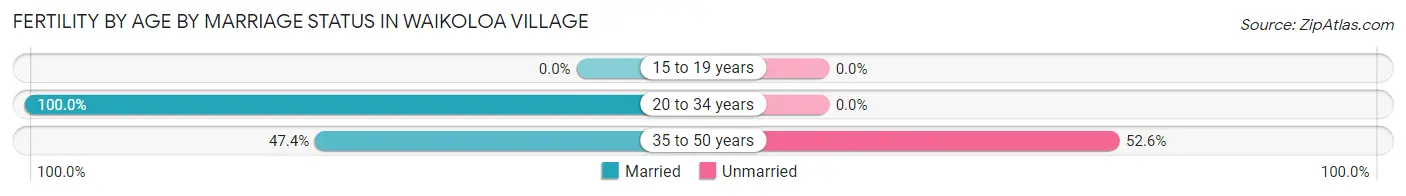
Fertility by Age by Marriage Status in Waikoloa Village
74.8% of women with births (119) in Waikoloa Village are married. The highest percentage of unmarried women with births falls into 35 to 50 years age bracket with 52.6% of them unmarried at the time of birth, while the lowest percentage of unmarried women with births belong to 20 to 34 years age bracket with 0.0% of them unmarried.
| Age Bracket | Married | Unmarried |
| 15 to 19 years | 0 (0.0%) | 0 (0.0%) |
| 20 to 34 years | 62 (100.0%) | 0 (0.0%) |
| 35 to 50 years | 27 (47.4%) | 30 (52.6%) |
| Total | 89 (74.8%) | 30 (25.2%) |
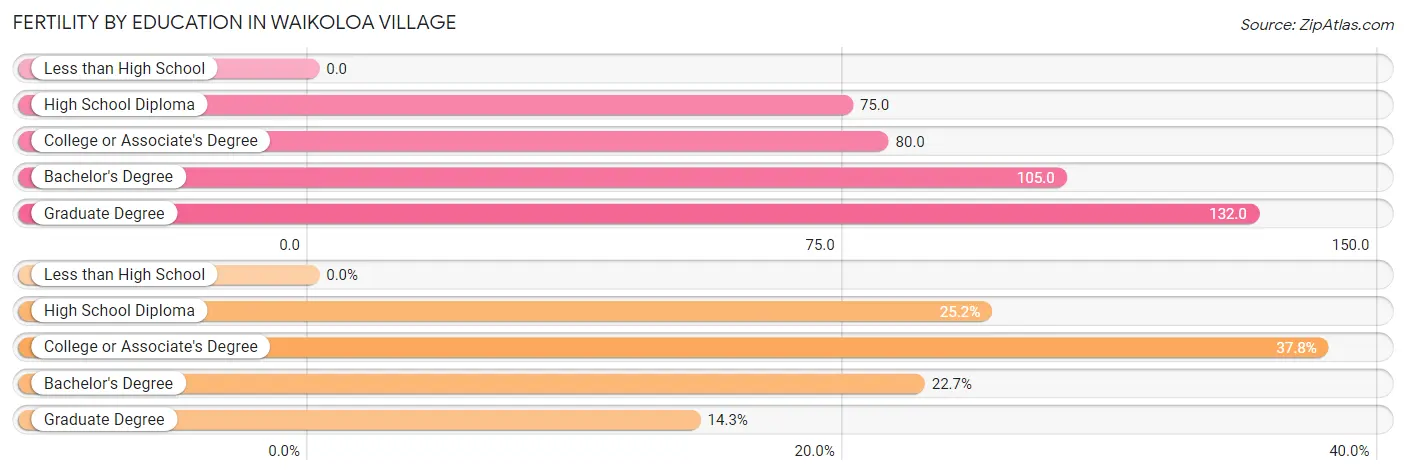
Fertility by Education in Waikoloa Village
| Educational Attainment | Women with Births | Births / 1,000 Women |
| Less than High School | 0 (0.0%) | 0.0 |
| High School Diploma | 30 (25.2%) | 75.0 |
| College or Associate's Degree | 45 (37.8%) | 80.0 |
| Bachelor's Degree | 27 (22.7%) | 105.0 |
| Graduate Degree | 17 (14.3%) | 132.0 |
| Total | 119 (100.0%) | 73.0 |
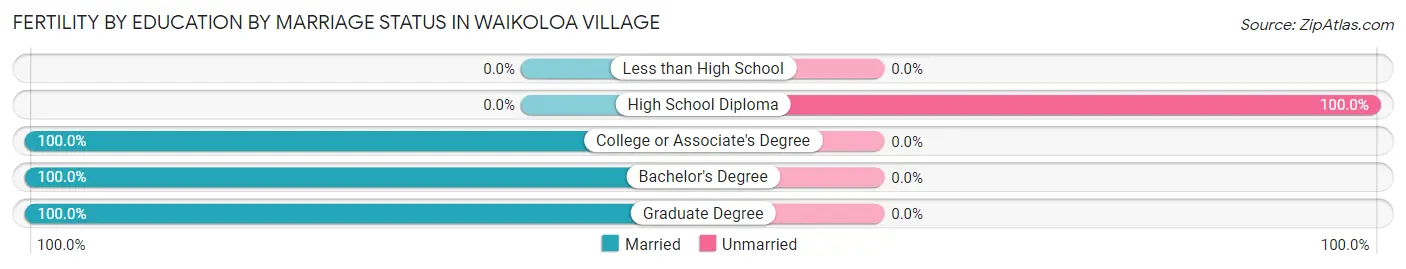
Fertility by Education by Marriage Status in Waikoloa Village
25.2% of women with births in Waikoloa Village are unmarried. Women with the educational attainment of college or associate's degree are most likely to be married with 100.0% of them married at childbirth, while women with the educational attainment of high school diploma are least likely to be married with 100.0% of them unmarried at childbirth.
| Educational Attainment | Married | Unmarried |
| Less than High School | 0 (0.0%) | 0 (0.0%) |
| High School Diploma | 0 (0.0%) | 30 (100.0%) |
| College or Associate's Degree | 45 (100.0%) | 0 (0.0%) |
| Bachelor's Degree | 27 (100.0%) | 0 (0.0%) |
| Graduate Degree | 17 (100.0%) | 0 (0.0%) |
| Total | 89 (74.8%) | 30 (25.2%) |
Employment Characteristics in Waikoloa Village
Employment by Class of Employer in Waikoloa Village
Among the 3,320 employed individuals in Waikoloa Village, private company employees (2,198 | 66.2%), self-employed (not incorporated) (335 | 10.1%), and not-for-profit organizations (281 | 8.5%) make up the most common classes of employment.
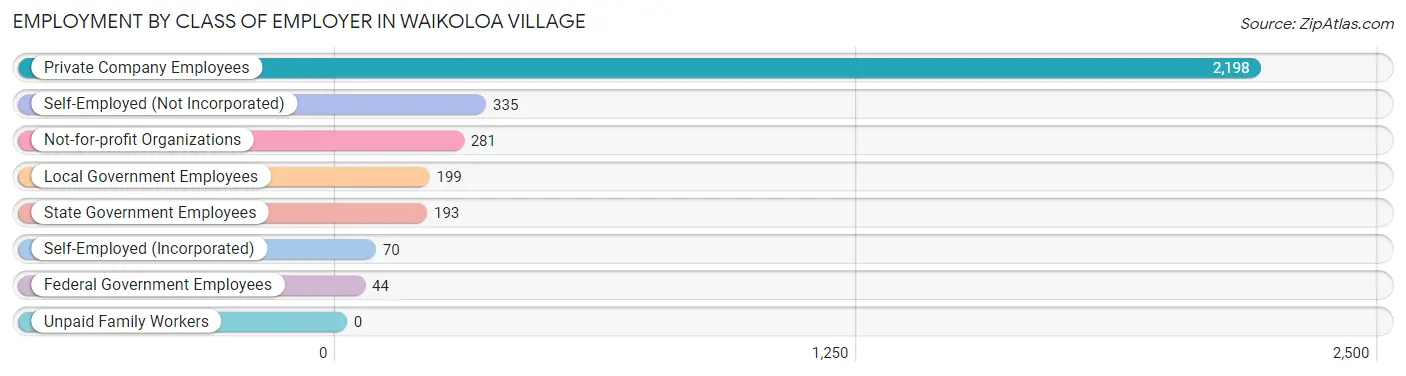
| Employer Class | # Employees | % Employees |
| Private Company Employees | 2,198 | 66.2% |
| Self-Employed (Incorporated) | 70 | 2.1% |
| Self-Employed (Not Incorporated) | 335 | 10.1% |
| Not-for-profit Organizations | 281 | 8.5% |
| Local Government Employees | 199 | 6.0% |
| State Government Employees | 193 | 5.8% |
| Federal Government Employees | 44 | 1.3% |
| Unpaid Family Workers | 0 | 0.0% |
| Total | 3,320 | 100.0% |
Employment Status by Age in Waikoloa Village
According to the labor force statistics for Waikoloa Village, out of the total population over 16 years of age (5,622), 67.4% or 3,789 individuals are in the labor force, with 9.8% or 371 of them unemployed. The age group with the highest labor force participation rate is 45 to 54 years, with 97.3% or 733 individuals in the labor force. Within the labor force, the 16 to 19 years age range has the highest percentage of unemployed individuals, with 51.3% or 41 of them being unemployed.
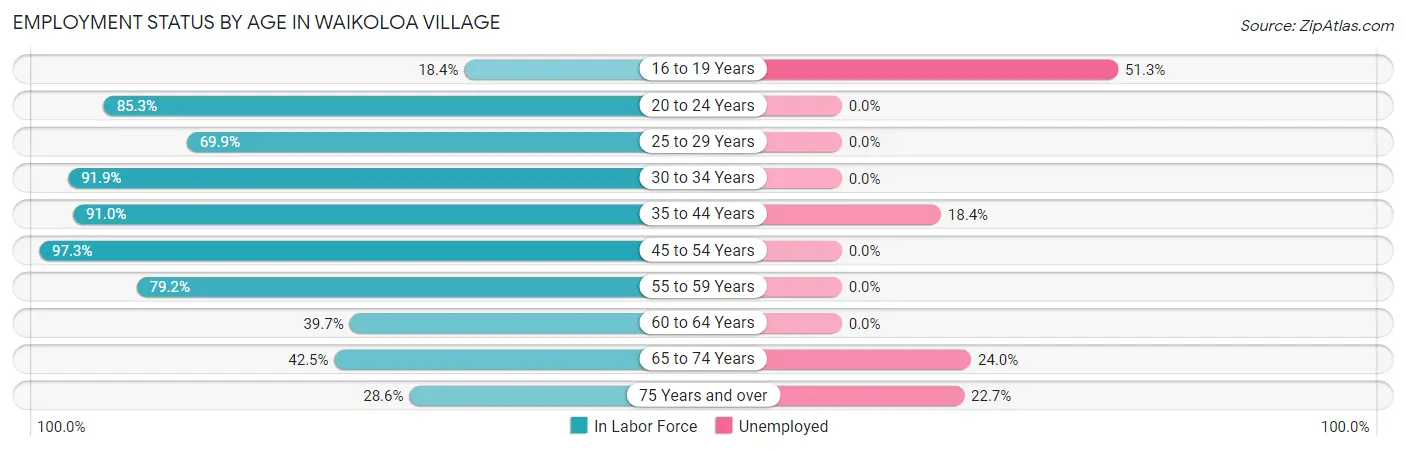
| Age Bracket | In Labor Force | Unemployed |
| 16 to 19 Years | 80 (18.4%) | 41 (51.3%) |
| 20 to 24 Years | 116 (85.3%) | 0 (0.0%) |
| 25 to 29 Years | 256 (69.9%) | 0 (0.0%) |
| 30 to 34 Years | 455 (91.9%) | 0 (0.0%) |
| 35 to 44 Years | 1,168 (91.0%) | 215 (18.4%) |
| 45 to 54 Years | 733 (97.3%) | 0 (0.0%) |
| 55 to 59 Years | 309 (79.2%) | 0 (0.0%) |
| 60 to 64 Years | 186 (39.7%) | 0 (0.0%) |
| 65 to 74 Years | 354 (42.5%) | 85 (24.0%) |
| 75 Years and over | 132 (28.6%) | 30 (22.7%) |
| Total | 3,789 (67.4%) | 371 (9.8%) |
Employment Status by Educational Attainment in Waikoloa Village
According to labor force statistics for Waikoloa Village, 82.7% of individuals (3,107) out of the total population between 25 and 64 years of age (3,757) are in the labor force, with 6.9% or 214 of them being unemployed. The group with the highest labor force participation rate are those with the educational attainment of less than high school, with 100.0% or 316 individuals in the labor force. Within the labor force, individuals with high school diploma education have the highest percentage of unemployment, with 10.7% or 86 of them being unemployed.
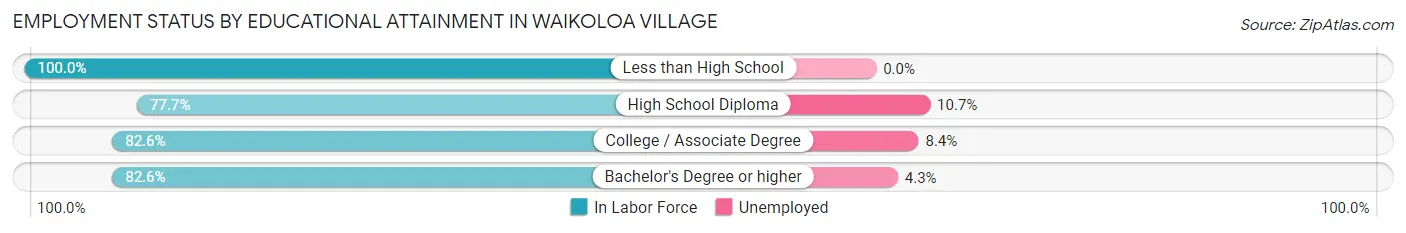
| Educational Attainment | In Labor Force | Unemployed |
| Less than High School | 316 (100.0%) | 0 (0.0%) |
| High School Diploma | 805 (77.7%) | 111 (10.7%) |
| College / Associate Degree | 1,072 (82.6%) | 109 (8.4%) |
| Bachelor's Degree or higher | 914 (82.6%) | 48 (4.3%) |
| Total | 3,107 (82.7%) | 259 (6.9%) |
Employment Occupations by Sex in Waikoloa Village
Management, Business, Science and Arts Occupations
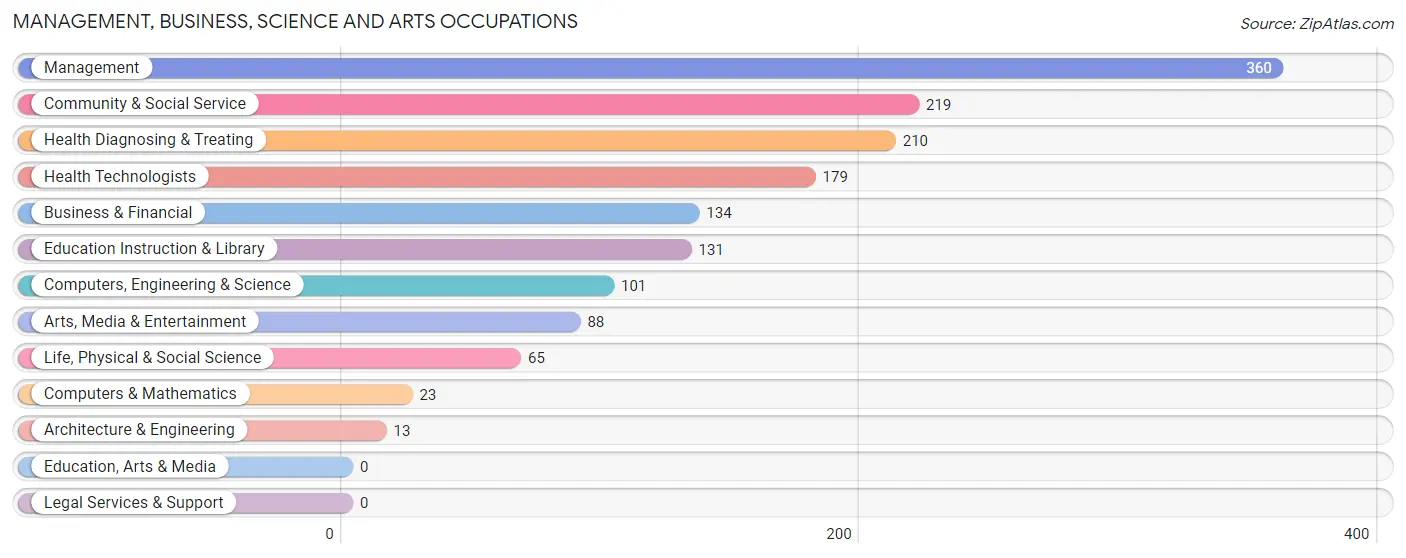
The most common Management, Business, Science and Arts occupations in Waikoloa Village are Management (360 | 10.5%), Community & Social Service (219 | 6.4%), Health Diagnosing & Treating (210 | 6.1%), Health Technologists (179 | 5.2%), and Business & Financial (134 | 3.9%).
Management, Business, Science and Arts Occupations by Sex
Within the Management, Business, Science and Arts occupations in Waikoloa Village, the most male-oriented occupations are Architecture & Engineering (100.0%), Arts, Media & Entertainment (75.0%), and Business & Financial (69.4%), while the most female-oriented occupations are Computers & Mathematics (100.0%), Health Diagnosing & Treating (82.9%), and Health Technologists (79.9%).
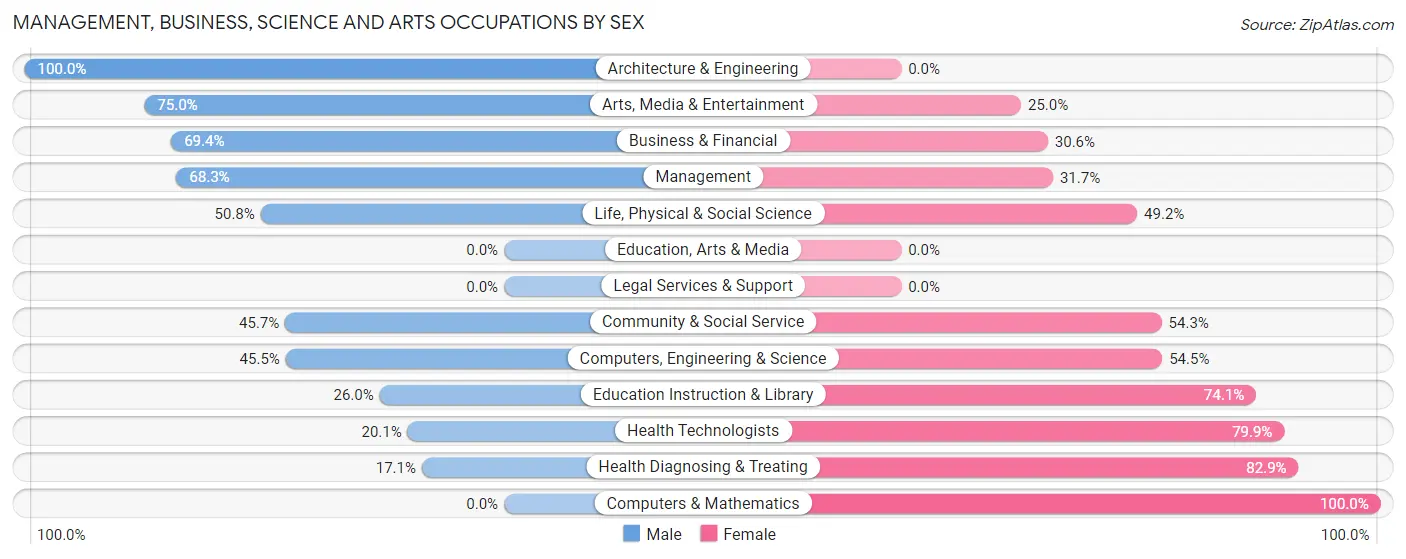
| Occupation | Male | Female |
| Management | 246 (68.3%) | 114 (31.7%) |
| Business & Financial | 93 (69.4%) | 41 (30.6%) |
| Computers, Engineering & Science | 46 (45.5%) | 55 (54.5%) |
| Computers & Mathematics | 0 (0.0%) | 23 (100.0%) |
| Architecture & Engineering | 13 (100.0%) | 0 (0.0%) |
| Life, Physical & Social Science | 33 (50.8%) | 32 (49.2%) |
| Community & Social Service | 100 (45.7%) | 119 (54.3%) |
| Education, Arts & Media | 0 (0.0%) | 0 (0.0%) |
| Legal Services & Support | 0 (0.0%) | 0 (0.0%) |
| Education Instruction & Library | 34 (26.0%) | 97 (74.1%) |
| Arts, Media & Entertainment | 66 (75.0%) | 22 (25.0%) |
| Health Diagnosing & Treating | 36 (17.1%) | 174 (82.9%) |
| Health Technologists | 36 (20.1%) | 143 (79.9%) |
| Total (Category) | 521 (50.9%) | 503 (49.1%) |
| Total (Overall) | 1,906 (55.8%) | 1,512 (44.2%) |
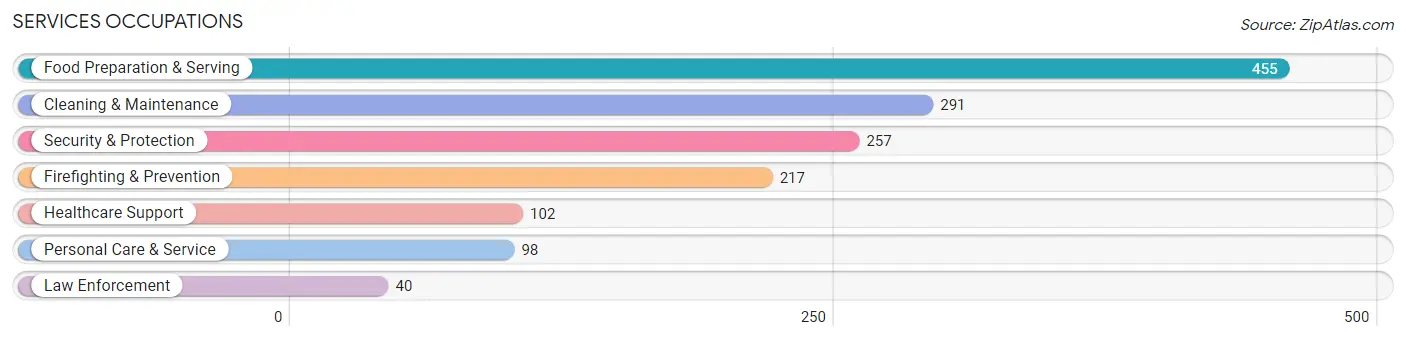
Services Occupations
The most common Services occupations in Waikoloa Village are Food Preparation & Serving (455 | 13.3%), Cleaning & Maintenance (291 | 8.5%), Security & Protection (257 | 7.5%), Firefighting & Prevention (217 | 6.4%), and Healthcare Support (102 | 3.0%).
Services Occupations by Sex
Within the Services occupations in Waikoloa Village, the most male-oriented occupations are Security & Protection (100.0%), Firefighting & Prevention (100.0%), and Law Enforcement (100.0%), while the most female-oriented occupations are Healthcare Support (100.0%), Cleaning & Maintenance (71.1%), and Food Preparation & Serving (33.2%).
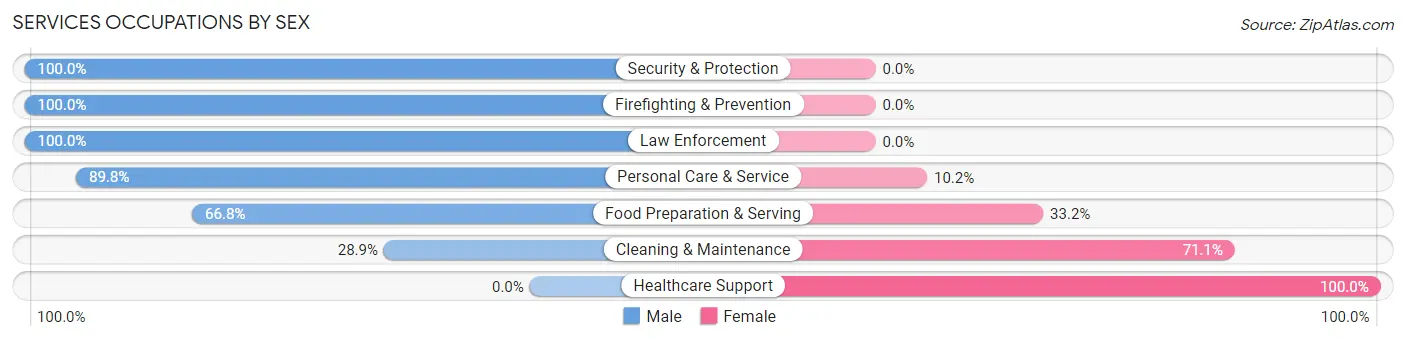
| Occupation | Male | Female |
| Healthcare Support | 0 (0.0%) | 102 (100.0%) |
| Security & Protection | 257 (100.0%) | 0 (0.0%) |
| Firefighting & Prevention | 217 (100.0%) | 0 (0.0%) |
| Law Enforcement | 40 (100.0%) | 0 (0.0%) |
| Food Preparation & Serving | 304 (66.8%) | 151 (33.2%) |
| Cleaning & Maintenance | 84 (28.9%) | 207 (71.1%) |
| Personal Care & Service | 88 (89.8%) | 10 (10.2%) |
| Total (Category) | 733 (60.9%) | 470 (39.1%) |
| Total (Overall) | 1,906 (55.8%) | 1,512 (44.2%) |
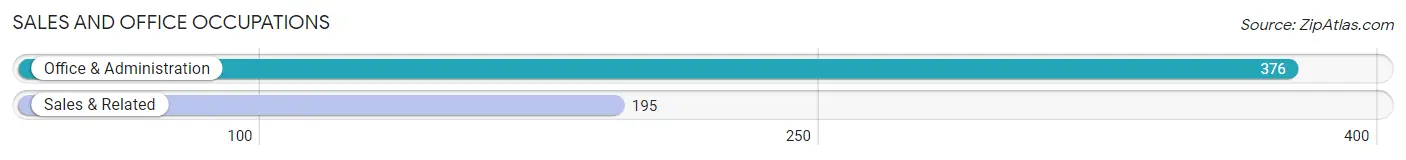
Sales and Office Occupations
The most common Sales and Office occupations in Waikoloa Village are Office & Administration (376 | 11.0%), and Sales & Related (195 | 5.7%).
Sales and Office Occupations by Sex
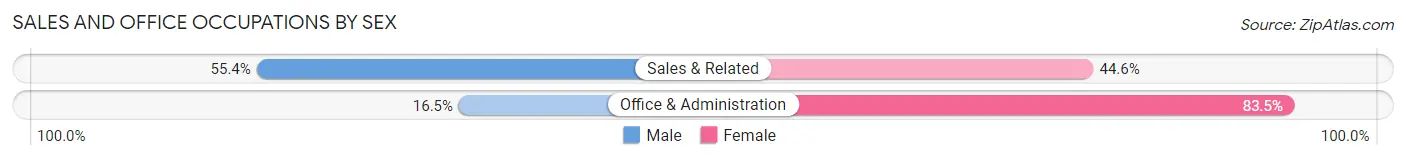
| Occupation | Male | Female |
| Sales & Related | 108 (55.4%) | 87 (44.6%) |
| Office & Administration | 62 (16.5%) | 314 (83.5%) |
| Total (Category) | 170 (29.8%) | 401 (70.2%) |
| Total (Overall) | 1,906 (55.8%) | 1,512 (44.2%) |
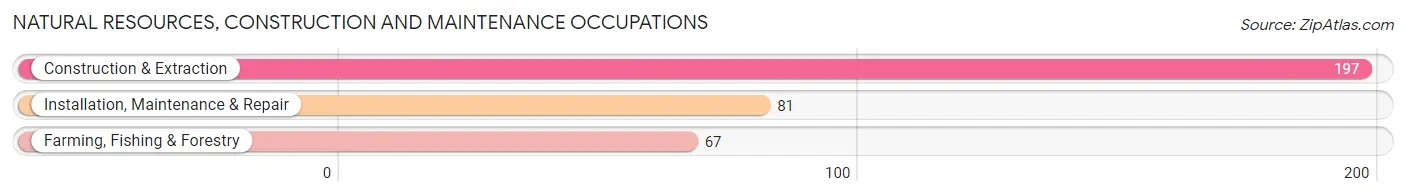
Natural Resources, Construction and Maintenance Occupations
The most common Natural Resources, Construction and Maintenance occupations in Waikoloa Village are Construction & Extraction (197 | 5.8%), Installation, Maintenance & Repair (81 | 2.4%), and Farming, Fishing & Forestry (67 | 2.0%).
Natural Resources, Construction and Maintenance Occupations by Sex
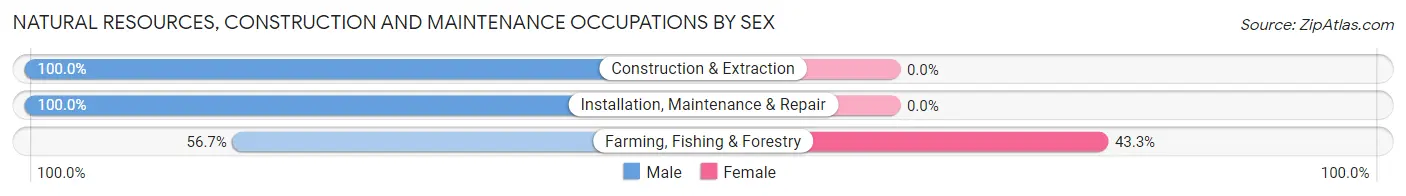
| Occupation | Male | Female |
| Farming, Fishing & Forestry | 38 (56.7%) | 29 (43.3%) |
| Construction & Extraction | 197 (100.0%) | 0 (0.0%) |
| Installation, Maintenance & Repair | 81 (100.0%) | 0 (0.0%) |
| Total (Category) | 316 (91.6%) | 29 (8.4%) |
| Total (Overall) | 1,906 (55.8%) | 1,512 (44.2%) |
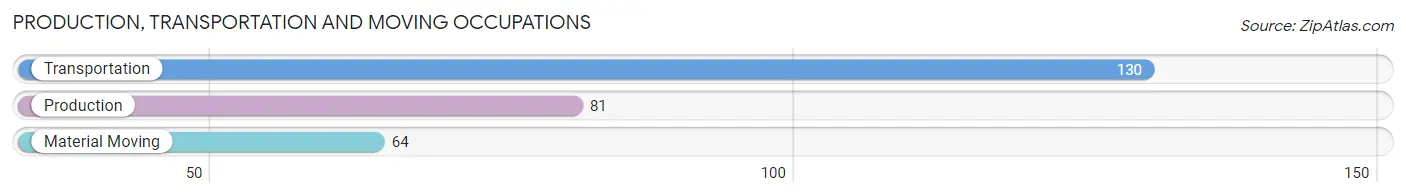
Production, Transportation and Moving Occupations
The most common Production, Transportation and Moving occupations in Waikoloa Village are Transportation (130 | 3.8%), Production (81 | 2.4%), and Material Moving (64 | 1.9%).
Production, Transportation and Moving Occupations by Sex
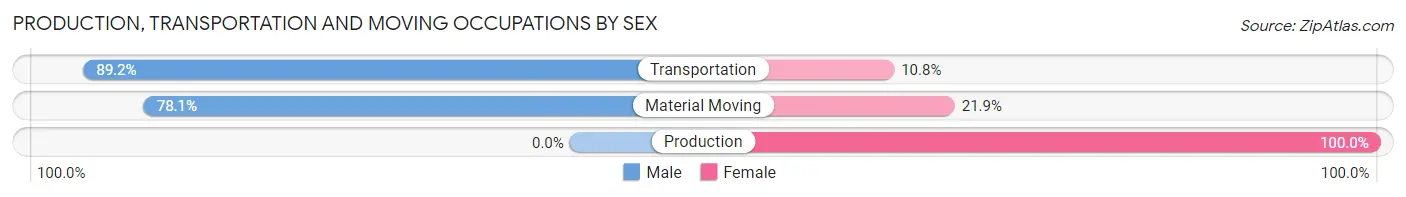
| Occupation | Male | Female |
| Production | 0 (0.0%) | 81 (100.0%) |
| Transportation | 116 (89.2%) | 14 (10.8%) |
| Material Moving | 50 (78.1%) | 14 (21.9%) |
| Total (Category) | 166 (60.4%) | 109 (39.6%) |
| Total (Overall) | 1,906 (55.8%) | 1,512 (44.2%) |
Employment Industries by Sex in Waikoloa Village
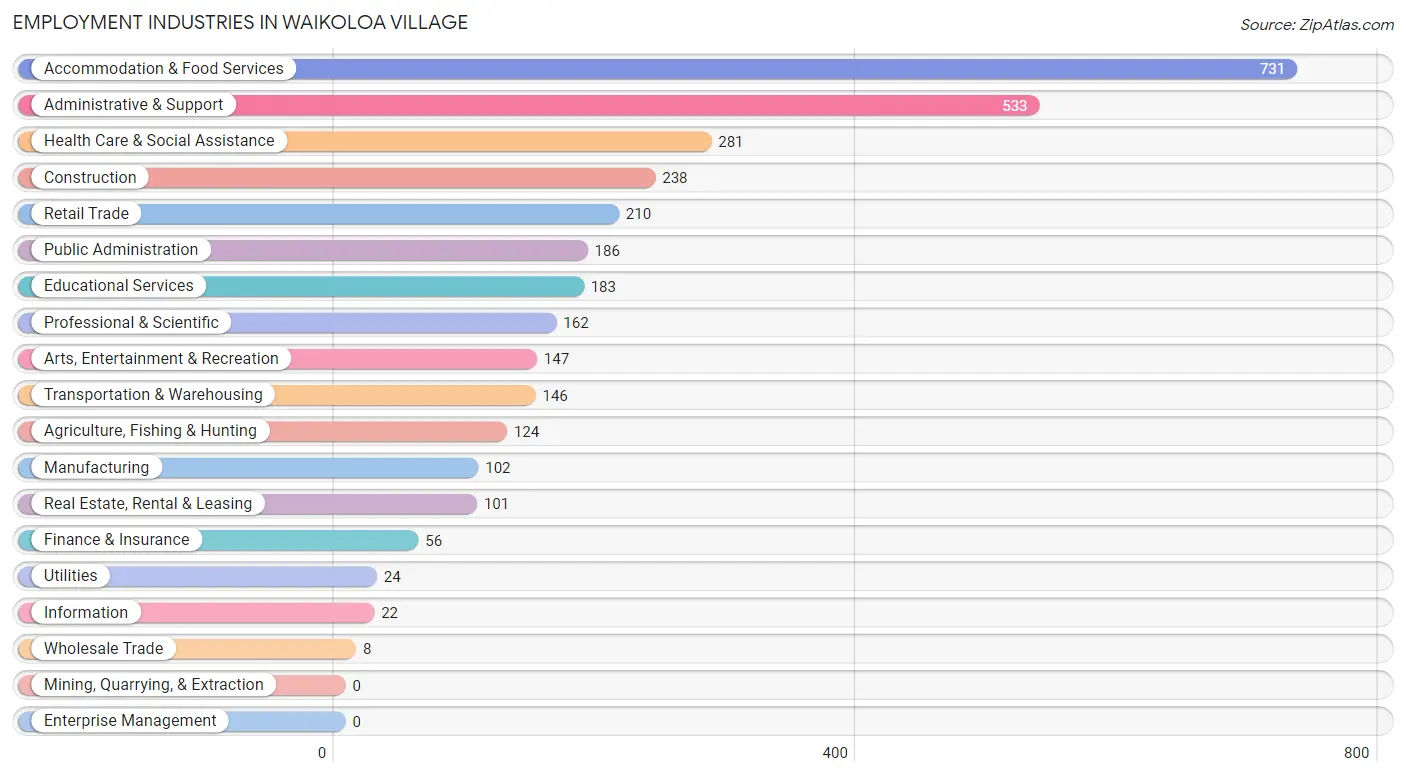
Employment Industries in Waikoloa Village
The major employment industries in Waikoloa Village include Accommodation & Food Services (731 | 21.4%), Administrative & Support (533 | 15.6%), Health Care & Social Assistance (281 | 8.2%), Construction (238 | 7.0%), and Retail Trade (210 | 6.1%).
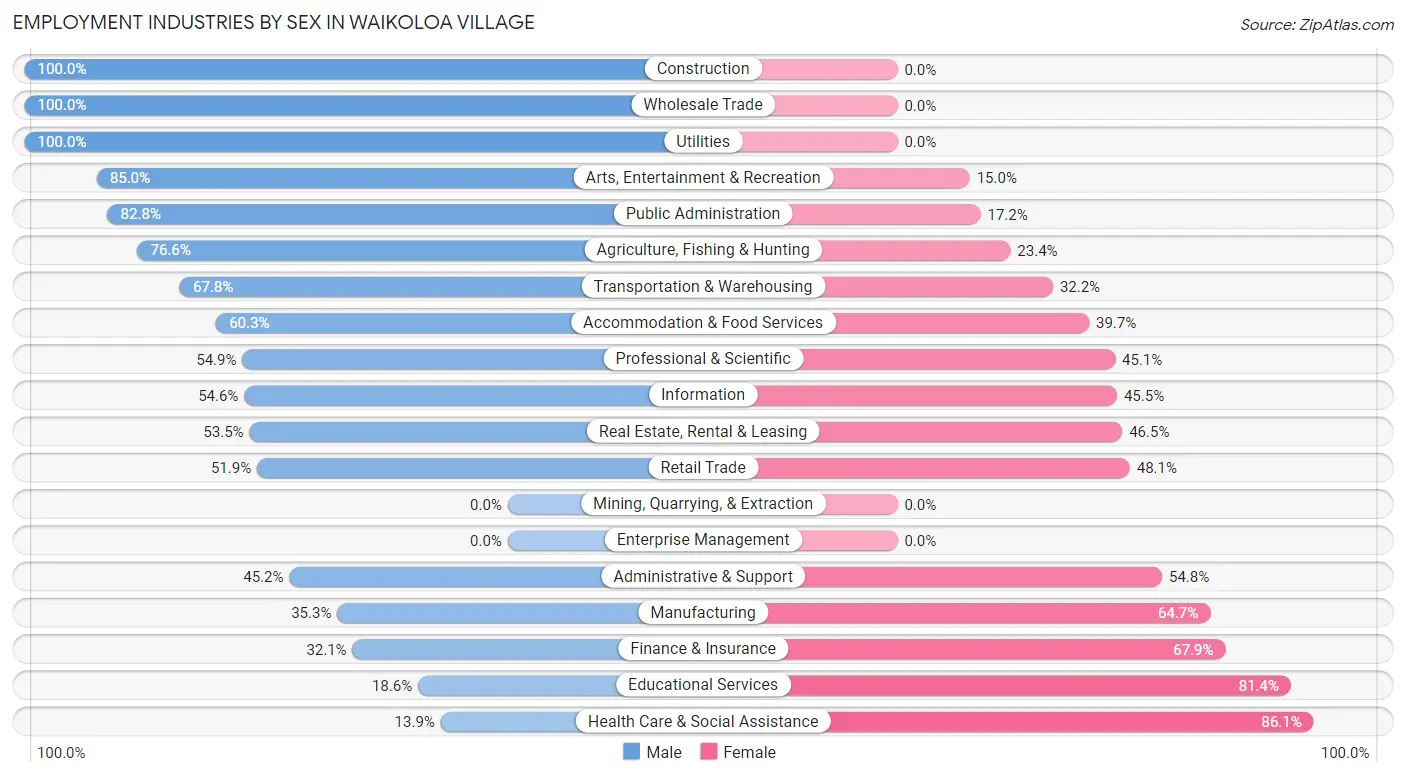
Employment Industries by Sex in Waikoloa Village
The Waikoloa Village industries that see more men than women are Construction (100.0%), Wholesale Trade (100.0%), and Utilities (100.0%), whereas the industries that tend to have a higher number of women are Health Care & Social Assistance (86.1%), Educational Services (81.4%), and Finance & Insurance (67.9%).
| Industry | Male | Female |
| Agriculture, Fishing & Hunting | 95 (76.6%) | 29 (23.4%) |
| Mining, Quarrying, & Extraction | 0 (0.0%) | 0 (0.0%) |
| Construction | 238 (100.0%) | 0 (0.0%) |
| Manufacturing | 36 (35.3%) | 66 (64.7%) |
| Wholesale Trade | 8 (100.0%) | 0 (0.0%) |
| Retail Trade | 109 (51.9%) | 101 (48.1%) |
| Transportation & Warehousing | 99 (67.8%) | 47 (32.2%) |
| Utilities | 24 (100.0%) | 0 (0.0%) |
| Information | 12 (54.5%) | 10 (45.5%) |
| Finance & Insurance | 18 (32.1%) | 38 (67.9%) |
| Real Estate, Rental & Leasing | 54 (53.5%) | 47 (46.5%) |
| Professional & Scientific | 89 (54.9%) | 73 (45.1%) |
| Enterprise Management | 0 (0.0%) | 0 (0.0%) |
| Administrative & Support | 241 (45.2%) | 292 (54.8%) |
| Educational Services | 34 (18.6%) | 149 (81.4%) |
| Health Care & Social Assistance | 39 (13.9%) | 242 (86.1%) |
| Arts, Entertainment & Recreation | 125 (85.0%) | 22 (15.0%) |
| Accommodation & Food Services | 441 (60.3%) | 290 (39.7%) |
| Public Administration | 154 (82.8%) | 32 (17.2%) |
| Total | 1,906 (55.8%) | 1,512 (44.2%) |
Education in Waikoloa Village
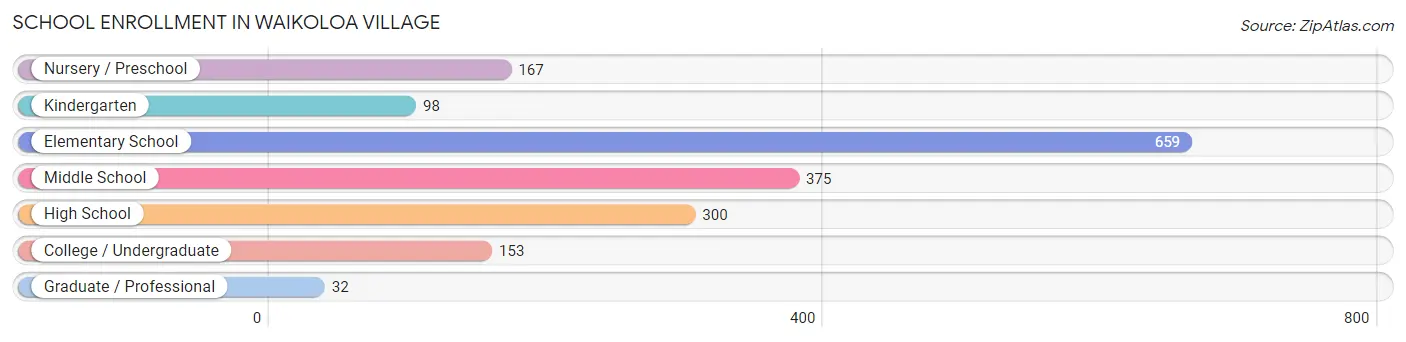
School Enrollment in Waikoloa Village
The most common levels of schooling among the 1,784 students in Waikoloa Village are elementary school (659 | 36.9%), middle school (375 | 21.0%), and high school (300 | 16.8%).
| School Level | # Students | % Students |
| Nursery / Preschool | 167 | 9.4% |
| Kindergarten | 98 | 5.5% |
| Elementary School | 659 | 36.9% |
| Middle School | 375 | 21.0% |
| High School | 300 | 16.8% |
| College / Undergraduate | 153 | 8.6% |
| Graduate / Professional | 32 | 1.8% |
| Total | 1,784 | 100.0% |
School Enrollment by Age by Funding Source in Waikoloa Village
Out of a total of 1,784 students who are enrolled in schools in Waikoloa Village, 253 (14.2%) attend a private institution, while the remaining 1,531 (85.8%) are enrolled in public schools. The age group of 3 to 4 year olds has the highest likelihood of being enrolled in private schools, with 107 (72.3% in the age bracket) enrolled. Conversely, the age group of 18 to 19 year olds has the lowest likelihood of being enrolled in a private school, with 52 (100.0% in the age bracket) attending a public institution.
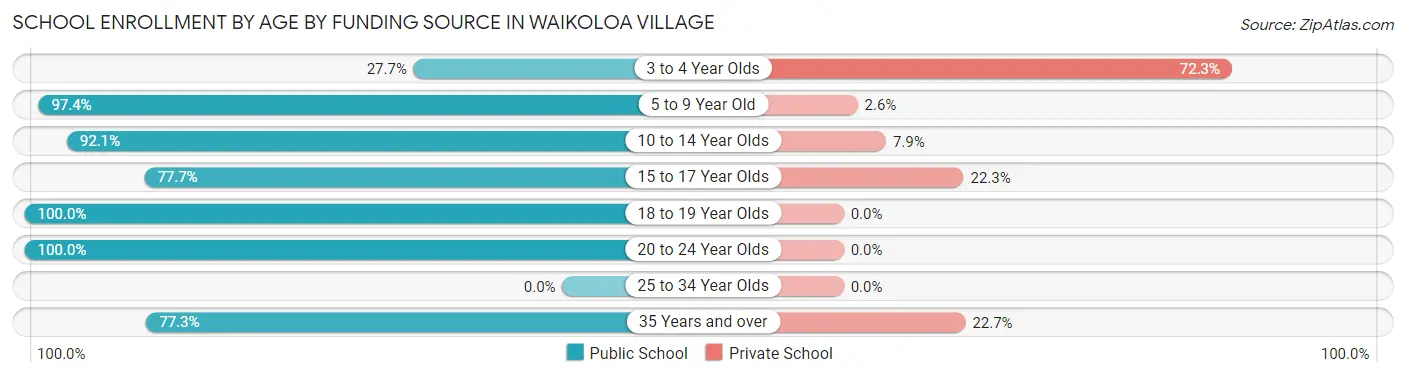
| Age Bracket | Public School | Private School |
| 3 to 4 Year Olds | 41 (27.7%) | 107 (72.3%) |
| 5 to 9 Year Old | 602 (97.4%) | 16 (2.6%) |
| 10 to 14 Year Olds | 491 (92.1%) | 42 (7.9%) |
| 15 to 17 Year Olds | 233 (77.7%) | 67 (22.3%) |
| 18 to 19 Year Olds | 52 (100.0%) | 0 (0.0%) |
| 20 to 24 Year Olds | 36 (100.0%) | 0 (0.0%) |
| 25 to 34 Year Olds | 0 (0.0%) | 0 (0.0%) |
| 35 Years and over | 75 (77.3%) | 22 (22.7%) |
| Total | 1,531 (85.8%) | 253 (14.2%) |
Educational Attainment by Field of Study in Waikoloa Village
Education (263 | 15.7%), business (251 | 15.0%), science & technology (193 | 11.5%), social sciences (160 | 9.6%), and visual & performing arts (136 | 8.1%) are the most common fields of study among 1,672 individuals in Waikoloa Village who have obtained a bachelor's degree or higher.
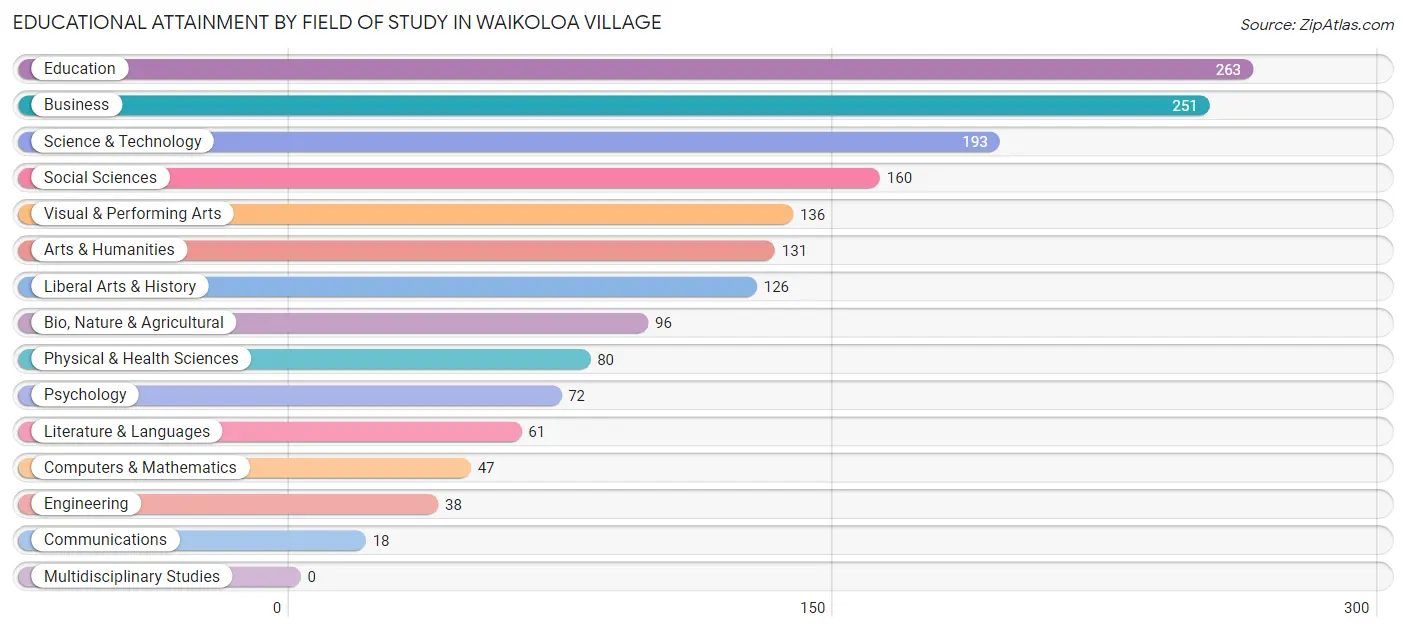
| Field of Study | # Graduates | % Graduates |
| Computers & Mathematics | 47 | 2.8% |
| Bio, Nature & Agricultural | 96 | 5.7% |
| Physical & Health Sciences | 80 | 4.8% |
| Psychology | 72 | 4.3% |
| Social Sciences | 160 | 9.6% |
| Engineering | 38 | 2.3% |
| Multidisciplinary Studies | 0 | 0.0% |
| Science & Technology | 193 | 11.5% |
| Business | 251 | 15.0% |
| Education | 263 | 15.7% |
| Literature & Languages | 61 | 3.6% |
| Liberal Arts & History | 126 | 7.5% |
| Visual & Performing Arts | 136 | 8.1% |
| Communications | 18 | 1.1% |
| Arts & Humanities | 131 | 7.8% |
| Total | 1,672 | 100.0% |
Transportation & Commute in Waikoloa Village
Vehicle Availability by Sex in Waikoloa Village
The most prevalent vehicle ownership categories in Waikoloa Village are males with 2 vehicles (665, accounting for 35.2%) and females with 2 vehicles (545, making up 46.5%).
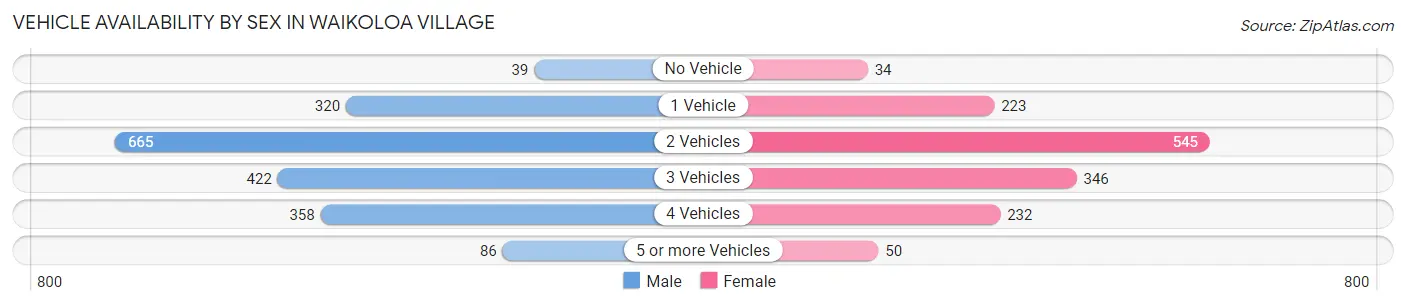
| Vehicles Available | Male | Female |
| No Vehicle | 39 (2.1%) | 34 (2.4%) |
| 1 Vehicle | 320 (16.9%) | 223 (15.6%) |
| 2 Vehicles | 665 (35.2%) | 545 (38.1%) |
| 3 Vehicles | 422 (22.3%) | 346 (24.2%) |
| 4 Vehicles | 358 (18.9%) | 232 (16.2%) |
| 5 or more Vehicles | 86 (4.5%) | 50 (3.5%) |
| Total | 1,890 (100.0%) | 1,430 (100.0%) |
Commute Time in Waikoloa Village
The most frequently occuring commute durations in Waikoloa Village are 30 to 34 minutes (765 commuters, 23.9%), 20 to 24 minutes (473 commuters, 14.8%), and 45 to 59 minutes (425 commuters, 13.3%).
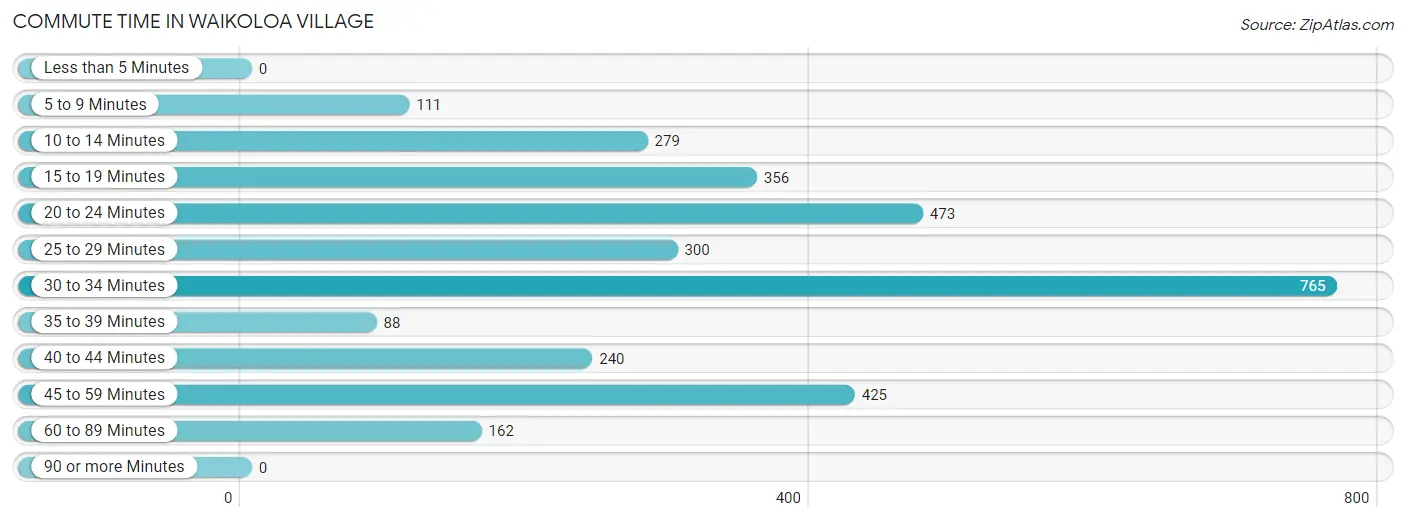
| Commute Time | # Commuters | % Commuters |
| Less than 5 Minutes | 0 | 0.0% |
| 5 to 9 Minutes | 111 | 3.5% |
| 10 to 14 Minutes | 279 | 8.7% |
| 15 to 19 Minutes | 356 | 11.1% |
| 20 to 24 Minutes | 473 | 14.8% |
| 25 to 29 Minutes | 300 | 9.4% |
| 30 to 34 Minutes | 765 | 23.9% |
| 35 to 39 Minutes | 88 | 2.8% |
| 40 to 44 Minutes | 240 | 7.5% |
| 45 to 59 Minutes | 425 | 13.3% |
| 60 to 89 Minutes | 162 | 5.1% |
| 90 or more Minutes | 0 | 0.0% |
Commute Time by Sex in Waikoloa Village
The most common commute times in Waikoloa Village are 30 to 34 minutes (466 commuters, 25.5%) for males and 30 to 34 minutes (299 commuters, 21.8%) for females.
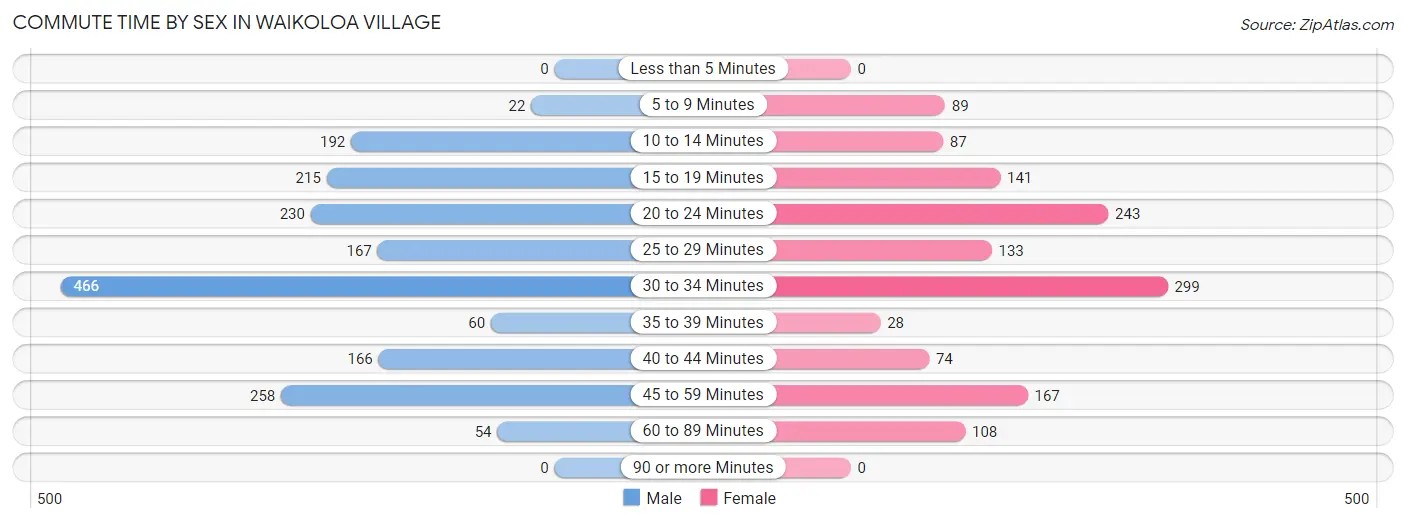
| Commute Time | Male | Female |
| Less than 5 Minutes | 0 (0.0%) | 0 (0.0%) |
| 5 to 9 Minutes | 22 (1.2%) | 89 (6.5%) |
| 10 to 14 Minutes | 192 (10.5%) | 87 (6.4%) |
| 15 to 19 Minutes | 215 (11.7%) | 141 (10.3%) |
| 20 to 24 Minutes | 230 (12.6%) | 243 (17.7%) |
| 25 to 29 Minutes | 167 (9.1%) | 133 (9.7%) |
| 30 to 34 Minutes | 466 (25.5%) | 299 (21.8%) |
| 35 to 39 Minutes | 60 (3.3%) | 28 (2.1%) |
| 40 to 44 Minutes | 166 (9.1%) | 74 (5.4%) |
| 45 to 59 Minutes | 258 (14.1%) | 167 (12.2%) |
| 60 to 89 Minutes | 54 (2.9%) | 108 (7.9%) |
| 90 or more Minutes | 0 (0.0%) | 0 (0.0%) |
Time of Departure to Work by Sex in Waikoloa Village
The most frequent times of departure to work in Waikoloa Village are 6:00 AM to 6:29 AM (292, 16.0%) for males and 7:30 AM to 7:59 AM (368, 26.9%) for females.
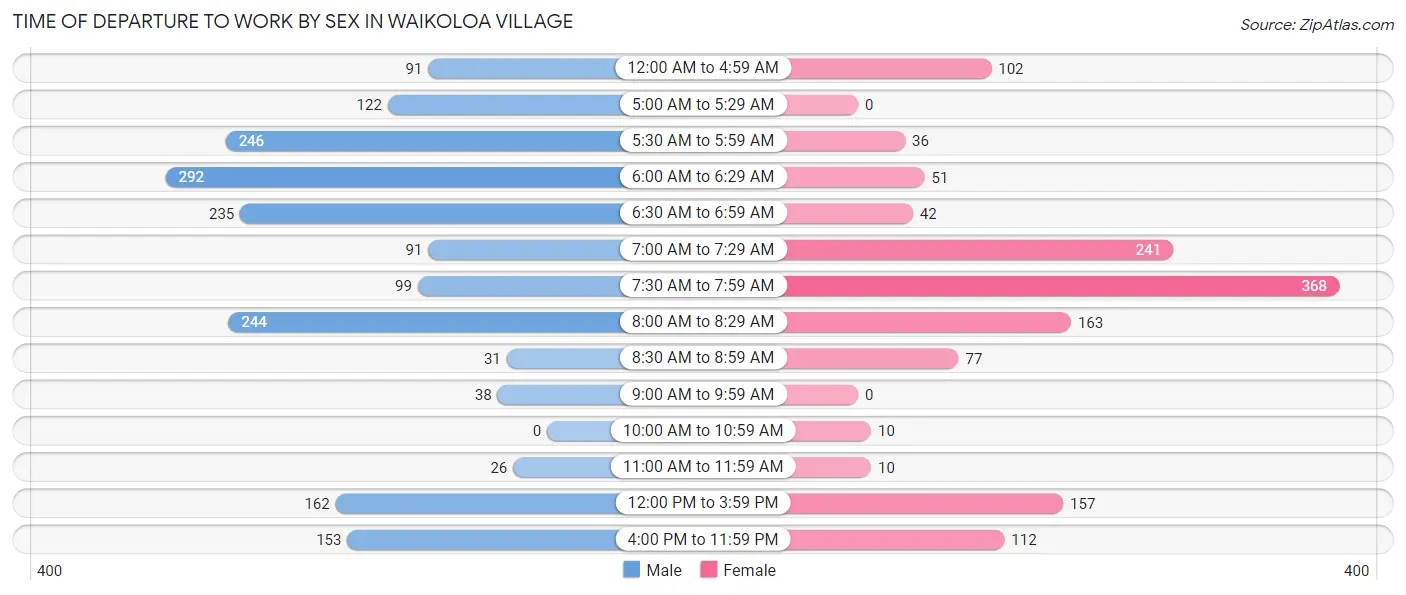
| Time of Departure | Male | Female |
| 12:00 AM to 4:59 AM | 91 (5.0%) | 102 (7.4%) |
| 5:00 AM to 5:29 AM | 122 (6.7%) | 0 (0.0%) |
| 5:30 AM to 5:59 AM | 246 (13.4%) | 36 (2.6%) |
| 6:00 AM to 6:29 AM | 292 (16.0%) | 51 (3.7%) |
| 6:30 AM to 6:59 AM | 235 (12.8%) | 42 (3.1%) |
| 7:00 AM to 7:29 AM | 91 (5.0%) | 241 (17.6%) |
| 7:30 AM to 7:59 AM | 99 (5.4%) | 368 (26.9%) |
| 8:00 AM to 8:29 AM | 244 (13.3%) | 163 (11.9%) |
| 8:30 AM to 8:59 AM | 31 (1.7%) | 77 (5.6%) |
| 9:00 AM to 9:59 AM | 38 (2.1%) | 0 (0.0%) |
| 10:00 AM to 10:59 AM | 0 (0.0%) | 10 (0.7%) |
| 11:00 AM to 11:59 AM | 26 (1.4%) | 10 (0.7%) |
| 12:00 PM to 3:59 PM | 162 (8.8%) | 157 (11.5%) |
| 4:00 PM to 11:59 PM | 153 (8.4%) | 112 (8.2%) |
| Total | 1,830 (100.0%) | 1,369 (100.0%) |
Housing Occupancy in Waikoloa Village
Occupancy by Ownership in Waikoloa Village
Of the total 2,568 dwellings in Waikoloa Village, owner-occupied units account for 1,854 (72.2%), while renter-occupied units make up 714 (27.8%).
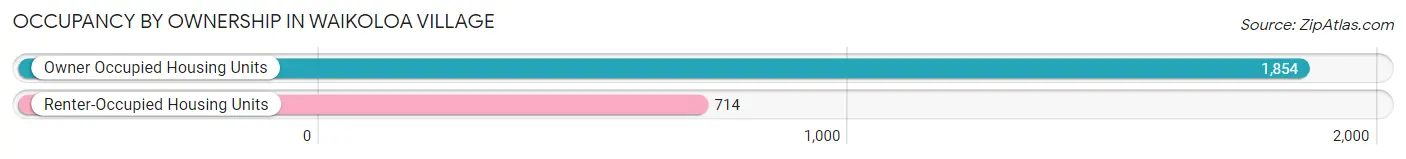
| Occupancy | # Housing Units | % Housing Units |
| Owner Occupied Housing Units | 1,854 | 72.2% |
| Renter-Occupied Housing Units | 714 | 27.8% |
| Total Occupied Housing Units | 2,568 | 100.0% |
Occupancy by Household Size in Waikoloa Village
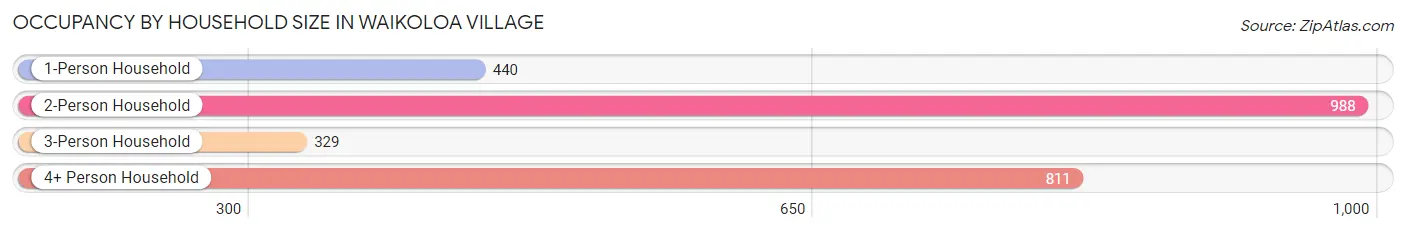
| Household Size | # Housing Units | % Housing Units |
| 1-Person Household | 440 | 17.1% |
| 2-Person Household | 988 | 38.5% |
| 3-Person Household | 329 | 12.8% |
| 4+ Person Household | 811 | 31.6% |
| Total Housing Units | 2,568 | 100.0% |
Occupancy by Ownership by Household Size in Waikoloa Village
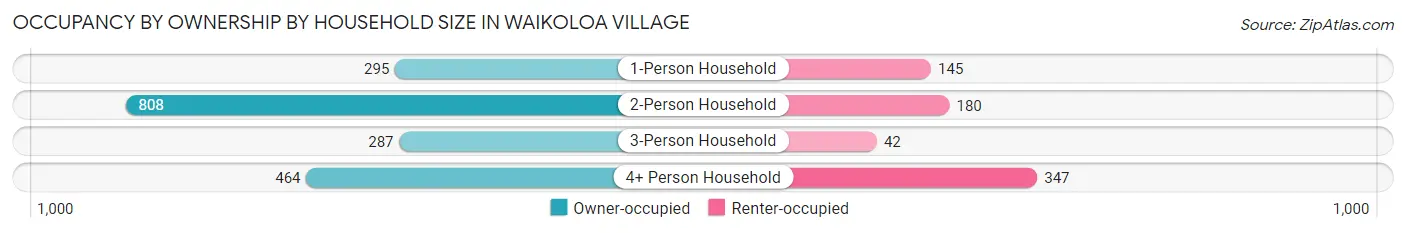
| Household Size | Owner-occupied | Renter-occupied |
| 1-Person Household | 295 (67.0%) | 145 (33.0%) |
| 2-Person Household | 808 (81.8%) | 180 (18.2%) |
| 3-Person Household | 287 (87.2%) | 42 (12.8%) |
| 4+ Person Household | 464 (57.2%) | 347 (42.8%) |
| Total Housing Units | 1,854 (72.2%) | 714 (27.8%) |
Occupancy by Educational Attainment in Waikoloa Village
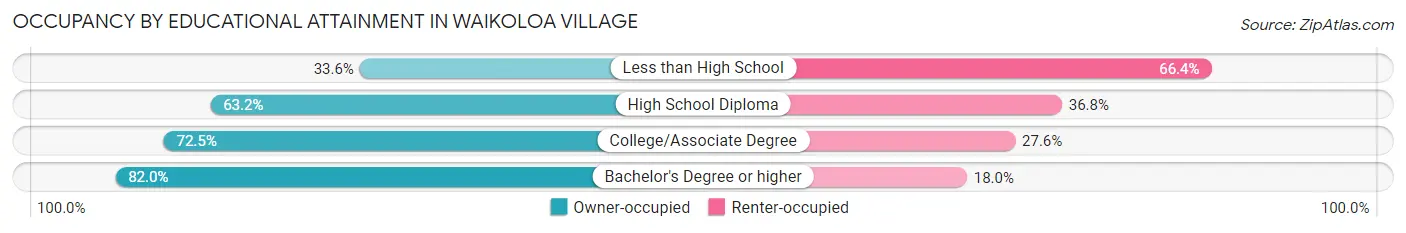
| Household Size | Owner-occupied | Renter-occupied |
| Less than High School | 50 (33.6%) | 99 (66.4%) |
| High School Diploma | 249 (63.2%) | 145 (36.8%) |
| College/Associate Degree | 802 (72.5%) | 305 (27.6%) |
| Bachelor's Degree or higher | 753 (82.0%) | 165 (18.0%) |
Occupancy by Age of Householder in Waikoloa Village
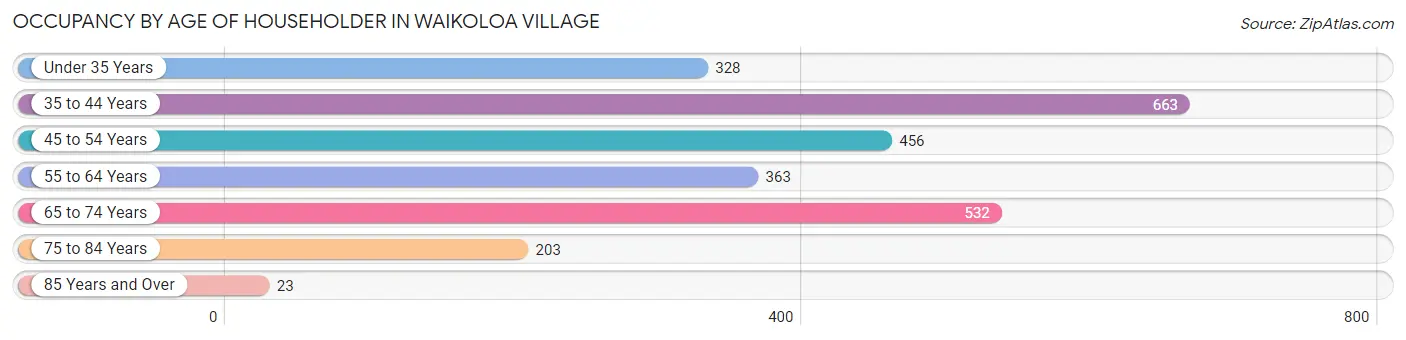
| Age Bracket | # Households | % Households |
| Under 35 Years | 328 | 12.8% |
| 35 to 44 Years | 663 | 25.8% |
| 45 to 54 Years | 456 | 17.8% |
| 55 to 64 Years | 363 | 14.1% |
| 65 to 74 Years | 532 | 20.7% |
| 75 to 84 Years | 203 | 7.9% |
| 85 Years and Over | 23 | 0.9% |
| Total | 2,568 | 100.0% |
Housing Finances in Waikoloa Village
Median Income by Occupancy in Waikoloa Village
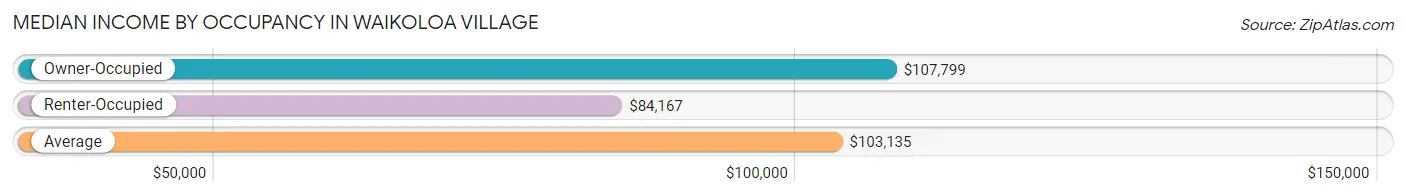
| Occupancy Type | # Households | Median Income |
| Owner-Occupied | 1,854 (72.2%) | $107,799 |
| Renter-Occupied | 714 (27.8%) | $84,167 |
| Average | 2,568 (100.0%) | $103,135 |
Occupancy by Householder Income Bracket in Waikoloa Village
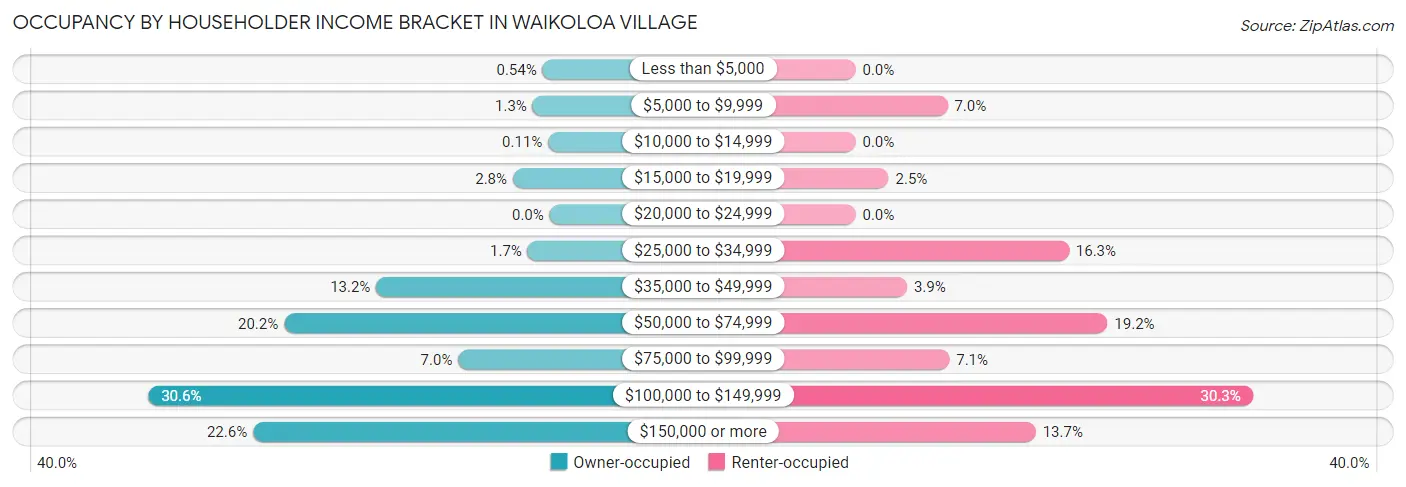
| Income Bracket | Owner-occupied | Renter-occupied |
| Less than $5,000 | 10 (0.5%) | 0 (0.0%) |
| $5,000 to $9,999 | 24 (1.3%) | 50 (7.0%) |
| $10,000 to $14,999 | 2 (0.1%) | 0 (0.0%) |
| $15,000 to $19,999 | 52 (2.8%) | 18 (2.5%) |
| $20,000 to $24,999 | 0 (0.0%) | 0 (0.0%) |
| $25,000 to $34,999 | 31 (1.7%) | 116 (16.3%) |
| $35,000 to $49,999 | 245 (13.2%) | 28 (3.9%) |
| $50,000 to $74,999 | 375 (20.2%) | 137 (19.2%) |
| $75,000 to $99,999 | 129 (7.0%) | 51 (7.1%) |
| $100,000 to $149,999 | 567 (30.6%) | 216 (30.2%) |
| $150,000 or more | 419 (22.6%) | 98 (13.7%) |
| Total | 1,854 (100.0%) | 714 (100.0%) |
Monthly Housing Cost Tiers in Waikoloa Village
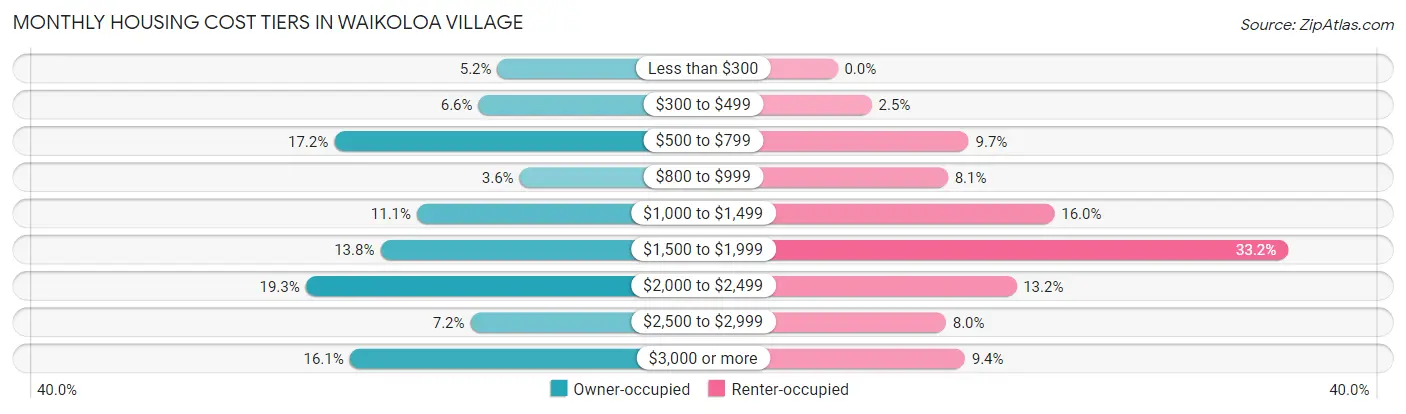
| Monthly Cost | Owner-occupied | Renter-occupied |
| Less than $300 | 96 (5.2%) | 0 (0.0%) |
| $300 to $499 | 122 (6.6%) | 18 (2.5%) |
| $500 to $799 | 319 (17.2%) | 69 (9.7%) |
| $800 to $999 | 66 (3.6%) | 58 (8.1%) |
| $1,000 to $1,499 | 206 (11.1%) | 114 (16.0%) |
| $1,500 to $1,999 | 256 (13.8%) | 237 (33.2%) |
| $2,000 to $2,499 | 358 (19.3%) | 94 (13.2%) |
| $2,500 to $2,999 | 133 (7.2%) | 57 (8.0%) |
| $3,000 or more | 298 (16.1%) | 67 (9.4%) |
| Total | 1,854 (100.0%) | 714 (100.0%) |
Physical Housing Characteristics in Waikoloa Village
Housing Structures in Waikoloa Village
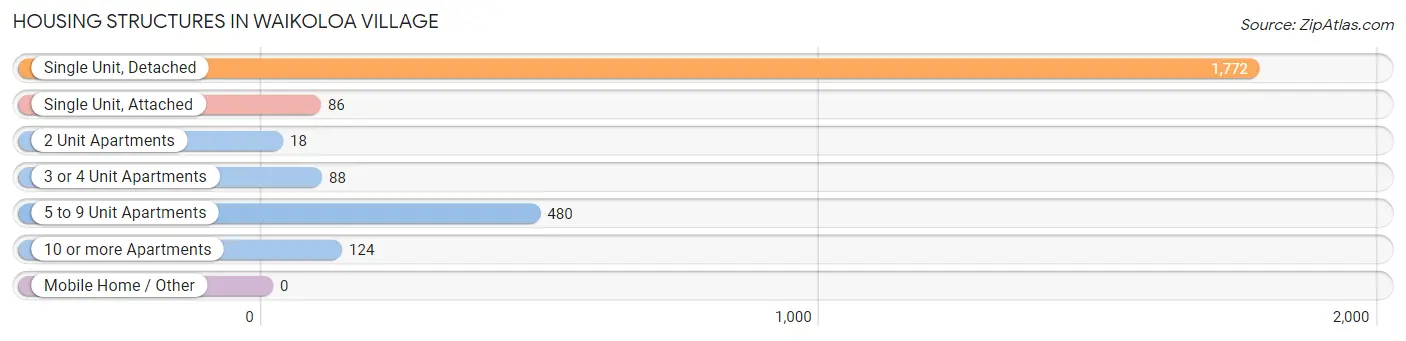
| Structure Type | # Housing Units | % Housing Units |
| Single Unit, Detached | 1,772 | 69.0% |
| Single Unit, Attached | 86 | 3.4% |
| 2 Unit Apartments | 18 | 0.7% |
| 3 or 4 Unit Apartments | 88 | 3.4% |
| 5 to 9 Unit Apartments | 480 | 18.7% |
| 10 or more Apartments | 124 | 4.8% |
| Mobile Home / Other | 0 | 0.0% |
| Total | 2,568 | 100.0% |
Housing Structures by Occupancy in Waikoloa Village
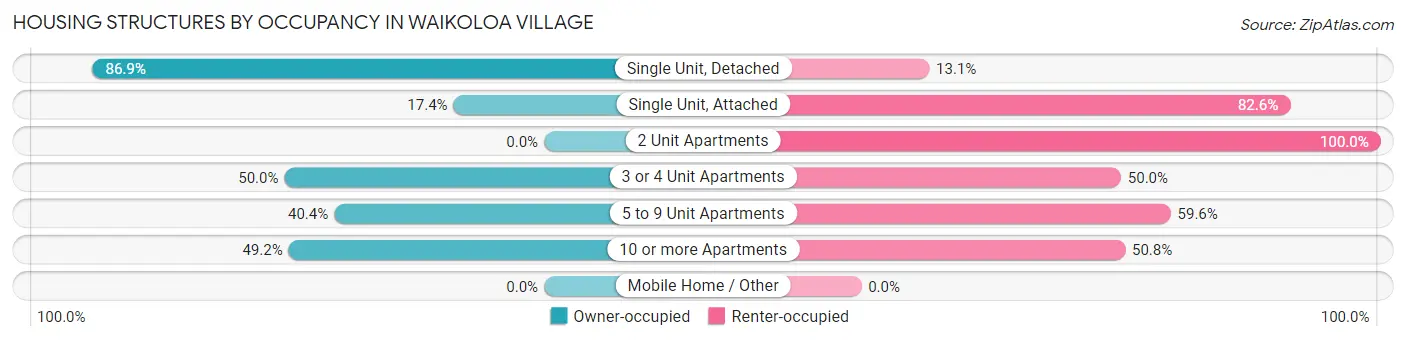
| Structure Type | Owner-occupied | Renter-occupied |
| Single Unit, Detached | 1,540 (86.9%) | 232 (13.1%) |
| Single Unit, Attached | 15 (17.4%) | 71 (82.6%) |
| 2 Unit Apartments | 0 (0.0%) | 18 (100.0%) |
| 3 or 4 Unit Apartments | 44 (50.0%) | 44 (50.0%) |
| 5 to 9 Unit Apartments | 194 (40.4%) | 286 (59.6%) |
| 10 or more Apartments | 61 (49.2%) | 63 (50.8%) |
| Mobile Home / Other | 0 (0.0%) | 0 (0.0%) |
| Total | 1,854 (72.2%) | 714 (27.8%) |
Housing Structures by Number of Rooms in Waikoloa Village
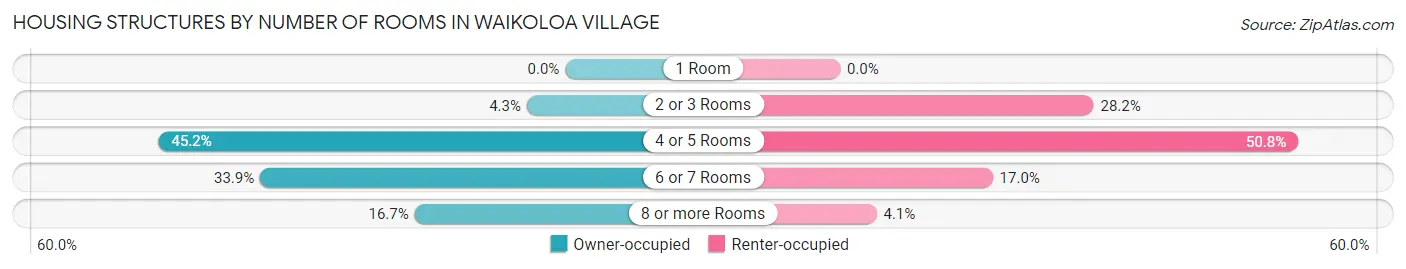
| Number of Rooms | Owner-occupied | Renter-occupied |
| 1 Room | 0 (0.0%) | 0 (0.0%) |
| 2 or 3 Rooms | 79 (4.3%) | 201 (28.1%) |
| 4 or 5 Rooms | 837 (45.2%) | 363 (50.8%) |
| 6 or 7 Rooms | 628 (33.9%) | 121 (17.0%) |
| 8 or more Rooms | 310 (16.7%) | 29 (4.1%) |
| Total | 1,854 (100.0%) | 714 (100.0%) |
Housing Structure by Heating Type in Waikoloa Village
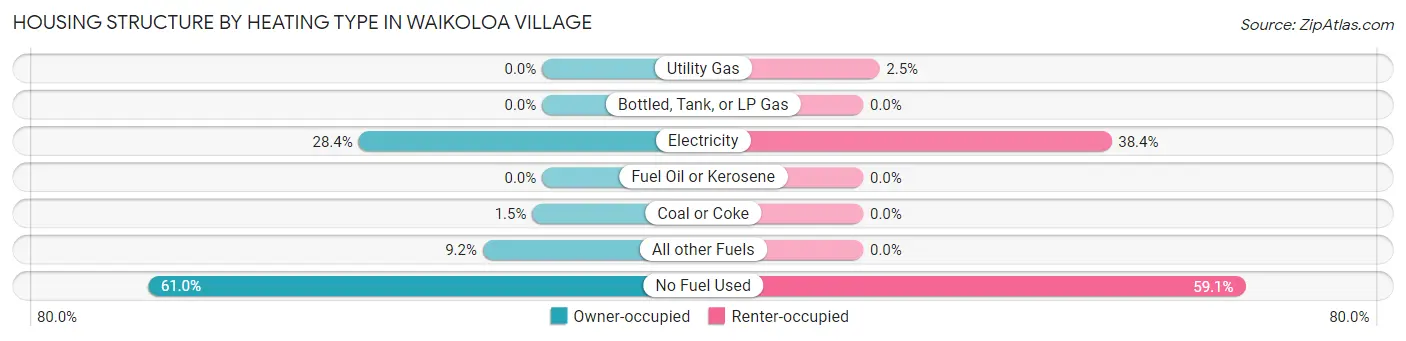
| Heating Type | Owner-occupied | Renter-occupied |
| Utility Gas | 0 (0.0%) | 18 (2.5%) |
| Bottled, Tank, or LP Gas | 0 (0.0%) | 0 (0.0%) |
| Electricity | 526 (28.4%) | 274 (38.4%) |
| Fuel Oil or Kerosene | 0 (0.0%) | 0 (0.0%) |
| Coal or Coke | 28 (1.5%) | 0 (0.0%) |
| All other Fuels | 170 (9.2%) | 0 (0.0%) |
| No Fuel Used | 1,130 (61.0%) | 422 (59.1%) |
| Total | 1,854 (100.0%) | 714 (100.0%) |
Household Vehicle Usage in Waikoloa Village
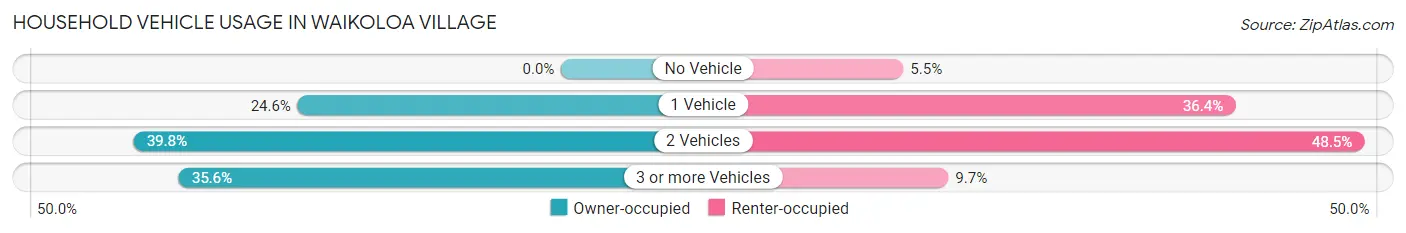
| Vehicles per Household | Owner-occupied | Renter-occupied |
| No Vehicle | 0 (0.0%) | 39 (5.5%) |
| 1 Vehicle | 456 (24.6%) | 260 (36.4%) |
| 2 Vehicles | 738 (39.8%) | 346 (48.5%) |
| 3 or more Vehicles | 660 (35.6%) | 69 (9.7%) |
| Total | 1,854 (100.0%) | 714 (100.0%) |
Real Estate & Mortgages in Waikoloa Village
Real Estate and Mortgage Overview in Waikoloa Village
| Characteristic | Without Mortgage | With Mortgage |
| Housing Units | 709 | 1,145 |
| Median Property Value | $615,100 | $618,800 |
| Median Household Income | $72,750 | $190 |
| Monthly Housing Costs | $587 | $298 |
| Real Estate Taxes | $1,416 | $14 |
Property Value by Mortgage Status in Waikoloa Village
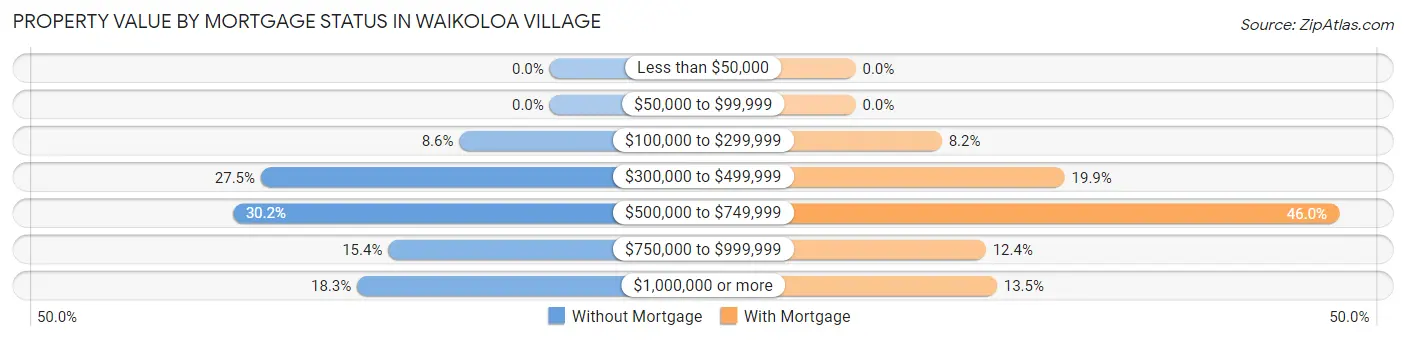
| Property Value | Without Mortgage | With Mortgage |
| Less than $50,000 | 0 (0.0%) | 0 (0.0%) |
| $50,000 to $99,999 | 0 (0.0%) | 0 (0.0%) |
| $100,000 to $299,999 | 61 (8.6%) | 94 (8.2%) |
| $300,000 to $499,999 | 195 (27.5%) | 228 (19.9%) |
| $500,000 to $749,999 | 214 (30.2%) | 527 (46.0%) |
| $750,000 to $999,999 | 109 (15.4%) | 142 (12.4%) |
| $1,000,000 or more | 130 (18.3%) | 154 (13.5%) |
| Total | 709 (100.0%) | 1,145 (100.0%) |
Household Income by Mortgage Status in Waikoloa Village
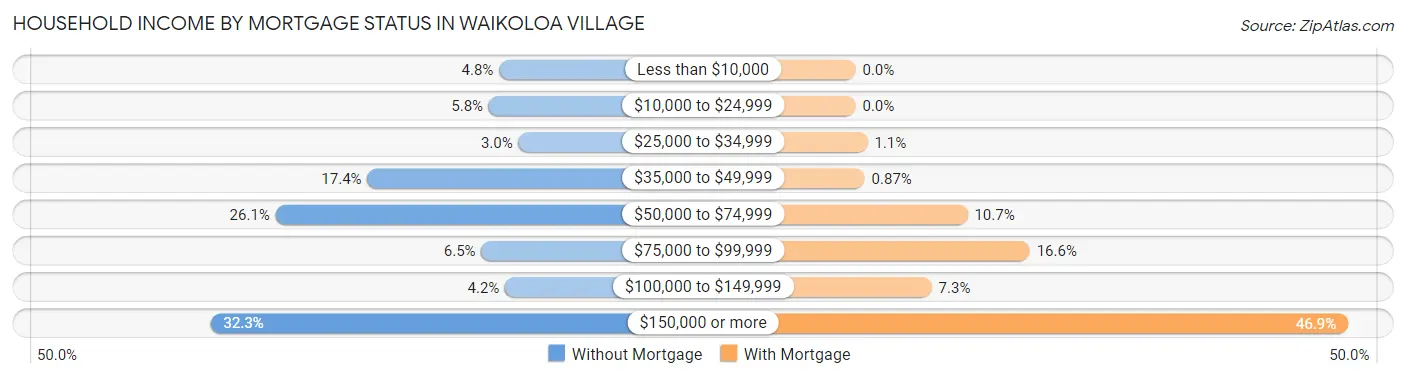
| Household Income | Without Mortgage | With Mortgage |
| Less than $10,000 | 34 (4.8%) | 0 (0.0%) |
| $10,000 to $24,999 | 41 (5.8%) | 0 (0.0%) |
| $25,000 to $34,999 | 21 (3.0%) | 13 (1.1%) |
| $35,000 to $49,999 | 123 (17.3%) | 10 (0.9%) |
| $50,000 to $74,999 | 185 (26.1%) | 122 (10.7%) |
| $75,000 to $99,999 | 46 (6.5%) | 190 (16.6%) |
| $100,000 to $149,999 | 30 (4.2%) | 83 (7.2%) |
| $150,000 or more | 229 (32.3%) | 537 (46.9%) |
| Total | 709 (100.0%) | 1,145 (100.0%) |
Property Value to Household Income Ratio in Waikoloa Village
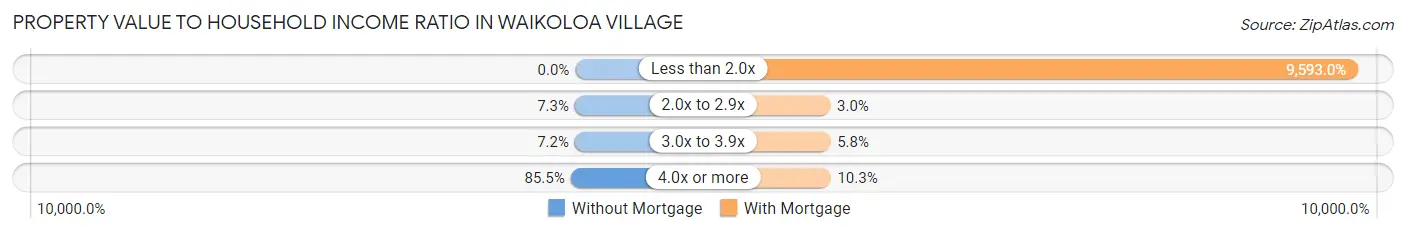
| Value-to-Income Ratio | Without Mortgage | With Mortgage |
| Less than 2.0x | 0 (0.0%) | 109,840 (9,593.0%) |
| 2.0x to 2.9x | 52 (7.3%) | 34 (3.0%) |
| 3.0x to 3.9x | 51 (7.2%) | 66 (5.8%) |
| 4.0x or more | 606 (85.5%) | 118 (10.3%) |
| Total | 709 (100.0%) | 1,145 (100.0%) |
Real Estate Taxes by Mortgage Status in Waikoloa Village
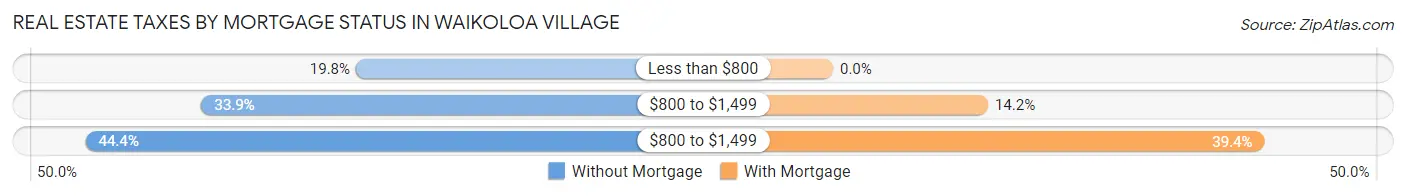
| Property Taxes | Without Mortgage | With Mortgage |
| Less than $800 | 140 (19.8%) | 0 (0.0%) |
| $800 to $1,499 | 240 (33.9%) | 162 (14.1%) |
| $800 to $1,499 | 315 (44.4%) | 451 (39.4%) |
| Total | 709 (100.0%) | 1,145 (100.0%) |
Health & Disability in Waikoloa Village
Health Insurance Coverage by Age in Waikoloa Village
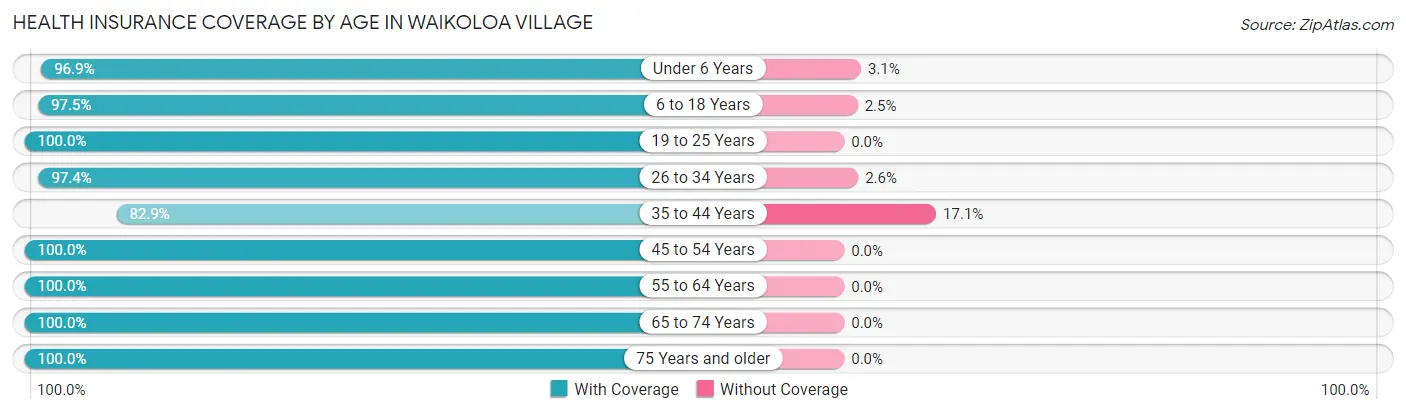
| Age Bracket | With Coverage | Without Coverage |
| Under 6 Years | 592 (96.9%) | 19 (3.1%) |
| 6 to 18 Years | 1,483 (97.5%) | 38 (2.5%) |
| 19 to 25 Years | 325 (100.0%) | 0 (0.0%) |
| 26 to 34 Years | 751 (97.4%) | 20 (2.6%) |
| 35 to 44 Years | 1,064 (82.9%) | 220 (17.1%) |
| 45 to 54 Years | 753 (100.0%) | 0 (0.0%) |
| 55 to 64 Years | 859 (100.0%) | 0 (0.0%) |
| 65 to 74 Years | 832 (100.0%) | 0 (0.0%) |
| 75 Years and older | 462 (100.0%) | 0 (0.0%) |
| Total | 7,121 (96.0%) | 297 (4.0%) |
Health Insurance Coverage by Citizenship Status in Waikoloa Village
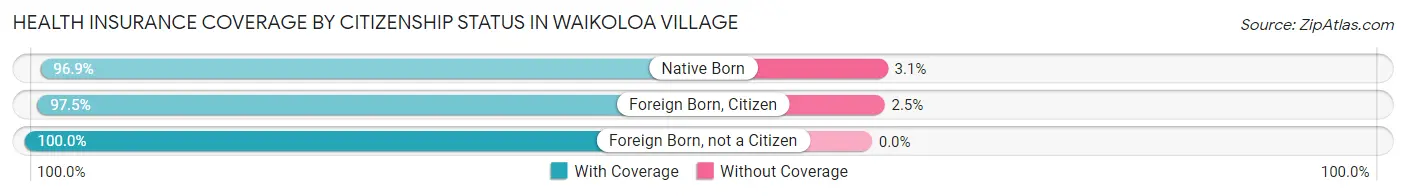
| Citizenship Status | With Coverage | Without Coverage |
| Native Born | 592 (96.9%) | 19 (3.1%) |
| Foreign Born, Citizen | 1,483 (97.5%) | 38 (2.5%) |
| Foreign Born, not a Citizen | 325 (100.0%) | 0 (0.0%) |
Health Insurance Coverage by Household Income in Waikoloa Village
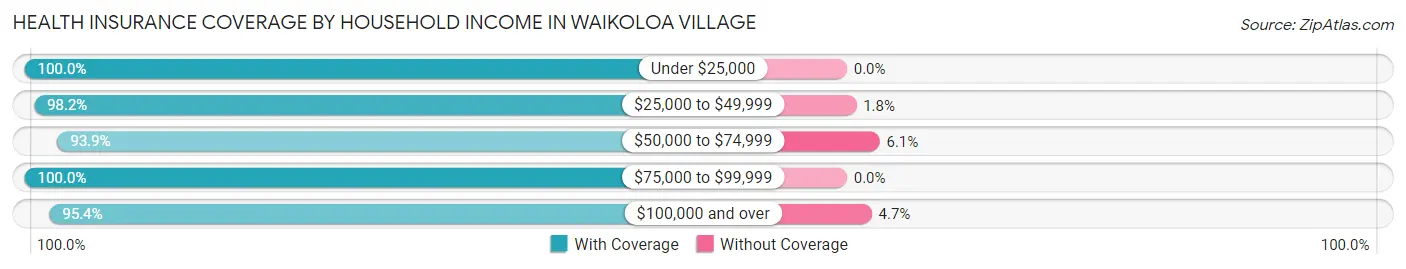
| Household Income | With Coverage | Without Coverage |
| Under $25,000 | 309 (100.0%) | 0 (0.0%) |
| $25,000 to $49,999 | 1,118 (98.2%) | 20 (1.8%) |
| $50,000 to $74,999 | 1,146 (93.9%) | 75 (6.1%) |
| $75,000 to $99,999 | 397 (100.0%) | 0 (0.0%) |
| $100,000 and over | 4,142 (95.4%) | 202 (4.6%) |
Public vs Private Health Insurance Coverage by Age in Waikoloa Village
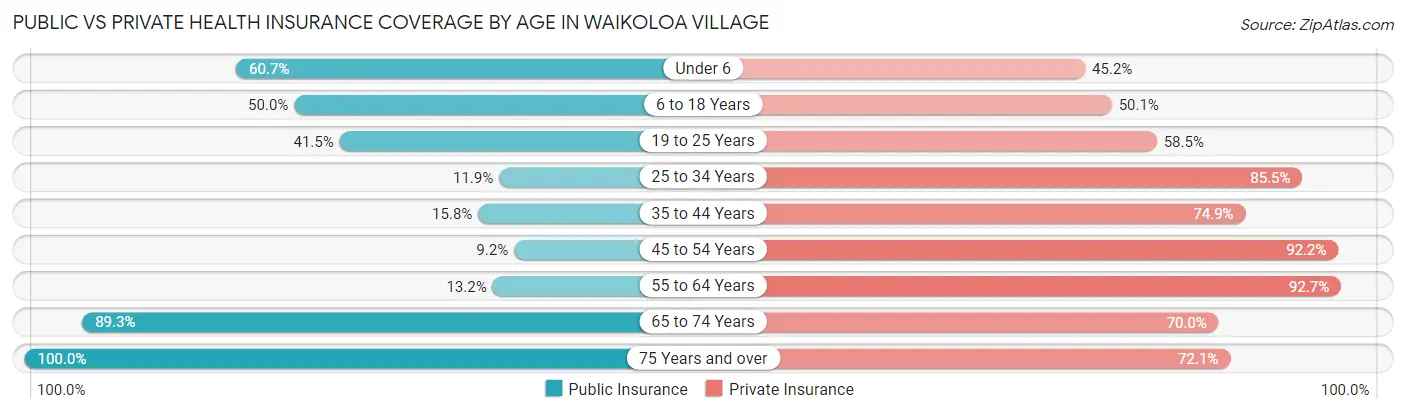
| Age Bracket | Public Insurance | Private Insurance |
| Under 6 | 371 (60.7%) | 276 (45.2%) |
| 6 to 18 Years | 760 (50.0%) | 762 (50.1%) |
| 19 to 25 Years | 135 (41.5%) | 190 (58.5%) |
| 25 to 34 Years | 92 (11.9%) | 659 (85.5%) |
| 35 to 44 Years | 203 (15.8%) | 962 (74.9%) |
| 45 to 54 Years | 69 (9.2%) | 694 (92.2%) |
| 55 to 64 Years | 113 (13.2%) | 796 (92.7%) |
| 65 to 74 Years | 743 (89.3%) | 582 (70.0%) |
| 75 Years and over | 462 (100.0%) | 333 (72.1%) |
| Total | 2,948 (39.7%) | 5,254 (70.8%) |
Disability Status by Sex by Age in Waikoloa Village
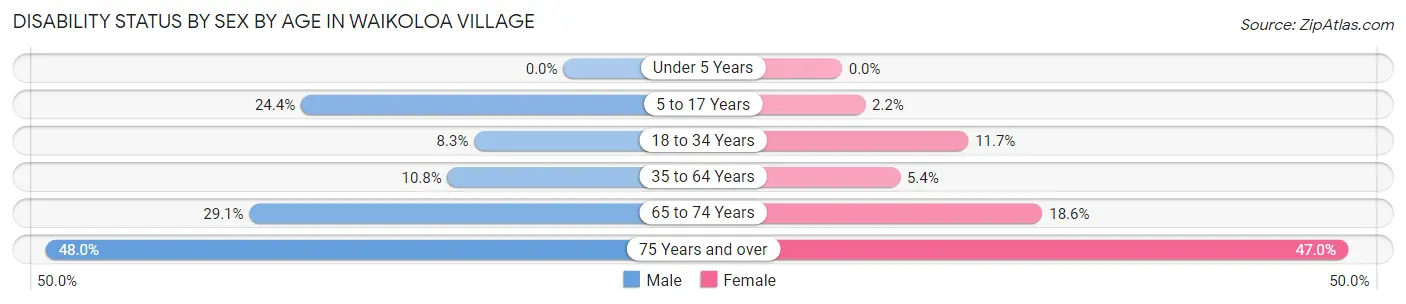
| Age Bracket | Male | Female |
| Under 5 Years | 0 (0.0%) | 0 (0.0%) |
| 5 to 17 Years | 177 (24.3%) | 19 (2.2%) |
| 18 to 34 Years | 42 (8.3%) | 69 (11.7%) |
| 35 to 64 Years | 158 (10.7%) | 77 (5.4%) |
| 65 to 74 Years | 125 (29.1%) | 75 (18.6%) |
| 75 Years and over | 135 (48.0%) | 85 (47.0%) |
Disability Class by Sex by Age in Waikoloa Village
Disability Class: Hearing Difficulty
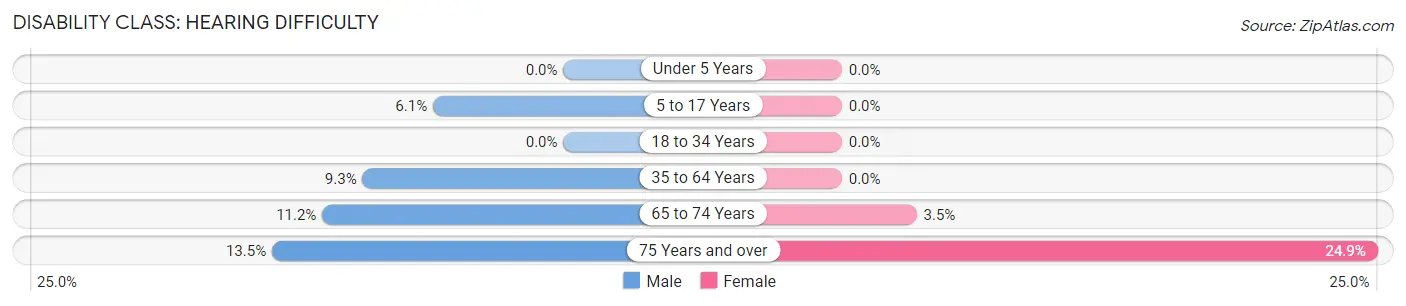
| Age Bracket | Male | Female |
| Under 5 Years | 0 (0.0%) | 0 (0.0%) |
| 5 to 17 Years | 44 (6.0%) | 0 (0.0%) |
| 18 to 34 Years | 0 (0.0%) | 0 (0.0%) |
| 35 to 64 Years | 137 (9.3%) | 0 (0.0%) |
| 65 to 74 Years | 48 (11.2%) | 14 (3.5%) |
| 75 Years and over | 38 (13.5%) | 45 (24.9%) |
Disability Class: Vision Difficulty
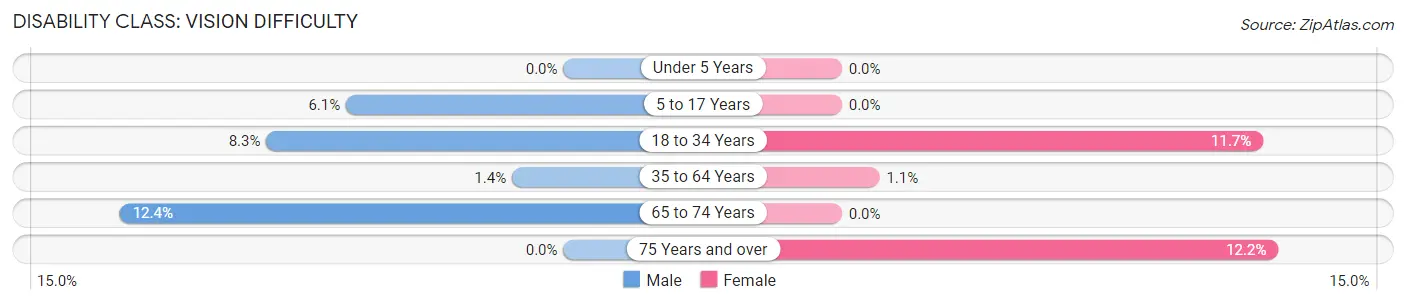
| Age Bracket | Male | Female |
| Under 5 Years | 0 (0.0%) | 0 (0.0%) |
| 5 to 17 Years | 44 (6.0%) | 0 (0.0%) |
| 18 to 34 Years | 42 (8.3%) | 69 (11.7%) |
| 35 to 64 Years | 21 (1.4%) | 15 (1.1%) |
| 65 to 74 Years | 53 (12.3%) | 0 (0.0%) |
| 75 Years and over | 0 (0.0%) | 22 (12.1%) |
Disability Class: Cognitive Difficulty
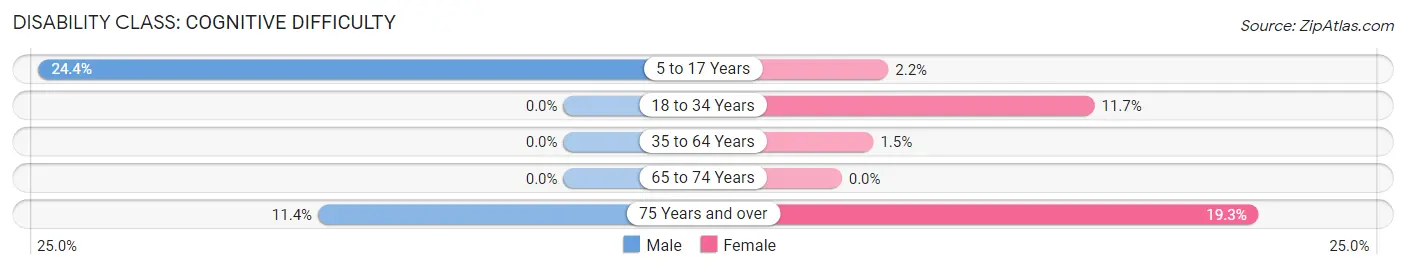
| Age Bracket | Male | Female |
| 5 to 17 Years | 177 (24.3%) | 19 (2.2%) |
| 18 to 34 Years | 0 (0.0%) | 69 (11.7%) |
| 35 to 64 Years | 0 (0.0%) | 21 (1.5%) |
| 65 to 74 Years | 0 (0.0%) | 0 (0.0%) |
| 75 Years and over | 32 (11.4%) | 35 (19.3%) |
Disability Class: Ambulatory Difficulty
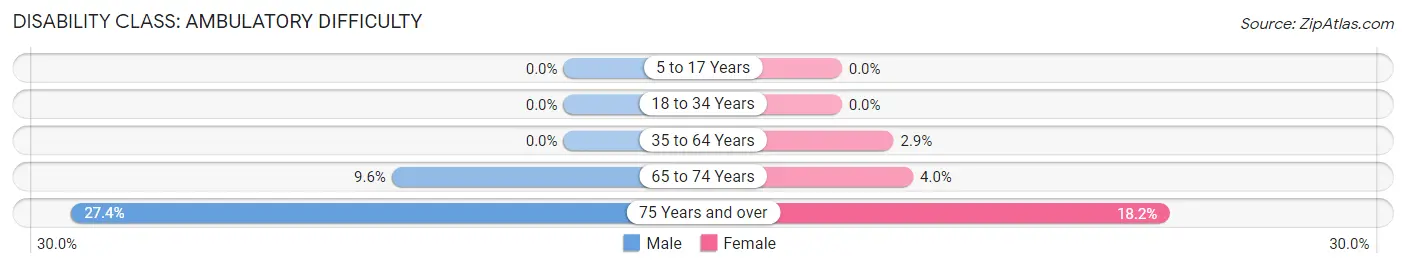
| Age Bracket | Male | Female |
| 5 to 17 Years | 0 (0.0%) | 0 (0.0%) |
| 18 to 34 Years | 0 (0.0%) | 0 (0.0%) |
| 35 to 64 Years | 0 (0.0%) | 41 (2.9%) |
| 65 to 74 Years | 41 (9.6%) | 16 (4.0%) |
| 75 Years and over | 77 (27.4%) | 33 (18.2%) |
Disability Class: Self-Care Difficulty
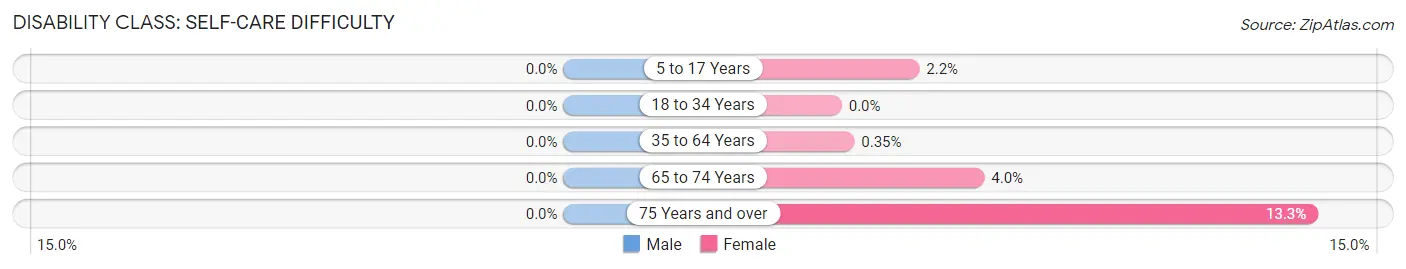
| Age Bracket | Male | Female |
| 5 to 17 Years | 0 (0.0%) | 19 (2.2%) |
| 18 to 34 Years | 0 (0.0%) | 0 (0.0%) |
| 35 to 64 Years | 0 (0.0%) | 5 (0.4%) |
| 65 to 74 Years | 0 (0.0%) | 16 (4.0%) |
| 75 Years and over | 0 (0.0%) | 24 (13.3%) |
Technology Access in Waikoloa Village
Computing Device Access in Waikoloa Village
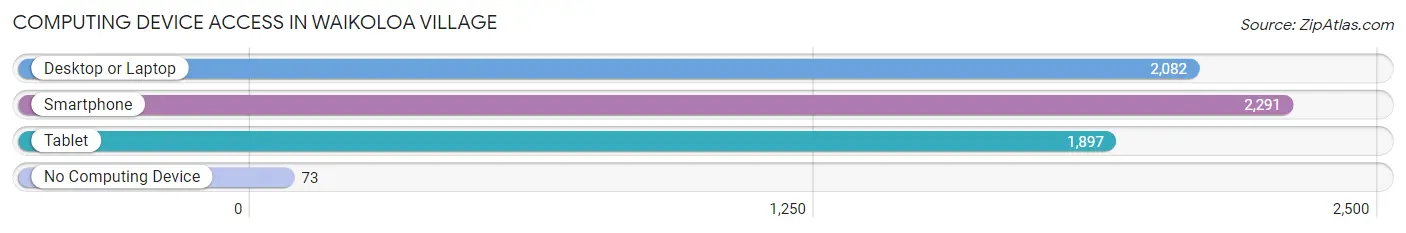
| Device Type | # Households | % Households |
| Desktop or Laptop | 2,082 | 81.1% |
| Smartphone | 2,291 | 89.2% |
| Tablet | 1,897 | 73.9% |
| No Computing Device | 73 | 2.8% |
| Total | 2,568 | 100.0% |
Internet Access in Waikoloa Village
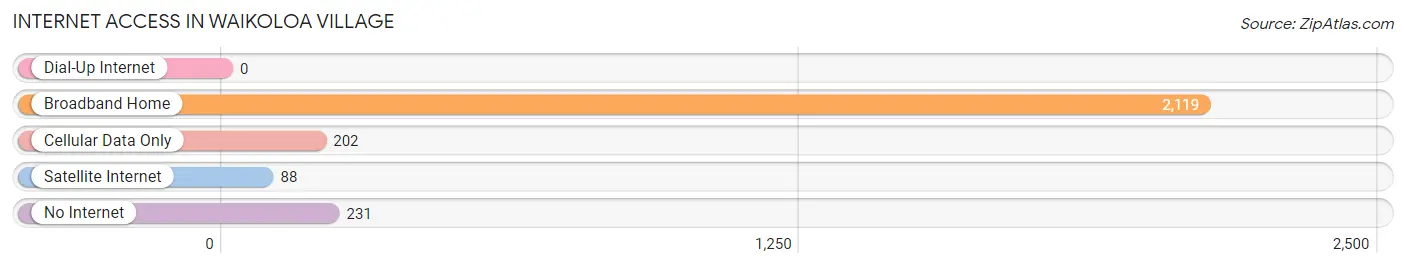
| Internet Type | # Households | % Households |
| Dial-Up Internet | 0 | 0.0% |
| Broadband Home | 2,119 | 82.5% |
| Cellular Data Only | 202 | 7.9% |
| Satellite Internet | 88 | 3.4% |
| No Internet | 231 | 9.0% |
| Total | 2,568 | 100.0% |
Waikoloa Village Summary
Waikoloa Village is a census-designated place (CDP) located in the South Kohala District of the island of Hawaii in the U.S. state of Hawaii. The population was 6,362 at the 2010 census, up from 4,806 at the 2000 census. Waikoloa Village is located at 19°56′N 155°45′W, at an elevation of 545 feet (166 m).
History
Waikoloa Village was originally a small fishing village located on the banks of the Waikoloa Stream. The area was first settled by Polynesian immigrants in the late 1700s. The village was later abandoned in the early 1800s, but was re-established in the late 1800s by Japanese immigrants. The village was then abandoned again in the early 1900s, but was re-established in the late 1950s by American settlers.
The area was developed in the 1960s and 1970s as a resort community. The Waikoloa Village Association was formed in 1972 to manage the development of the area. The Waikoloa Village Golf Course was opened in 1974, and the Waikoloa Beach Resort was opened in 1978.
Geography
Waikoloa Village is located on the western side of the island of Hawaii, about 25 miles (40 km) north of Kailua-Kona. The village is situated in the South Kohala District, between the Kohala Mountains to the north and the Mauna Kea volcano to the south. The village is located on the banks of the Waikoloa Stream, which flows from the Kohala Mountains to the Pacific Ocean.
The village is bordered to the north by the Waikoloa Beach Resort, to the east by the Waikoloa Village Golf Course, and to the south by the Waikoloa Stream. The village is located within the Waikoloa Dry Forest, a dry tropical forest that is home to a variety of native plants and animals.
Economy
The economy of Waikoloa Village is largely based on tourism. The Waikoloa Beach Resort and the Waikoloa Village Golf Course are the two main attractions in the area. The resort offers a variety of amenities, including a spa, restaurants, and shopping. The golf course is a popular destination for golfers from around the world.
In addition to tourism, Waikoloa Village is home to a variety of businesses, including restaurants, retail stores, and professional services. The village is also home to a number of technology companies, including a software development firm and a web design firm.
Demographics
As of the 2010 census, there were 6,362 people, 2,845 households, and 1,845 families residing in the CDP. The population density was 545.3 people per square mile (210.9/km2). There were 3,845 housing units at an average density of 327.3 per square mile (126.3/km2). The racial makeup of the CDP was 68.2% White, 0.7% African American, 0.3% Native American, 11.2% Asian, 0.2% Pacific Islander, 15.2% from other races, and 4.2% from two or more races. Hispanic or Latino of any race were 24.2% of the population.
There were 2,845 households, out of which 24.2% had children under the age of 18 living with them, 48.2% were married couples living together, 10.2% had a female householder with no husband present, and 36.2% were non-families. 28.2% of all households were made up of individuals, and 8.2% had someone living alone who was 65 years of age or older. The average household size was 2.22 and the average family size was 2.71.
In the CDP, the population was spread out, with 19.2% under the age of 18, 6.2% from 18 to 24, 24.2% from 25 to 44, 33.2% from 45 to 64, and 17.2% who were 65 years of age or older. The median age was 44 years. For every 100 females, there were 97.2 males. For every 100 females age 18 and over, there were 95.2 males.
The median income for a household in the CDP was $50,000, and the median income for a family was $58,750. Males had a median income of $41,250 versus $30,000 for females. The per capita income for the CDP was $27,917. About 8.2% of families and 11.2% of the population were below the poverty line, including 16.2% of those under age 18 and 4.2% of those age 65 or over.
Common Questions
What is Per Capita Income in Waikoloa Village?
Per Capita income in Waikoloa Village is $35,769.
What is the Median Family Income in Waikoloa Village?
Median Family Income in Waikoloa Village is $105,806.
What is the Median Household income in Waikoloa Village?
Median Household Income in Waikoloa Village is $103,135.
What is Income or Wage Gap in Waikoloa Village?
Income or Wage Gap in Waikoloa Village is 26.3%.
Women in Waikoloa Village earn 73.7 cents for every dollar earned by a man.
What is Family Income Deficit in Waikoloa Village?
Family Income Deficit in Waikoloa Village is $12,012.
Families that are below poverty line in Waikoloa Village earn $12,012 less on average than the poverty threshold level.
What is Inequality or Gini Index in Waikoloa Village?
Inequality or Gini Index in Waikoloa Village is 0.34.
What is the Total Population of Waikoloa Village?
Total Population of Waikoloa Village is 7,418.
What is the Total Male Population of Waikoloa Village?
Total Male Population of Waikoloa Village is 3,656.
What is the Total Female Population of Waikoloa Village?
Total Female Population of Waikoloa Village is 3,762.
What is the Ratio of Males per 100 Females in Waikoloa Village?
There are 97.18 Males per 100 Females in Waikoloa Village.
What is the Ratio of Females per 100 Males in Waikoloa Village?
There are 102.90 Females per 100 Males in Waikoloa Village.
What is the Median Population Age in Waikoloa Village?
Median Population Age in Waikoloa Village is 38.1 Years.
What is the Average Family Size in Waikoloa Village
Average Family Size in Waikoloa Village is 3.2 People.
What is the Average Household Size in Waikoloa Village
Average Household Size in Waikoloa Village is 2.9 People.
How Large is the Labor Force in Waikoloa Village?
There are 3,789 People in the Labor Forcein in Waikoloa Village.
What is the Percentage of People in the Labor Force in Waikoloa Village?
67.4% of People are in the Labor Force in Waikoloa Village.
What is the Unemployment Rate in Waikoloa Village?
Unemployment Rate in Waikoloa Village is 9.8%.