Waikapu, HI Map & Demographics
Waikapu Map
Waikapu Overview
$41,443
PER CAPITA INCOME
$119,438
AVG FAMILY INCOME
$117,500
AVG HOUSEHOLD INCOME
21.8%
WAGE / INCOME GAP [ % ]
78.2¢/ $1
WAGE / INCOME GAP [ $ ]
0.36
INEQUALITY / GINI INDEX
3,887
TOTAL POPULATION
1,910
MALE POPULATION
1,977
FEMALE POPULATION
96.61
MALES / 100 FEMALES
103.51
FEMALES / 100 MALES
33.9
MEDIAN AGE
3.7
AVG FAMILY SIZE
3.5
AVG HOUSEHOLD SIZE
2,047
LABOR FORCE [ PEOPLE ]
73.6%
PERCENT IN LABOR FORCE
2.6%
UNEMPLOYMENT RATE
Income in Waikapu
Income Overview in Waikapu
Per Capita Income in Waikapu is $41,443, while median incomes of families and households are $119,438 and $117,500 respectively.
| Characteristic | Number | Measure |
| Per Capita Income | 3,887 | $41,443 |
| Median Family Income | 932 | $119,438 |
| Mean Family Income | 932 | $147,429 |
| Median Household Income | 1,112 | $117,500 |
| Mean Household Income | 1,112 | $140,036 |
| Income Deficit | 932 | $0 |
| Wage / Income Gap (%) | 3,887 | 21.80% |
| Wage / Income Gap ($) | 3,887 | 78.20¢ per $1 |
| Gini / Inequality Index | 3,887 | 0.36 |
Earnings by Sex in Waikapu
Average Earnings in Waikapu are $47,054, $53,304 for men and $41,682 for women, a difference of 21.8%.
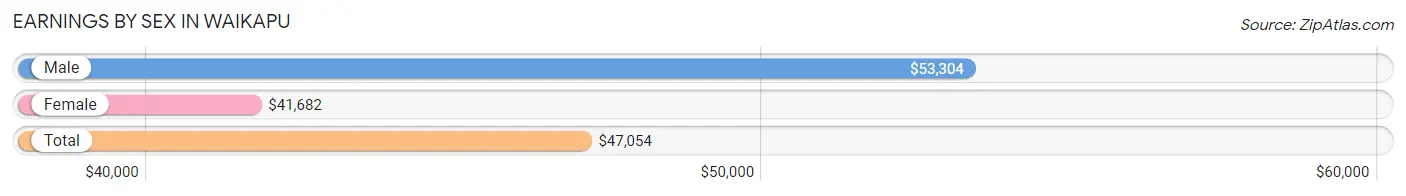
| Sex | Number | Average Earnings |
| Male | 1,001 (45.9%) | $53,304 |
| Female | 1,180 (54.1%) | $41,682 |
| Total | 2,181 (100.0%) | $47,054 |
Earnings by Sex by Income Bracket in Waikapu
The most common earnings brackets in Waikapu are $100,000+ for men (221 | 22.1%) and $75,000 to $99,999 for women (146 | 12.4%).
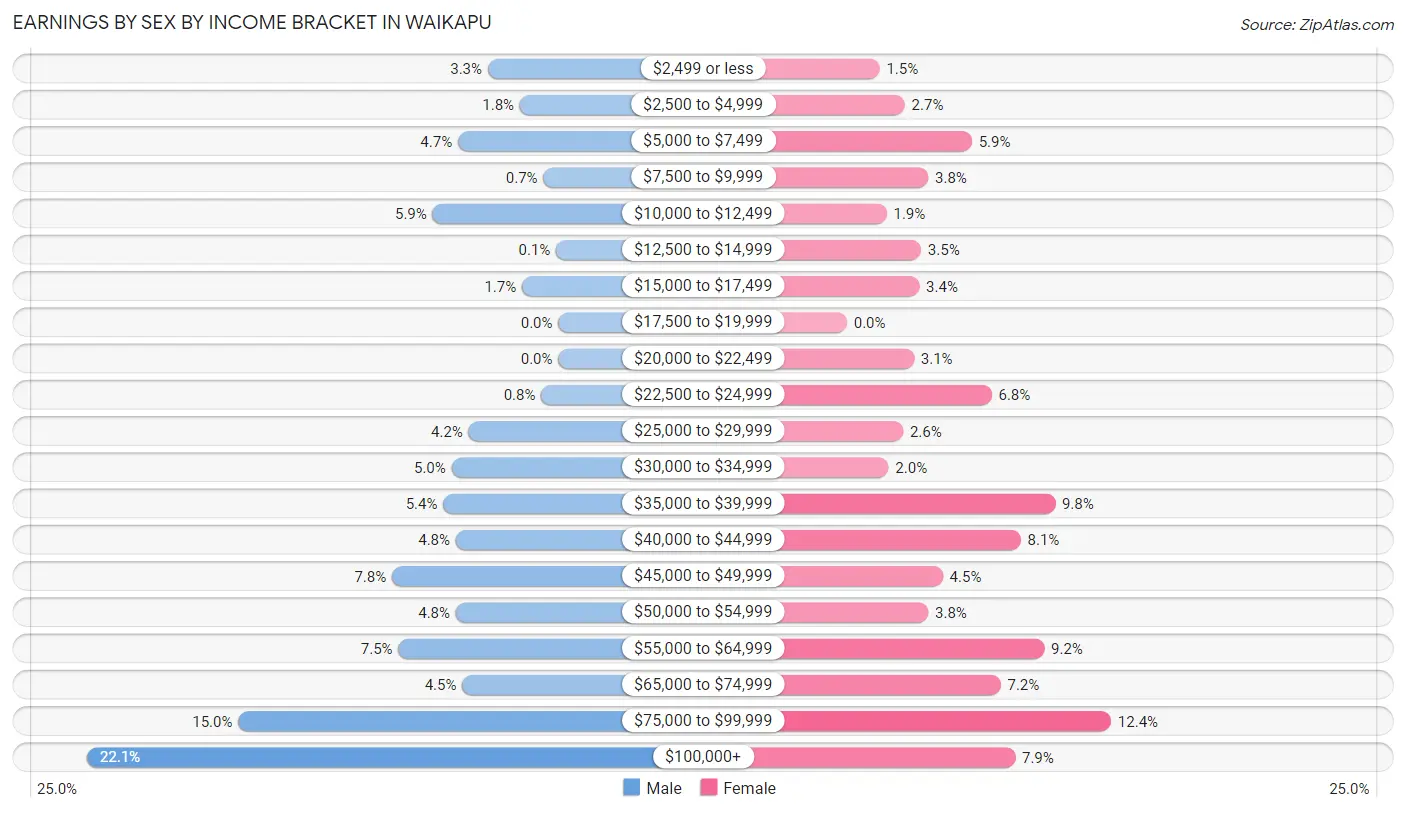
| Income | Male | Female |
| $2,499 or less | 33 (3.3%) | 18 (1.5%) |
| $2,500 to $4,999 | 18 (1.8%) | 32 (2.7%) |
| $5,000 to $7,499 | 47 (4.7%) | 69 (5.9%) |
| $7,500 to $9,999 | 7 (0.7%) | 45 (3.8%) |
| $10,000 to $12,499 | 59 (5.9%) | 22 (1.9%) |
| $12,500 to $14,999 | 1 (0.1%) | 41 (3.5%) |
| $15,000 to $17,499 | 17 (1.7%) | 40 (3.4%) |
| $17,500 to $19,999 | 0 (0.0%) | 0 (0.0%) |
| $20,000 to $22,499 | 0 (0.0%) | 37 (3.1%) |
| $22,500 to $24,999 | 8 (0.8%) | 80 (6.8%) |
| $25,000 to $29,999 | 42 (4.2%) | 31 (2.6%) |
| $30,000 to $34,999 | 50 (5.0%) | 23 (1.9%) |
| $35,000 to $39,999 | 54 (5.4%) | 115 (9.8%) |
| $40,000 to $44,999 | 48 (4.8%) | 96 (8.1%) |
| $45,000 to $49,999 | 78 (7.8%) | 53 (4.5%) |
| $50,000 to $54,999 | 48 (4.8%) | 45 (3.8%) |
| $55,000 to $64,999 | 75 (7.5%) | 109 (9.2%) |
| $65,000 to $74,999 | 45 (4.5%) | 85 (7.2%) |
| $75,000 to $99,999 | 150 (15.0%) | 146 (12.4%) |
| $100,000+ | 221 (22.1%) | 93 (7.9%) |
| Total | 1,001 (100.0%) | 1,180 (100.0%) |
Earnings by Sex by Educational Attainment in Waikapu
Average earnings in Waikapu are $61,667 for men and $48,750 for women, a difference of 20.9%. Men with an educational attainment of bachelor's degree enjoy the highest average annual earnings of $85,000, while those with high school diploma education earn the least with $42,500. Women with an educational attainment of bachelor's degree earn the most with the average annual earnings of $64,306, while those with high school diploma education have the smallest earnings of $36,771.
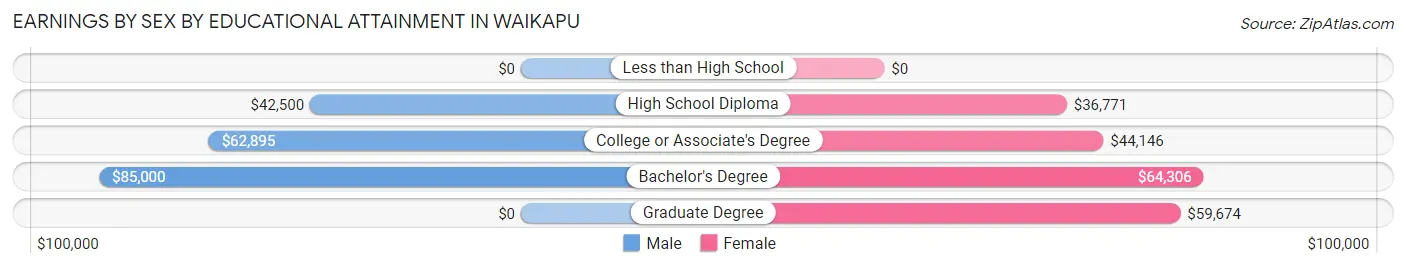
| Educational Attainment | Male Income | Female Income |
| Less than High School | - | - |
| High School Diploma | $42,500 | $36,771 |
| College or Associate's Degree | $62,895 | $44,146 |
| Bachelor's Degree | $85,000 | $64,306 |
| Graduate Degree | - | - |
| Total | $61,667 | $48,750 |
Family Income in Waikapu
Family Income Brackets in Waikapu
According to the Waikapu family income data, there are 258 families falling into the $100,000 to $149,999 income range, which is the most common income bracket and makes up 27.7% of all families.
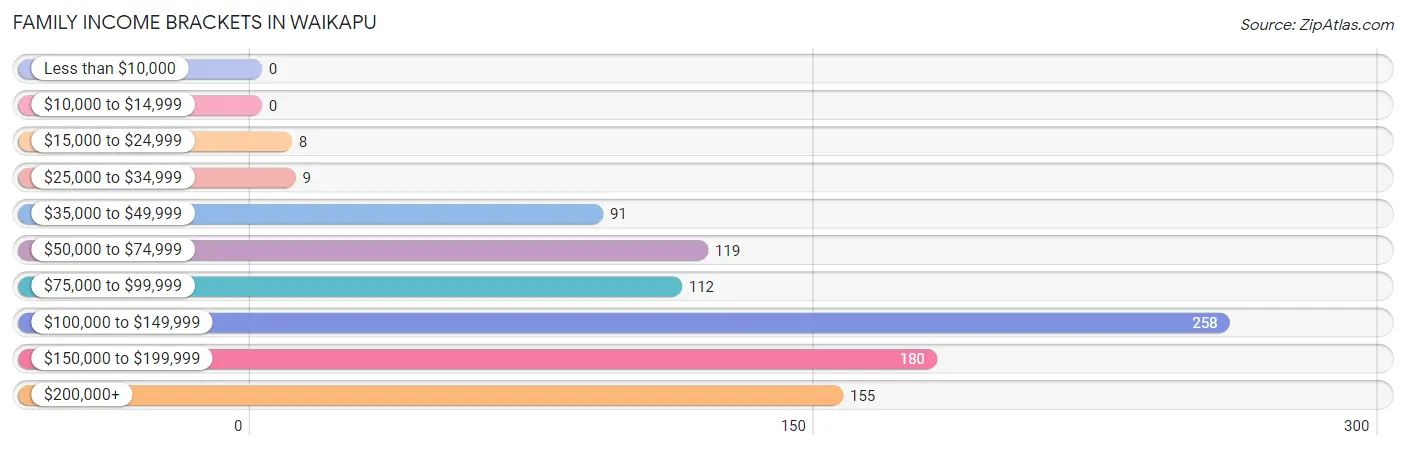
| Income Bracket | # Families | % Families |
| Less than $10,000 | 0 | 0.0% |
| $10,000 to $14,999 | 0 | 0.0% |
| $15,000 to $24,999 | 8 | 0.9% |
| $25,000 to $34,999 | 9 | 1.0% |
| $35,000 to $49,999 | 91 | 9.8% |
| $50,000 to $74,999 | 119 | 12.8% |
| $75,000 to $99,999 | 112 | 12.0% |
| $100,000 to $149,999 | 258 | 27.7% |
| $150,000 to $199,999 | 180 | 19.3% |
| $200,000+ | 155 | 16.6% |
Family Income by Famaliy Size in Waikapu
6-person families (65 | 7.0%) account for the highest median family income in Waikapu with $191,089 per family, while 2-person families (282 | 30.3%) have the highest median income of $56,544 per family member.
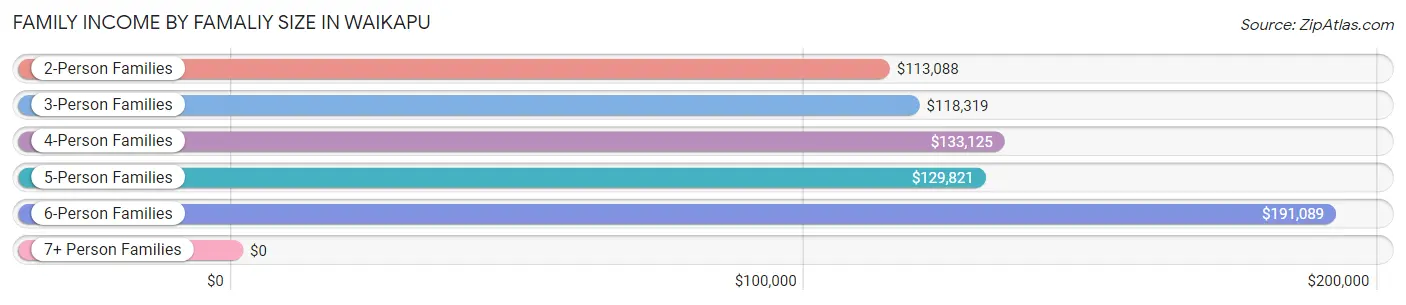
| Income Bracket | # Families | Median Income |
| 2-Person Families | 282 (30.3%) | $113,088 |
| 3-Person Families | 231 (24.8%) | $118,319 |
| 4-Person Families | 195 (20.9%) | $133,125 |
| 5-Person Families | 147 (15.8%) | $129,821 |
| 6-Person Families | 65 (7.0%) | $191,089 |
| 7+ Person Families | 12 (1.3%) | $0 |
| Total | 932 (100.0%) | $119,438 |
Family Income by Number of Earners in Waikapu
The median family income in Waikapu is $119,438, with families comprising 3+ earners (210) having the highest median family income of $191,129, while families with 1 earner (251) have the lowest median family income of $72,054, accounting for 22.5% and 26.9% of families, respectively.
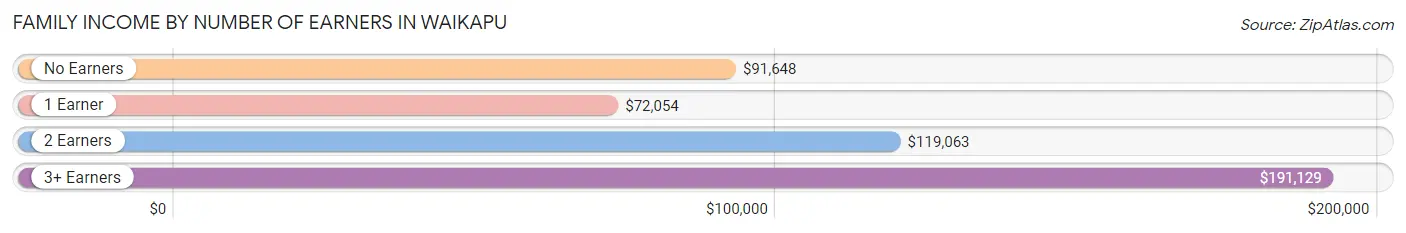
| Number of Earners | # Families | Median Income |
| No Earners | 61 (6.6%) | $91,648 |
| 1 Earner | 251 (26.9%) | $72,054 |
| 2 Earners | 410 (44.0%) | $119,063 |
| 3+ Earners | 210 (22.5%) | $191,129 |
| Total | 932 (100.0%) | $119,438 |
Household Income in Waikapu
Household Income Brackets in Waikapu
With 312 households falling in the category, the $100,000 to $149,999 income range is the most frequent in Waikapu, accounting for 28.1% of all households. In contrast, only 7 households (0.6%) fall into the less than $10,000 income bracket, making it the least populous group.
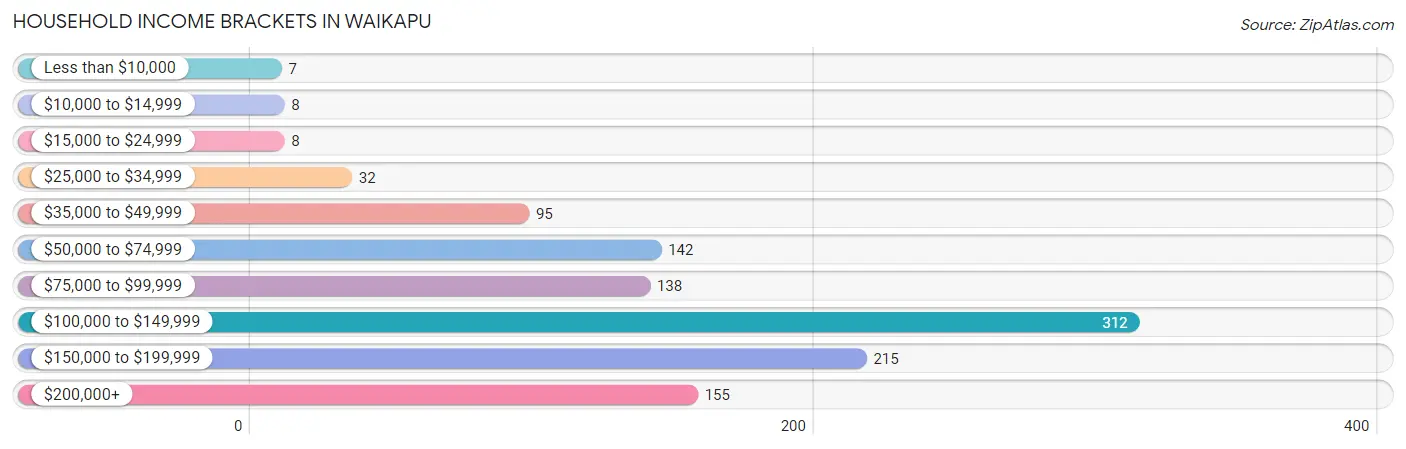
| Income Bracket | # Households | % Households |
| Less than $10,000 | 7 | 0.6% |
| $10,000 to $14,999 | 8 | 0.7% |
| $15,000 to $24,999 | 8 | 0.7% |
| $25,000 to $34,999 | 32 | 2.9% |
| $35,000 to $49,999 | 95 | 8.5% |
| $50,000 to $74,999 | 142 | 12.8% |
| $75,000 to $99,999 | 138 | 12.4% |
| $100,000 to $149,999 | 312 | 28.1% |
| $150,000 to $199,999 | 215 | 19.3% |
| $200,000+ | 155 | 13.9% |
Household Income by Householder Age in Waikapu
The median household income in Waikapu is $117,500, with the highest median household income of $129,350 found in the 45 to 64 years age bracket for the primary householder. A total of 391 households (35.2%) fall into this category. Meanwhile, the 15 to 24 years age bracket for the primary householder has the lowest median household income of $0, with 16 households (1.4%) in this group.
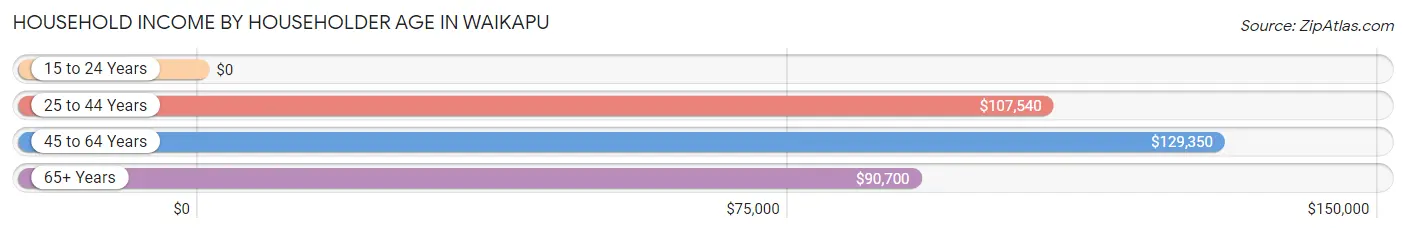
| Income Bracket | # Households | Median Income |
| 15 to 24 Years | 16 (1.4%) | $0 |
| 25 to 44 Years | 413 (37.1%) | $107,540 |
| 45 to 64 Years | 391 (35.2%) | $129,350 |
| 65+ Years | 292 (26.3%) | $90,700 |
| Total | 1,112 (100.0%) | $117,500 |
Poverty in Waikapu
Income Below Poverty by Sex and Age in Waikapu
With 4.7% poverty level for males and 4.2% for females among the residents of Waikapu, 16 and 17 year old males and 15 year old females are the most vulnerable to poverty, with 9 males (21.4%) and 24 females (39.3%) in their respective age groups living below the poverty level.
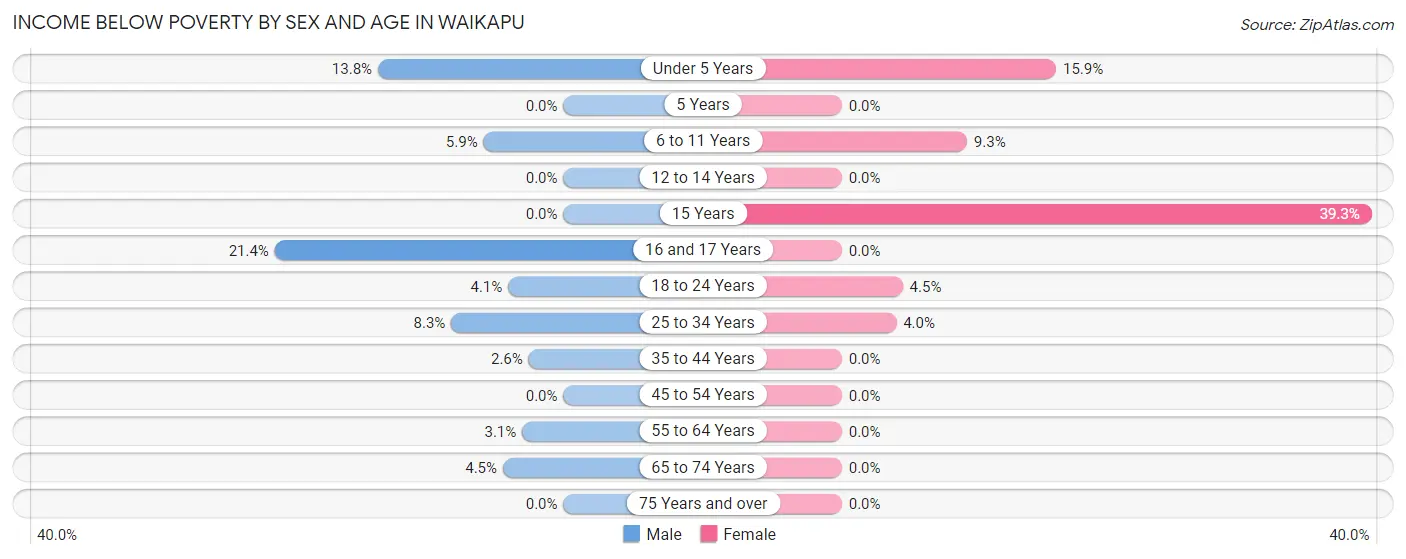
| Age Bracket | Male | Female |
| Under 5 Years | 19 (13.8%) | 21 (15.9%) |
| 5 Years | 0 (0.0%) | 0 (0.0%) |
| 6 to 11 Years | 15 (5.9%) | 17 (9.3%) |
| 12 to 14 Years | 0 (0.0%) | 0 (0.0%) |
| 15 Years | 0 (0.0%) | 24 (39.3%) |
| 16 and 17 Years | 9 (21.4%) | 0 (0.0%) |
| 18 to 24 Years | 5 (4.1%) | 8 (4.5%) |
| 25 to 34 Years | 21 (8.3%) | 12 (4.0%) |
| 35 to 44 Years | 6 (2.6%) | 0 (0.0%) |
| 45 to 54 Years | 0 (0.0%) | 0 (0.0%) |
| 55 to 64 Years | 6 (3.1%) | 0 (0.0%) |
| 65 to 74 Years | 8 (4.5%) | 0 (0.0%) |
| 75 Years and over | 0 (0.0%) | 0 (0.0%) |
| Total | 89 (4.7%) | 82 (4.2%) |
Income Above Poverty by Sex and Age in Waikapu
According to the poverty statistics in Waikapu, males aged 5 years and females aged 5 years are the age groups that are most secure financially, with 100.0% of males and 100.0% of females in these age groups living above the poverty line.
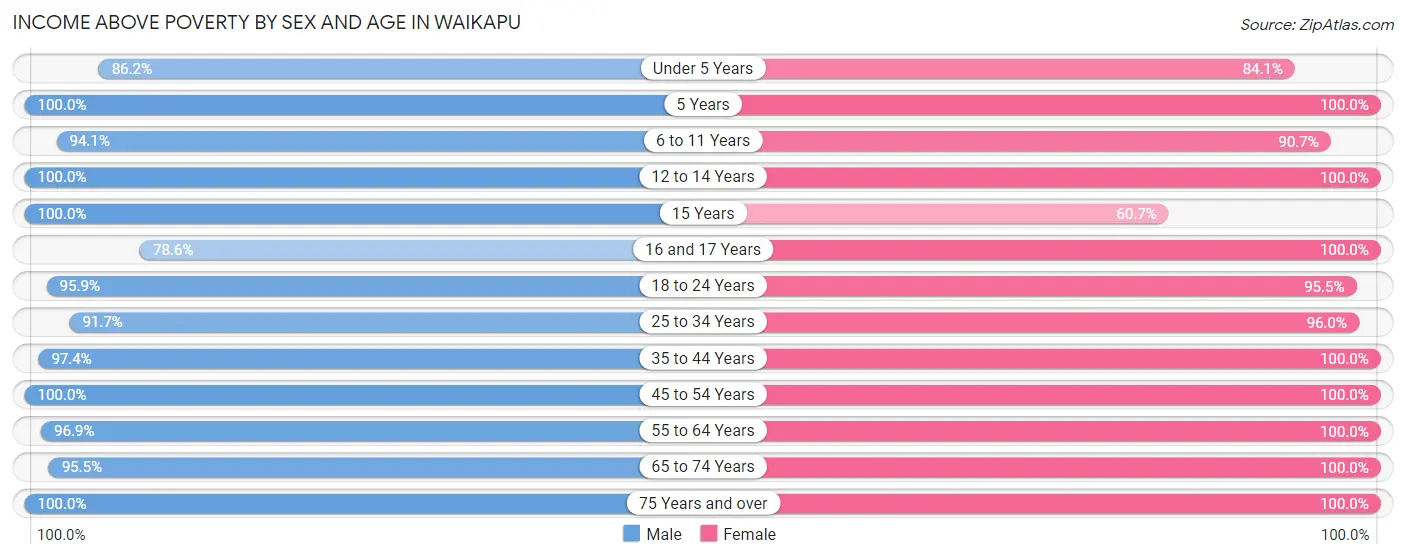
| Age Bracket | Male | Female |
| Under 5 Years | 119 (86.2%) | 111 (84.1%) |
| 5 Years | 71 (100.0%) | 73 (100.0%) |
| 6 to 11 Years | 238 (94.1%) | 166 (90.7%) |
| 12 to 14 Years | 74 (100.0%) | 58 (100.0%) |
| 15 Years | 57 (100.0%) | 37 (60.7%) |
| 16 and 17 Years | 33 (78.6%) | 37 (100.0%) |
| 18 to 24 Years | 117 (95.9%) | 169 (95.5%) |
| 25 to 34 Years | 231 (91.7%) | 285 (96.0%) |
| 35 to 44 Years | 227 (97.4%) | 367 (100.0%) |
| 45 to 54 Years | 242 (100.0%) | 253 (100.0%) |
| 55 to 64 Years | 190 (96.9%) | 137 (100.0%) |
| 65 to 74 Years | 170 (95.5%) | 91 (100.0%) |
| 75 Years and over | 52 (100.0%) | 105 (100.0%) |
| Total | 1,821 (95.3%) | 1,889 (95.8%) |
Income Below Poverty Among Married-Couple Families in Waikapu
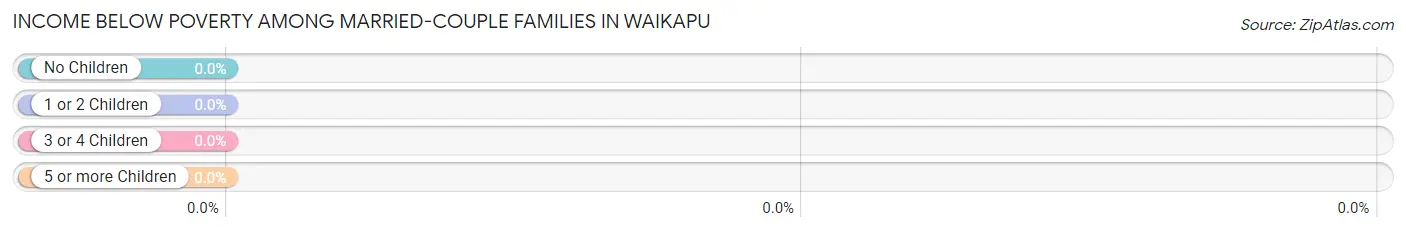
| Children | Above Poverty | Below Poverty |
| No Children | 289 (100.0%) | 0 (0.0%) |
| 1 or 2 Children | 313 (100.0%) | 0 (0.0%) |
| 3 or 4 Children | 86 (100.0%) | 0 (0.0%) |
| 5 or more Children | 6 (100.0%) | 0 (0.0%) |
| Total | 694 (100.0%) | 0 (0.0%) |
Income Below Poverty Among Single-Parent Households in Waikapu
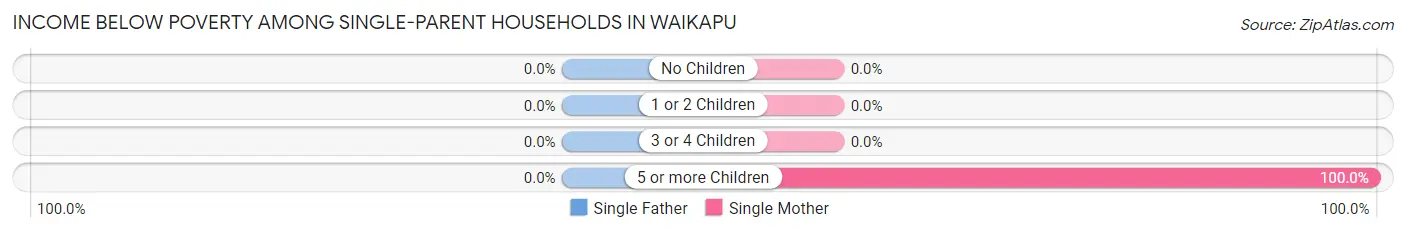
| Children | Single Father | Single Mother |
| No Children | 0 (0.0%) | 0 (0.0%) |
| 1 or 2 Children | 0 (0.0%) | 0 (0.0%) |
| 3 or 4 Children | 0 (0.0%) | 0 (0.0%) |
| 5 or more Children | 0 (0.0%) | 12 (100.0%) |
| Total | 0 (0.0%) | 12 (6.6%) |
Income Below Poverty Among Married-Couple vs Single-Parent Households in Waikapu
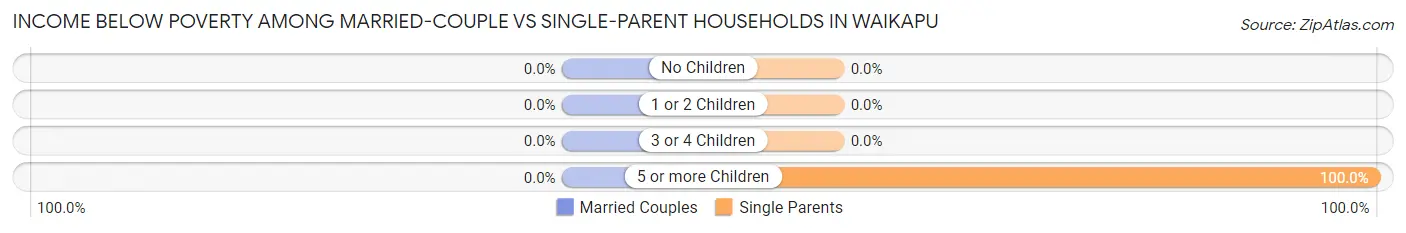
| Children | Married-Couple Families | Single-Parent Households |
| No Children | 0 (0.0%) | 0 (0.0%) |
| 1 or 2 Children | 0 (0.0%) | 0 (0.0%) |
| 3 or 4 Children | 0 (0.0%) | 0 (0.0%) |
| 5 or more Children | 0 (0.0%) | 12 (100.0%) |
| Total | 0 (0.0%) | 12 (5.0%) |
Race in Waikapu
The most populous races in Waikapu are Two or more Races (1,485 | 38.2%), Asian (1,102 | 28.3%), and White / Caucasian (1,053 | 27.1%).
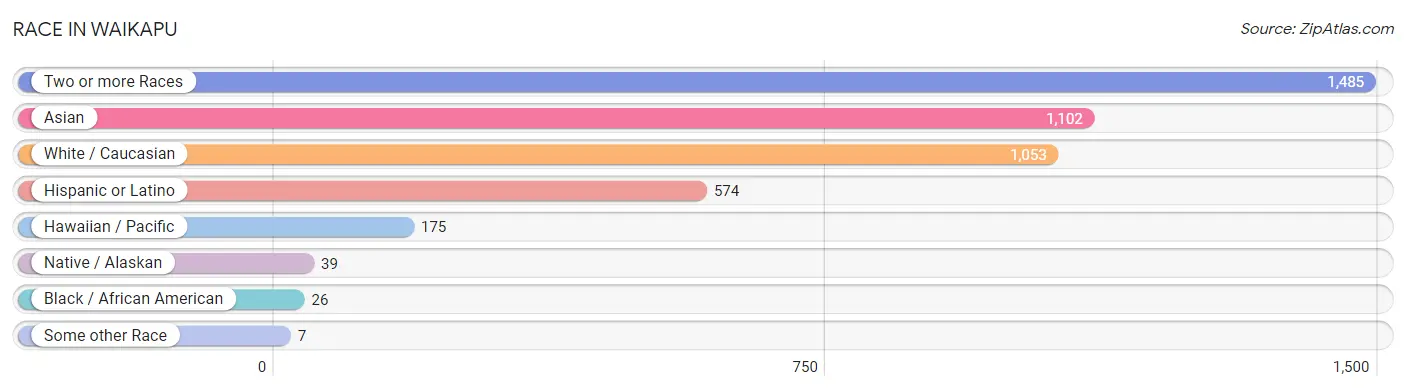
| Race | # Population | % Population |
| Asian | 1,102 | 28.3% |
| Black / African American | 26 | 0.7% |
| Hawaiian / Pacific | 175 | 4.5% |
| Hispanic or Latino | 574 | 14.8% |
| Native / Alaskan | 39 | 1.0% |
| White / Caucasian | 1,053 | 27.1% |
| Two or more Races | 1,485 | 38.2% |
| Some other Race | 7 | 0.2% |
| Total | 3,887 | 100.0% |
Ancestry in Waikapu
The most populous ancestries reported in Waikapu are Bhutanese (1,264 | 32.5%), Native Hawaiian (1,161 | 29.9%), Korean (1,132 | 29.1%), Indian (Asian) (627 | 16.1%), and Burmese (190 | 4.9%), together accounting for 112.5% of all Waikapu residents.
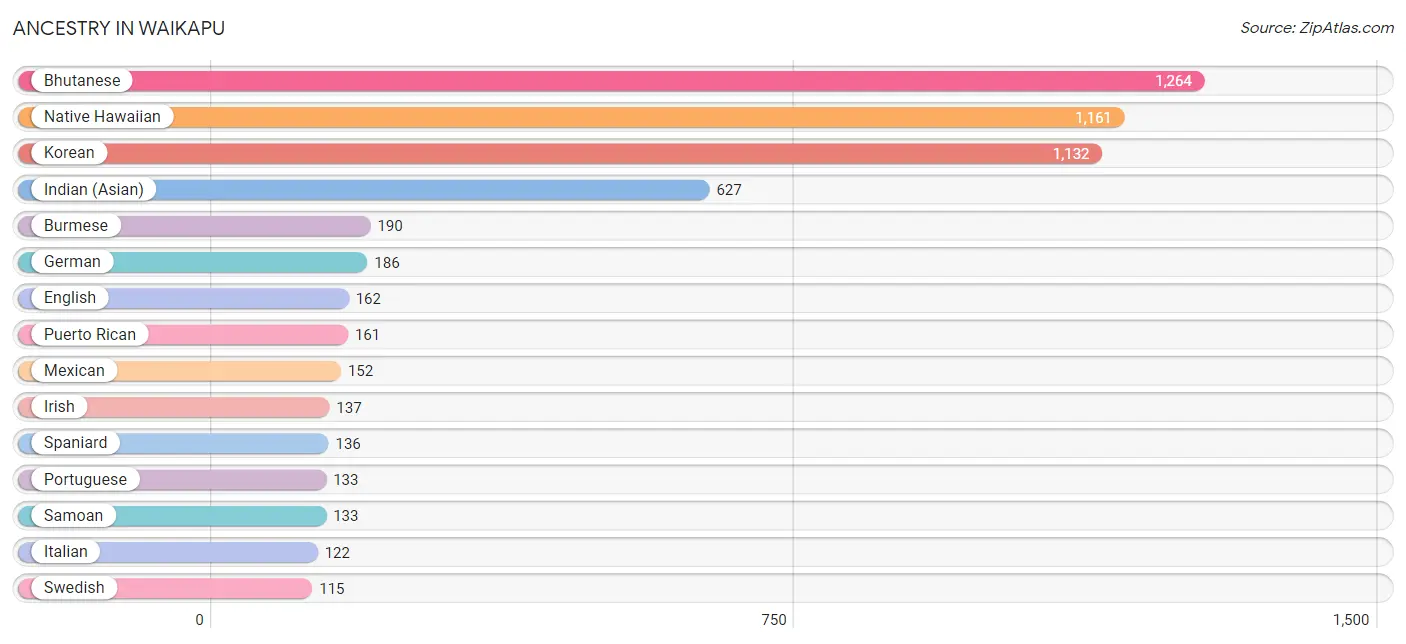
| Ancestry | # Population | % Population |
| African | 18 | 0.5% |
| Belgian | 22 | 0.6% |
| Bhutanese | 1,264 | 32.5% |
| British | 32 | 0.8% |
| Burmese | 190 | 4.9% |
| Canadian | 5 | 0.1% |
| Chinese | 8 | 0.2% |
| English | 162 | 4.2% |
| European | 5 | 0.1% |
| Filipino | 13 | 0.3% |
| Finnish | 15 | 0.4% |
| French | 34 | 0.9% |
| German | 186 | 4.8% |
| Hungarian | 15 | 0.4% |
| Indian (Asian) | 627 | 16.1% |
| Irish | 137 | 3.5% |
| Italian | 122 | 3.1% |
| Korean | 1,132 | 29.1% |
| Mexican | 152 | 3.9% |
| Native Hawaiian | 1,161 | 29.9% |
| Navajo | 39 | 1.0% |
| Norwegian | 30 | 0.8% |
| Pakistani | 6 | 0.2% |
| Portuguese | 133 | 3.4% |
| Puerto Rican | 161 | 4.1% |
| Romanian | 5 | 0.1% |
| Samoan | 133 | 3.4% |
| Scandinavian | 30 | 0.8% |
| Scottish | 19 | 0.5% |
| Spaniard | 136 | 3.5% |
| Spanish | 113 | 2.9% |
| Sri Lankan | 30 | 0.8% |
| Subsaharan African | 18 | 0.5% |
| Swedish | 115 | 3.0% |
| Welsh | 44 | 1.1% | View All 35 Rows |
Immigrants in Waikapu
The most numerous immigrant groups reported in Waikapu came from Asia (278 | 7.1%), South Eastern Asia (253 | 6.5%), Philippines (217 | 5.6%), Europe (34 | 0.9%), and Eastern Asia (25 | 0.6%), together accounting for 20.7% of all Waikapu residents.
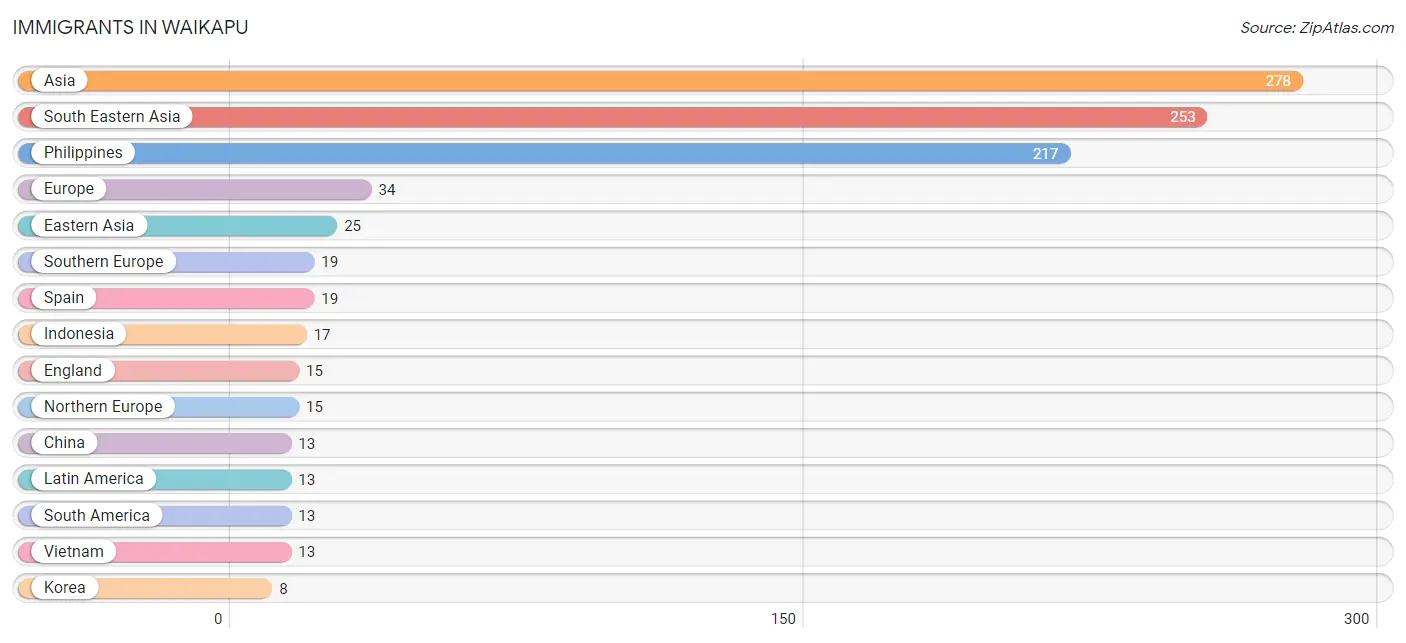
| Immigration Origin | # Population | % Population |
| Asia | 278 | 7.1% |
| Brazil | 7 | 0.2% |
| Canada | 5 | 0.1% |
| China | 13 | 0.3% |
| Colombia | 6 | 0.2% |
| Eastern Asia | 25 | 0.6% |
| England | 15 | 0.4% |
| Europe | 34 | 0.9% |
| Indonesia | 17 | 0.4% |
| Japan | 4 | 0.1% |
| Korea | 8 | 0.2% |
| Latin America | 13 | 0.3% |
| Northern Europe | 15 | 0.4% |
| Philippines | 217 | 5.6% |
| South America | 13 | 0.3% |
| South Eastern Asia | 253 | 6.5% |
| Southern Europe | 19 | 0.5% |
| Spain | 19 | 0.5% |
| Taiwan | 6 | 0.2% |
| Thailand | 6 | 0.2% |
| Vietnam | 13 | 0.3% | View All 21 Rows |
Sex and Age in Waikapu
Sex and Age in Waikapu
The most populous age groups in Waikapu are 5 to 9 Years (293 | 15.3%) for men and 35 to 39 Years (255 | 12.9%) for women.
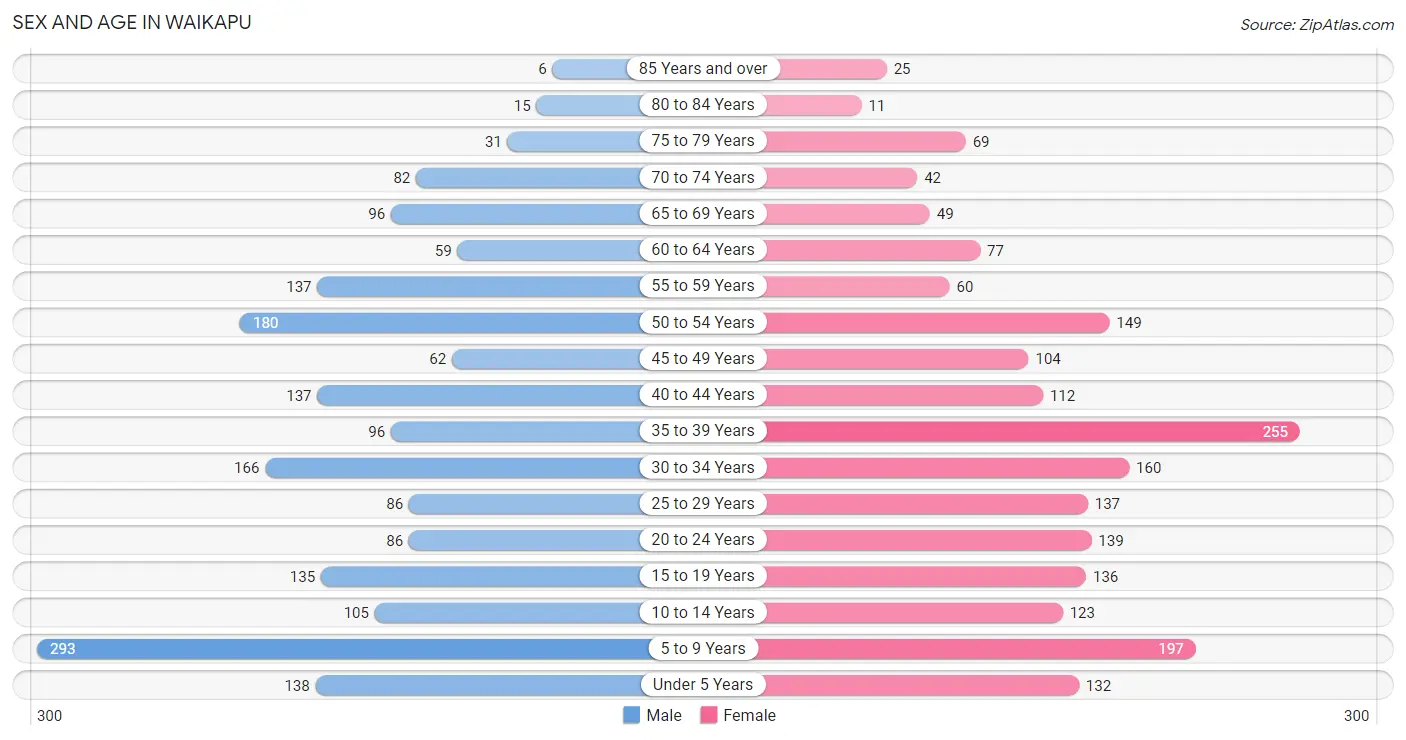
| Age Bracket | Male | Female |
| Under 5 Years | 138 (7.2%) | 132 (6.7%) |
| 5 to 9 Years | 293 (15.3%) | 197 (10.0%) |
| 10 to 14 Years | 105 (5.5%) | 123 (6.2%) |
| 15 to 19 Years | 135 (7.1%) | 136 (6.9%) |
| 20 to 24 Years | 86 (4.5%) | 139 (7.0%) |
| 25 to 29 Years | 86 (4.5%) | 137 (6.9%) |
| 30 to 34 Years | 166 (8.7%) | 160 (8.1%) |
| 35 to 39 Years | 96 (5.0%) | 255 (12.9%) |
| 40 to 44 Years | 137 (7.2%) | 112 (5.7%) |
| 45 to 49 Years | 62 (3.3%) | 104 (5.3%) |
| 50 to 54 Years | 180 (9.4%) | 149 (7.5%) |
| 55 to 59 Years | 137 (7.2%) | 60 (3.0%) |
| 60 to 64 Years | 59 (3.1%) | 77 (3.9%) |
| 65 to 69 Years | 96 (5.0%) | 49 (2.5%) |
| 70 to 74 Years | 82 (4.3%) | 42 (2.1%) |
| 75 to 79 Years | 31 (1.6%) | 69 (3.5%) |
| 80 to 84 Years | 15 (0.8%) | 11 (0.6%) |
| 85 Years and over | 6 (0.3%) | 25 (1.3%) |
| Total | 1,910 (100.0%) | 1,977 (100.0%) |
Families and Households in Waikapu
Median Family Size in Waikapu
The median family size in Waikapu is 3.73 persons per family, with single female/mother families (181 | 19.4%) accounting for the largest median family size of 3.86 persons per family. On the other hand, single male/father families (57 | 6.1%) represent the smallest median family size with 2.96 persons per family.
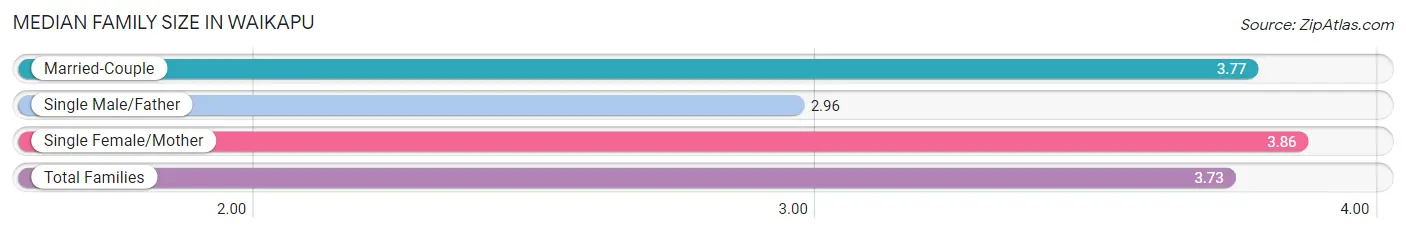
| Family Type | # Families | Family Size |
| Married-Couple | 694 (74.5%) | 3.77 |
| Single Male/Father | 57 (6.1%) | 2.96 |
| Single Female/Mother | 181 (19.4%) | 3.86 |
| Total Families | 932 (100.0%) | 3.73 |
Median Household Size in Waikapu
The median household size in Waikapu is 3.50 persons per household, with single female/mother households (181 | 16.3%) accounting for the largest median household size of 4.39 persons per household. non-family households (180 | 16.2%) represent the smallest median household size with 1.38 persons per household.
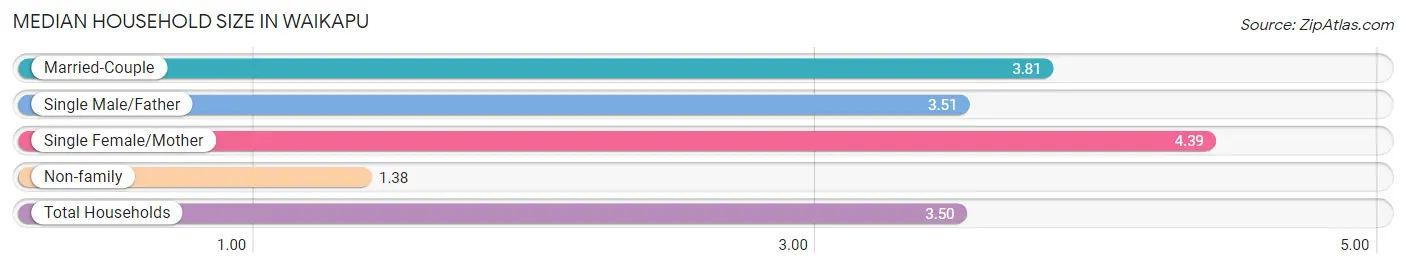
| Household Type | # Households | Household Size |
| Married-Couple | 694 (62.4%) | 3.81 |
| Single Male/Father | 57 (5.1%) | 3.51 |
| Single Female/Mother | 181 (16.3%) | 4.39 |
| Non-family | 180 (16.2%) | 1.38 |
| Total Households | 1,112 (100.0%) | 3.50 |
Household Size by Marriage Status in Waikapu
Out of a total of 1,112 households in Waikapu, 932 (83.8%) are family households, while 180 (16.2%) are nonfamily households. The most numerous type of family households are 2-person households, comprising 254, and the most common type of nonfamily households are 1-person households, comprising 131.
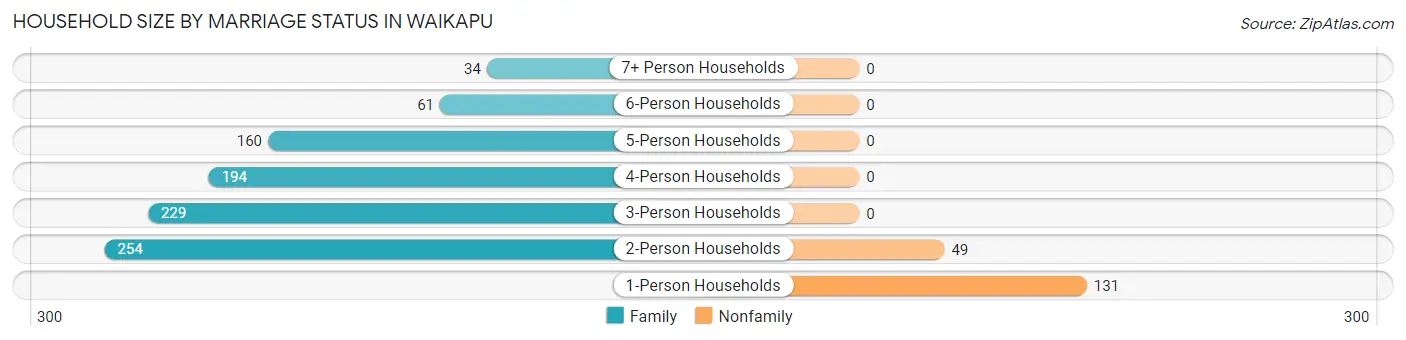
| Household Size | Family Households | Nonfamily Households |
| 1-Person Households | - | 131 (11.8%) |
| 2-Person Households | 254 (22.8%) | 49 (4.4%) |
| 3-Person Households | 229 (20.6%) | 0 (0.0%) |
| 4-Person Households | 194 (17.4%) | 0 (0.0%) |
| 5-Person Households | 160 (14.4%) | 0 (0.0%) |
| 6-Person Households | 61 (5.5%) | 0 (0.0%) |
| 7+ Person Households | 34 (3.1%) | 0 (0.0%) |
| Total | 932 (83.8%) | 180 (16.2%) |
Female Fertility in Waikapu
Fertility by Age in Waikapu
Average fertility rate in Waikapu is 73.0 births per 1,000 women. Women in the age bracket of 20 to 34 years have the highest fertility rate with 140.0 births per 1,000 women. Women in the age bracket of 20 to 34 years acount for 78.2% of all women with births.
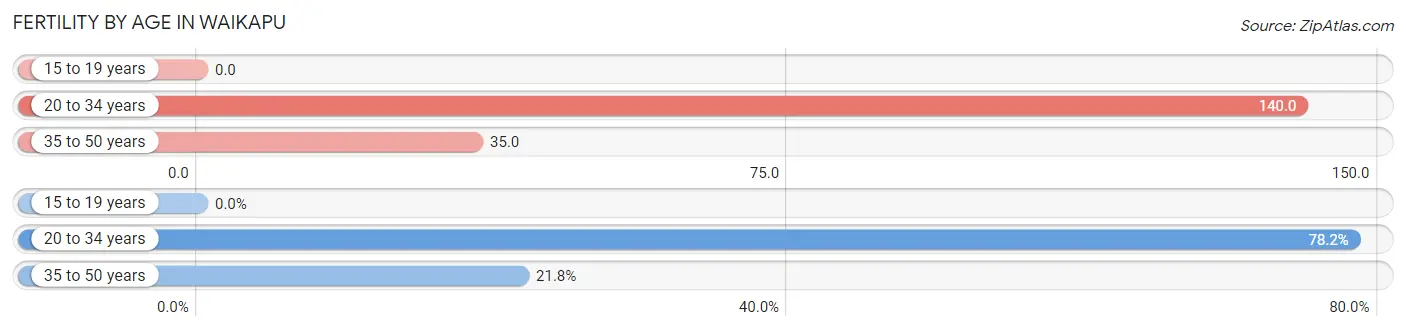
| Age Bracket | Women with Births | Births / 1,000 Women |
| 15 to 19 years | 0 (0.0%) | 0.0 |
| 20 to 34 years | 61 (78.2%) | 140.0 |
| 35 to 50 years | 17 (21.8%) | 35.0 |
| Total | 78 (100.0%) | 73.0 |
Fertility by Age by Marriage Status in Waikapu
19.2% of women with births (78) in Waikapu are married. The highest percentage of unmarried women with births falls into 20 to 34 years age bracket with 93.4% of them unmarried at the time of birth, while the lowest percentage of unmarried women with births belong to 35 to 50 years age bracket with 35.3% of them unmarried.
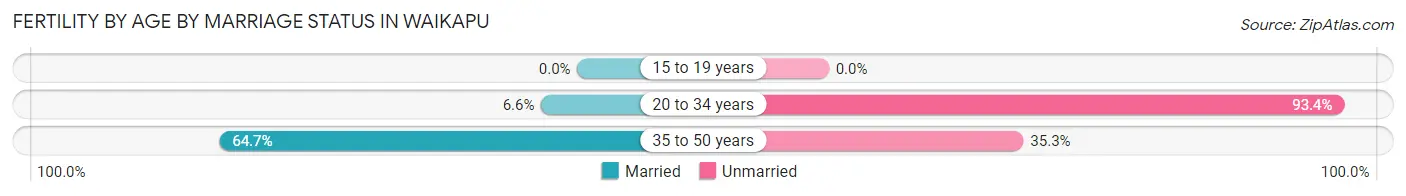
| Age Bracket | Married | Unmarried |
| 15 to 19 years | 0 (0.0%) | 0 (0.0%) |
| 20 to 34 years | 4 (6.6%) | 57 (93.4%) |
| 35 to 50 years | 11 (64.7%) | 6 (35.3%) |
| Total | 15 (19.2%) | 63 (80.8%) |
Fertility by Education in Waikapu
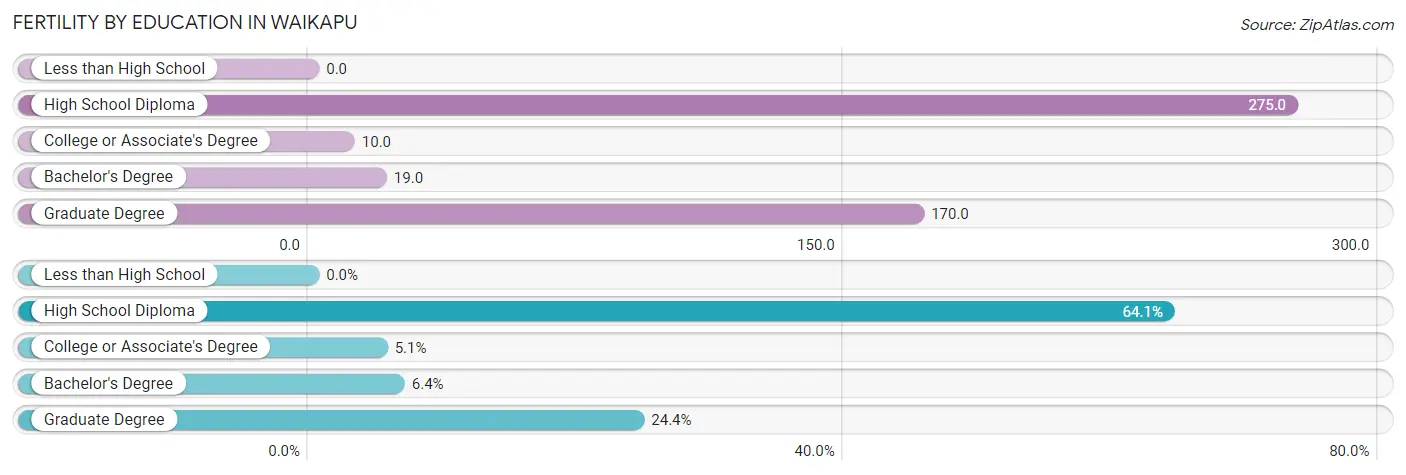
| Educational Attainment | Women with Births | Births / 1,000 Women |
| Less than High School | 0 (0.0%) | 0.0 |
| High School Diploma | 50 (64.1%) | 275.0 |
| College or Associate's Degree | 4 (5.1%) | 10.0 |
| Bachelor's Degree | 5 (6.4%) | 19.0 |
| Graduate Degree | 19 (24.4%) | 170.0 |
| Total | 78 (100.0%) | 73.0 |
Fertility by Education by Marriage Status in Waikapu
80.8% of women with births in Waikapu are unmarried. Women with the educational attainment of college or associate's degree are most likely to be married with 100.0% of them married at childbirth, while women with the educational attainment of graduate degree are least likely to be married with 100.0% of them unmarried at childbirth.
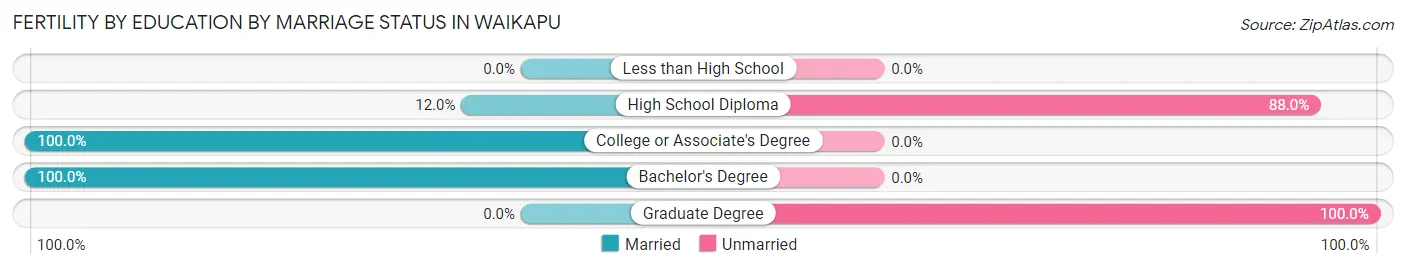
| Educational Attainment | Married | Unmarried |
| Less than High School | 0 (0.0%) | 0 (0.0%) |
| High School Diploma | 6 (12.0%) | 44 (88.0%) |
| College or Associate's Degree | 4 (100.0%) | 0 (0.0%) |
| Bachelor's Degree | 5 (100.0%) | 0 (0.0%) |
| Graduate Degree | 0 (0.0%) | 19 (100.0%) |
| Total | 15 (19.2%) | 63 (80.8%) |
Employment Characteristics in Waikapu
Employment by Class of Employer in Waikapu
Among the 1,952 employed individuals in Waikapu, private company employees (1,204 | 61.7%), local government employees (205 | 10.5%), and state government employees (180 | 9.2%) make up the most common classes of employment.
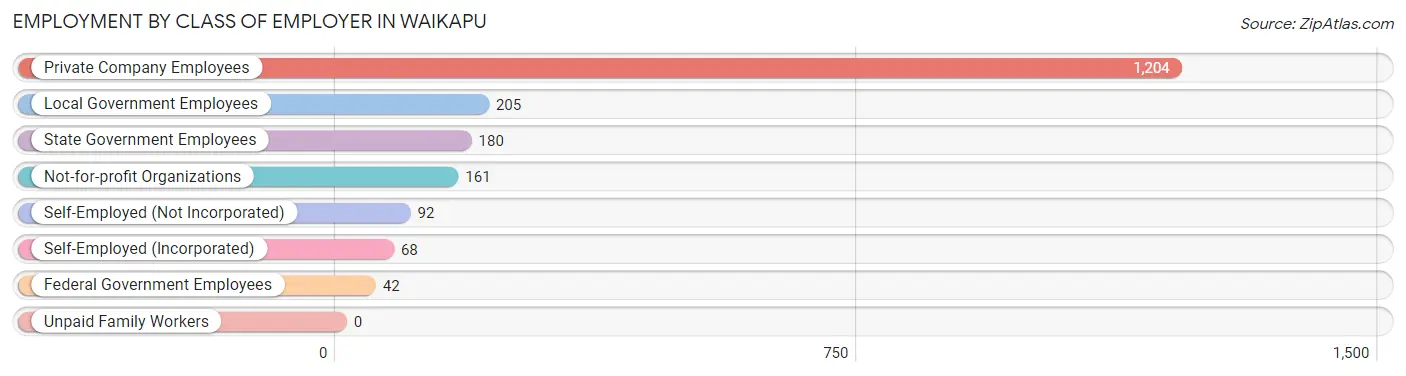
| Employer Class | # Employees | % Employees |
| Private Company Employees | 1,204 | 61.7% |
| Self-Employed (Incorporated) | 68 | 3.5% |
| Self-Employed (Not Incorporated) | 92 | 4.7% |
| Not-for-profit Organizations | 161 | 8.3% |
| Local Government Employees | 205 | 10.5% |
| State Government Employees | 180 | 9.2% |
| Federal Government Employees | 42 | 2.1% |
| Unpaid Family Workers | 0 | 0.0% |
| Total | 1,952 | 100.0% |
Employment Status by Age in Waikapu
According to the labor force statistics for Waikapu, out of the total population over 16 years of age (2,781), 73.6% or 2,047 individuals are in the labor force, with 2.6% or 53 of them unemployed. The age group with the highest labor force participation rate is 20 to 24 years, with 96.4% or 217 individuals in the labor force. Within the labor force, the 55 to 59 years age range has the highest percentage of unemployed individuals, with 13.5% or 20 of them being unemployed.
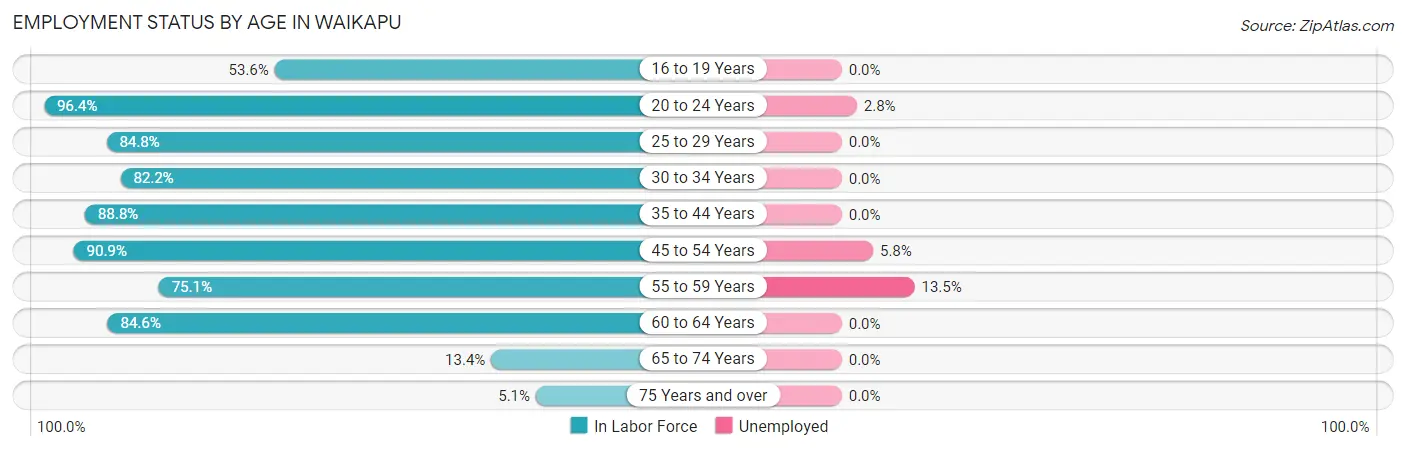
| Age Bracket | In Labor Force | Unemployed |
| 16 to 19 Years | 82 (53.6%) | 0 (0.0%) |
| 20 to 24 Years | 217 (96.4%) | 6 (2.8%) |
| 25 to 29 Years | 189 (84.8%) | 0 (0.0%) |
| 30 to 34 Years | 268 (82.2%) | 0 (0.0%) |
| 35 to 44 Years | 533 (88.8%) | 0 (0.0%) |
| 45 to 54 Years | 450 (90.9%) | 26 (5.8%) |
| 55 to 59 Years | 148 (75.1%) | 20 (13.5%) |
| 60 to 64 Years | 115 (84.6%) | 0 (0.0%) |
| 65 to 74 Years | 36 (13.4%) | 0 (0.0%) |
| 75 Years and over | 8 (5.1%) | 0 (0.0%) |
| Total | 2,047 (73.6%) | 53 (2.6%) |
Employment Status by Educational Attainment in Waikapu
According to labor force statistics for Waikapu, 86.1% of individuals (1,702) out of the total population between 25 and 64 years of age (1,977) are in the labor force, with 2.7% or 46 of them being unemployed. The group with the highest labor force participation rate are those with the educational attainment of bachelor's degree or higher, with 90.2% or 678 individuals in the labor force. Within the labor force, individuals with college / associate degree education have the highest percentage of unemployment, with 7.4% or 46 of them being unemployed.
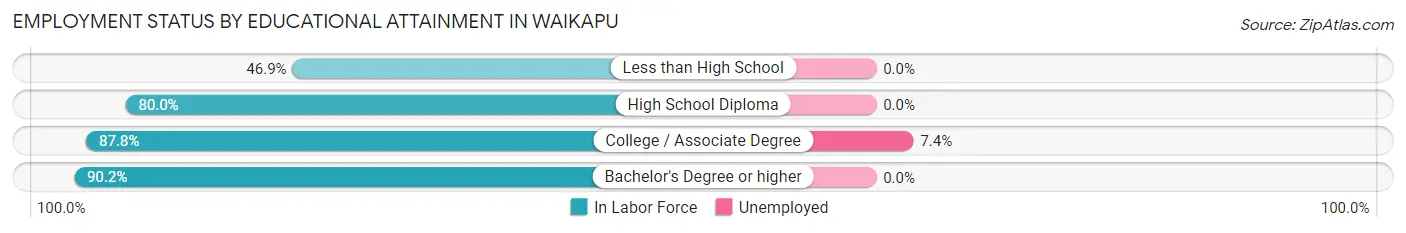
| Educational Attainment | In Labor Force | Unemployed |
| Less than High School | 15 (46.9%) | 0 (0.0%) |
| High School Diploma | 384 (80.0%) | 0 (0.0%) |
| College / Associate Degree | 626 (87.8%) | 53 (7.4%) |
| Bachelor's Degree or higher | 678 (90.2%) | 0 (0.0%) |
| Total | 1,702 (86.1%) | 53 (2.7%) |
Employment Occupations by Sex in Waikapu
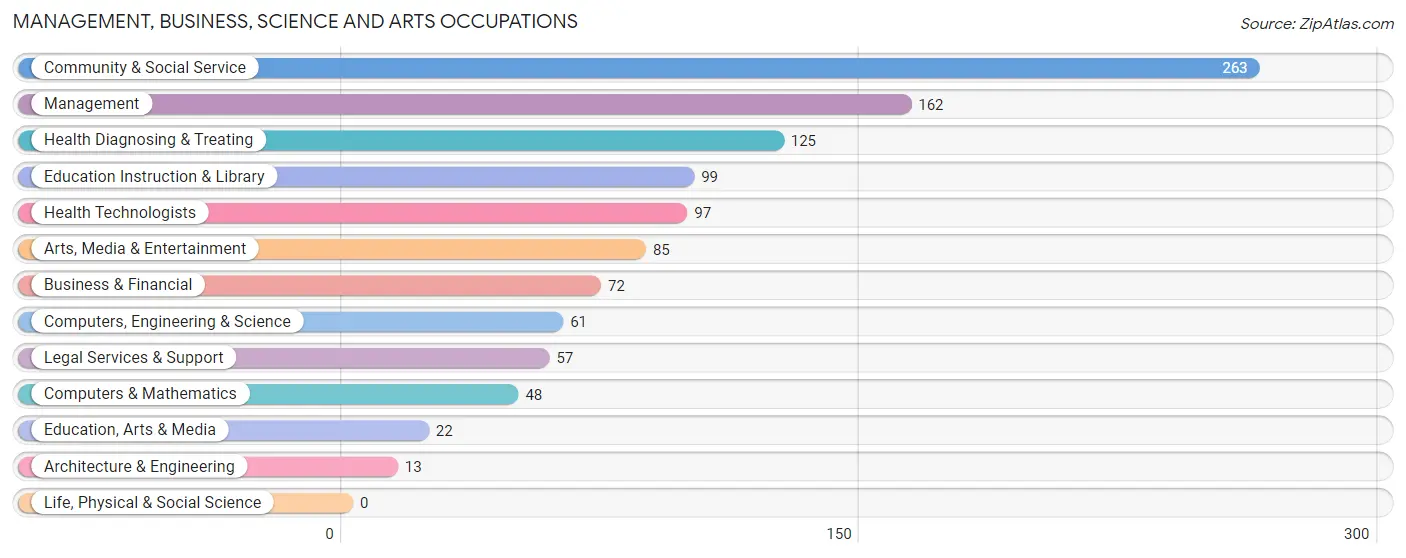
Management, Business, Science and Arts Occupations
The most common Management, Business, Science and Arts occupations in Waikapu are Community & Social Service (263 | 13.3%), Management (162 | 8.2%), Health Diagnosing & Treating (125 | 6.3%), Education Instruction & Library (99 | 5.0%), and Health Technologists (97 | 4.9%).
Management, Business, Science and Arts Occupations by Sex
Within the Management, Business, Science and Arts occupations in Waikapu, the most male-oriented occupations are Architecture & Engineering (100.0%), Computers, Engineering & Science (95.1%), and Computers & Mathematics (93.8%), while the most female-oriented occupations are Legal Services & Support (100.0%), Health Diagnosing & Treating (96.8%), and Health Technologists (95.9%).
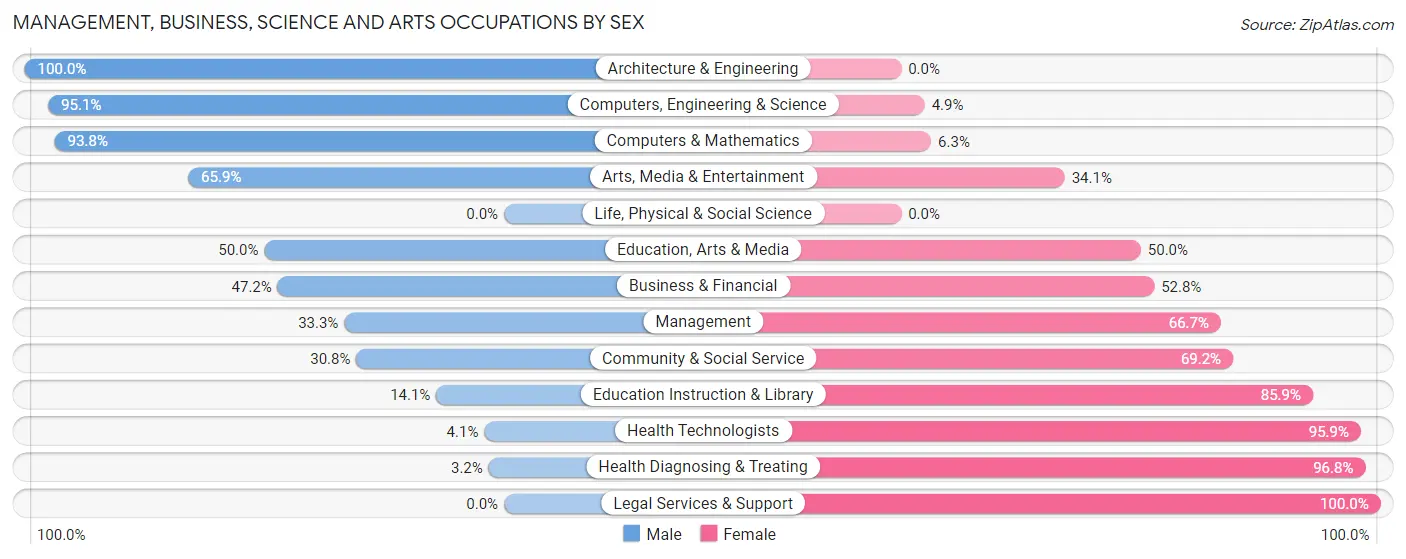
| Occupation | Male | Female |
| Management | 54 (33.3%) | 108 (66.7%) |
| Business & Financial | 34 (47.2%) | 38 (52.8%) |
| Computers, Engineering & Science | 58 (95.1%) | 3 (4.9%) |
| Computers & Mathematics | 45 (93.8%) | 3 (6.2%) |
| Architecture & Engineering | 13 (100.0%) | 0 (0.0%) |
| Life, Physical & Social Science | 0 (0.0%) | 0 (0.0%) |
| Community & Social Service | 81 (30.8%) | 182 (69.2%) |
| Education, Arts & Media | 11 (50.0%) | 11 (50.0%) |
| Legal Services & Support | 0 (0.0%) | 57 (100.0%) |
| Education Instruction & Library | 14 (14.1%) | 85 (85.9%) |
| Arts, Media & Entertainment | 56 (65.9%) | 29 (34.1%) |
| Health Diagnosing & Treating | 4 (3.2%) | 121 (96.8%) |
| Health Technologists | 4 (4.1%) | 93 (95.9%) |
| Total (Category) | 231 (33.8%) | 452 (66.2%) |
| Total (Overall) | 895 (45.3%) | 1,080 (54.7%) |
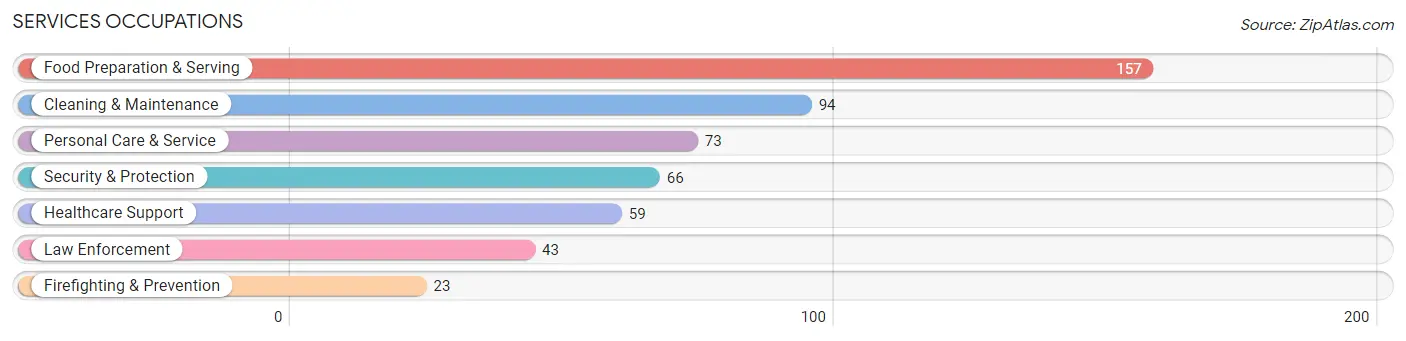
Services Occupations
The most common Services occupations in Waikapu are Food Preparation & Serving (157 | 8.0%), Cleaning & Maintenance (94 | 4.8%), Personal Care & Service (73 | 3.7%), Security & Protection (66 | 3.3%), and Healthcare Support (59 | 3.0%).
Services Occupations by Sex
Within the Services occupations in Waikapu, the most male-oriented occupations are Firefighting & Prevention (100.0%), Security & Protection (95.5%), and Law Enforcement (93.0%), while the most female-oriented occupations are Healthcare Support (100.0%), Food Preparation & Serving (76.4%), and Personal Care & Service (72.6%).
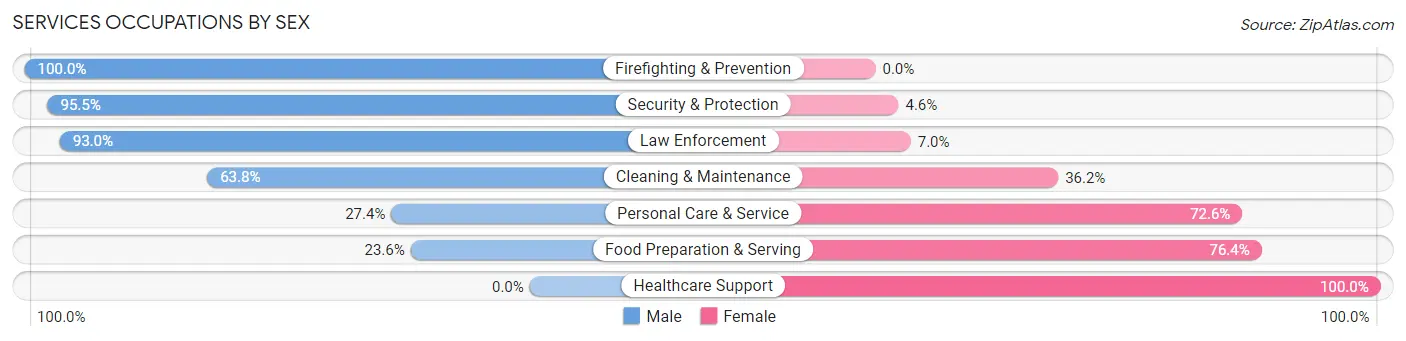
| Occupation | Male | Female |
| Healthcare Support | 0 (0.0%) | 59 (100.0%) |
| Security & Protection | 63 (95.5%) | 3 (4.5%) |
| Firefighting & Prevention | 23 (100.0%) | 0 (0.0%) |
| Law Enforcement | 40 (93.0%) | 3 (7.0%) |
| Food Preparation & Serving | 37 (23.6%) | 120 (76.4%) |
| Cleaning & Maintenance | 60 (63.8%) | 34 (36.2%) |
| Personal Care & Service | 20 (27.4%) | 53 (72.6%) |
| Total (Category) | 180 (40.1%) | 269 (59.9%) |
| Total (Overall) | 895 (45.3%) | 1,080 (54.7%) |
Sales and Office Occupations
The most common Sales and Office occupations in Waikapu are Office & Administration (301 | 15.2%), and Sales & Related (190 | 9.6%).
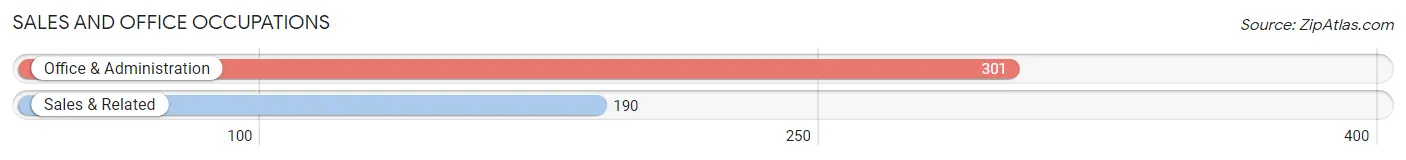
Sales and Office Occupations by Sex
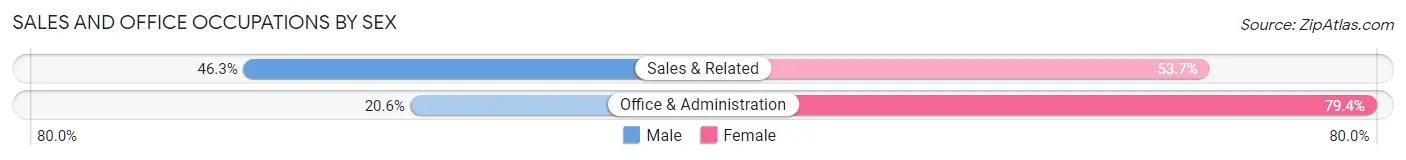
| Occupation | Male | Female |
| Sales & Related | 88 (46.3%) | 102 (53.7%) |
| Office & Administration | 62 (20.6%) | 239 (79.4%) |
| Total (Category) | 150 (30.5%) | 341 (69.5%) |
| Total (Overall) | 895 (45.3%) | 1,080 (54.7%) |
Natural Resources, Construction and Maintenance Occupations
The most common Natural Resources, Construction and Maintenance occupations in Waikapu are Construction & Extraction (156 | 7.9%), and Installation, Maintenance & Repair (55 | 2.8%).
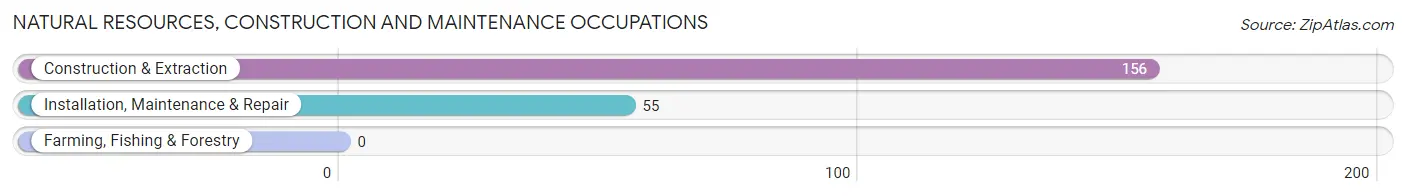
Natural Resources, Construction and Maintenance Occupations by Sex
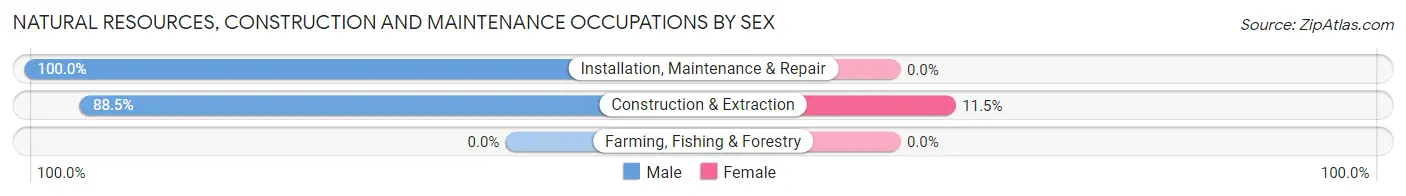
| Occupation | Male | Female |
| Farming, Fishing & Forestry | 0 (0.0%) | 0 (0.0%) |
| Construction & Extraction | 138 (88.5%) | 18 (11.5%) |
| Installation, Maintenance & Repair | 55 (100.0%) | 0 (0.0%) |
| Total (Category) | 193 (91.5%) | 18 (8.5%) |
| Total (Overall) | 895 (45.3%) | 1,080 (54.7%) |
Production, Transportation and Moving Occupations
The most common Production, Transportation and Moving occupations in Waikapu are Material Moving (80 | 4.1%), Transportation (47 | 2.4%), and Production (14 | 0.7%).
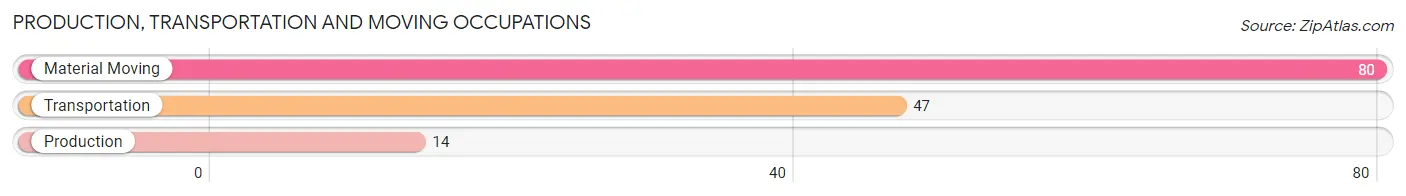
Production, Transportation and Moving Occupations by Sex
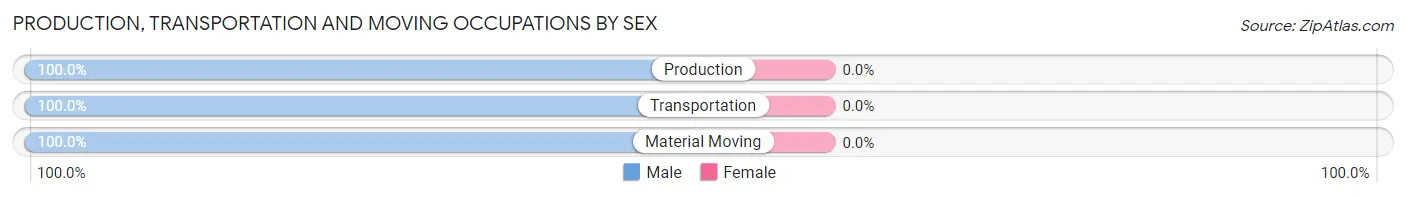
| Occupation | Male | Female |
| Production | 14 (100.0%) | 0 (0.0%) |
| Transportation | 47 (100.0%) | 0 (0.0%) |
| Material Moving | 80 (100.0%) | 0 (0.0%) |
| Total (Category) | 141 (100.0%) | 0 (0.0%) |
| Total (Overall) | 895 (45.3%) | 1,080 (54.7%) |
Employment Industries by Sex in Waikapu
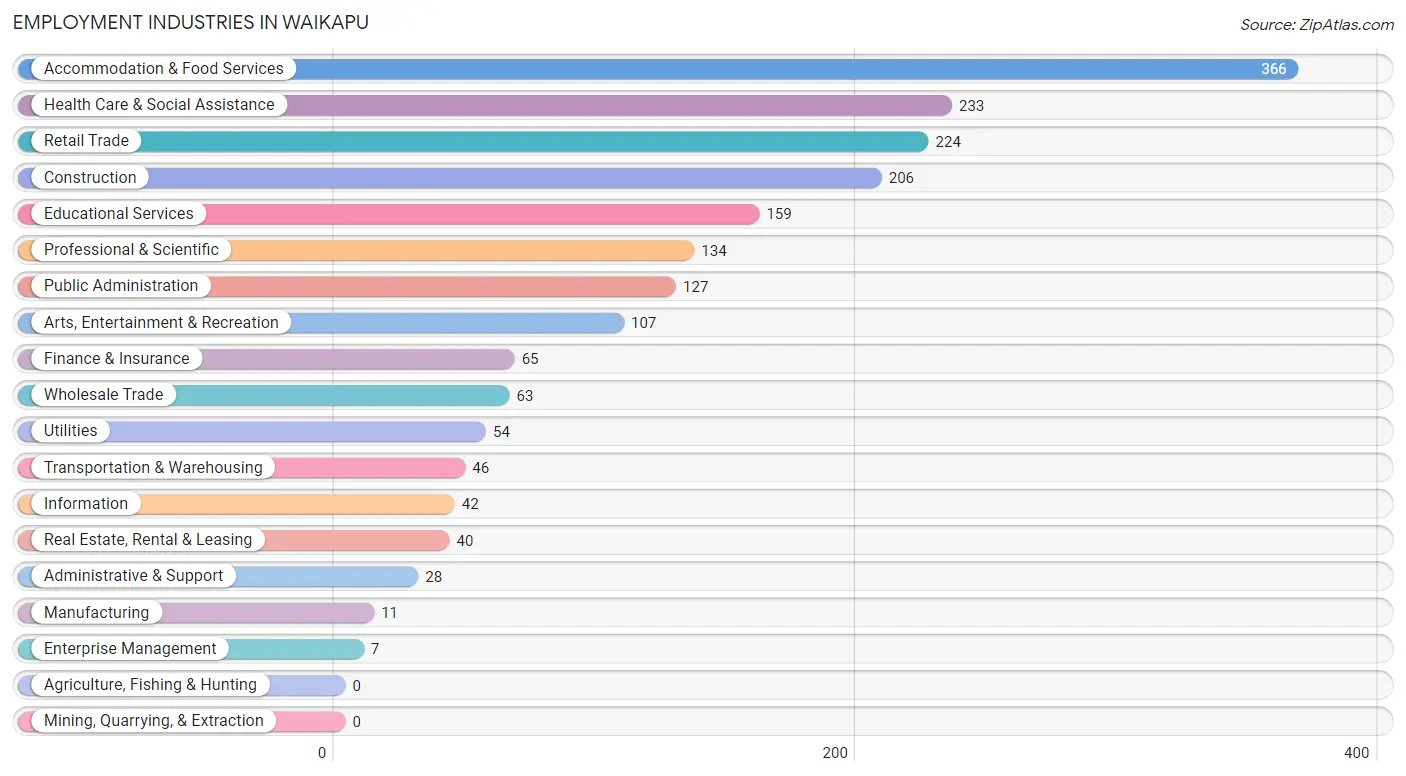
Employment Industries in Waikapu
The major employment industries in Waikapu include Accommodation & Food Services (366 | 18.5%), Health Care & Social Assistance (233 | 11.8%), Retail Trade (224 | 11.3%), Construction (206 | 10.4%), and Educational Services (159 | 8.1%).
Employment Industries by Sex in Waikapu
The Waikapu industries that see more men than women are Manufacturing (100.0%), Administrative & Support (100.0%), and Transportation & Warehousing (89.1%), whereas the industries that tend to have a higher number of women are Enterprise Management (100.0%), Health Care & Social Assistance (96.6%), and Real Estate, Rental & Leasing (85.0%).
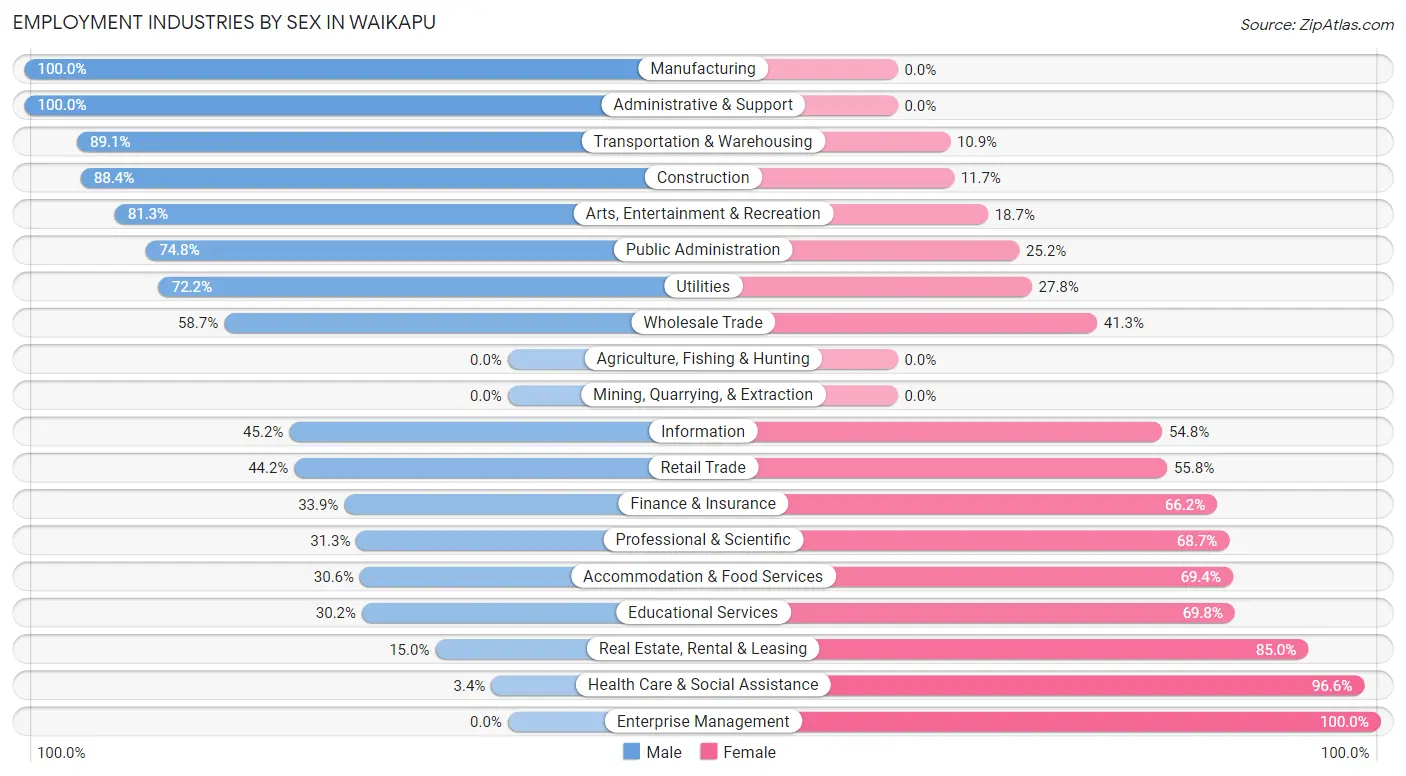
| Industry | Male | Female |
| Agriculture, Fishing & Hunting | 0 (0.0%) | 0 (0.0%) |
| Mining, Quarrying, & Extraction | 0 (0.0%) | 0 (0.0%) |
| Construction | 182 (88.3%) | 24 (11.7%) |
| Manufacturing | 11 (100.0%) | 0 (0.0%) |
| Wholesale Trade | 37 (58.7%) | 26 (41.3%) |
| Retail Trade | 99 (44.2%) | 125 (55.8%) |
| Transportation & Warehousing | 41 (89.1%) | 5 (10.9%) |
| Utilities | 39 (72.2%) | 15 (27.8%) |
| Information | 19 (45.2%) | 23 (54.8%) |
| Finance & Insurance | 22 (33.9%) | 43 (66.1%) |
| Real Estate, Rental & Leasing | 6 (15.0%) | 34 (85.0%) |
| Professional & Scientific | 42 (31.3%) | 92 (68.7%) |
| Enterprise Management | 0 (0.0%) | 7 (100.0%) |
| Administrative & Support | 28 (100.0%) | 0 (0.0%) |
| Educational Services | 48 (30.2%) | 111 (69.8%) |
| Health Care & Social Assistance | 8 (3.4%) | 225 (96.6%) |
| Arts, Entertainment & Recreation | 87 (81.3%) | 20 (18.7%) |
| Accommodation & Food Services | 112 (30.6%) | 254 (69.4%) |
| Public Administration | 95 (74.8%) | 32 (25.2%) |
| Total | 895 (45.3%) | 1,080 (54.7%) |
Education in Waikapu
School Enrollment in Waikapu
The most common levels of schooling among the 1,112 students in Waikapu are elementary school (284 | 25.5%), high school (233 | 20.9%), and middle school (203 | 18.3%).
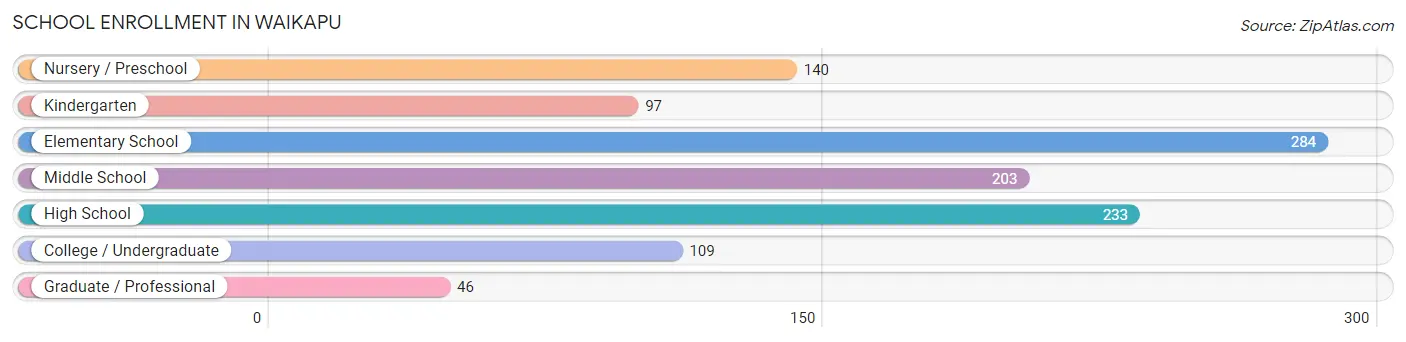
| School Level | # Students | % Students |
| Nursery / Preschool | 140 | 12.6% |
| Kindergarten | 97 | 8.7% |
| Elementary School | 284 | 25.5% |
| Middle School | 203 | 18.3% |
| High School | 233 | 20.9% |
| College / Undergraduate | 109 | 9.8% |
| Graduate / Professional | 46 | 4.1% |
| Total | 1,112 | 100.0% |
School Enrollment by Age by Funding Source in Waikapu
Out of a total of 1,112 students who are enrolled in schools in Waikapu, 297 (26.7%) attend a private institution, while the remaining 815 (73.3%) are enrolled in public schools. The age group of 3 to 4 year olds has the highest likelihood of being enrolled in private schools, with 56 (72.7% in the age bracket) enrolled. Conversely, the age group of 25 to 34 year olds has the lowest likelihood of being enrolled in a private school, with 64 (100.0% in the age bracket) attending a public institution.
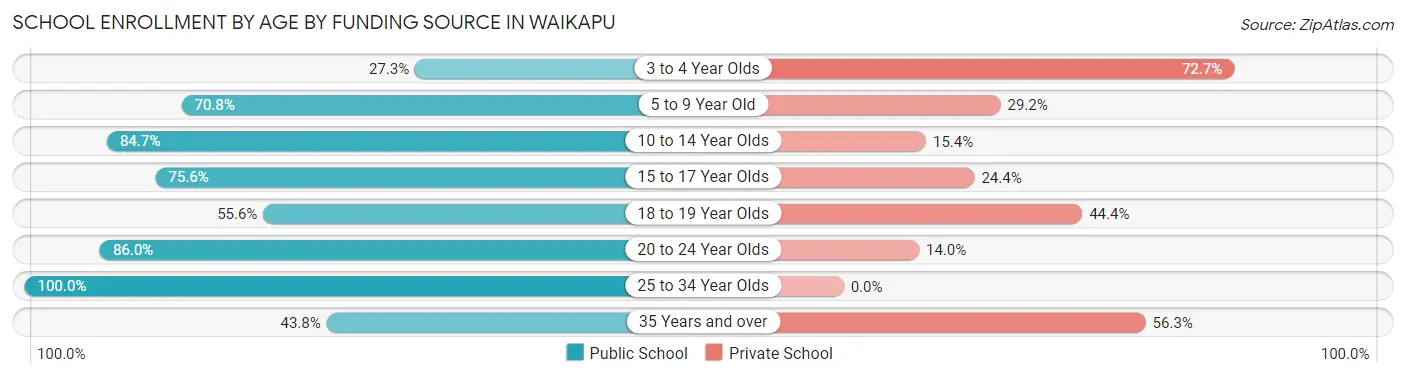
| Age Bracket | Public School | Private School |
| 3 to 4 Year Olds | 21 (27.3%) | 56 (72.7%) |
| 5 to 9 Year Old | 322 (70.8%) | 133 (29.2%) |
| 10 to 14 Year Olds | 193 (84.7%) | 35 (15.3%) |
| 15 to 17 Year Olds | 149 (75.6%) | 48 (24.4%) |
| 18 to 19 Year Olds | 10 (55.6%) | 8 (44.4%) |
| 20 to 24 Year Olds | 49 (86.0%) | 8 (14.0%) |
| 25 to 34 Year Olds | 64 (100.0%) | 0 (0.0%) |
| 35 Years and over | 7 (43.8%) | 9 (56.2%) |
| Total | 815 (73.3%) | 297 (26.7%) |
Educational Attainment by Field of Study in Waikapu
Business (203 | 22.1%), psychology (116 | 12.6%), social sciences (115 | 12.5%), education (103 | 11.2%), and physical & health sciences (82 | 8.9%) are the most common fields of study among 920 individuals in Waikapu who have obtained a bachelor's degree or higher.
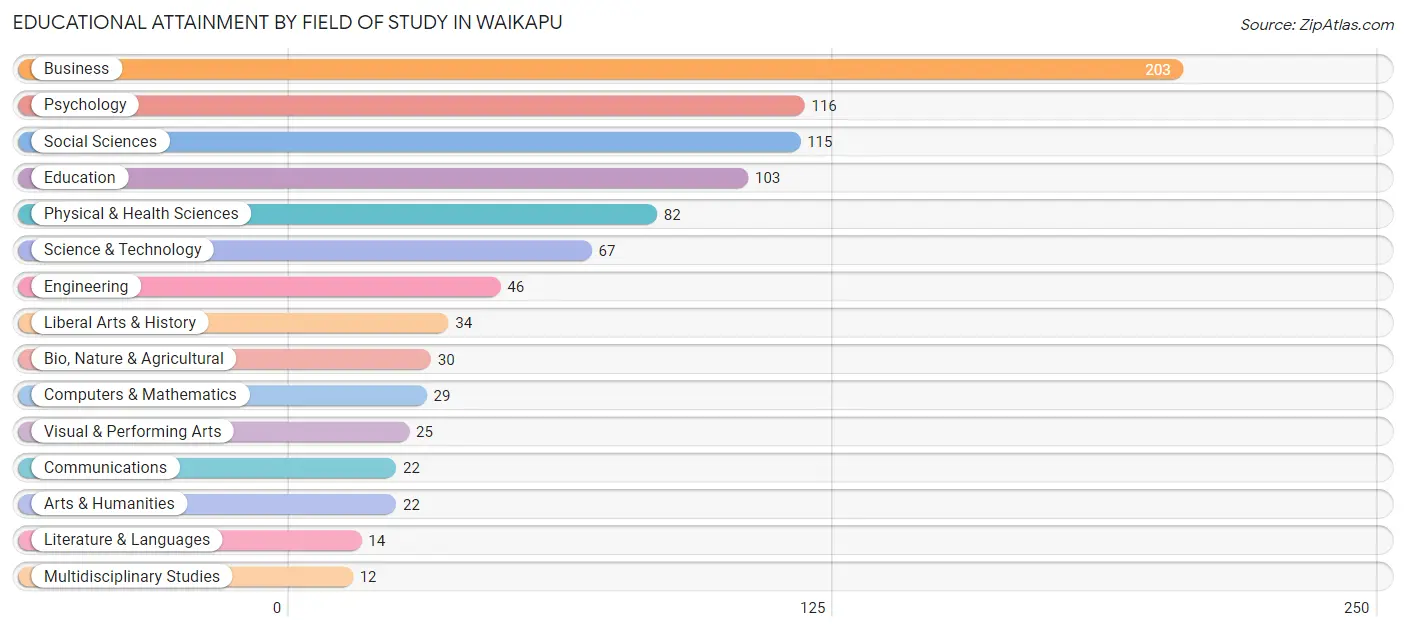
| Field of Study | # Graduates | % Graduates |
| Computers & Mathematics | 29 | 3.2% |
| Bio, Nature & Agricultural | 30 | 3.3% |
| Physical & Health Sciences | 82 | 8.9% |
| Psychology | 116 | 12.6% |
| Social Sciences | 115 | 12.5% |
| Engineering | 46 | 5.0% |
| Multidisciplinary Studies | 12 | 1.3% |
| Science & Technology | 67 | 7.3% |
| Business | 203 | 22.1% |
| Education | 103 | 11.2% |
| Literature & Languages | 14 | 1.5% |
| Liberal Arts & History | 34 | 3.7% |
| Visual & Performing Arts | 25 | 2.7% |
| Communications | 22 | 2.4% |
| Arts & Humanities | 22 | 2.4% |
| Total | 920 | 100.0% |
Transportation & Commute in Waikapu
Vehicle Availability by Sex in Waikapu
The most prevalent vehicle ownership categories in Waikapu are males with 2 vehicles (384, accounting for 43.4%) and females with 2 vehicles (414, making up 36.0%).
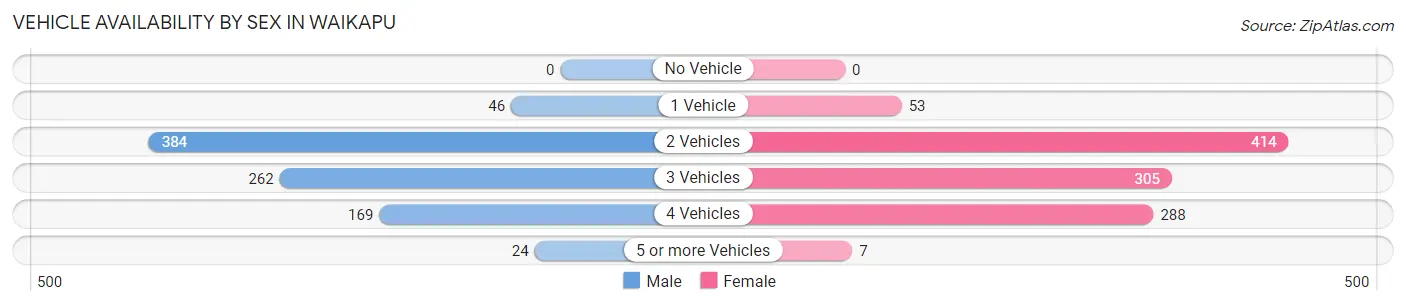
| Vehicles Available | Male | Female |
| No Vehicle | 0 (0.0%) | 0 (0.0%) |
| 1 Vehicle | 46 (5.2%) | 53 (5.0%) |
| 2 Vehicles | 384 (43.4%) | 414 (38.8%) |
| 3 Vehicles | 262 (29.6%) | 305 (28.6%) |
| 4 Vehicles | 169 (19.1%) | 288 (27.0%) |
| 5 or more Vehicles | 24 (2.7%) | 7 (0.7%) |
| Total | 885 (100.0%) | 1,067 (100.0%) |
Commute Time in Waikapu
The most frequently occuring commute durations in Waikapu are 15 to 19 minutes (422 commuters, 22.5%), 30 to 34 minutes (377 commuters, 20.1%), and 10 to 14 minutes (361 commuters, 19.2%).
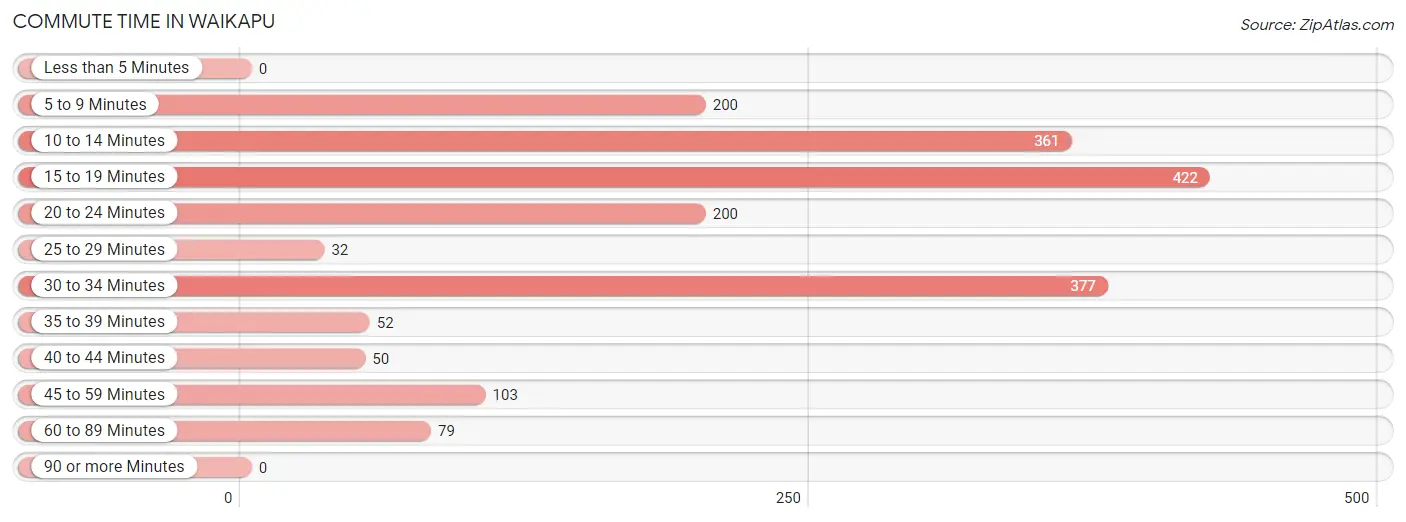
| Commute Time | # Commuters | % Commuters |
| Less than 5 Minutes | 0 | 0.0% |
| 5 to 9 Minutes | 200 | 10.7% |
| 10 to 14 Minutes | 361 | 19.2% |
| 15 to 19 Minutes | 422 | 22.5% |
| 20 to 24 Minutes | 200 | 10.7% |
| 25 to 29 Minutes | 32 | 1.7% |
| 30 to 34 Minutes | 377 | 20.1% |
| 35 to 39 Minutes | 52 | 2.8% |
| 40 to 44 Minutes | 50 | 2.7% |
| 45 to 59 Minutes | 103 | 5.5% |
| 60 to 89 Minutes | 79 | 4.2% |
| 90 or more Minutes | 0 | 0.0% |
Commute Time by Sex in Waikapu
The most common commute times in Waikapu are 30 to 34 minutes (210 commuters, 24.6%) for males and 15 to 19 minutes (232 commuters, 22.7%) for females.
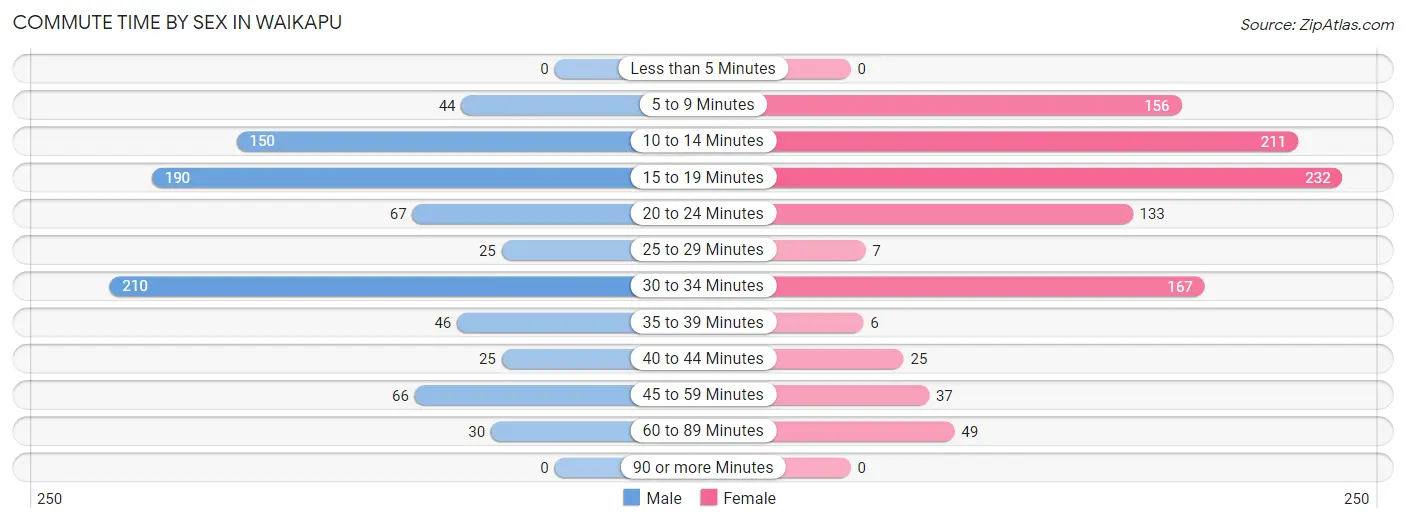
| Commute Time | Male | Female |
| Less than 5 Minutes | 0 (0.0%) | 0 (0.0%) |
| 5 to 9 Minutes | 44 (5.2%) | 156 (15.2%) |
| 10 to 14 Minutes | 150 (17.6%) | 211 (20.6%) |
| 15 to 19 Minutes | 190 (22.3%) | 232 (22.7%) |
| 20 to 24 Minutes | 67 (7.9%) | 133 (13.0%) |
| 25 to 29 Minutes | 25 (2.9%) | 7 (0.7%) |
| 30 to 34 Minutes | 210 (24.6%) | 167 (16.3%) |
| 35 to 39 Minutes | 46 (5.4%) | 6 (0.6%) |
| 40 to 44 Minutes | 25 (2.9%) | 25 (2.4%) |
| 45 to 59 Minutes | 66 (7.7%) | 37 (3.6%) |
| 60 to 89 Minutes | 30 (3.5%) | 49 (4.8%) |
| 90 or more Minutes | 0 (0.0%) | 0 (0.0%) |
Time of Departure to Work by Sex in Waikapu
The most frequent times of departure to work in Waikapu are 6:30 AM to 6:59 AM (214, 25.1%) for males and 6:30 AM to 6:59 AM (217, 21.2%) for females.
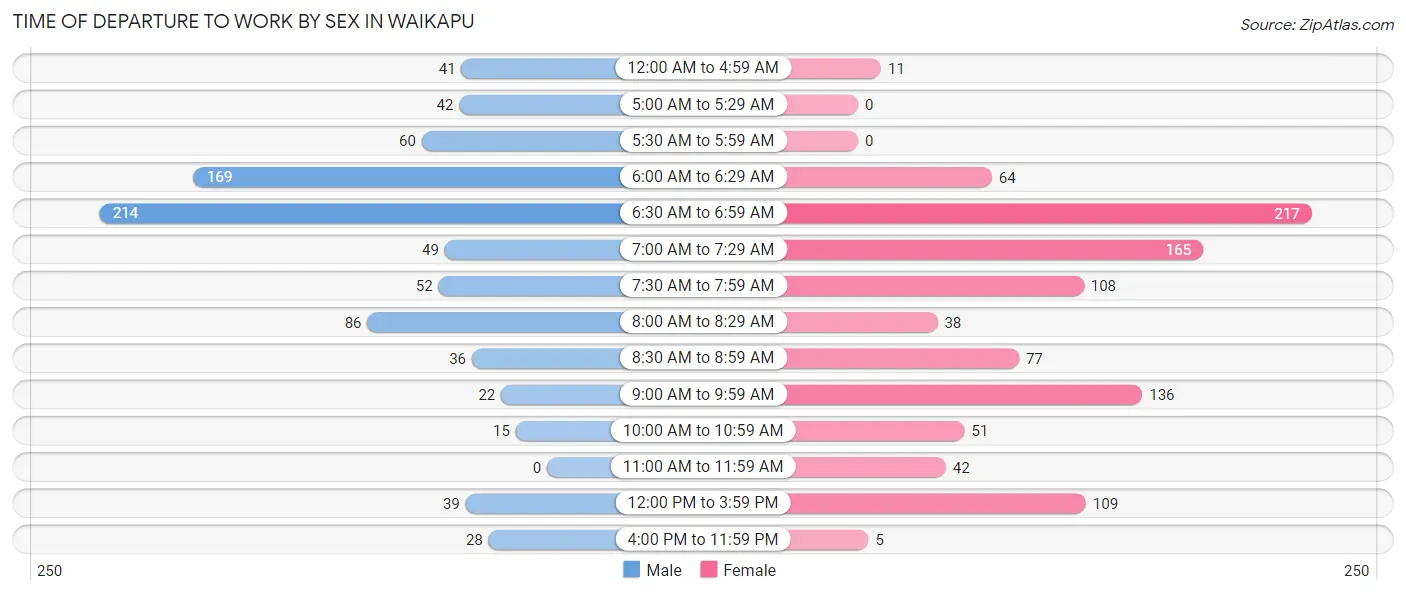
| Time of Departure | Male | Female |
| 12:00 AM to 4:59 AM | 41 (4.8%) | 11 (1.1%) |
| 5:00 AM to 5:29 AM | 42 (4.9%) | 0 (0.0%) |
| 5:30 AM to 5:59 AM | 60 (7.0%) | 0 (0.0%) |
| 6:00 AM to 6:29 AM | 169 (19.8%) | 64 (6.3%) |
| 6:30 AM to 6:59 AM | 214 (25.1%) | 217 (21.2%) |
| 7:00 AM to 7:29 AM | 49 (5.7%) | 165 (16.1%) |
| 7:30 AM to 7:59 AM | 52 (6.1%) | 108 (10.6%) |
| 8:00 AM to 8:29 AM | 86 (10.1%) | 38 (3.7%) |
| 8:30 AM to 8:59 AM | 36 (4.2%) | 77 (7.5%) |
| 9:00 AM to 9:59 AM | 22 (2.6%) | 136 (13.3%) |
| 10:00 AM to 10:59 AM | 15 (1.8%) | 51 (5.0%) |
| 11:00 AM to 11:59 AM | 0 (0.0%) | 42 (4.1%) |
| 12:00 PM to 3:59 PM | 39 (4.6%) | 109 (10.6%) |
| 4:00 PM to 11:59 PM | 28 (3.3%) | 5 (0.5%) |
| Total | 853 (100.0%) | 1,023 (100.0%) |
Housing Occupancy in Waikapu
Occupancy by Ownership in Waikapu
Of the total 1,112 dwellings in Waikapu, owner-occupied units account for 937 (84.3%), while renter-occupied units make up 175 (15.7%).
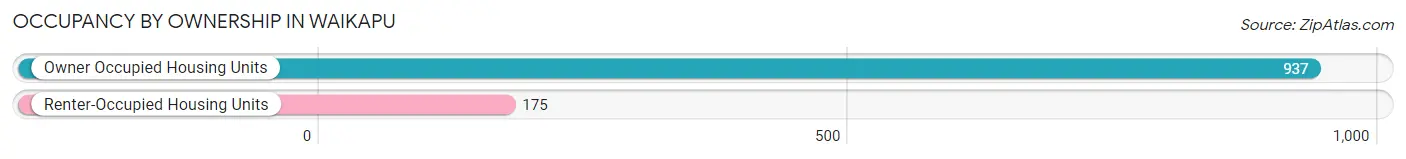
| Occupancy | # Housing Units | % Housing Units |
| Owner Occupied Housing Units | 937 | 84.3% |
| Renter-Occupied Housing Units | 175 | 15.7% |
| Total Occupied Housing Units | 1,112 | 100.0% |
Occupancy by Household Size in Waikapu
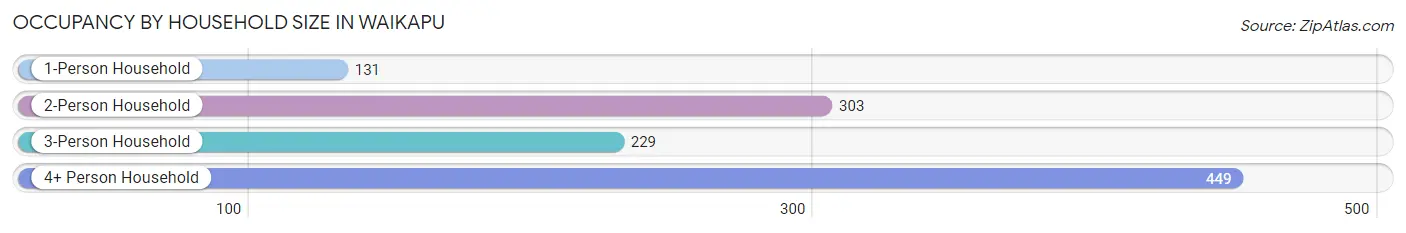
| Household Size | # Housing Units | % Housing Units |
| 1-Person Household | 131 | 11.8% |
| 2-Person Household | 303 | 27.3% |
| 3-Person Household | 229 | 20.6% |
| 4+ Person Household | 449 | 40.4% |
| Total Housing Units | 1,112 | 100.0% |
Occupancy by Ownership by Household Size in Waikapu
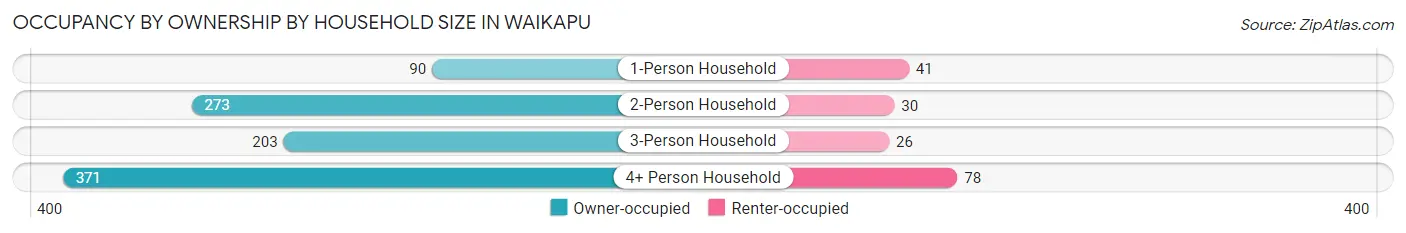
| Household Size | Owner-occupied | Renter-occupied |
| 1-Person Household | 90 (68.7%) | 41 (31.3%) |
| 2-Person Household | 273 (90.1%) | 30 (9.9%) |
| 3-Person Household | 203 (88.6%) | 26 (11.4%) |
| 4+ Person Household | 371 (82.6%) | 78 (17.4%) |
| Total Housing Units | 937 (84.3%) | 175 (15.7%) |
Occupancy by Educational Attainment in Waikapu
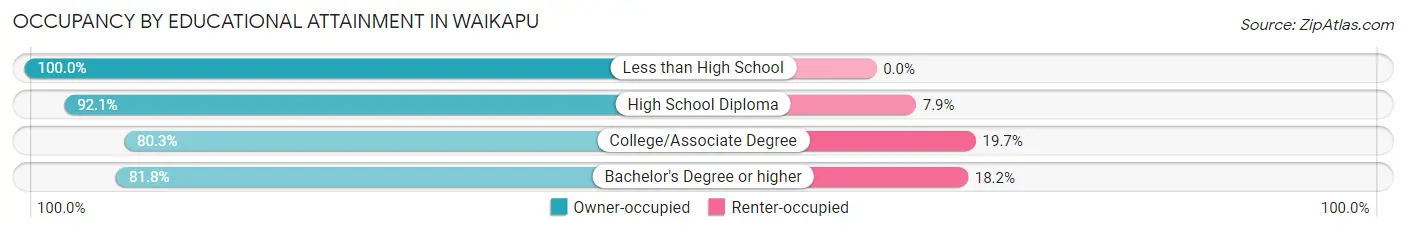
| Household Size | Owner-occupied | Renter-occupied |
| Less than High School | 56 (100.0%) | 0 (0.0%) |
| High School Diploma | 211 (92.1%) | 18 (7.9%) |
| College/Associate Degree | 350 (80.3%) | 86 (19.7%) |
| Bachelor's Degree or higher | 320 (81.8%) | 71 (18.2%) |
Occupancy by Age of Householder in Waikapu
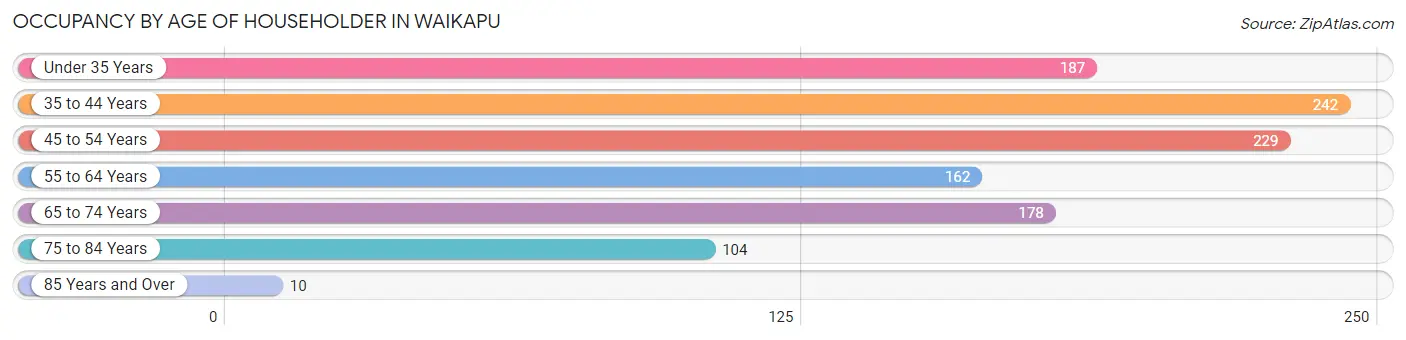
| Age Bracket | # Households | % Households |
| Under 35 Years | 187 | 16.8% |
| 35 to 44 Years | 242 | 21.8% |
| 45 to 54 Years | 229 | 20.6% |
| 55 to 64 Years | 162 | 14.6% |
| 65 to 74 Years | 178 | 16.0% |
| 75 to 84 Years | 104 | 9.3% |
| 85 Years and Over | 10 | 0.9% |
| Total | 1,112 | 100.0% |
Housing Finances in Waikapu
Median Income by Occupancy in Waikapu
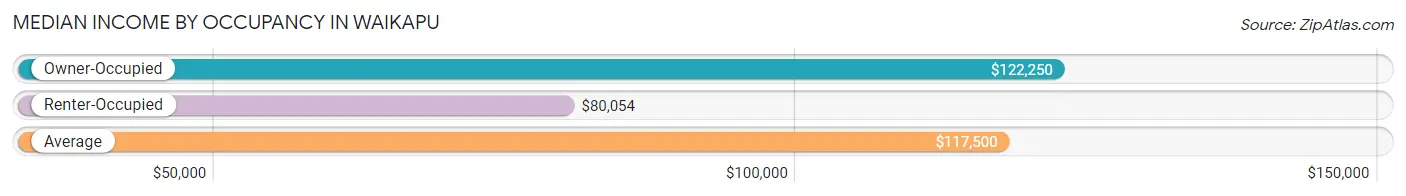
| Occupancy Type | # Households | Median Income |
| Owner-Occupied | 937 (84.3%) | $122,250 |
| Renter-Occupied | 175 (15.7%) | $80,054 |
| Average | 1,112 (100.0%) | $117,500 |
Occupancy by Householder Income Bracket in Waikapu
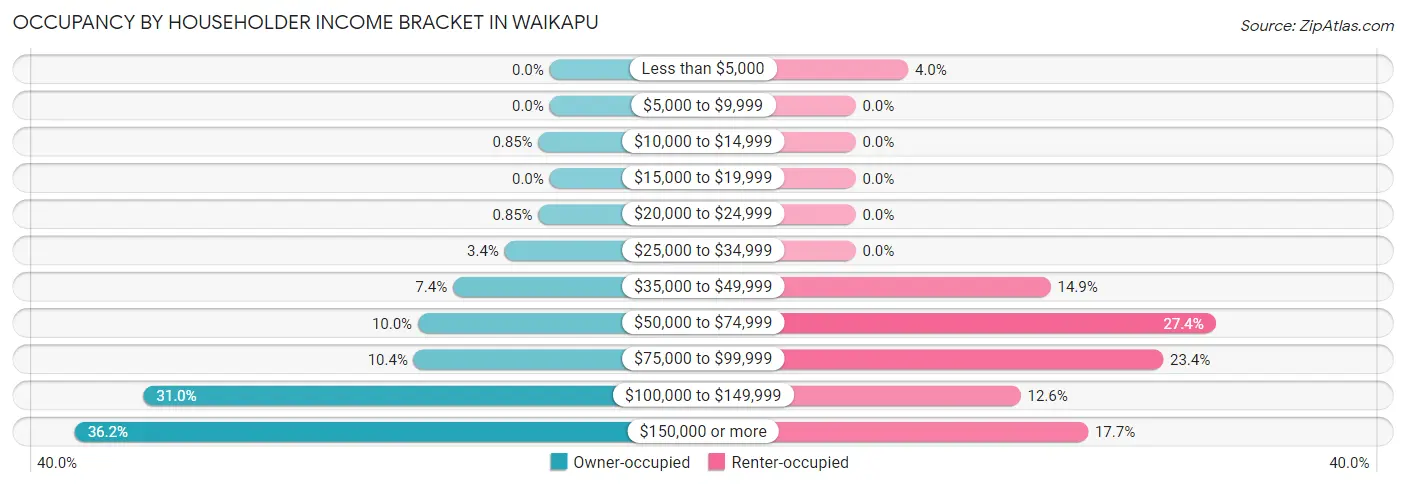
| Income Bracket | Owner-occupied | Renter-occupied |
| Less than $5,000 | 0 (0.0%) | 7 (4.0%) |
| $5,000 to $9,999 | 0 (0.0%) | 0 (0.0%) |
| $10,000 to $14,999 | 8 (0.9%) | 0 (0.0%) |
| $15,000 to $19,999 | 0 (0.0%) | 0 (0.0%) |
| $20,000 to $24,999 | 8 (0.9%) | 0 (0.0%) |
| $25,000 to $34,999 | 32 (3.4%) | 0 (0.0%) |
| $35,000 to $49,999 | 69 (7.4%) | 26 (14.9%) |
| $50,000 to $74,999 | 94 (10.0%) | 48 (27.4%) |
| $75,000 to $99,999 | 97 (10.3%) | 41 (23.4%) |
| $100,000 to $149,999 | 290 (30.9%) | 22 (12.6%) |
| $150,000 or more | 339 (36.2%) | 31 (17.7%) |
| Total | 937 (100.0%) | 175 (100.0%) |
Monthly Housing Cost Tiers in Waikapu
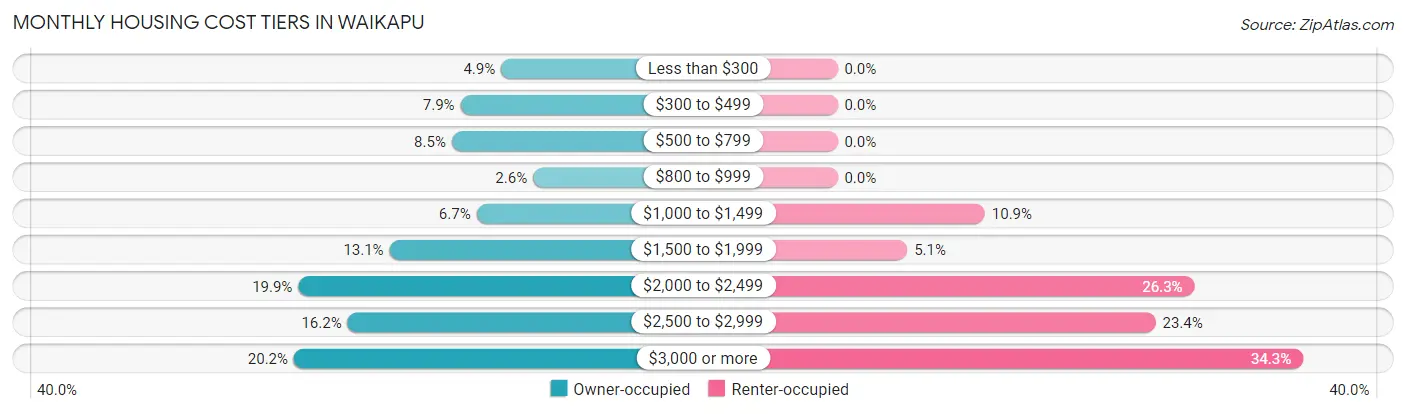
| Monthly Cost | Owner-occupied | Renter-occupied |
| Less than $300 | 46 (4.9%) | 0 (0.0%) |
| $300 to $499 | 74 (7.9%) | 0 (0.0%) |
| $500 to $799 | 80 (8.5%) | 0 (0.0%) |
| $800 to $999 | 24 (2.6%) | 0 (0.0%) |
| $1,000 to $1,499 | 63 (6.7%) | 19 (10.9%) |
| $1,500 to $1,999 | 123 (13.1%) | 9 (5.1%) |
| $2,000 to $2,499 | 186 (19.9%) | 46 (26.3%) |
| $2,500 to $2,999 | 152 (16.2%) | 41 (23.4%) |
| $3,000 or more | 189 (20.2%) | 60 (34.3%) |
| Total | 937 (100.0%) | 175 (100.0%) |
Physical Housing Characteristics in Waikapu
Housing Structures in Waikapu
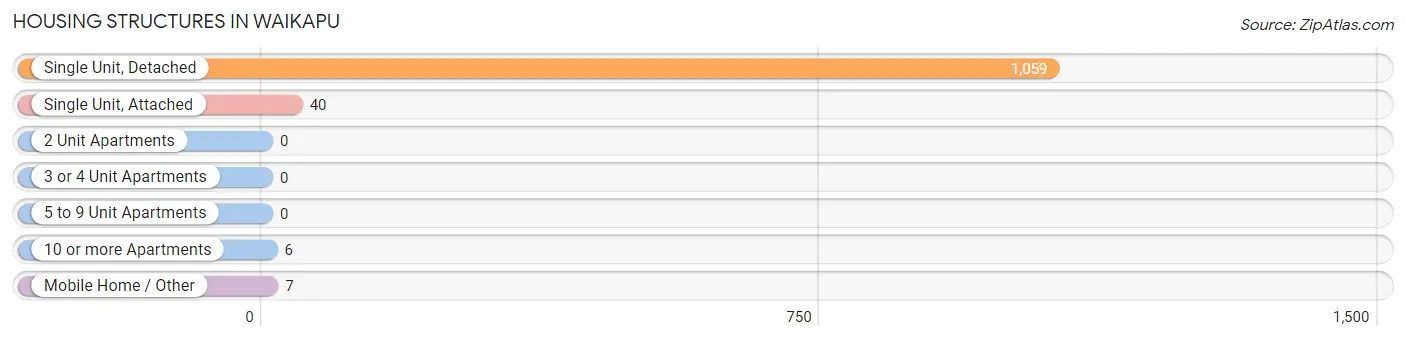
| Structure Type | # Housing Units | % Housing Units |
| Single Unit, Detached | 1,059 | 95.2% |
| Single Unit, Attached | 40 | 3.6% |
| 2 Unit Apartments | 0 | 0.0% |
| 3 or 4 Unit Apartments | 0 | 0.0% |
| 5 to 9 Unit Apartments | 0 | 0.0% |
| 10 or more Apartments | 6 | 0.5% |
| Mobile Home / Other | 7 | 0.6% |
| Total | 1,112 | 100.0% |
Housing Structures by Occupancy in Waikapu
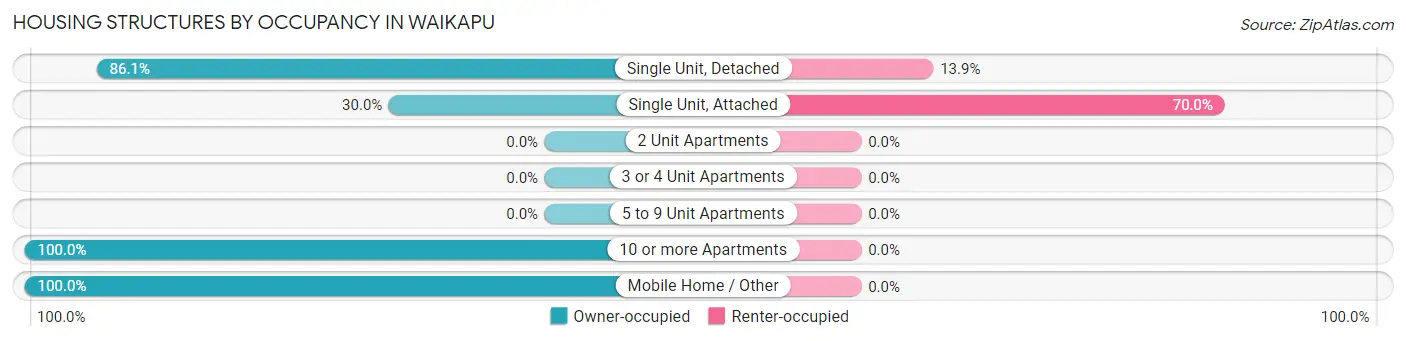
| Structure Type | Owner-occupied | Renter-occupied |
| Single Unit, Detached | 912 (86.1%) | 147 (13.9%) |
| Single Unit, Attached | 12 (30.0%) | 28 (70.0%) |
| 2 Unit Apartments | 0 (0.0%) | 0 (0.0%) |
| 3 or 4 Unit Apartments | 0 (0.0%) | 0 (0.0%) |
| 5 to 9 Unit Apartments | 0 (0.0%) | 0 (0.0%) |
| 10 or more Apartments | 6 (100.0%) | 0 (0.0%) |
| Mobile Home / Other | 7 (100.0%) | 0 (0.0%) |
| Total | 937 (84.3%) | 175 (15.7%) |
Housing Structures by Number of Rooms in Waikapu
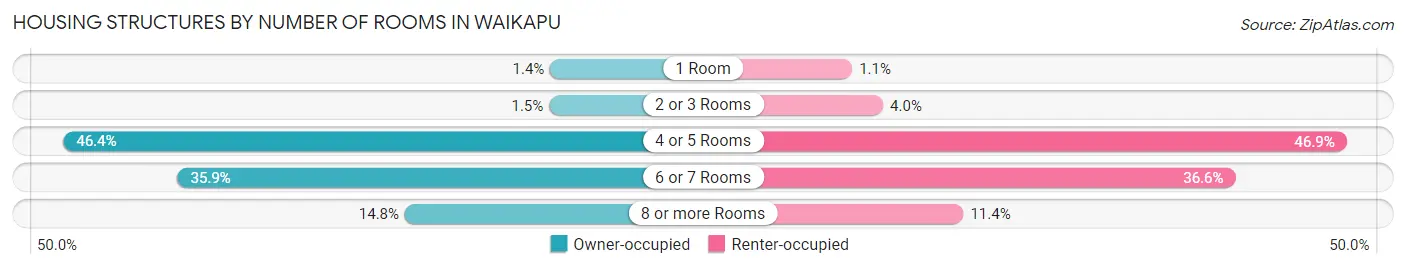
| Number of Rooms | Owner-occupied | Renter-occupied |
| 1 Room | 13 (1.4%) | 2 (1.1%) |
| 2 or 3 Rooms | 14 (1.5%) | 7 (4.0%) |
| 4 or 5 Rooms | 435 (46.4%) | 82 (46.9%) |
| 6 or 7 Rooms | 336 (35.9%) | 64 (36.6%) |
| 8 or more Rooms | 139 (14.8%) | 20 (11.4%) |
| Total | 937 (100.0%) | 175 (100.0%) |
Housing Structure by Heating Type in Waikapu
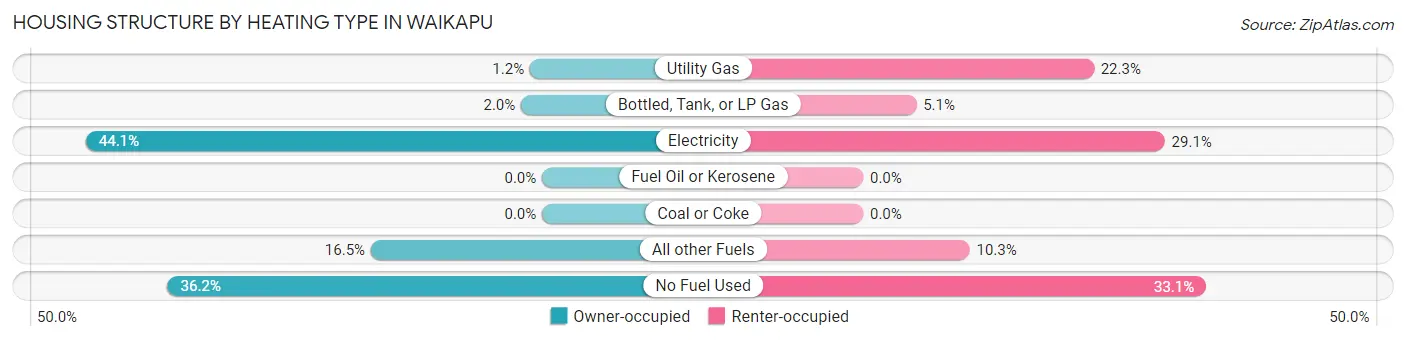
| Heating Type | Owner-occupied | Renter-occupied |
| Utility Gas | 11 (1.2%) | 39 (22.3%) |
| Bottled, Tank, or LP Gas | 19 (2.0%) | 9 (5.1%) |
| Electricity | 413 (44.1%) | 51 (29.1%) |
| Fuel Oil or Kerosene | 0 (0.0%) | 0 (0.0%) |
| Coal or Coke | 0 (0.0%) | 0 (0.0%) |
| All other Fuels | 155 (16.5%) | 18 (10.3%) |
| No Fuel Used | 339 (36.2%) | 58 (33.1%) |
| Total | 937 (100.0%) | 175 (100.0%) |
Household Vehicle Usage in Waikapu
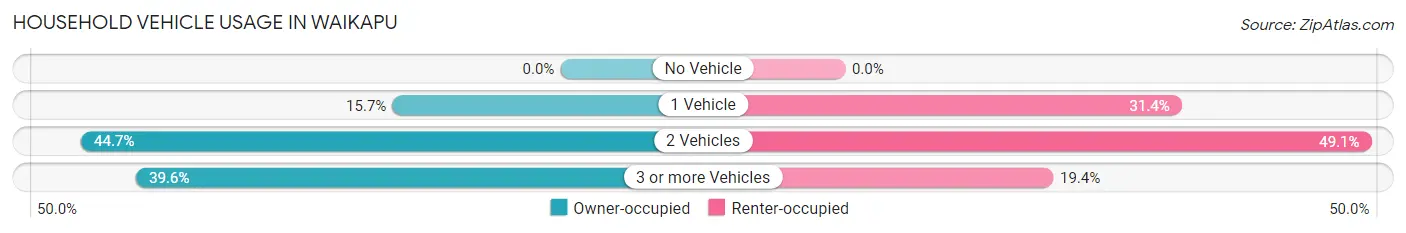
| Vehicles per Household | Owner-occupied | Renter-occupied |
| No Vehicle | 0 (0.0%) | 0 (0.0%) |
| 1 Vehicle | 147 (15.7%) | 55 (31.4%) |
| 2 Vehicles | 419 (44.7%) | 86 (49.1%) |
| 3 or more Vehicles | 371 (39.6%) | 34 (19.4%) |
| Total | 937 (100.0%) | 175 (100.0%) |
Real Estate & Mortgages in Waikapu
Real Estate and Mortgage Overview in Waikapu
| Characteristic | Without Mortgage | With Mortgage |
| Housing Units | 189 | 748 |
| Median Property Value | $523,700 | $792,300 |
| Median Household Income | $129,539 | $254 |
| Monthly Housing Costs | $493 | $189 |
| Real Estate Taxes | $1,531 | $40 |
Property Value by Mortgage Status in Waikapu
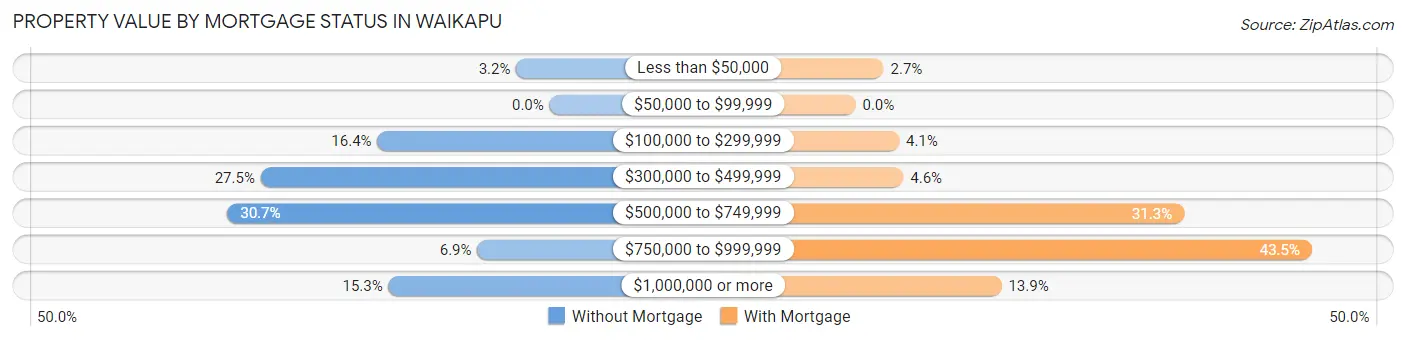
| Property Value | Without Mortgage | With Mortgage |
| Less than $50,000 | 6 (3.2%) | 20 (2.7%) |
| $50,000 to $99,999 | 0 (0.0%) | 0 (0.0%) |
| $100,000 to $299,999 | 31 (16.4%) | 31 (4.1%) |
| $300,000 to $499,999 | 52 (27.5%) | 34 (4.5%) |
| $500,000 to $749,999 | 58 (30.7%) | 234 (31.3%) |
| $750,000 to $999,999 | 13 (6.9%) | 325 (43.4%) |
| $1,000,000 or more | 29 (15.3%) | 104 (13.9%) |
| Total | 189 (100.0%) | 748 (100.0%) |
Household Income by Mortgage Status in Waikapu
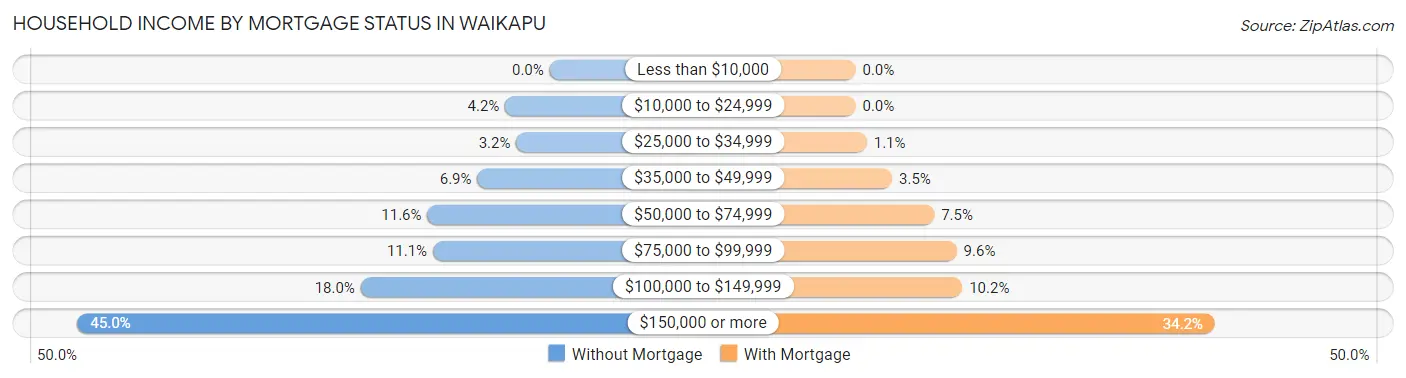
| Household Income | Without Mortgage | With Mortgage |
| Less than $10,000 | 0 (0.0%) | 0 (0.0%) |
| $10,000 to $24,999 | 8 (4.2%) | 0 (0.0%) |
| $25,000 to $34,999 | 6 (3.2%) | 8 (1.1%) |
| $35,000 to $49,999 | 13 (6.9%) | 26 (3.5%) |
| $50,000 to $74,999 | 22 (11.6%) | 56 (7.5%) |
| $75,000 to $99,999 | 21 (11.1%) | 72 (9.6%) |
| $100,000 to $149,999 | 34 (18.0%) | 76 (10.2%) |
| $150,000 or more | 85 (45.0%) | 256 (34.2%) |
| Total | 189 (100.0%) | 748 (100.0%) |
Property Value to Household Income Ratio in Waikapu
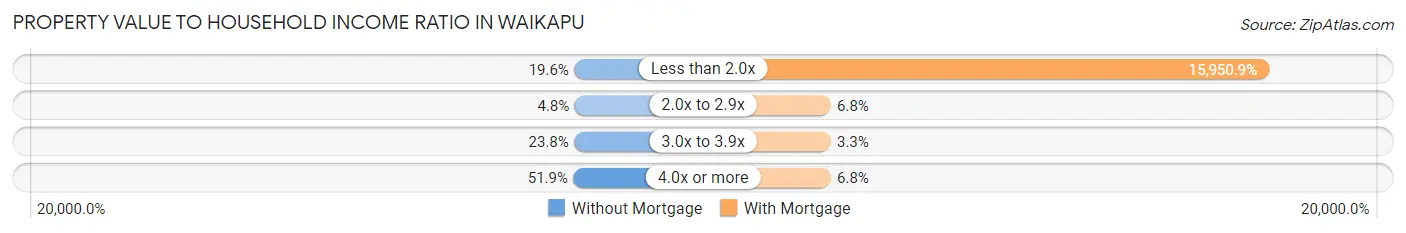
| Value-to-Income Ratio | Without Mortgage | With Mortgage |
| Less than 2.0x | 37 (19.6%) | 119,313 (15,950.9%) |
| 2.0x to 2.9x | 9 (4.8%) | 51 (6.8%) |
| 3.0x to 3.9x | 45 (23.8%) | 25 (3.3%) |
| 4.0x or more | 98 (51.8%) | 51 (6.8%) |
| Total | 189 (100.0%) | 748 (100.0%) |
Real Estate Taxes by Mortgage Status in Waikapu
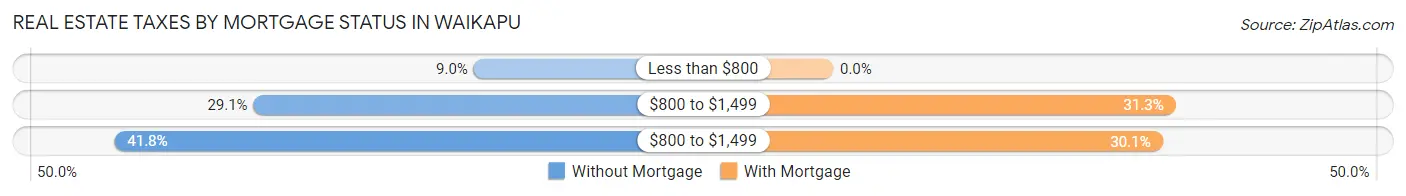
| Property Taxes | Without Mortgage | With Mortgage |
| Less than $800 | 17 (9.0%) | 0 (0.0%) |
| $800 to $1,499 | 55 (29.1%) | 234 (31.3%) |
| $800 to $1,499 | 79 (41.8%) | 225 (30.1%) |
| Total | 189 (100.0%) | 748 (100.0%) |
Health & Disability in Waikapu
Health Insurance Coverage by Age in Waikapu
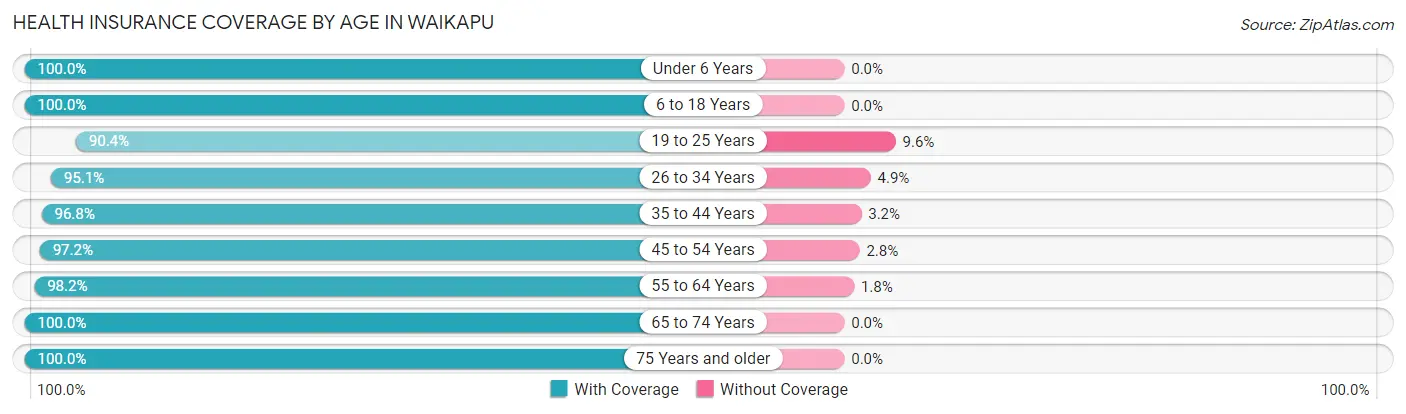
| Age Bracket | With Coverage | Without Coverage |
| Under 6 Years | 414 (100.0%) | 0 (0.0%) |
| 6 to 18 Years | 787 (100.0%) | 0 (0.0%) |
| 19 to 25 Years | 293 (90.4%) | 31 (9.6%) |
| 26 to 34 Years | 465 (95.1%) | 24 (4.9%) |
| 35 to 44 Years | 581 (96.8%) | 19 (3.2%) |
| 45 to 54 Years | 481 (97.2%) | 14 (2.8%) |
| 55 to 64 Years | 327 (98.2%) | 6 (1.8%) |
| 65 to 74 Years | 269 (100.0%) | 0 (0.0%) |
| 75 Years and older | 157 (100.0%) | 0 (0.0%) |
| Total | 3,774 (97.6%) | 94 (2.4%) |
Health Insurance Coverage by Citizenship Status in Waikapu
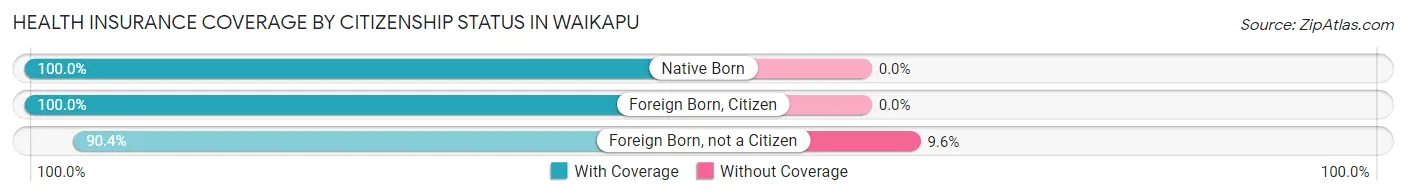
| Citizenship Status | With Coverage | Without Coverage |
| Native Born | 414 (100.0%) | 0 (0.0%) |
| Foreign Born, Citizen | 787 (100.0%) | 0 (0.0%) |
| Foreign Born, not a Citizen | 293 (90.4%) | 31 (9.6%) |
Health Insurance Coverage by Household Income in Waikapu
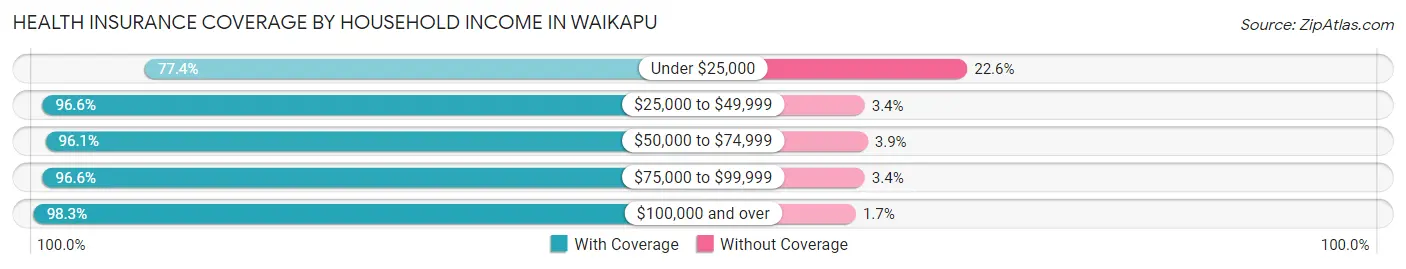
| Household Income | With Coverage | Without Coverage |
| Under $25,000 | 24 (77.4%) | 7 (22.6%) |
| $25,000 to $49,999 | 258 (96.6%) | 9 (3.4%) |
| $50,000 to $74,999 | 415 (96.1%) | 17 (3.9%) |
| $75,000 to $99,999 | 399 (96.6%) | 14 (3.4%) |
| $100,000 and over | 2,678 (98.3%) | 47 (1.7%) |
Public vs Private Health Insurance Coverage by Age in Waikapu
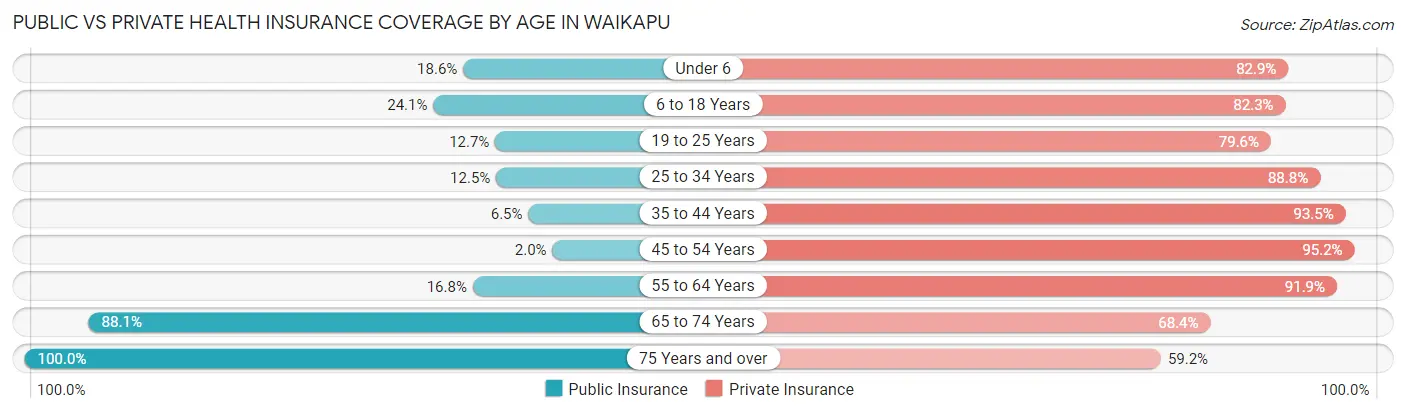
| Age Bracket | Public Insurance | Private Insurance |
| Under 6 | 77 (18.6%) | 343 (82.9%) |
| 6 to 18 Years | 190 (24.1%) | 648 (82.3%) |
| 19 to 25 Years | 41 (12.7%) | 258 (79.6%) |
| 25 to 34 Years | 61 (12.5%) | 434 (88.7%) |
| 35 to 44 Years | 39 (6.5%) | 561 (93.5%) |
| 45 to 54 Years | 10 (2.0%) | 471 (95.2%) |
| 55 to 64 Years | 56 (16.8%) | 306 (91.9%) |
| 65 to 74 Years | 237 (88.1%) | 184 (68.4%) |
| 75 Years and over | 157 (100.0%) | 93 (59.2%) |
| Total | 868 (22.4%) | 3,298 (85.3%) |
Disability Status by Sex by Age in Waikapu
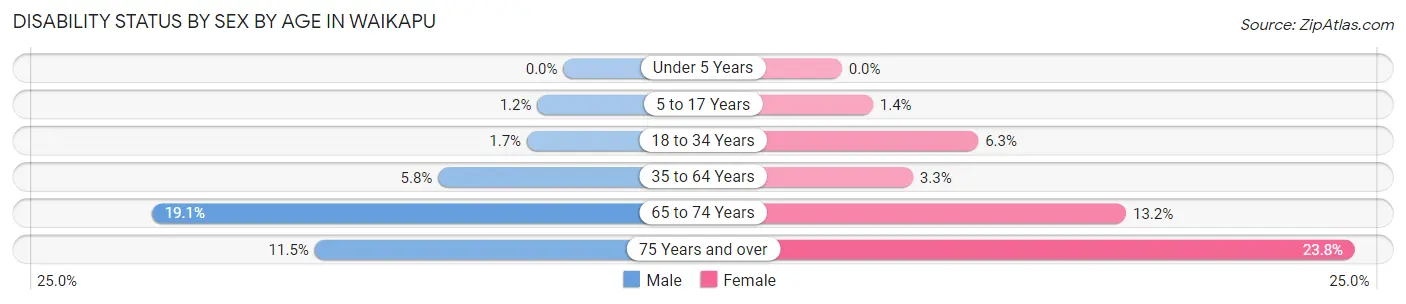
| Age Bracket | Male | Female |
| Under 5 Years | 0 (0.0%) | 0 (0.0%) |
| 5 to 17 Years | 6 (1.2%) | 6 (1.4%) |
| 18 to 34 Years | 6 (1.7%) | 30 (6.3%) |
| 35 to 64 Years | 39 (5.8%) | 25 (3.3%) |
| 65 to 74 Years | 34 (19.1%) | 12 (13.2%) |
| 75 Years and over | 6 (11.5%) | 25 (23.8%) |
Disability Class by Sex by Age in Waikapu
Disability Class: Hearing Difficulty
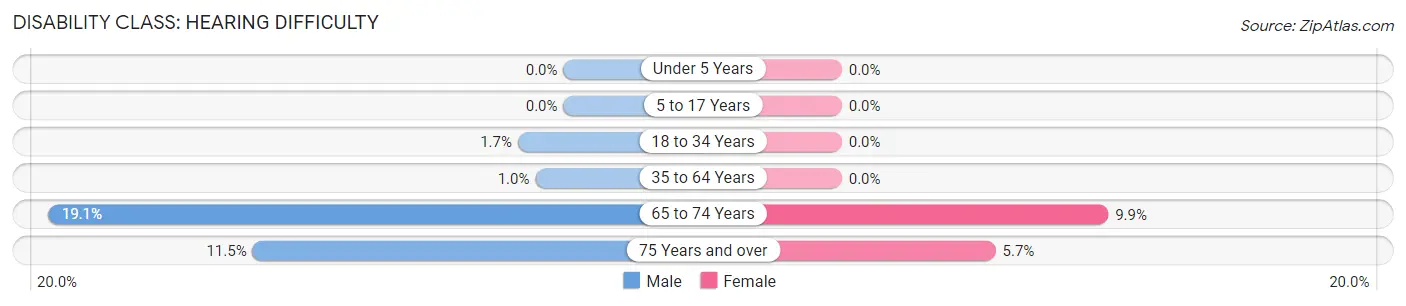
| Age Bracket | Male | Female |
| Under 5 Years | 0 (0.0%) | 0 (0.0%) |
| 5 to 17 Years | 0 (0.0%) | 0 (0.0%) |
| 18 to 34 Years | 6 (1.7%) | 0 (0.0%) |
| 35 to 64 Years | 7 (1.0%) | 0 (0.0%) |
| 65 to 74 Years | 34 (19.1%) | 9 (9.9%) |
| 75 Years and over | 6 (11.5%) | 6 (5.7%) |
Disability Class: Vision Difficulty
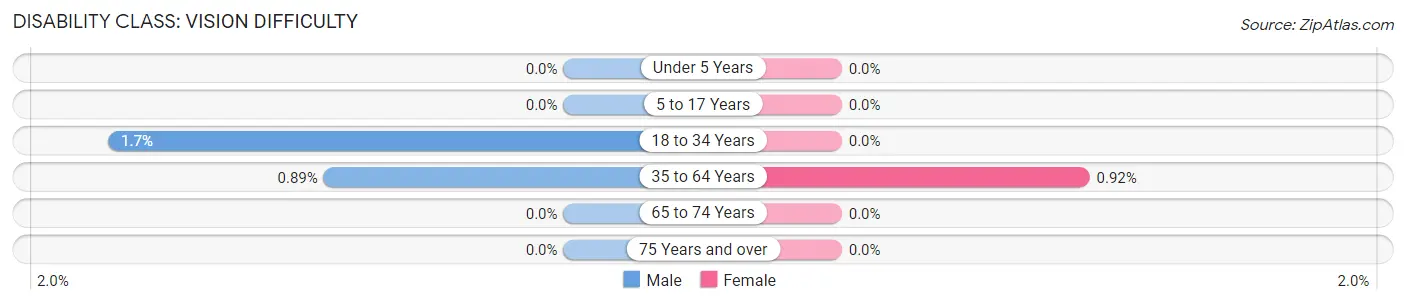
| Age Bracket | Male | Female |
| Under 5 Years | 0 (0.0%) | 0 (0.0%) |
| 5 to 17 Years | 0 (0.0%) | 0 (0.0%) |
| 18 to 34 Years | 6 (1.7%) | 0 (0.0%) |
| 35 to 64 Years | 6 (0.9%) | 7 (0.9%) |
| 65 to 74 Years | 0 (0.0%) | 0 (0.0%) |
| 75 Years and over | 0 (0.0%) | 0 (0.0%) |
Disability Class: Cognitive Difficulty
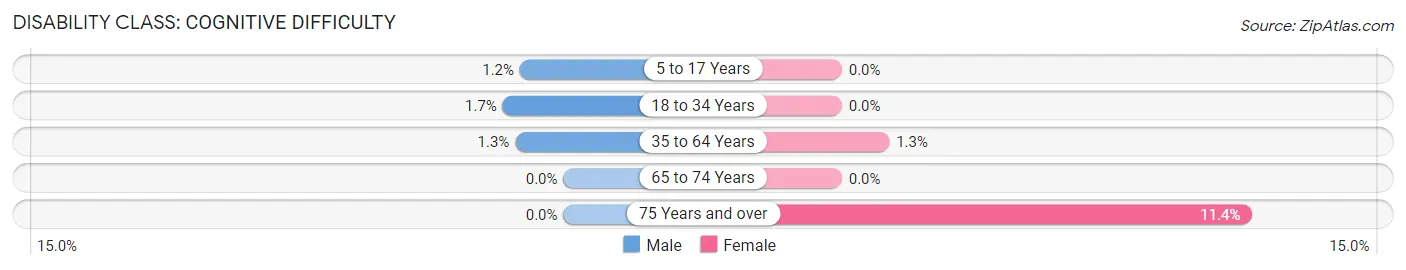
| Age Bracket | Male | Female |
| 5 to 17 Years | 6 (1.2%) | 0 (0.0%) |
| 18 to 34 Years | 6 (1.7%) | 0 (0.0%) |
| 35 to 64 Years | 9 (1.3%) | 10 (1.3%) |
| 65 to 74 Years | 0 (0.0%) | 0 (0.0%) |
| 75 Years and over | 0 (0.0%) | 12 (11.4%) |
Disability Class: Ambulatory Difficulty
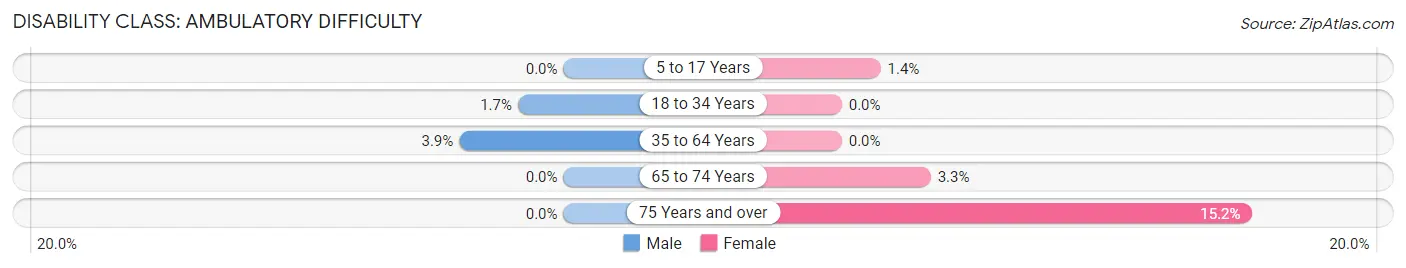
| Age Bracket | Male | Female |
| 5 to 17 Years | 0 (0.0%) | 6 (1.4%) |
| 18 to 34 Years | 6 (1.7%) | 0 (0.0%) |
| 35 to 64 Years | 26 (3.9%) | 0 (0.0%) |
| 65 to 74 Years | 0 (0.0%) | 3 (3.3%) |
| 75 Years and over | 0 (0.0%) | 16 (15.2%) |
Disability Class: Self-Care Difficulty
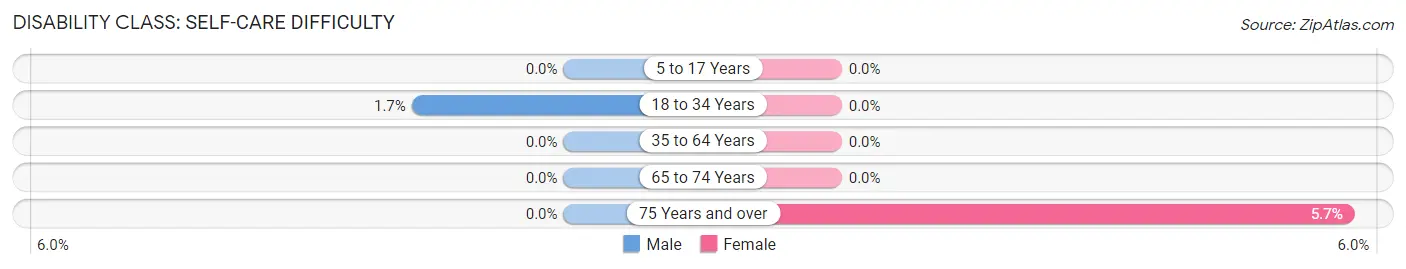
| Age Bracket | Male | Female |
| 5 to 17 Years | 0 (0.0%) | 0 (0.0%) |
| 18 to 34 Years | 6 (1.7%) | 0 (0.0%) |
| 35 to 64 Years | 0 (0.0%) | 0 (0.0%) |
| 65 to 74 Years | 0 (0.0%) | 0 (0.0%) |
| 75 Years and over | 0 (0.0%) | 6 (5.7%) |
Technology Access in Waikapu
Computing Device Access in Waikapu
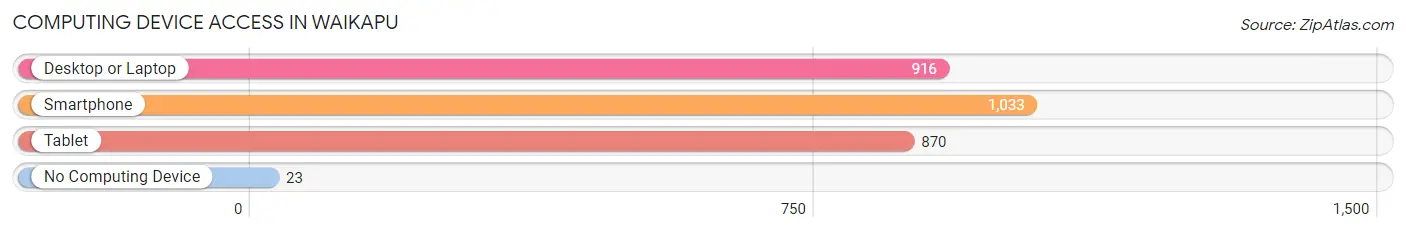
| Device Type | # Households | % Households |
| Desktop or Laptop | 916 | 82.4% |
| Smartphone | 1,033 | 92.9% |
| Tablet | 870 | 78.2% |
| No Computing Device | 23 | 2.1% |
| Total | 1,112 | 100.0% |
Internet Access in Waikapu
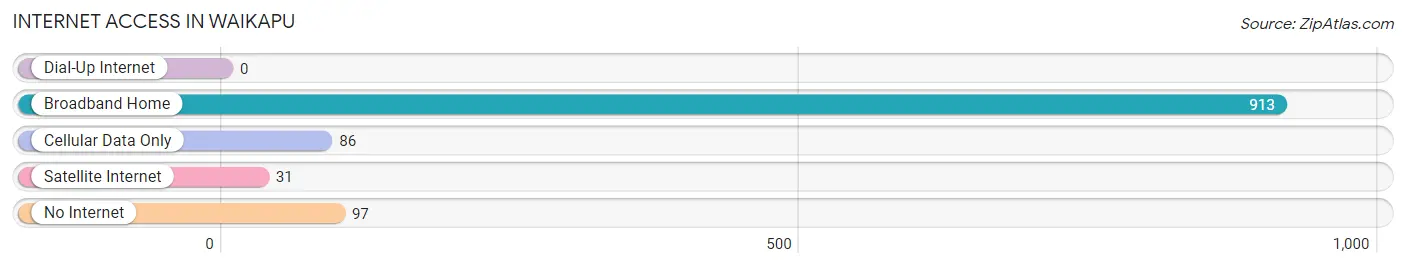
| Internet Type | # Households | % Households |
| Dial-Up Internet | 0 | 0.0% |
| Broadband Home | 913 | 82.1% |
| Cellular Data Only | 86 | 7.7% |
| Satellite Internet | 31 | 2.8% |
| No Internet | 97 | 8.7% |
| Total | 1,112 | 100.0% |
Waikapu Summary
Waikapu is a small unincorporated community located in the central part of Maui, Hawaii. It is located in the district of Wailuku, and is part of the larger Wailuku-Waikapu-Kahului CDP. Waikapu is a rural area with a population of approximately 1,000 people.
History
Waikapu has a long and rich history. It was once a thriving agricultural community, with many of its residents working in the sugar cane and pineapple fields. The area was also home to a large number of Native Hawaiians, who were the original inhabitants of the area.
The area was first settled by the Hawaiians in the late 1700s. The area was known as “Kapu”, which means “forbidden” in Hawaiian. This was due to the fact that the area was considered sacred by the Hawaiians and was off-limits to outsiders.
In the early 1800s, the area was opened up to outsiders and the first non-Hawaiian settlers began to arrive. These settlers were mostly of Portuguese and Chinese descent. They began to cultivate the land and grow sugar cane and pineapple.
The area was also home to a large number of Japanese immigrants, who began to arrive in the late 1800s. These immigrants were mostly farmers and fishermen, and they helped to develop the area further.
In the early 1900s, the area was home to a large number of Chinese immigrants. These immigrants were mostly merchants and laborers, and they helped to further develop the area.
In the mid-1900s, the area was home to a large number of Filipino immigrants. These immigrants were mostly laborers and merchants, and they helped to further develop the area.
Geography
Waikapu is located in the central part of Maui, Hawaii. It is located in the district of Wailuku, and is part of the larger Wailuku-Waikapu-Kahului CDP. The area is mostly rural, with a few small businesses and residential areas.
The area is located in a valley, surrounded by mountains. The area is known for its lush vegetation and beautiful scenery. The area is also home to a number of streams and rivers, which provide a source of water for the area.
Economy
The economy of Waikapu is largely based on agriculture. The area is home to a number of farms, which produce a variety of crops, including sugar cane, pineapple, and other fruits and vegetables. The area is also home to a number of small businesses, which provide services to the local community.
The area is also home to a number of tourist attractions, including the Waikapu Valley Lookout, which offers stunning views of the valley and the surrounding mountains. The area is also home to a number of restaurants, which serve a variety of local and international cuisine.
Demographics
As of the 2010 census, the population of Waikapu was 1,000 people. The racial makeup of the area was 57.7% White, 0.7% African American, 0.3% Native American, 0.3% Asian, 0.1% Pacific Islander, and 40.3% from other races. The median household income was $45,000, and the median age was 37.
Conclusion
Waikapu is a small unincorporated community located in the central part of Maui, Hawaii. It is located in the district of Wailuku, and is part of the larger Wailuku-Waikapu-Kahului CDP. Waikapu has a long and rich history, and was once a thriving agricultural community. The area is mostly rural, with a few small businesses and residential areas. The economy of Waikapu is largely based on agriculture, and the area is home to a number of tourist attractions. As of the 2010 census, the population of Waikapu was 1,000 people.
Common Questions
What is Per Capita Income in Waikapu?
Per Capita income in Waikapu is $41,443.
What is the Median Family Income in Waikapu?
Median Family Income in Waikapu is $119,438.
What is the Median Household income in Waikapu?
Median Household Income in Waikapu is $117,500.
What is Income or Wage Gap in Waikapu?
Income or Wage Gap in Waikapu is 21.8%.
Women in Waikapu earn 78.2 cents for every dollar earned by a man.
What is Inequality or Gini Index in Waikapu?
Inequality or Gini Index in Waikapu is 0.36.
What is the Total Population of Waikapu?
Total Population of Waikapu is 3,887.
What is the Total Male Population of Waikapu?
Total Male Population of Waikapu is 1,910.
What is the Total Female Population of Waikapu?
Total Female Population of Waikapu is 1,977.
What is the Ratio of Males per 100 Females in Waikapu?
There are 96.61 Males per 100 Females in Waikapu.
What is the Ratio of Females per 100 Males in Waikapu?
There are 103.51 Females per 100 Males in Waikapu.
What is the Median Population Age in Waikapu?
Median Population Age in Waikapu is 33.9 Years.
What is the Average Family Size in Waikapu
Average Family Size in Waikapu is 3.7 People.
What is the Average Household Size in Waikapu
Average Household Size in Waikapu is 3.5 People.
How Large is the Labor Force in Waikapu?
There are 2,047 People in the Labor Forcein in Waikapu.
What is the Percentage of People in the Labor Force in Waikapu?
73.6% of People are in the Labor Force in Waikapu.
What is the Unemployment Rate in Waikapu?
Unemployment Rate in Waikapu is 2.6%.