Anahola, HI Map & Demographics
Anahola Map
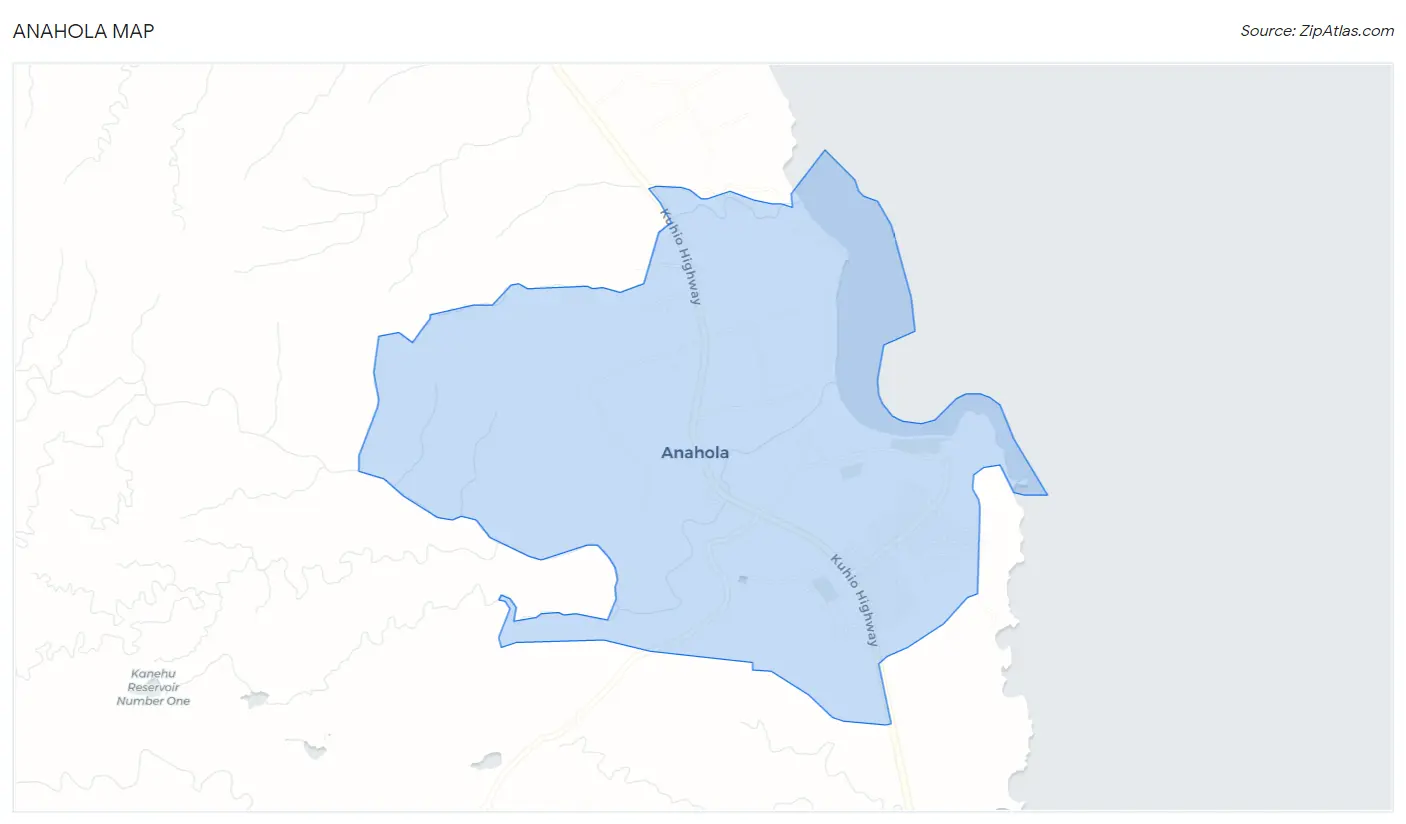
Anahola Overview
$27,411
PER CAPITA INCOME
$94,097
AVG FAMILY INCOME
$88,667
AVG HOUSEHOLD INCOME
30.4%
WAGE / INCOME GAP [ % ]
69.6¢/ $1
WAGE / INCOME GAP [ $ ]
0.38
INEQUALITY / GINI INDEX
2,853
TOTAL POPULATION
1,332
MALE POPULATION
1,521
FEMALE POPULATION
87.57
MALES / 100 FEMALES
114.19
FEMALES / 100 MALES
40.9
MEDIAN AGE
4.1
AVG FAMILY SIZE
3.7
AVG HOUSEHOLD SIZE
1,185
LABOR FORCE [ PEOPLE ]
53.3%
PERCENT IN LABOR FORCE
6.2%
UNEMPLOYMENT RATE
Anahola Zip Codes
Anahola Area Codes
Income in Anahola
Income Overview in Anahola
Per Capita Income in Anahola is $27,411, while median incomes of families and households are $94,097 and $88,667 respectively.
| Characteristic | Number | Measure |
| Per Capita Income | 2,853 | $27,411 |
| Median Family Income | 625 | $94,097 |
| Mean Family Income | 625 | $99,711 |
| Median Household Income | 772 | $88,667 |
| Mean Household Income | 772 | $90,707 |
| Income Deficit | 625 | $0 |
| Wage / Income Gap (%) | 2,853 | 30.44% |
| Wage / Income Gap ($) | 2,853 | 69.56¢ per $1 |
| Gini / Inequality Index | 2,853 | 0.38 |
Earnings by Sex in Anahola
Average Earnings in Anahola are $37,045, $45,469 for men and $31,627 for women, a difference of 30.4%.
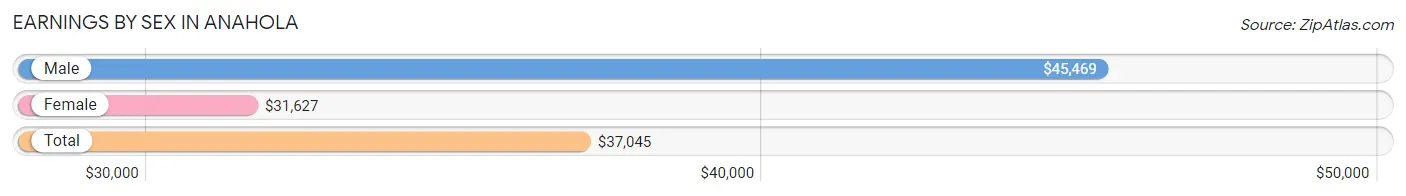
| Sex | Number | Average Earnings |
| Male | 569 (45.5%) | $45,469 |
| Female | 681 (54.5%) | $31,627 |
| Total | 1,250 (100.0%) | $37,045 |
Earnings by Sex by Income Bracket in Anahola
The most common earnings brackets in Anahola are $75,000 to $99,999 for men (109 | 19.2%) and $75,000 to $99,999 for women (90 | 13.2%).
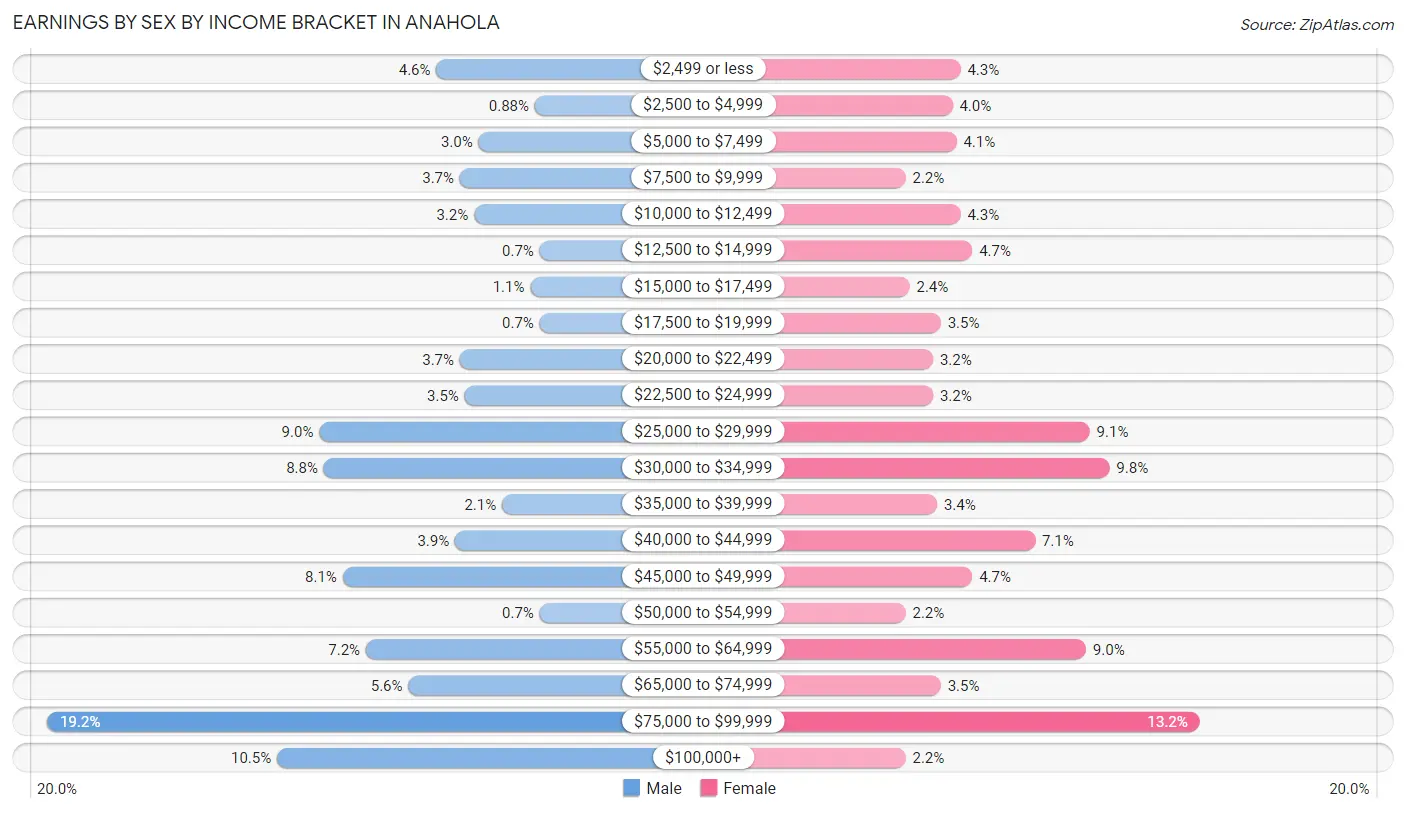
| Income | Male | Female |
| $2,499 or less | 26 (4.6%) | 29 (4.3%) |
| $2,500 to $4,999 | 5 (0.9%) | 27 (4.0%) |
| $5,000 to $7,499 | 17 (3.0%) | 28 (4.1%) |
| $7,500 to $9,999 | 21 (3.7%) | 15 (2.2%) |
| $10,000 to $12,499 | 18 (3.2%) | 29 (4.3%) |
| $12,500 to $14,999 | 4 (0.7%) | 32 (4.7%) |
| $15,000 to $17,499 | 6 (1.1%) | 16 (2.4%) |
| $17,500 to $19,999 | 4 (0.7%) | 24 (3.5%) |
| $20,000 to $22,499 | 21 (3.7%) | 22 (3.2%) |
| $22,500 to $24,999 | 20 (3.5%) | 22 (3.2%) |
| $25,000 to $29,999 | 51 (9.0%) | 62 (9.1%) |
| $30,000 to $34,999 | 50 (8.8%) | 67 (9.8%) |
| $35,000 to $39,999 | 12 (2.1%) | 23 (3.4%) |
| $40,000 to $44,999 | 22 (3.9%) | 48 (7.0%) |
| $45,000 to $49,999 | 46 (8.1%) | 32 (4.7%) |
| $50,000 to $54,999 | 4 (0.7%) | 15 (2.2%) |
| $55,000 to $64,999 | 41 (7.2%) | 61 (9.0%) |
| $65,000 to $74,999 | 32 (5.6%) | 24 (3.5%) |
| $75,000 to $99,999 | 109 (19.2%) | 90 (13.2%) |
| $100,000+ | 60 (10.5%) | 15 (2.2%) |
| Total | 569 (100.0%) | 681 (100.0%) |
Earnings by Sex by Educational Attainment in Anahola
Average earnings in Anahola are $46,344 for men and $40,147 for women, a difference of 13.4%. Men with an educational attainment of graduate degree enjoy the highest average annual earnings of $91,719, while those with bachelor's degree education earn the least with $37,813. Women with an educational attainment of graduate degree earn the most with the average annual earnings of $59,250, while those with less than high school education have the smallest earnings of $11,667.
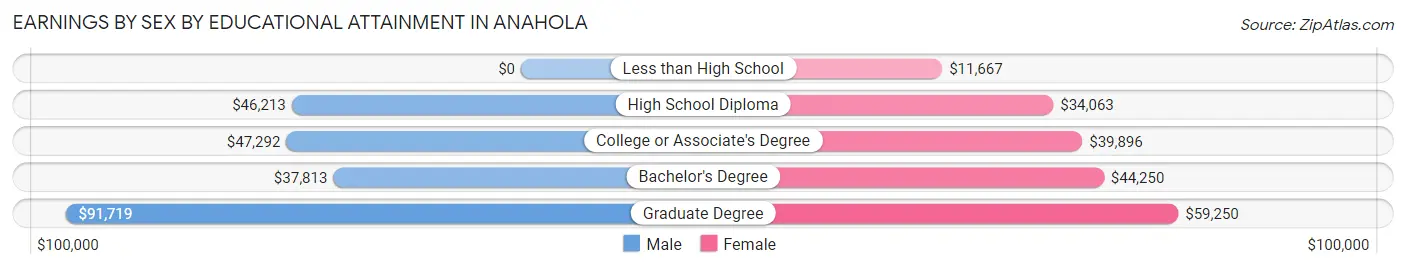
| Educational Attainment | Male Income | Female Income |
| Less than High School | - | - |
| High School Diploma | $46,213 | $34,063 |
| College or Associate's Degree | $47,292 | $39,896 |
| Bachelor's Degree | $37,813 | $44,250 |
| Graduate Degree | $91,719 | $59,250 |
| Total | $46,344 | $40,147 |
Family Income in Anahola
Family Income Brackets in Anahola
According to the Anahola family income data, there are 174 families falling into the $100,000 to $149,999 income range, which is the most common income bracket and makes up 27.8% of all families. Conversely, the less than $10,000 income bracket is the least frequent group with only 5 families (0.8%) belonging to this category.
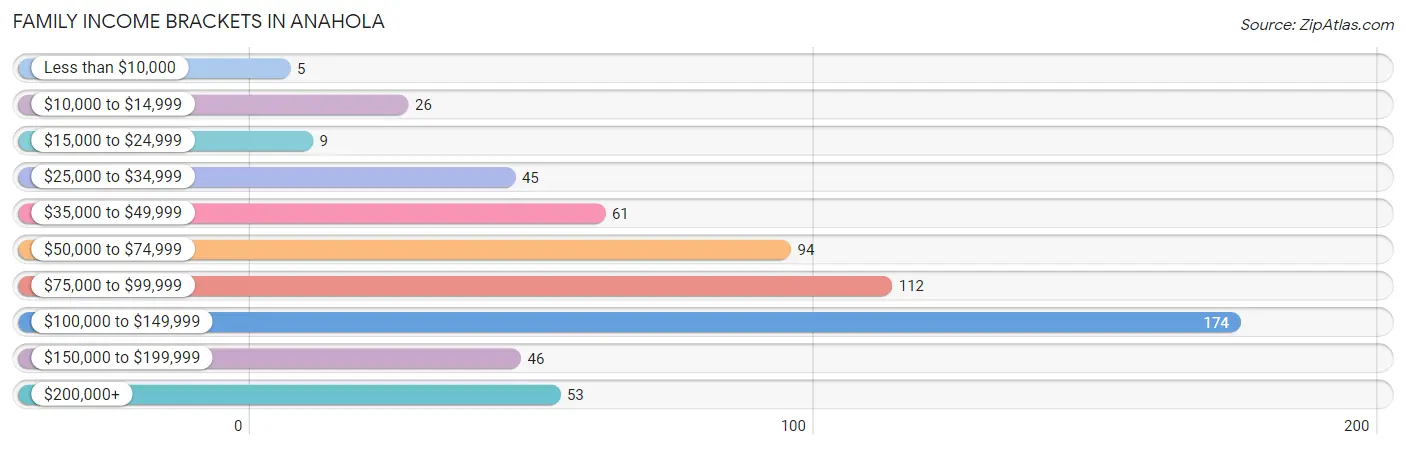
| Income Bracket | # Families | % Families |
| Less than $10,000 | 5 | 0.8% |
| $10,000 to $14,999 | 26 | 4.2% |
| $15,000 to $24,999 | 9 | 1.4% |
| $25,000 to $34,999 | 45 | 7.2% |
| $35,000 to $49,999 | 61 | 9.8% |
| $50,000 to $74,999 | 94 | 15.0% |
| $75,000 to $99,999 | 112 | 17.9% |
| $100,000 to $149,999 | 174 | 27.8% |
| $150,000 to $199,999 | 46 | 7.4% |
| $200,000+ | 53 | 8.5% |
Family Income by Famaliy Size in Anahola
5-person families (80 | 12.8%) account for the highest median family income in Anahola with $127,935 per family, while 3-person families (97 | 15.5%) have the highest median income of $34,120 per family member.
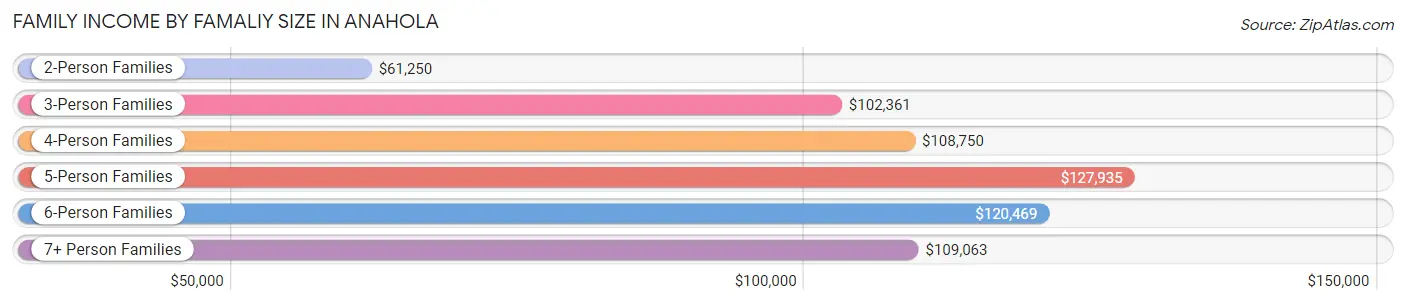
| Income Bracket | # Families | Median Income |
| 2-Person Families | 259 (41.4%) | $61,250 |
| 3-Person Families | 97 (15.5%) | $102,361 |
| 4-Person Families | 61 (9.8%) | $108,750 |
| 5-Person Families | 80 (12.8%) | $127,935 |
| 6-Person Families | 64 (10.2%) | $120,469 |
| 7+ Person Families | 64 (10.2%) | $109,063 |
| Total | 625 (100.0%) | $94,097 |
Family Income by Number of Earners in Anahola
The median family income in Anahola is $94,097, with families comprising 3+ earners (103) having the highest median family income of $131,250, while families with no earners (146) have the lowest median family income of $60,000, accounting for 16.5% and 23.4% of families, respectively.
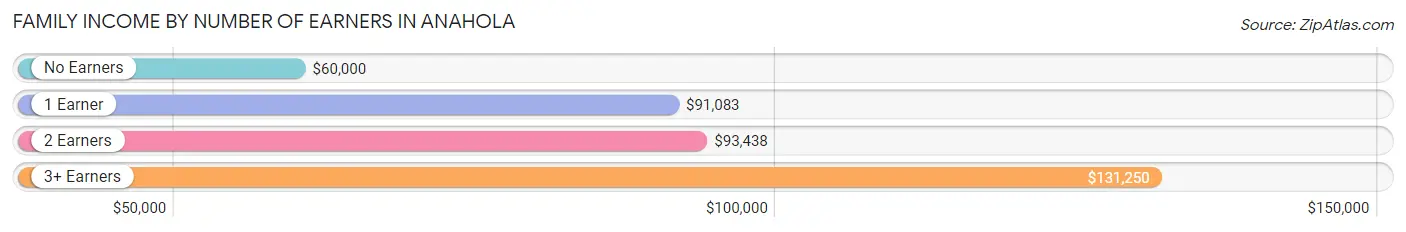
| Number of Earners | # Families | Median Income |
| No Earners | 146 (23.4%) | $60,000 |
| 1 Earner | 211 (33.8%) | $91,083 |
| 2 Earners | 165 (26.4%) | $93,438 |
| 3+ Earners | 103 (16.5%) | $131,250 |
| Total | 625 (100.0%) | $94,097 |
Household Income in Anahola
Household Income Brackets in Anahola
With 213 households falling in the category, the $100,000 to $149,999 income range is the most frequent in Anahola, accounting for 27.6% of all households. In contrast, only 27 households (3.5%) fall into the $15,000 to $24,999 income bracket, making it the least populous group.
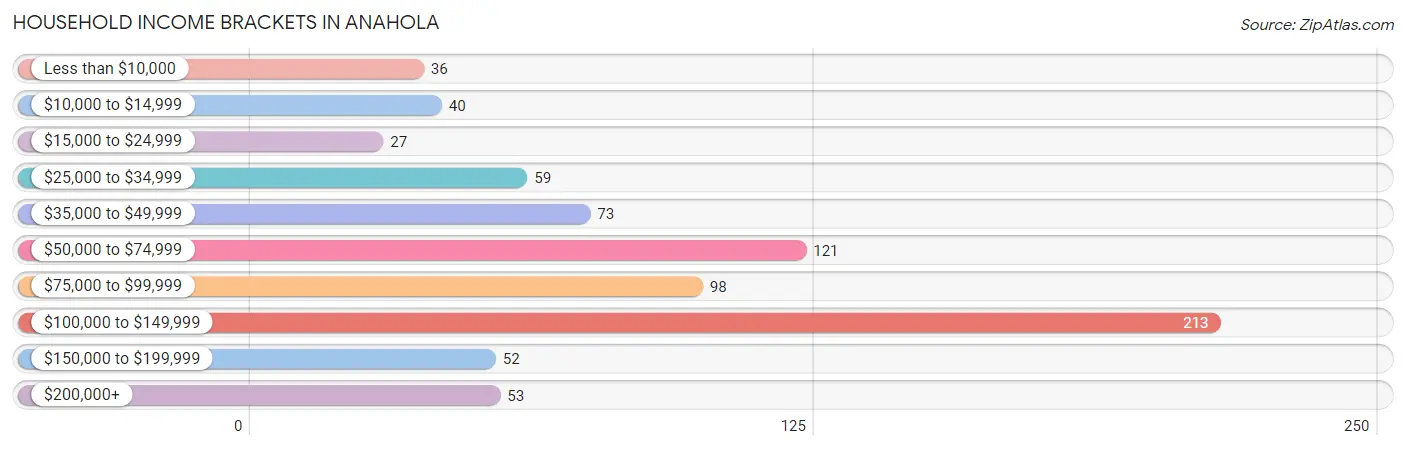
| Income Bracket | # Households | % Households |
| Less than $10,000 | 36 | 4.7% |
| $10,000 to $14,999 | 40 | 5.2% |
| $15,000 to $24,999 | 27 | 3.5% |
| $25,000 to $34,999 | 59 | 7.6% |
| $35,000 to $49,999 | 73 | 9.5% |
| $50,000 to $74,999 | 121 | 15.7% |
| $75,000 to $99,999 | 98 | 12.7% |
| $100,000 to $149,999 | 213 | 27.6% |
| $150,000 to $199,999 | 52 | 6.7% |
| $200,000+ | 53 | 6.9% |
Household Income by Householder Age in Anahola
The median household income in Anahola is $88,667, with the highest median household income of $93,571 found in the 45 to 64 years age bracket for the primary householder. A total of 368 households (47.7%) fall into this category.
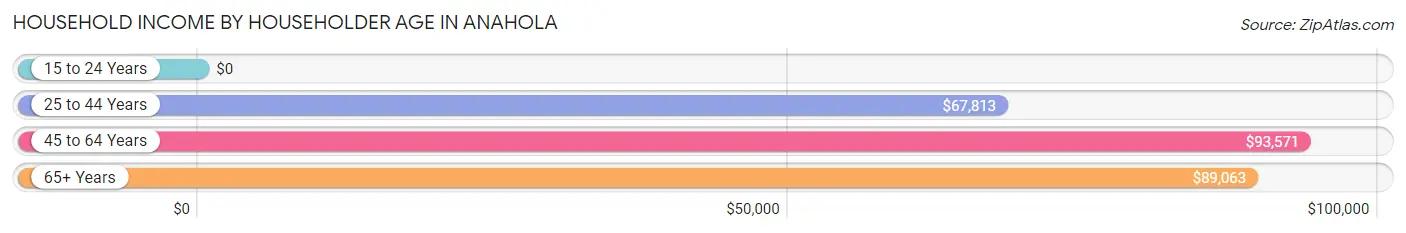
| Income Bracket | # Households | Median Income |
| 15 to 24 Years | 0 (0.0%) | $0 |
| 25 to 44 Years | 119 (15.4%) | $67,813 |
| 45 to 64 Years | 368 (47.7%) | $93,571 |
| 65+ Years | 285 (36.9%) | $89,063 |
| Total | 772 (100.0%) | $88,667 |
Poverty in Anahola
Income Below Poverty by Sex and Age in Anahola
With 11.8% poverty level for males and 12.0% for females among the residents of Anahola, 16 and 17 year old males and 75 year old and over females are the most vulnerable to poverty, with 5 males (33.3%) and 38 females (23.5%) in their respective age groups living below the poverty level.
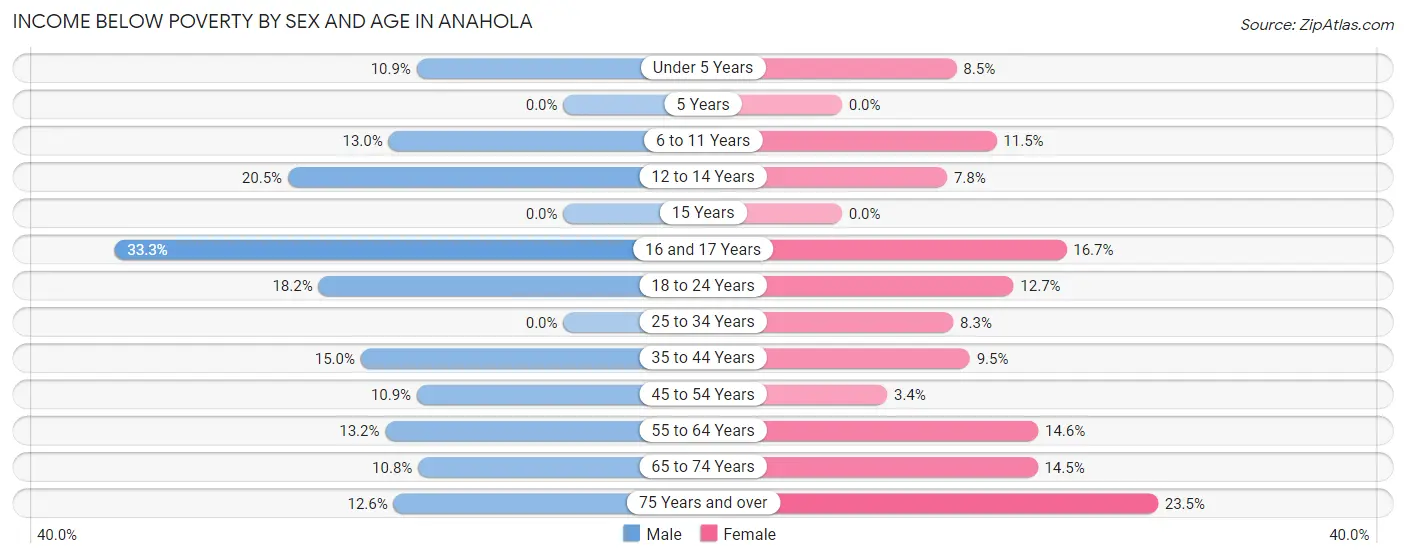
| Age Bracket | Male | Female |
| Under 5 Years | 11 (10.9%) | 8 (8.5%) |
| 5 Years | 0 (0.0%) | 0 (0.0%) |
| 6 to 11 Years | 17 (13.0%) | 14 (11.5%) |
| 12 to 14 Years | 9 (20.4%) | 5 (7.8%) |
| 15 Years | 0 (0.0%) | 0 (0.0%) |
| 16 and 17 Years | 5 (33.3%) | 7 (16.7%) |
| 18 to 24 Years | 16 (18.2%) | 20 (12.7%) |
| 25 to 34 Years | 0 (0.0%) | 11 (8.3%) |
| 35 to 44 Years | 20 (15.0%) | 21 (9.5%) |
| 45 to 54 Years | 15 (10.9%) | 4 (3.4%) |
| 55 to 64 Years | 32 (13.2%) | 29 (14.6%) |
| 65 to 74 Years | 18 (10.8%) | 25 (14.5%) |
| 75 Years and over | 14 (12.6%) | 38 (23.5%) |
| Total | 157 (11.8%) | 182 (12.0%) |
Income Above Poverty by Sex and Age in Anahola
According to the poverty statistics in Anahola, males aged 5 years and females aged 5 years are the age groups that are most secure financially, with 100.0% of males and 100.0% of females in these age groups living above the poverty line.
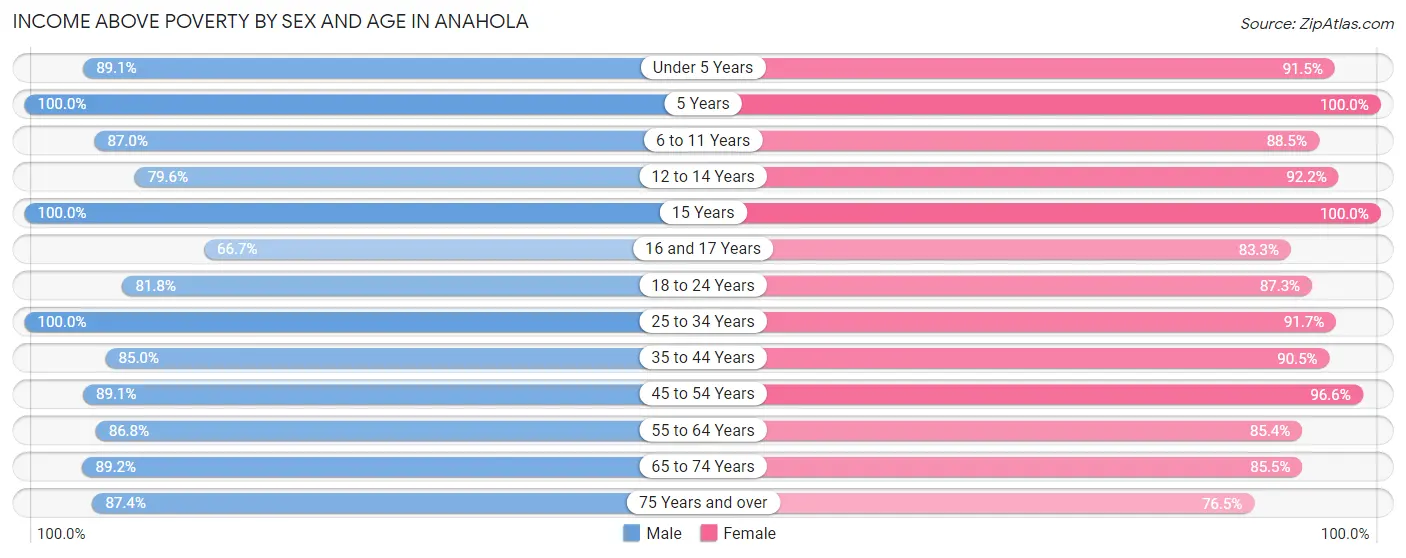
| Age Bracket | Male | Female |
| Under 5 Years | 90 (89.1%) | 86 (91.5%) |
| 5 Years | 17 (100.0%) | 18 (100.0%) |
| 6 to 11 Years | 114 (87.0%) | 108 (88.5%) |
| 12 to 14 Years | 35 (79.5%) | 59 (92.2%) |
| 15 Years | 20 (100.0%) | 14 (100.0%) |
| 16 and 17 Years | 10 (66.7%) | 35 (83.3%) |
| 18 to 24 Years | 72 (81.8%) | 137 (87.3%) |
| 25 to 34 Years | 125 (100.0%) | 122 (91.7%) |
| 35 to 44 Years | 113 (85.0%) | 200 (90.5%) |
| 45 to 54 Years | 123 (89.1%) | 115 (96.6%) |
| 55 to 64 Years | 210 (86.8%) | 170 (85.4%) |
| 65 to 74 Years | 149 (89.2%) | 147 (85.5%) |
| 75 Years and over | 97 (87.4%) | 124 (76.5%) |
| Total | 1,175 (88.2%) | 1,335 (88.0%) |
Income Below Poverty Among Married-Couple Families in Anahola
The poverty statistics for married-couple families in Anahola show that 3.9% or 16 of the total 407 families live below the poverty line. Families with 5 or more children have the highest poverty rate of 11.1%, comprising of 2 families. On the other hand, families with 1 or 2 children have the lowest poverty rate of 0.0%, which includes 0 families.
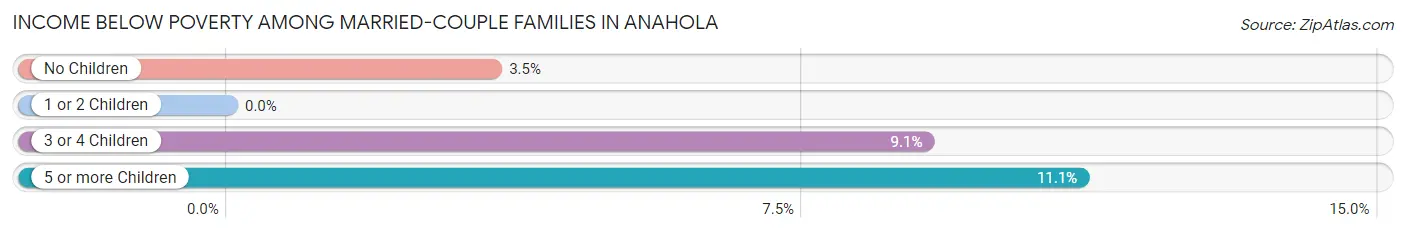
| Children | Above Poverty | Below Poverty |
| No Children | 252 (96.6%) | 9 (3.5%) |
| 1 or 2 Children | 73 (100.0%) | 0 (0.0%) |
| 3 or 4 Children | 50 (90.9%) | 5 (9.1%) |
| 5 or more Children | 16 (88.9%) | 2 (11.1%) |
| Total | 391 (96.1%) | 16 (3.9%) |
Income Below Poverty Among Single-Parent Households in Anahola
According to the poverty data in Anahola, 7.9% or 6 single-father households and 16.2% or 23 single-mother households are living below the poverty line. Among single-father households, those with 1 or 2 children have the highest poverty rate, with 6 households (15.0%) experiencing poverty. Likewise, among single-mother households, those with 5 or more children have the highest poverty rate, with 3 households (75.0%) falling below the poverty line.
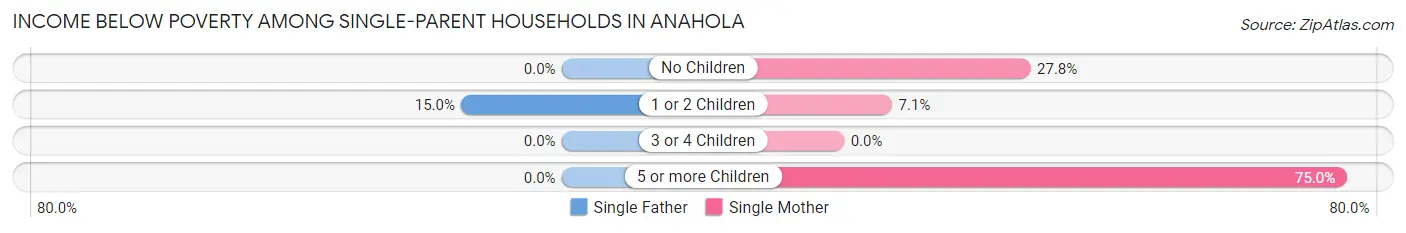
| Children | Single Father | Single Mother |
| No Children | 0 (0.0%) | 15 (27.8%) |
| 1 or 2 Children | 6 (15.0%) | 5 (7.1%) |
| 3 or 4 Children | 0 (0.0%) | 0 (0.0%) |
| 5 or more Children | 0 (0.0%) | 3 (75.0%) |
| Total | 6 (7.9%) | 23 (16.2%) |
Income Below Poverty Among Married-Couple vs Single-Parent Households in Anahola
The poverty data for Anahola shows that 16 of the married-couple family households (3.9%) and 29 of the single-parent households (13.3%) are living below the poverty level. Within the married-couple family households, those with 5 or more children have the highest poverty rate, with 2 households (11.1%) falling below the poverty line. Among the single-parent households, those with 5 or more children have the highest poverty rate, with 3 household (37.5%) living below poverty.
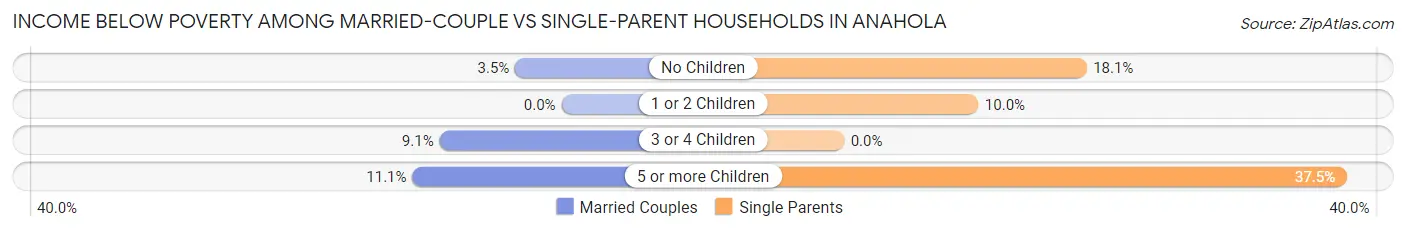
| Children | Married-Couple Families | Single-Parent Households |
| No Children | 9 (3.5%) | 15 (18.1%) |
| 1 or 2 Children | 0 (0.0%) | 11 (10.0%) |
| 3 or 4 Children | 5 (9.1%) | 0 (0.0%) |
| 5 or more Children | 2 (11.1%) | 3 (37.5%) |
| Total | 16 (3.9%) | 29 (13.3%) |
Race in Anahola
The most populous races in Anahola are Hawaiian / Pacific (1,440 | 50.5%), Two or more Races (900 | 31.6%), and White / Caucasian (346 | 12.1%).
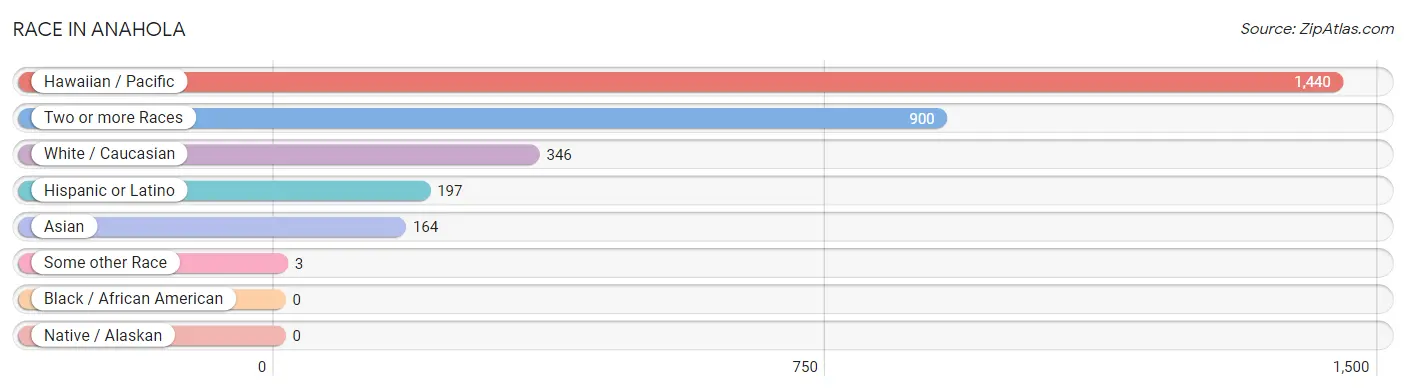
| Race | # Population | % Population |
| Asian | 164 | 5.8% |
| Black / African American | 0 | 0.0% |
| Hawaiian / Pacific | 1,440 | 50.5% |
| Hispanic or Latino | 197 | 6.9% |
| Native / Alaskan | 0 | 0.0% |
| White / Caucasian | 346 | 12.1% |
| Two or more Races | 900 | 31.6% |
| Some other Race | 3 | 0.1% |
| Total | 2,853 | 100.0% |
Ancestry in Anahola
The most populous ancestries reported in Anahola are Native Hawaiian (2,167 | 76.0%), Korean (440 | 15.4%), Indian (Asian) (304 | 10.7%), Portuguese (229 | 8.0%), and Bhutanese (210 | 7.4%), together accounting for 117.4% of all Anahola residents.
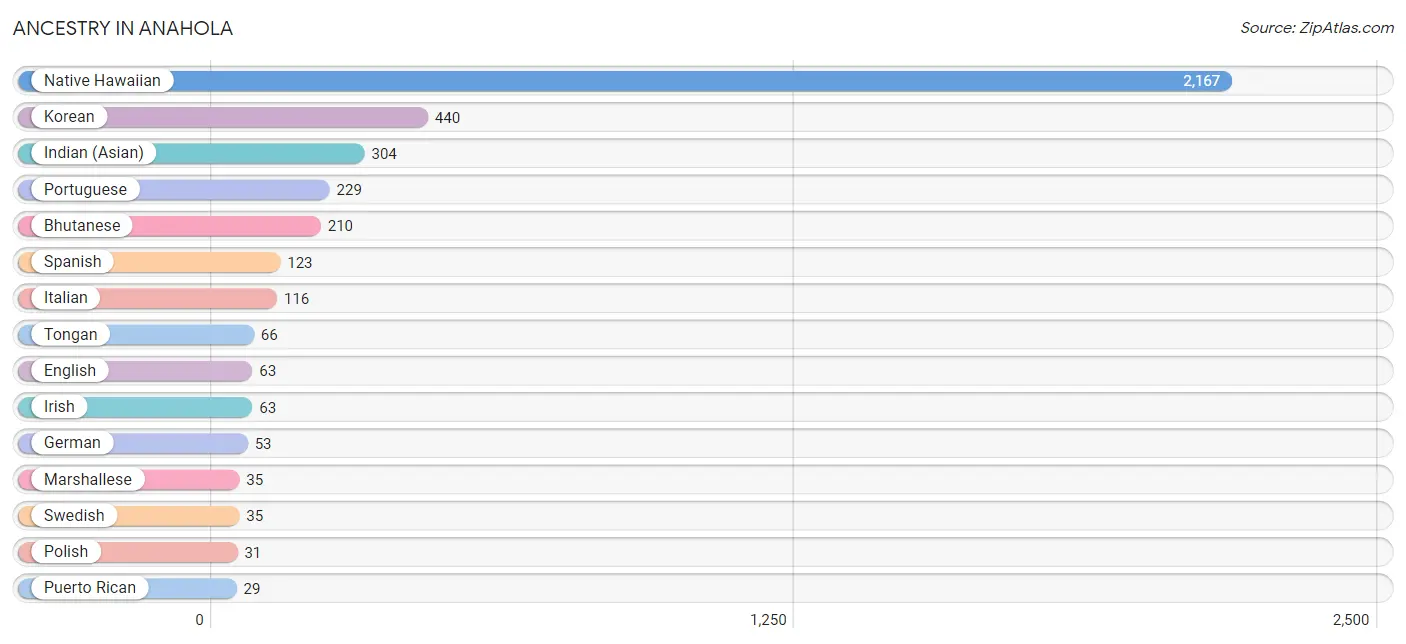
| Ancestry | # Population | % Population |
| African | 3 | 0.1% |
| Apache | 7 | 0.3% |
| Australian | 2 | 0.1% |
| Bhutanese | 210 | 7.4% |
| Blackfeet | 4 | 0.1% |
| British | 3 | 0.1% |
| Burmese | 16 | 0.6% |
| Central American | 4 | 0.1% |
| Central American Indian | 1 | 0.0% |
| Cherokee | 16 | 0.6% |
| Chinese | 24 | 0.8% |
| Dutch | 4 | 0.1% |
| Eastern European | 15 | 0.5% |
| English | 63 | 2.2% |
| European | 6 | 0.2% |
| French | 6 | 0.2% |
| German | 53 | 1.9% |
| Guamanian / Chamorro | 6 | 0.2% |
| Indian (Asian) | 304 | 10.7% |
| Irish | 63 | 2.2% |
| Italian | 116 | 4.1% |
| Korean | 440 | 15.4% |
| Marshallese | 35 | 1.2% |
| Mexican | 19 | 0.7% |
| Mexican American Indian | 7 | 0.3% |
| Native Hawaiian | 2,167 | 76.0% |
| Norwegian | 4 | 0.1% |
| Pakistani | 2 | 0.1% |
| Polish | 31 | 1.1% |
| Portuguese | 229 | 8.0% |
| Puerto Rican | 29 | 1.0% |
| Salvadoran | 4 | 0.1% |
| Samoan | 24 | 0.8% |
| Scandinavian | 10 | 0.4% |
| Scotch-Irish | 4 | 0.1% |
| Scottish | 6 | 0.2% |
| Seminole | 8 | 0.3% |
| Sioux | 13 | 0.5% |
| Spanish | 123 | 4.3% |
| Subsaharan African | 3 | 0.1% |
| Swedish | 35 | 1.2% |
| Thai | 2 | 0.1% |
| Tongan | 66 | 2.3% |
| Welsh | 3 | 0.1% | View All 44 Rows |
Immigrants in Anahola
The most numerous immigrant groups reported in Anahola came from Oceania (46 | 1.6%), Micronesia (39 | 1.4%), Asia (27 | 0.9%), South Eastern Asia (27 | 0.9%), and Philippines (25 | 0.9%), together accounting for 5.8% of all Anahola residents.
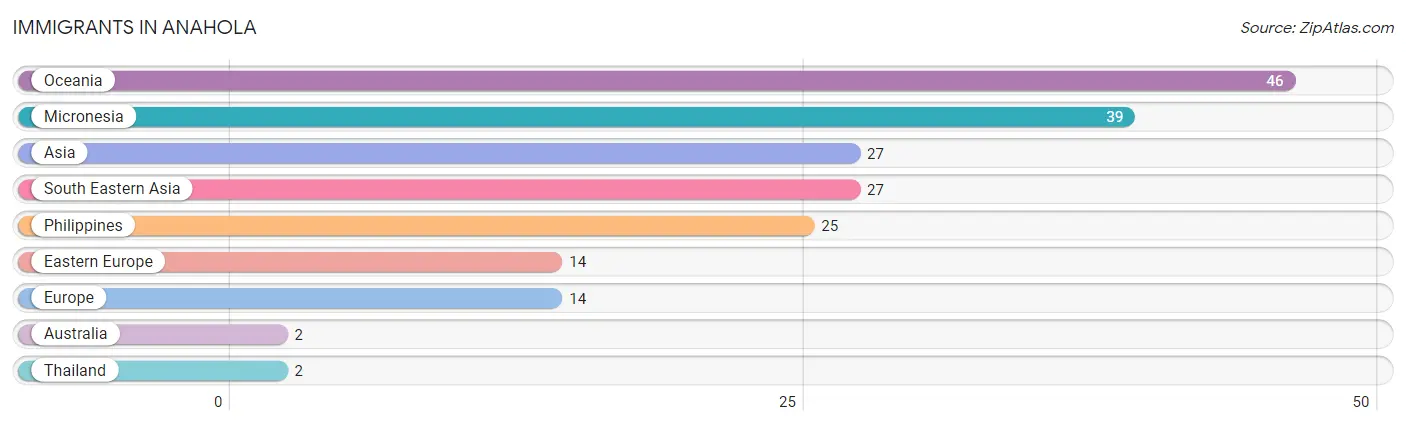
| Immigration Origin | # Population | % Population |
| Asia | 27 | 0.9% |
| Australia | 2 | 0.1% |
| Eastern Europe | 14 | 0.5% |
| Europe | 14 | 0.5% |
| Micronesia | 39 | 1.4% |
| Oceania | 46 | 1.6% |
| Philippines | 25 | 0.9% |
| South Eastern Asia | 27 | 0.9% |
| Thailand | 2 | 0.1% | View All 9 Rows |
Sex and Age in Anahola
Sex and Age in Anahola
The most populous age groups in Anahola are 55 to 59 Years (153 | 11.5%) for men and 20 to 24 Years (125 | 8.2%) for women.
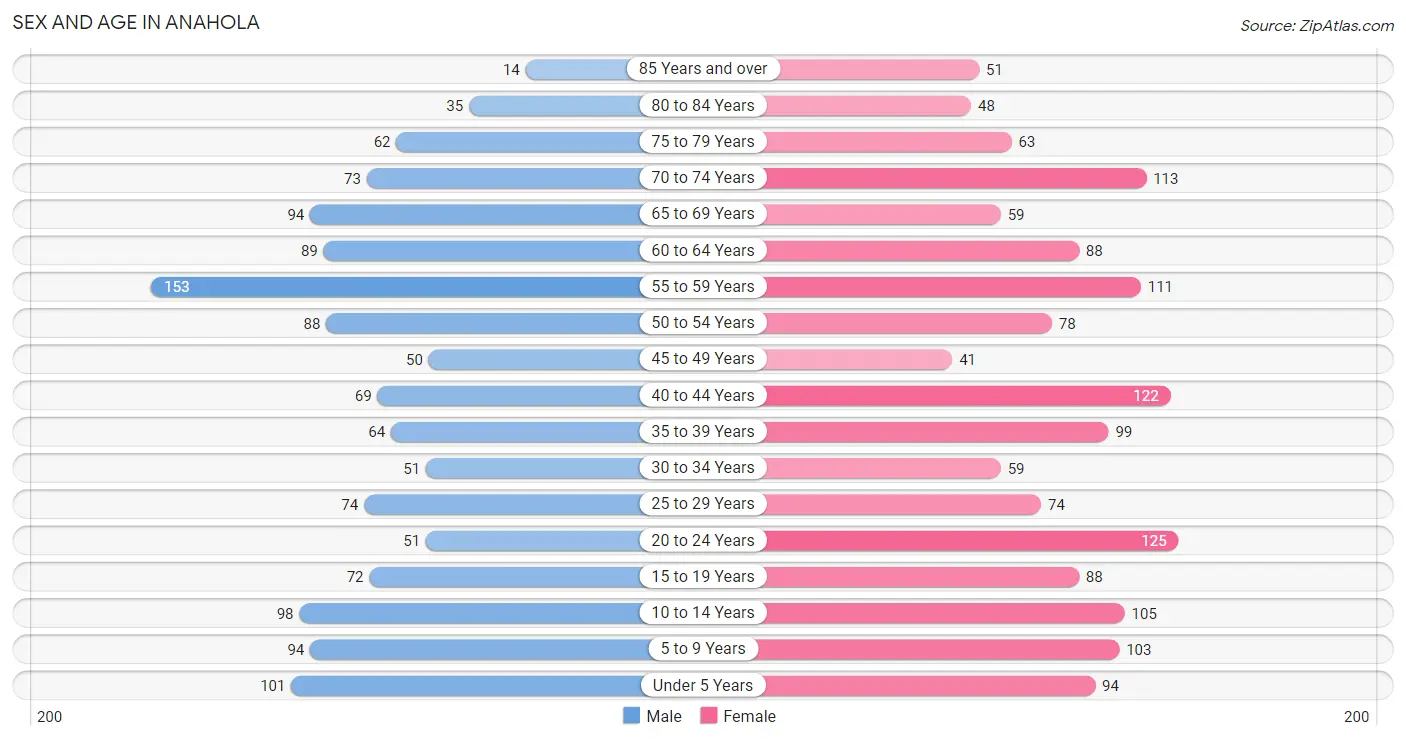
| Age Bracket | Male | Female |
| Under 5 Years | 101 (7.6%) | 94 (6.2%) |
| 5 to 9 Years | 94 (7.1%) | 103 (6.8%) |
| 10 to 14 Years | 98 (7.4%) | 105 (6.9%) |
| 15 to 19 Years | 72 (5.4%) | 88 (5.8%) |
| 20 to 24 Years | 51 (3.8%) | 125 (8.2%) |
| 25 to 29 Years | 74 (5.6%) | 74 (4.9%) |
| 30 to 34 Years | 51 (3.8%) | 59 (3.9%) |
| 35 to 39 Years | 64 (4.8%) | 99 (6.5%) |
| 40 to 44 Years | 69 (5.2%) | 122 (8.0%) |
| 45 to 49 Years | 50 (3.7%) | 41 (2.7%) |
| 50 to 54 Years | 88 (6.6%) | 78 (5.1%) |
| 55 to 59 Years | 153 (11.5%) | 111 (7.3%) |
| 60 to 64 Years | 89 (6.7%) | 88 (5.8%) |
| 65 to 69 Years | 94 (7.1%) | 59 (3.9%) |
| 70 to 74 Years | 73 (5.5%) | 113 (7.4%) |
| 75 to 79 Years | 62 (4.6%) | 63 (4.1%) |
| 80 to 84 Years | 35 (2.6%) | 48 (3.2%) |
| 85 Years and over | 14 (1.1%) | 51 (3.4%) |
| Total | 1,332 (100.0%) | 1,521 (100.0%) |
Families and Households in Anahola
Median Family Size in Anahola
The median family size in Anahola is 4.06 persons per family, with single female/mother families (142 | 22.7%) accounting for the largest median family size of 5.08 persons per family. On the other hand, single male/father families (76 | 12.2%) represent the smallest median family size with 3.53 persons per family.
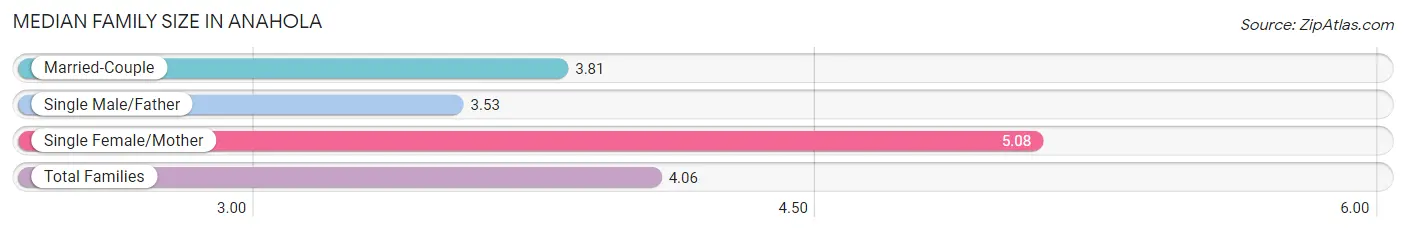
| Family Type | # Families | Family Size |
| Married-Couple | 407 (65.1%) | 3.81 |
| Single Male/Father | 76 (12.2%) | 3.53 |
| Single Female/Mother | 142 (22.7%) | 5.08 |
| Total Families | 625 (100.0%) | 4.06 |
Median Household Size in Anahola
The median household size in Anahola is 3.70 persons per household, with single female/mother households (142 | 18.4%) accounting for the largest median household size of 5.71 persons per household. non-family households (147 | 19.0%) represent the smallest median household size with 1.26 persons per household.
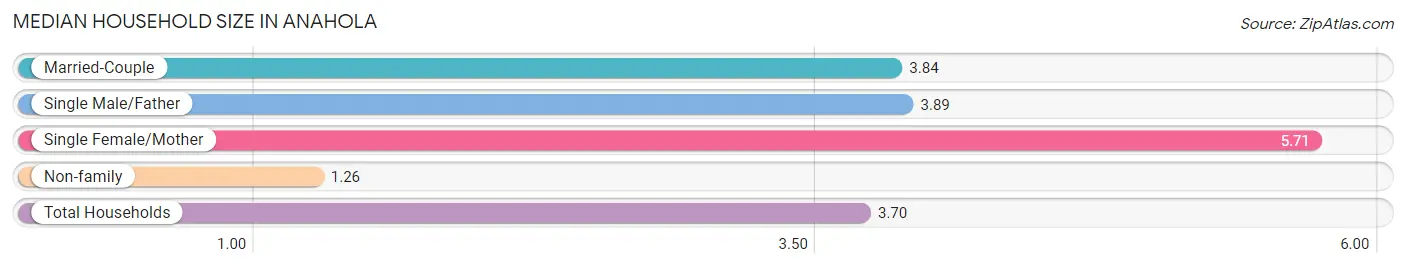
| Household Type | # Households | Household Size |
| Married-Couple | 407 (52.7%) | 3.84 |
| Single Male/Father | 76 (9.8%) | 3.89 |
| Single Female/Mother | 142 (18.4%) | 5.71 |
| Non-family | 147 (19.0%) | 1.26 |
| Total Households | 772 (100.0%) | 3.70 |
Household Size by Marriage Status in Anahola
Out of a total of 772 households in Anahola, 625 (81.0%) are family households, while 147 (19.0%) are nonfamily households. The most numerous type of family households are 2-person households, comprising 230, and the most common type of nonfamily households are 1-person households, comprising 121.
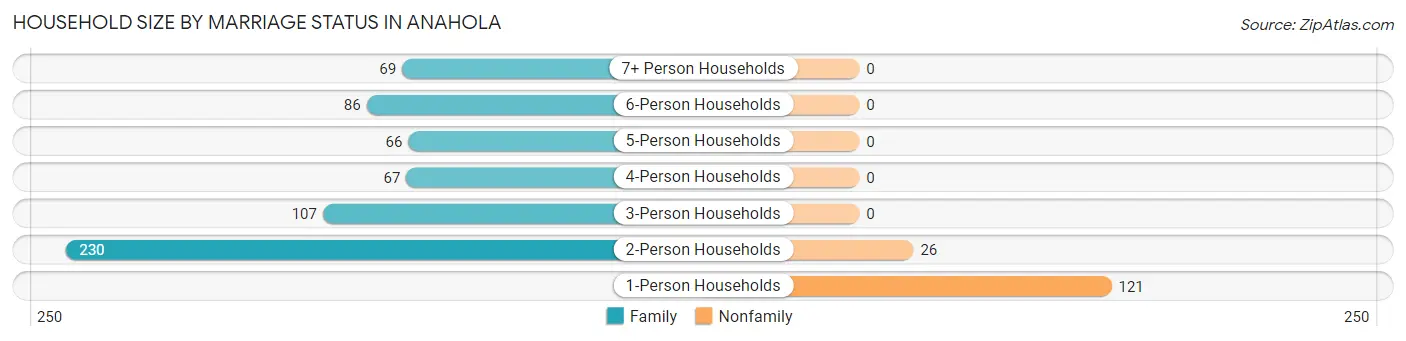
| Household Size | Family Households | Nonfamily Households |
| 1-Person Households | - | 121 (15.7%) |
| 2-Person Households | 230 (29.8%) | 26 (3.4%) |
| 3-Person Households | 107 (13.9%) | 0 (0.0%) |
| 4-Person Households | 67 (8.7%) | 0 (0.0%) |
| 5-Person Households | 66 (8.6%) | 0 (0.0%) |
| 6-Person Households | 86 (11.1%) | 0 (0.0%) |
| 7+ Person Households | 69 (8.9%) | 0 (0.0%) |
| Total | 625 (81.0%) | 147 (19.0%) |
Female Fertility in Anahola
Fertility by Age in Anahola
Average fertility rate in Anahola is 193.0 births per 1,000 women. Women in the age bracket of 35 to 50 years have the highest fertility rate with 295.0 births per 1,000 women. Women in the age bracket of 35 to 50 years acount for 67.5% of all women with births.
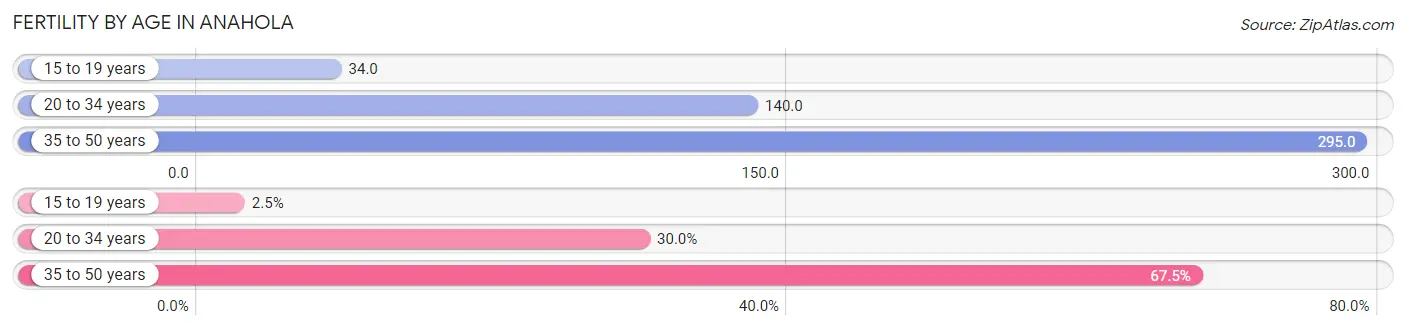
| Age Bracket | Women with Births | Births / 1,000 Women |
| 15 to 19 years | 3 (2.5%) | 34.0 |
| 20 to 34 years | 36 (30.0%) | 140.0 |
| 35 to 50 years | 81 (67.5%) | 295.0 |
| Total | 120 (100.0%) | 193.0 |
Fertility by Age by Marriage Status in Anahola
59.2% of women with births (120) in Anahola are married. The highest percentage of unmarried women with births falls into 15 to 19 years age bracket with 100.0% of them unmarried at the time of birth, while the lowest percentage of unmarried women with births belong to 20 to 34 years age bracket with 25.0% of them unmarried.
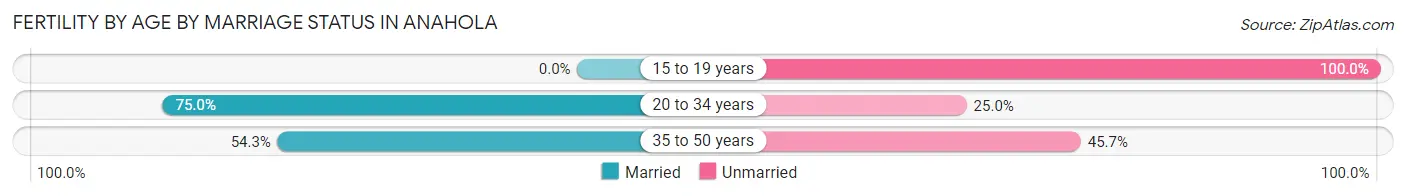
| Age Bracket | Married | Unmarried |
| 15 to 19 years | 0 (0.0%) | 3 (100.0%) |
| 20 to 34 years | 27 (75.0%) | 9 (25.0%) |
| 35 to 50 years | 44 (54.3%) | 37 (45.7%) |
| Total | 71 (59.2%) | 49 (40.8%) |
Fertility by Education in Anahola
Average fertility rate in Anahola is 193.0 births per 1,000 women. Women with the education attainment of college or associate's degree have the highest fertility rate of 273.0 births per 1,000 women, while women with the education attainment of less than high school have the lowest fertility at 43.0 births per 1,000 women. Women with the education attainment of college or associate's degree represent 45.0% of all women with births.
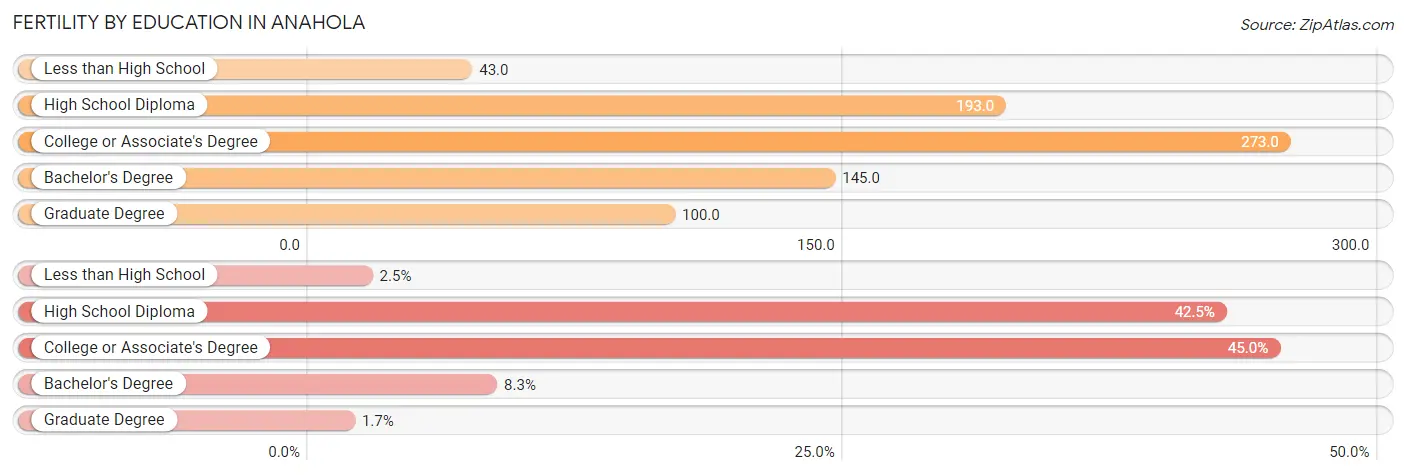
| Educational Attainment | Women with Births | Births / 1,000 Women |
| Less than High School | 3 (2.5%) | 43.0 |
| High School Diploma | 51 (42.5%) | 193.0 |
| College or Associate's Degree | 54 (45.0%) | 273.0 |
| Bachelor's Degree | 10 (8.3%) | 145.0 |
| Graduate Degree | 2 (1.7%) | 100.0 |
| Total | 120 (100.0%) | 193.0 |
Fertility by Education by Marriage Status in Anahola
40.8% of women with births in Anahola are unmarried. Women with the educational attainment of less than high school are most likely to be married with 100.0% of them married at childbirth, while women with the educational attainment of high school diploma are least likely to be married with 58.8% of them unmarried at childbirth.
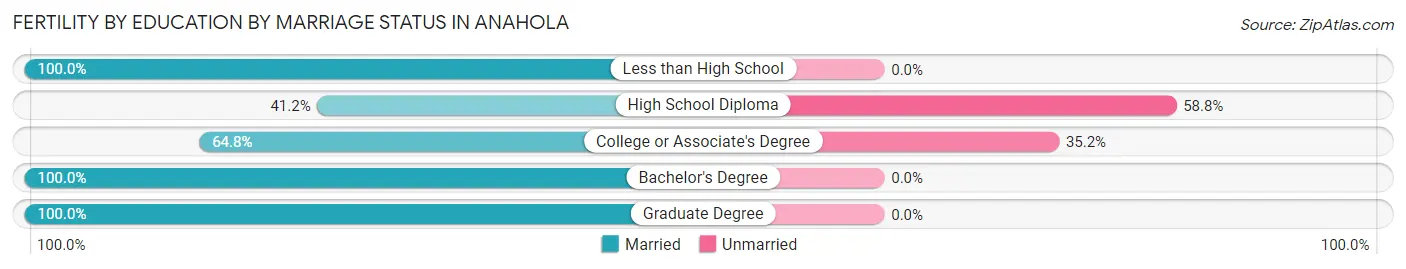
| Educational Attainment | Married | Unmarried |
| Less than High School | 3 (100.0%) | 0 (0.0%) |
| High School Diploma | 21 (41.2%) | 30 (58.8%) |
| College or Associate's Degree | 35 (64.8%) | 19 (35.2%) |
| Bachelor's Degree | 10 (100.0%) | 0 (0.0%) |
| Graduate Degree | 2 (100.0%) | 0 (0.0%) |
| Total | 71 (59.2%) | 49 (40.8%) |
Employment Characteristics in Anahola
Employment by Class of Employer in Anahola
Among the 1,047 employed individuals in Anahola, private company employees (700 | 66.9%), state government employees (123 | 11.7%), and self-employed (not incorporated) (81 | 7.7%) make up the most common classes of employment.
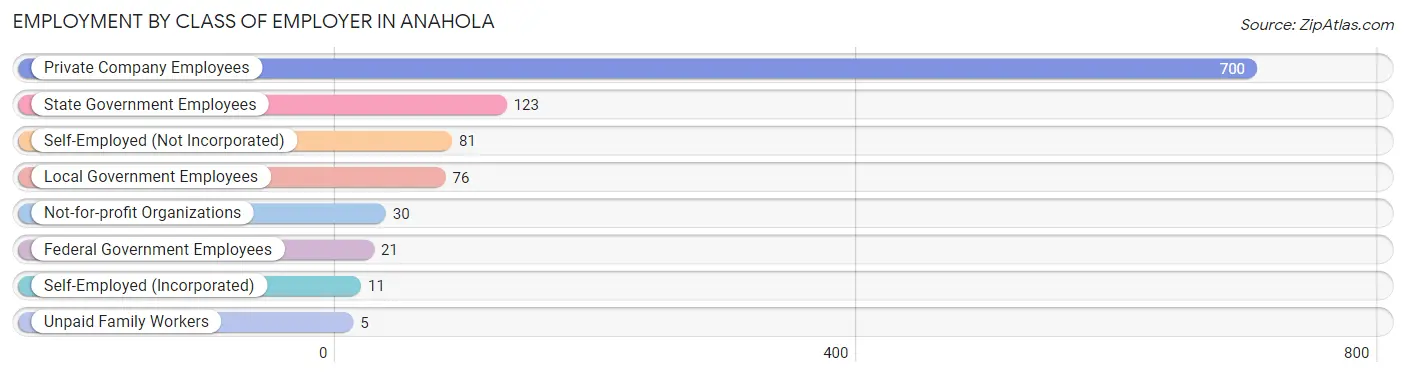
| Employer Class | # Employees | % Employees |
| Private Company Employees | 700 | 66.9% |
| Self-Employed (Incorporated) | 11 | 1.1% |
| Self-Employed (Not Incorporated) | 81 | 7.7% |
| Not-for-profit Organizations | 30 | 2.9% |
| Local Government Employees | 76 | 7.3% |
| State Government Employees | 123 | 11.7% |
| Federal Government Employees | 21 | 2.0% |
| Unpaid Family Workers | 5 | 0.5% |
| Total | 1,047 | 100.0% |
Employment Status by Age in Anahola
According to the labor force statistics for Anahola, out of the total population over 16 years of age (2,224), 53.3% or 1,185 individuals are in the labor force, with 6.2% or 73 of them unemployed. The age group with the highest labor force participation rate is 45 to 54 years, with 96.9% or 249 individuals in the labor force. Within the labor force, the 16 to 19 years age range has the highest percentage of unemployed individuals, with 27.0% or 10 of them being unemployed.
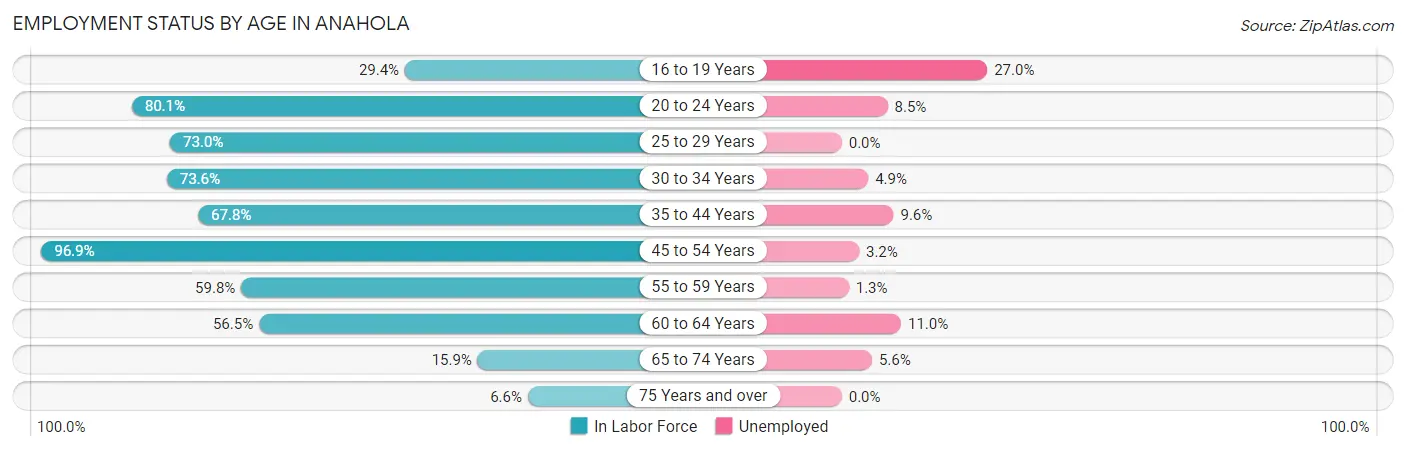
| Age Bracket | In Labor Force | Unemployed |
| 16 to 19 Years | 37 (29.4%) | 10 (27.0%) |
| 20 to 24 Years | 141 (80.1%) | 12 (8.5%) |
| 25 to 29 Years | 108 (73.0%) | 0 (0.0%) |
| 30 to 34 Years | 81 (73.6%) | 4 (4.9%) |
| 35 to 44 Years | 240 (67.8%) | 23 (9.6%) |
| 45 to 54 Years | 249 (96.9%) | 8 (3.2%) |
| 55 to 59 Years | 158 (59.8%) | 2 (1.3%) |
| 60 to 64 Years | 100 (56.5%) | 11 (11.0%) |
| 65 to 74 Years | 54 (15.9%) | 3 (5.6%) |
| 75 Years and over | 18 (6.6%) | 0 (0.0%) |
| Total | 1,185 (53.3%) | 73 (6.2%) |
Employment Status by Educational Attainment in Anahola
According to labor force statistics for Anahola, 71.5% of individuals (937) out of the total population between 25 and 64 years of age (1,310) are in the labor force, with 5.1% or 48 of them being unemployed. The group with the highest labor force participation rate are those with the educational attainment of bachelor's degree or higher, with 76.7% or 115 individuals in the labor force. Within the labor force, individuals with high school diploma education have the highest percentage of unemployment, with 9.1% or 44 of them being unemployed.
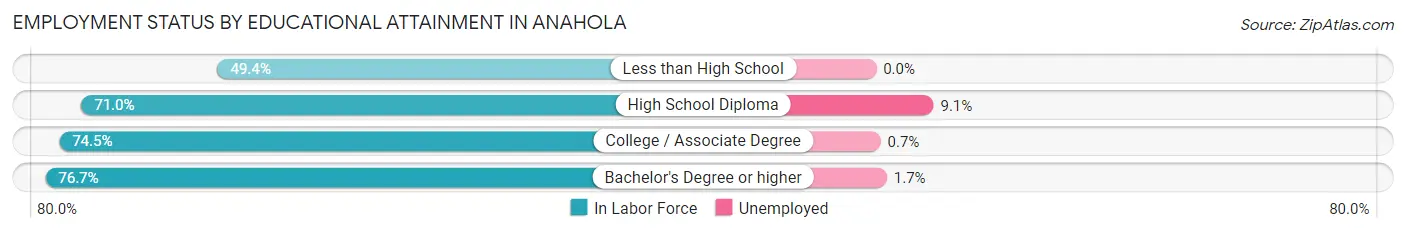
| Educational Attainment | In Labor Force | Unemployed |
| Less than High School | 39 (49.4%) | 0 (0.0%) |
| High School Diploma | 481 (71.0%) | 62 (9.1%) |
| College / Associate Degree | 301 (74.5%) | 3 (0.7%) |
| Bachelor's Degree or higher | 115 (76.7%) | 3 (1.7%) |
| Total | 937 (71.5%) | 67 (5.1%) |
Employment Occupations by Sex in Anahola
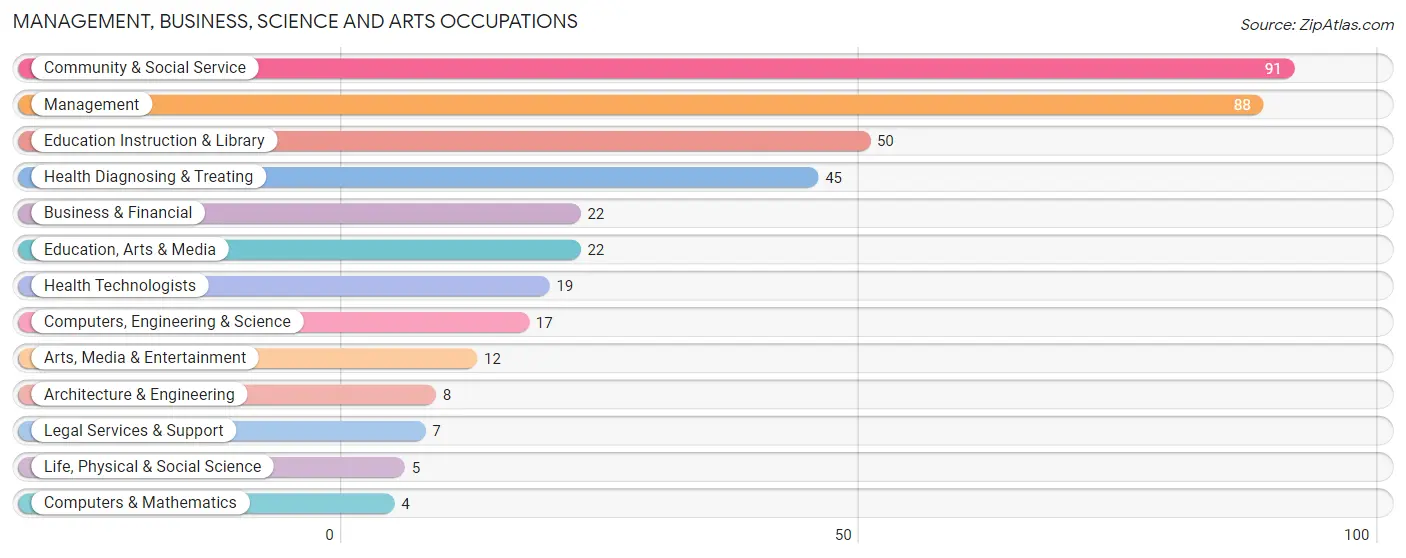
Management, Business, Science and Arts Occupations
The most common Management, Business, Science and Arts occupations in Anahola are Community & Social Service (91 | 8.2%), Management (88 | 7.9%), Education Instruction & Library (50 | 4.5%), Health Diagnosing & Treating (45 | 4.0%), and Business & Financial (22 | 2.0%).
Management, Business, Science and Arts Occupations by Sex
Within the Management, Business, Science and Arts occupations in Anahola, the most male-oriented occupations are Computers & Mathematics (100.0%), Legal Services & Support (71.4%), and Business & Financial (45.5%), while the most female-oriented occupations are Life, Physical & Social Science (100.0%), Health Technologists (100.0%), and Health Diagnosing & Treating (91.1%).
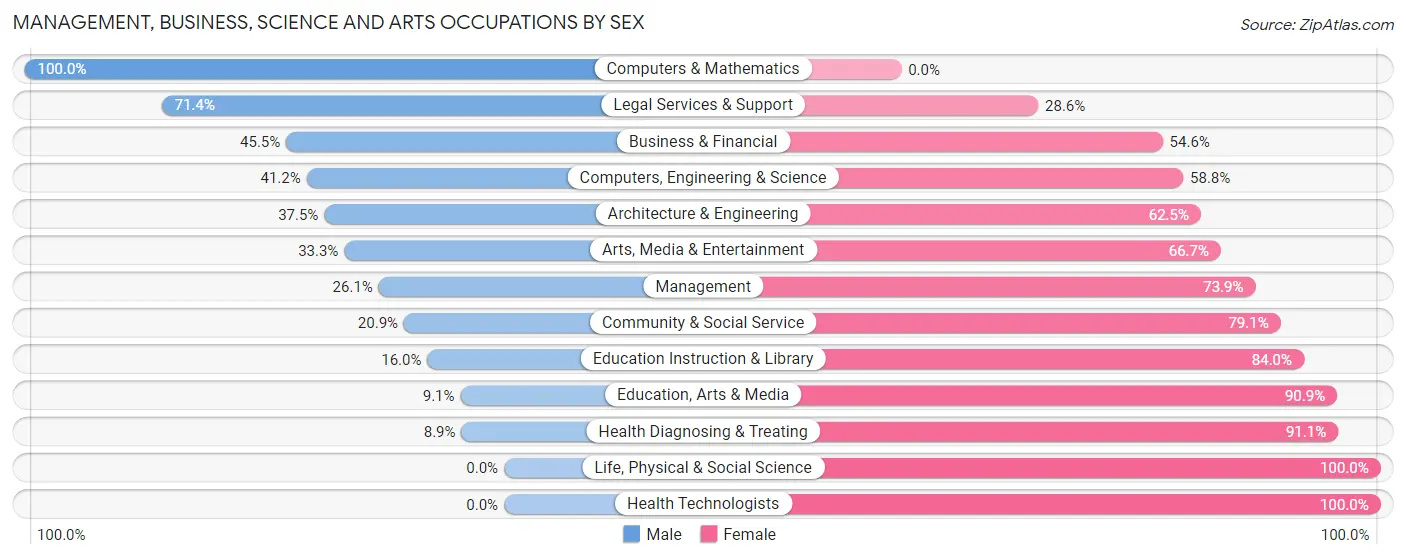
| Occupation | Male | Female |
| Management | 23 (26.1%) | 65 (73.9%) |
| Business & Financial | 10 (45.5%) | 12 (54.5%) |
| Computers, Engineering & Science | 7 (41.2%) | 10 (58.8%) |
| Computers & Mathematics | 4 (100.0%) | 0 (0.0%) |
| Architecture & Engineering | 3 (37.5%) | 5 (62.5%) |
| Life, Physical & Social Science | 0 (0.0%) | 5 (100.0%) |
| Community & Social Service | 19 (20.9%) | 72 (79.1%) |
| Education, Arts & Media | 2 (9.1%) | 20 (90.9%) |
| Legal Services & Support | 5 (71.4%) | 2 (28.6%) |
| Education Instruction & Library | 8 (16.0%) | 42 (84.0%) |
| Arts, Media & Entertainment | 4 (33.3%) | 8 (66.7%) |
| Health Diagnosing & Treating | 4 (8.9%) | 41 (91.1%) |
| Health Technologists | 0 (0.0%) | 19 (100.0%) |
| Total (Category) | 63 (23.9%) | 200 (76.0%) |
| Total (Overall) | 494 (44.4%) | 619 (55.6%) |
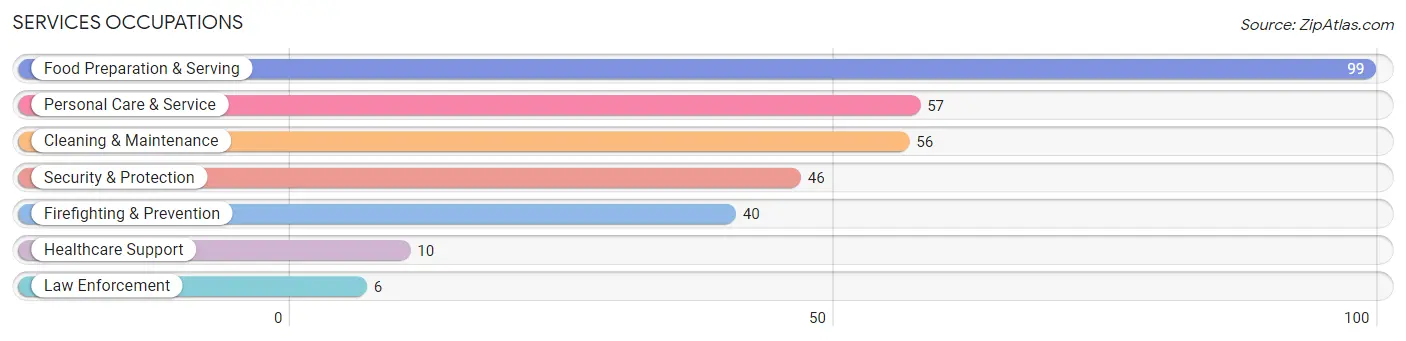
Services Occupations
The most common Services occupations in Anahola are Food Preparation & Serving (99 | 8.9%), Personal Care & Service (57 | 5.1%), Cleaning & Maintenance (56 | 5.0%), Security & Protection (46 | 4.1%), and Firefighting & Prevention (40 | 3.6%).
Services Occupations by Sex
Within the Services occupations in Anahola, the most male-oriented occupations are Law Enforcement (100.0%), Cleaning & Maintenance (82.1%), and Security & Protection (43.5%), while the most female-oriented occupations are Healthcare Support (100.0%), Personal Care & Service (86.0%), and Food Preparation & Serving (68.7%).
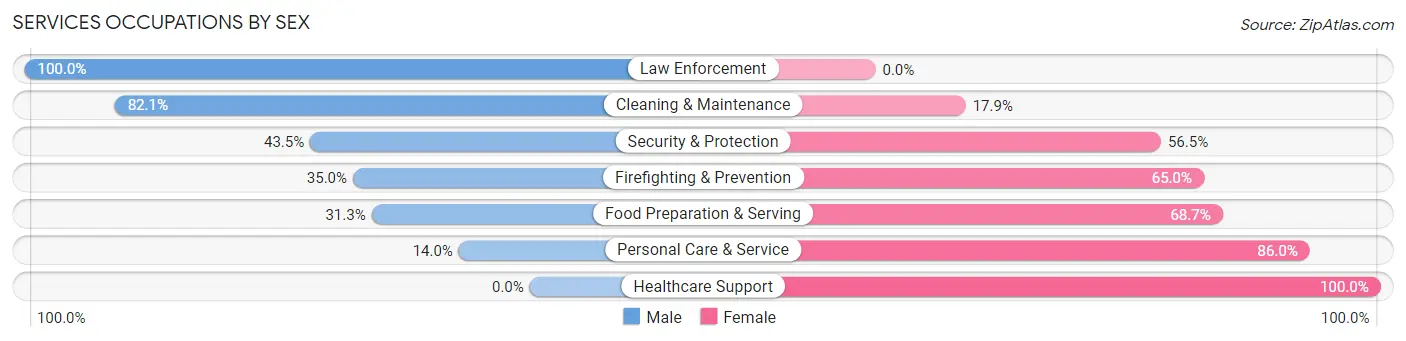
| Occupation | Male | Female |
| Healthcare Support | 0 (0.0%) | 10 (100.0%) |
| Security & Protection | 20 (43.5%) | 26 (56.5%) |
| Firefighting & Prevention | 14 (35.0%) | 26 (65.0%) |
| Law Enforcement | 6 (100.0%) | 0 (0.0%) |
| Food Preparation & Serving | 31 (31.3%) | 68 (68.7%) |
| Cleaning & Maintenance | 46 (82.1%) | 10 (17.9%) |
| Personal Care & Service | 8 (14.0%) | 49 (86.0%) |
| Total (Category) | 105 (39.2%) | 163 (60.8%) |
| Total (Overall) | 494 (44.4%) | 619 (55.6%) |
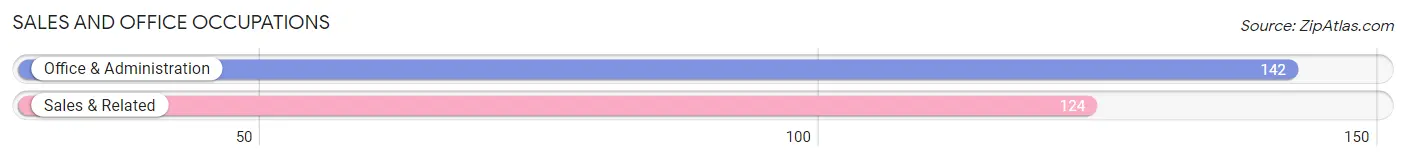
Sales and Office Occupations
The most common Sales and Office occupations in Anahola are Office & Administration (142 | 12.8%), and Sales & Related (124 | 11.1%).
Sales and Office Occupations by Sex
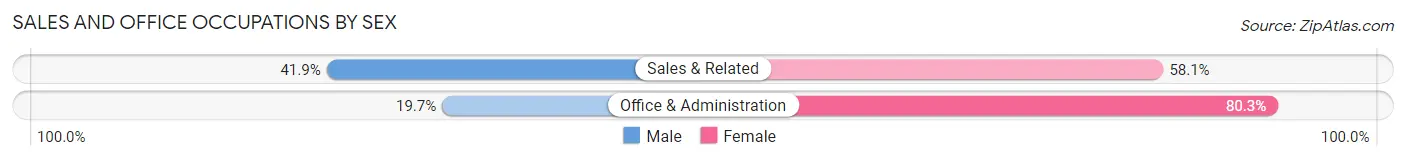
| Occupation | Male | Female |
| Sales & Related | 52 (41.9%) | 72 (58.1%) |
| Office & Administration | 28 (19.7%) | 114 (80.3%) |
| Total (Category) | 80 (30.1%) | 186 (69.9%) |
| Total (Overall) | 494 (44.4%) | 619 (55.6%) |
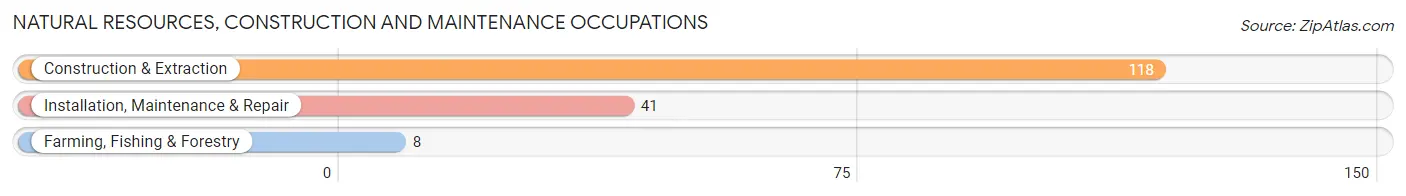
Natural Resources, Construction and Maintenance Occupations
The most common Natural Resources, Construction and Maintenance occupations in Anahola are Construction & Extraction (118 | 10.6%), Installation, Maintenance & Repair (41 | 3.7%), and Farming, Fishing & Forestry (8 | 0.7%).
Natural Resources, Construction and Maintenance Occupations by Sex
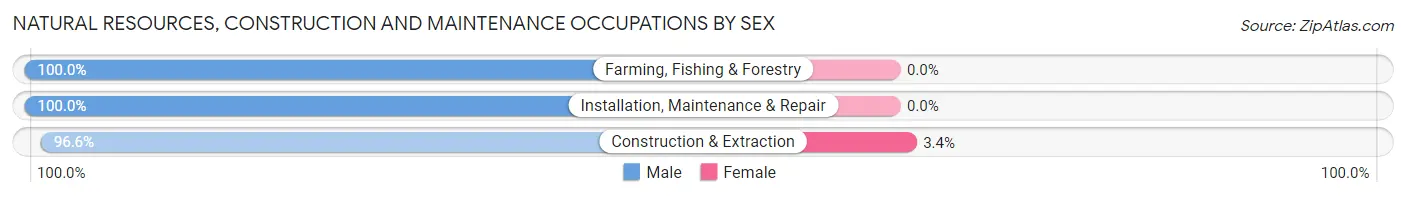
| Occupation | Male | Female |
| Farming, Fishing & Forestry | 8 (100.0%) | 0 (0.0%) |
| Construction & Extraction | 114 (96.6%) | 4 (3.4%) |
| Installation, Maintenance & Repair | 41 (100.0%) | 0 (0.0%) |
| Total (Category) | 163 (97.6%) | 4 (2.4%) |
| Total (Overall) | 494 (44.4%) | 619 (55.6%) |
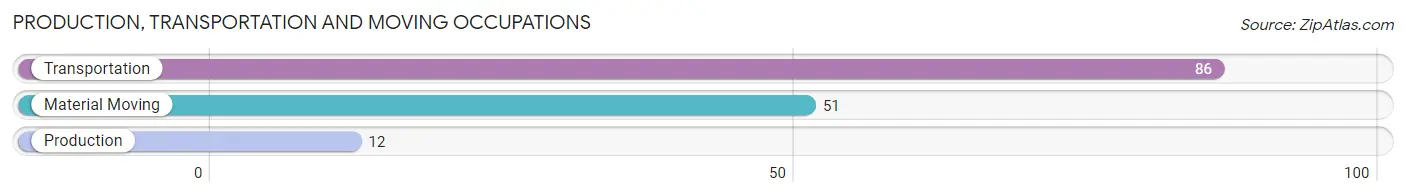
Production, Transportation and Moving Occupations
The most common Production, Transportation and Moving occupations in Anahola are Transportation (86 | 7.7%), Material Moving (51 | 4.6%), and Production (12 | 1.1%).
Production, Transportation and Moving Occupations by Sex
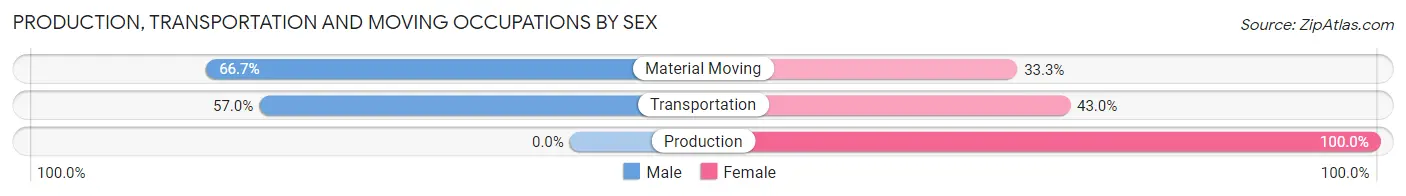
| Occupation | Male | Female |
| Production | 0 (0.0%) | 12 (100.0%) |
| Transportation | 49 (57.0%) | 37 (43.0%) |
| Material Moving | 34 (66.7%) | 17 (33.3%) |
| Total (Category) | 83 (55.7%) | 66 (44.3%) |
| Total (Overall) | 494 (44.4%) | 619 (55.6%) |
Employment Industries by Sex in Anahola
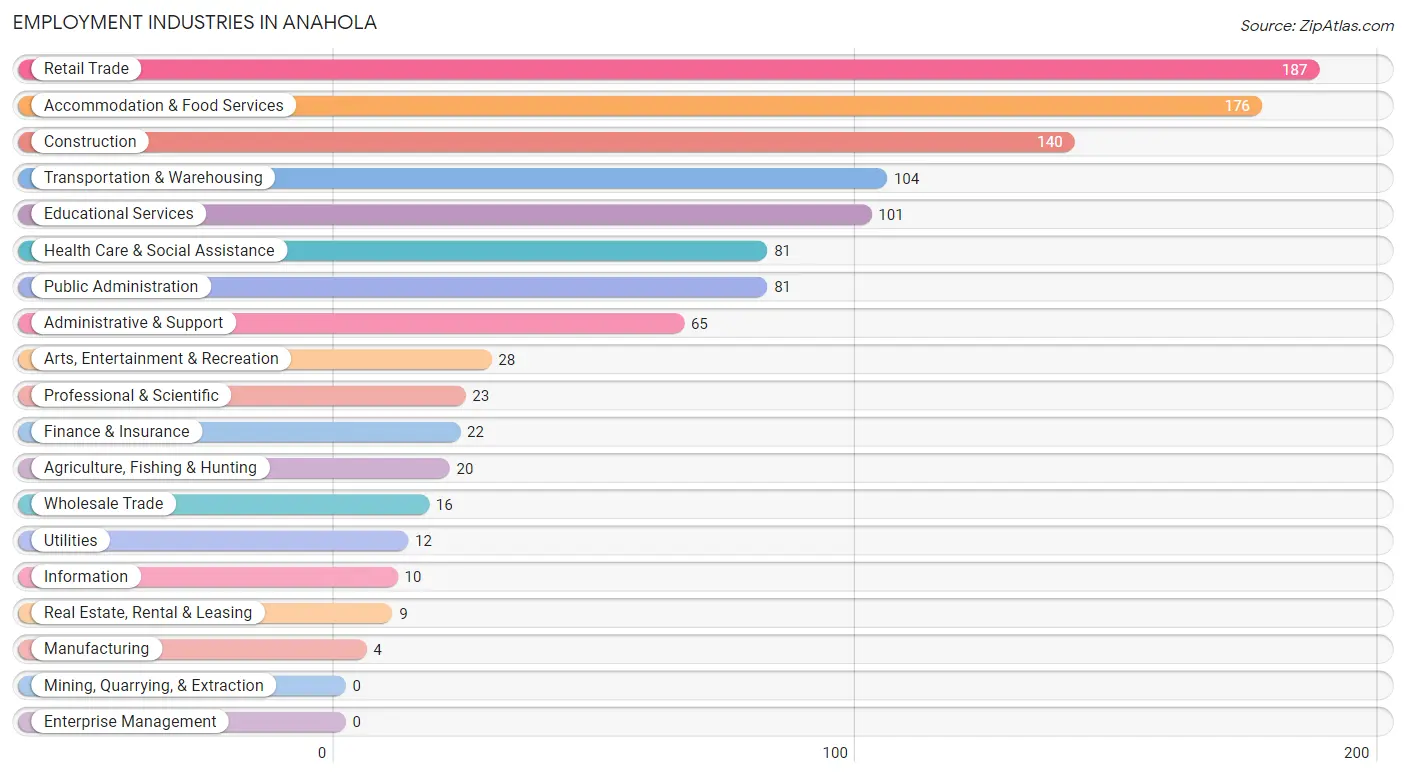
Employment Industries in Anahola
The major employment industries in Anahola include Retail Trade (187 | 16.8%), Accommodation & Food Services (176 | 15.8%), Construction (140 | 12.6%), Transportation & Warehousing (104 | 9.3%), and Educational Services (101 | 9.1%).
Employment Industries by Sex in Anahola
The Anahola industries that see more men than women are Construction (92.1%), Administrative & Support (81.5%), and Agriculture, Fishing & Hunting (80.0%), whereas the industries that tend to have a higher number of women are Manufacturing (100.0%), Finance & Insurance (100.0%), and Real Estate, Rental & Leasing (100.0%).
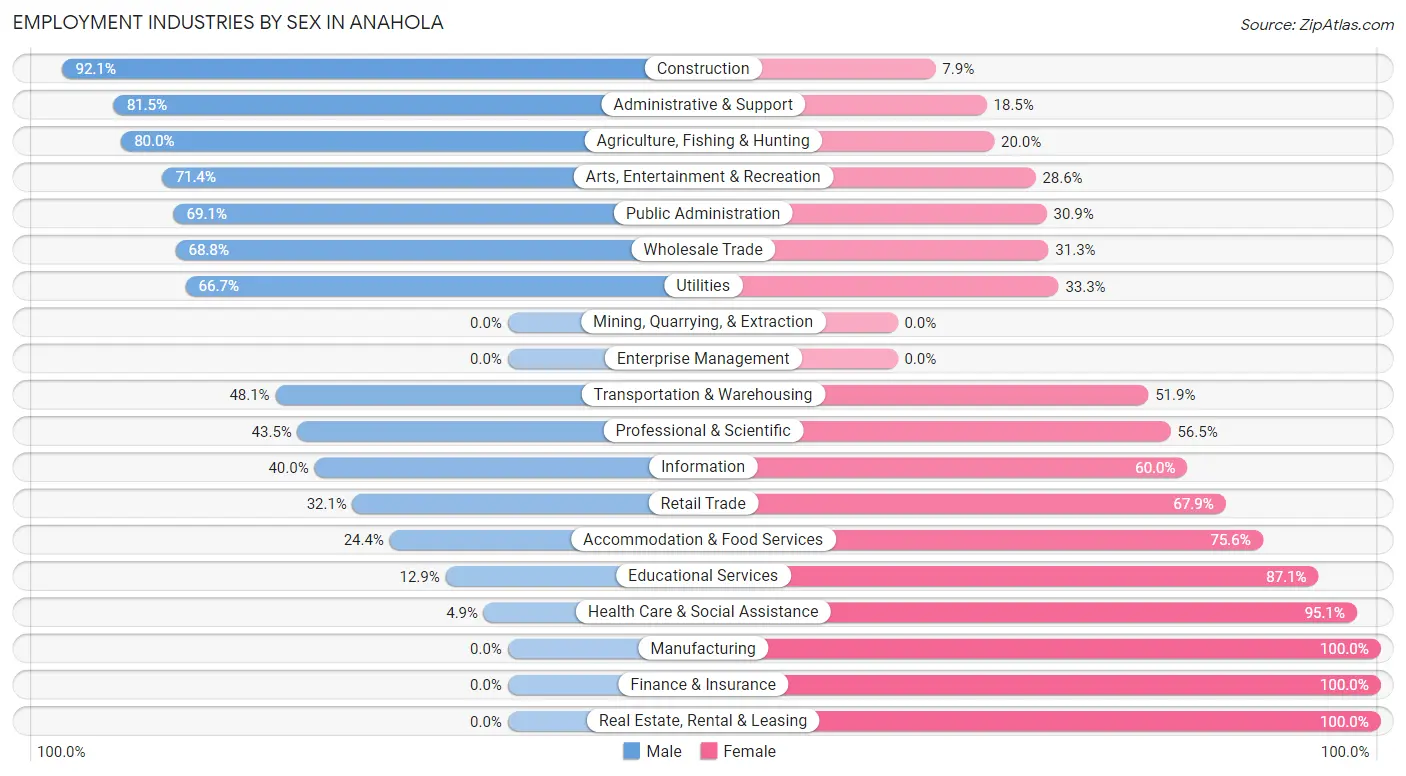
| Industry | Male | Female |
| Agriculture, Fishing & Hunting | 16 (80.0%) | 4 (20.0%) |
| Mining, Quarrying, & Extraction | 0 (0.0%) | 0 (0.0%) |
| Construction | 129 (92.1%) | 11 (7.9%) |
| Manufacturing | 0 (0.0%) | 4 (100.0%) |
| Wholesale Trade | 11 (68.8%) | 5 (31.2%) |
| Retail Trade | 60 (32.1%) | 127 (67.9%) |
| Transportation & Warehousing | 50 (48.1%) | 54 (51.9%) |
| Utilities | 8 (66.7%) | 4 (33.3%) |
| Information | 4 (40.0%) | 6 (60.0%) |
| Finance & Insurance | 0 (0.0%) | 22 (100.0%) |
| Real Estate, Rental & Leasing | 0 (0.0%) | 9 (100.0%) |
| Professional & Scientific | 10 (43.5%) | 13 (56.5%) |
| Enterprise Management | 0 (0.0%) | 0 (0.0%) |
| Administrative & Support | 53 (81.5%) | 12 (18.5%) |
| Educational Services | 13 (12.9%) | 88 (87.1%) |
| Health Care & Social Assistance | 4 (4.9%) | 77 (95.1%) |
| Arts, Entertainment & Recreation | 20 (71.4%) | 8 (28.6%) |
| Accommodation & Food Services | 43 (24.4%) | 133 (75.6%) |
| Public Administration | 56 (69.1%) | 25 (30.9%) |
| Total | 494 (44.4%) | 619 (55.6%) |
Education in Anahola
School Enrollment in Anahola
The most common levels of schooling among the 675 students in Anahola are elementary school (170 | 25.2%), middle school (149 | 22.1%), and high school (141 | 20.9%).
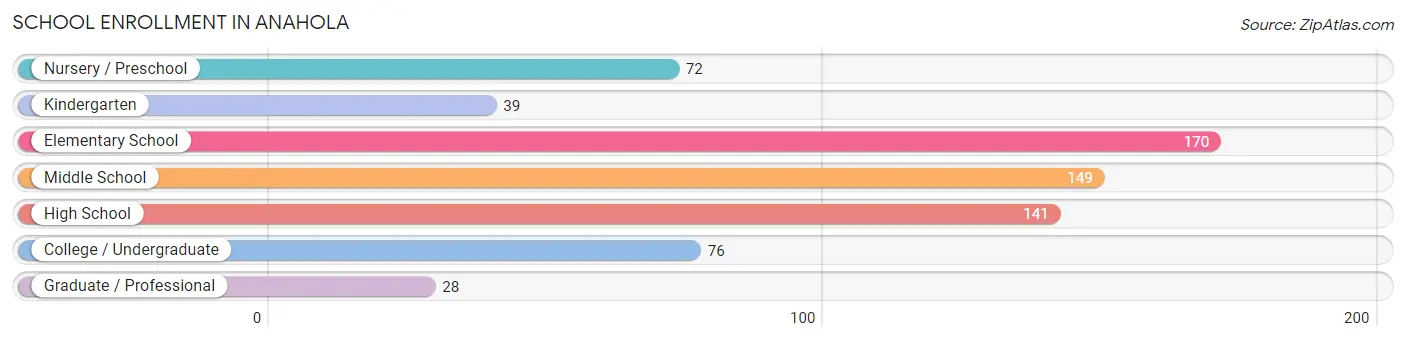
| School Level | # Students | % Students |
| Nursery / Preschool | 72 | 10.7% |
| Kindergarten | 39 | 5.8% |
| Elementary School | 170 | 25.2% |
| Middle School | 149 | 22.1% |
| High School | 141 | 20.9% |
| College / Undergraduate | 76 | 11.3% |
| Graduate / Professional | 28 | 4.2% |
| Total | 675 | 100.0% |
School Enrollment by Age by Funding Source in Anahola
Out of a total of 675 students who are enrolled in schools in Anahola, 159 (23.6%) attend a private institution, while the remaining 516 (76.4%) are enrolled in public schools. The age group of 20 to 24 year olds has the highest likelihood of being enrolled in private schools, with 22 (81.5% in the age bracket) enrolled. Conversely, the age group of 18 to 19 year olds has the lowest likelihood of being enrolled in a private school, with 51 (100.0% in the age bracket) attending a public institution.
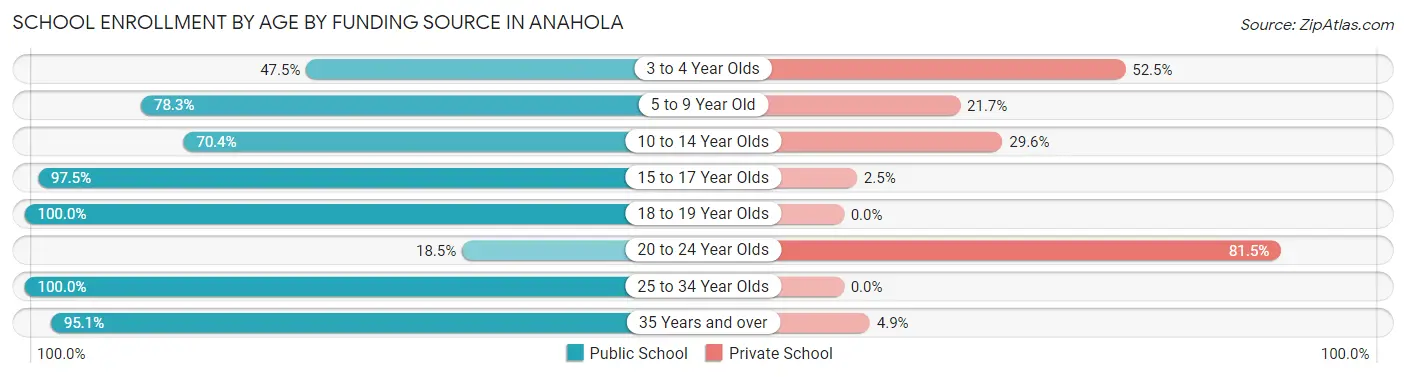
| Age Bracket | Public School | Private School |
| 3 to 4 Year Olds | 29 (47.5%) | 32 (52.5%) |
| 5 to 9 Year Old | 148 (78.3%) | 41 (21.7%) |
| 10 to 14 Year Olds | 143 (70.4%) | 60 (29.6%) |
| 15 to 17 Year Olds | 79 (97.5%) | 2 (2.5%) |
| 18 to 19 Year Olds | 51 (100.0%) | 0 (0.0%) |
| 20 to 24 Year Olds | 5 (18.5%) | 22 (81.5%) |
| 25 to 34 Year Olds | 22 (100.0%) | 0 (0.0%) |
| 35 Years and over | 39 (95.1%) | 2 (4.9%) |
| Total | 516 (76.4%) | 159 (23.6%) |
Educational Attainment by Field of Study in Anahola
Education (99 | 35.5%), business (67 | 24.0%), science & technology (28 | 10.0%), literature & languages (26 | 9.3%), and arts & humanities (20 | 7.2%) are the most common fields of study among 279 individuals in Anahola who have obtained a bachelor's degree or higher.
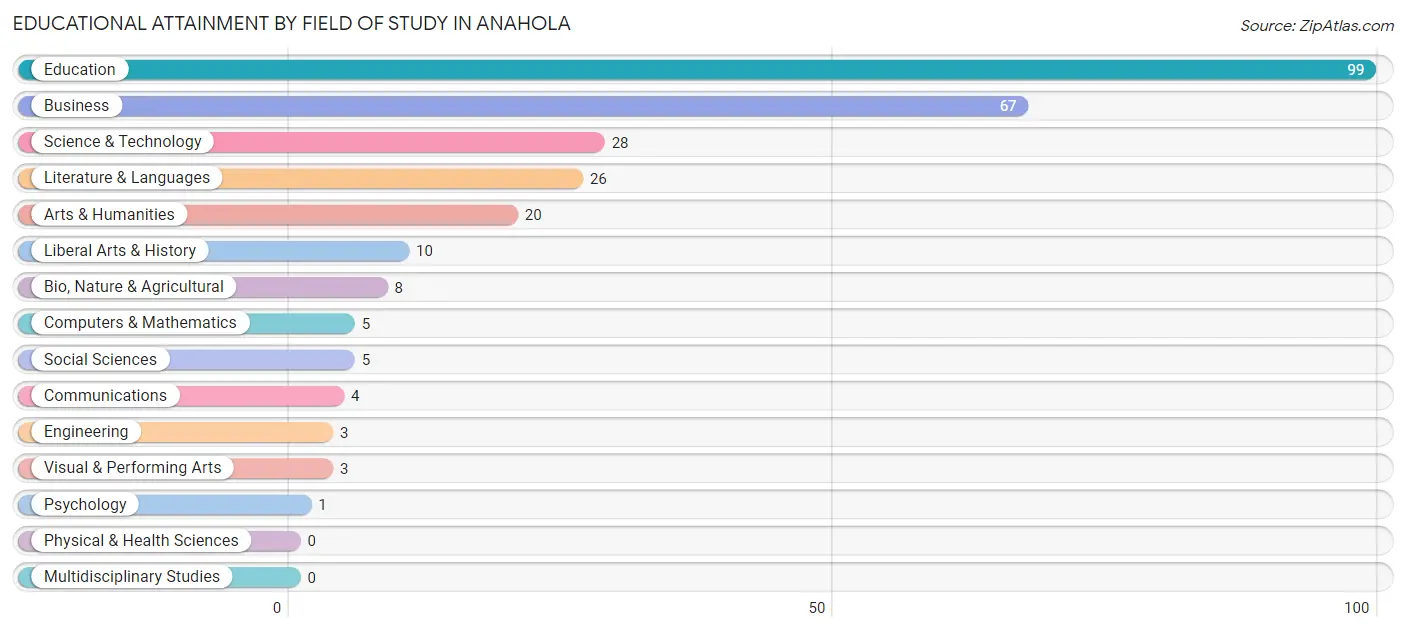
| Field of Study | # Graduates | % Graduates |
| Computers & Mathematics | 5 | 1.8% |
| Bio, Nature & Agricultural | 8 | 2.9% |
| Physical & Health Sciences | 0 | 0.0% |
| Psychology | 1 | 0.4% |
| Social Sciences | 5 | 1.8% |
| Engineering | 3 | 1.1% |
| Multidisciplinary Studies | 0 | 0.0% |
| Science & Technology | 28 | 10.0% |
| Business | 67 | 24.0% |
| Education | 99 | 35.5% |
| Literature & Languages | 26 | 9.3% |
| Liberal Arts & History | 10 | 3.6% |
| Visual & Performing Arts | 3 | 1.1% |
| Communications | 4 | 1.4% |
| Arts & Humanities | 20 | 7.2% |
| Total | 279 | 100.0% |
Transportation & Commute in Anahola
Vehicle Availability by Sex in Anahola
The most prevalent vehicle ownership categories in Anahola are males with 3 vehicles (160, accounting for 35.2%) and females with 3 vehicles (126, making up 27.0%).
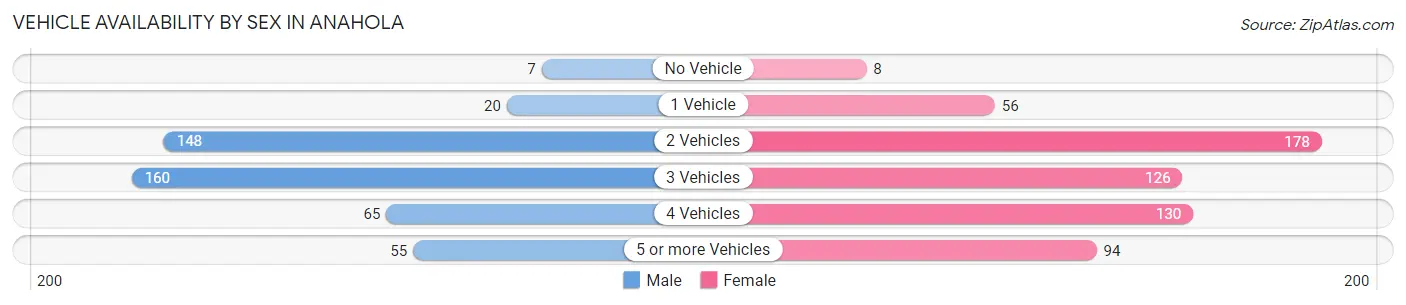
| Vehicles Available | Male | Female |
| No Vehicle | 7 (1.5%) | 8 (1.3%) |
| 1 Vehicle | 20 (4.4%) | 56 (9.5%) |
| 2 Vehicles | 148 (32.5%) | 178 (30.1%) |
| 3 Vehicles | 160 (35.2%) | 126 (21.3%) |
| 4 Vehicles | 65 (14.3%) | 130 (22.0%) |
| 5 or more Vehicles | 55 (12.1%) | 94 (15.9%) |
| Total | 455 (100.0%) | 592 (100.0%) |
Commute Time in Anahola
The most frequently occuring commute durations in Anahola are 30 to 34 minutes (263 commuters, 26.3%), 20 to 24 minutes (178 commuters, 17.8%), and 15 to 19 minutes (121 commuters, 12.1%).
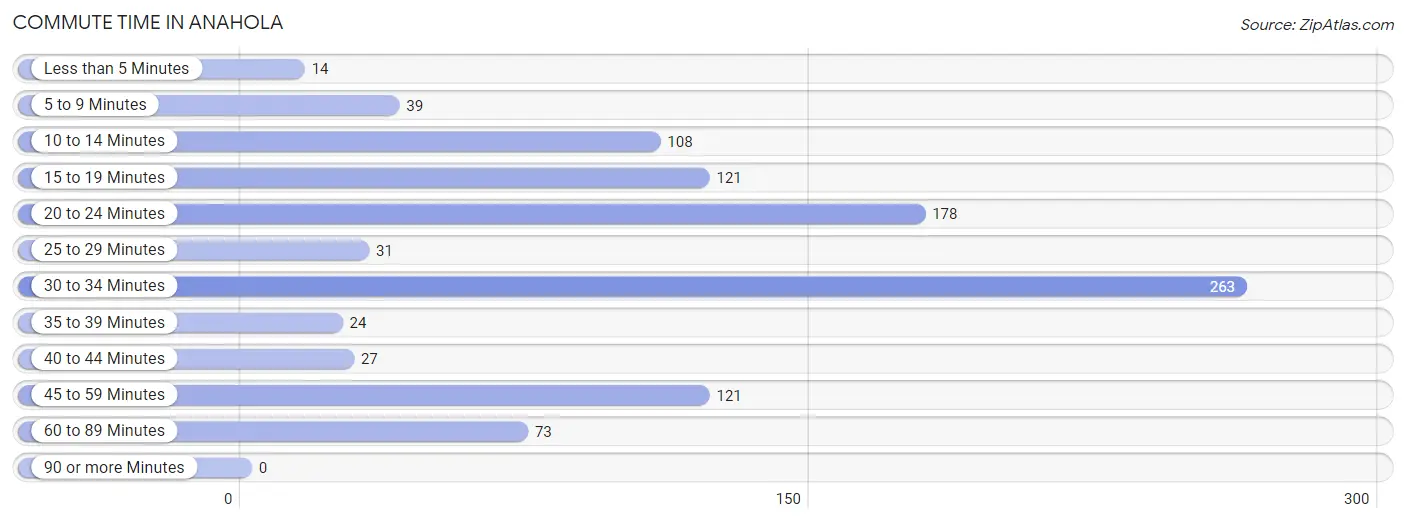
| Commute Time | # Commuters | % Commuters |
| Less than 5 Minutes | 14 | 1.4% |
| 5 to 9 Minutes | 39 | 3.9% |
| 10 to 14 Minutes | 108 | 10.8% |
| 15 to 19 Minutes | 121 | 12.1% |
| 20 to 24 Minutes | 178 | 17.8% |
| 25 to 29 Minutes | 31 | 3.1% |
| 30 to 34 Minutes | 263 | 26.3% |
| 35 to 39 Minutes | 24 | 2.4% |
| 40 to 44 Minutes | 27 | 2.7% |
| 45 to 59 Minutes | 121 | 12.1% |
| 60 to 89 Minutes | 73 | 7.3% |
| 90 or more Minutes | 0 | 0.0% |
Commute Time by Sex in Anahola
The most common commute times in Anahola are 30 to 34 minutes (165 commuters, 36.6%) for males and 20 to 24 minutes (126 commuters, 23.0%) for females.
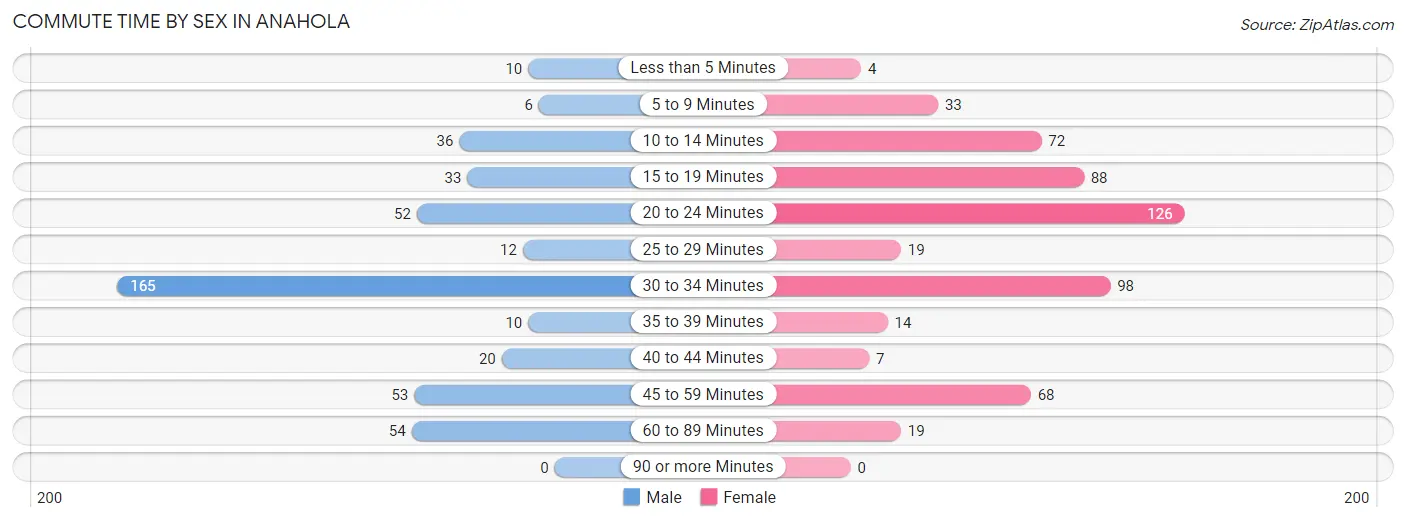
| Commute Time | Male | Female |
| Less than 5 Minutes | 10 (2.2%) | 4 (0.7%) |
| 5 to 9 Minutes | 6 (1.3%) | 33 (6.0%) |
| 10 to 14 Minutes | 36 (8.0%) | 72 (13.1%) |
| 15 to 19 Minutes | 33 (7.3%) | 88 (16.1%) |
| 20 to 24 Minutes | 52 (11.5%) | 126 (23.0%) |
| 25 to 29 Minutes | 12 (2.7%) | 19 (3.5%) |
| 30 to 34 Minutes | 165 (36.6%) | 98 (17.9%) |
| 35 to 39 Minutes | 10 (2.2%) | 14 (2.5%) |
| 40 to 44 Minutes | 20 (4.4%) | 7 (1.3%) |
| 45 to 59 Minutes | 53 (11.7%) | 68 (12.4%) |
| 60 to 89 Minutes | 54 (12.0%) | 19 (3.5%) |
| 90 or more Minutes | 0 (0.0%) | 0 (0.0%) |
Time of Departure to Work by Sex in Anahola
The most frequent times of departure to work in Anahola are 6:00 AM to 6:29 AM (108, 23.9%) for males and 6:30 AM to 6:59 AM (98, 17.9%) for females.
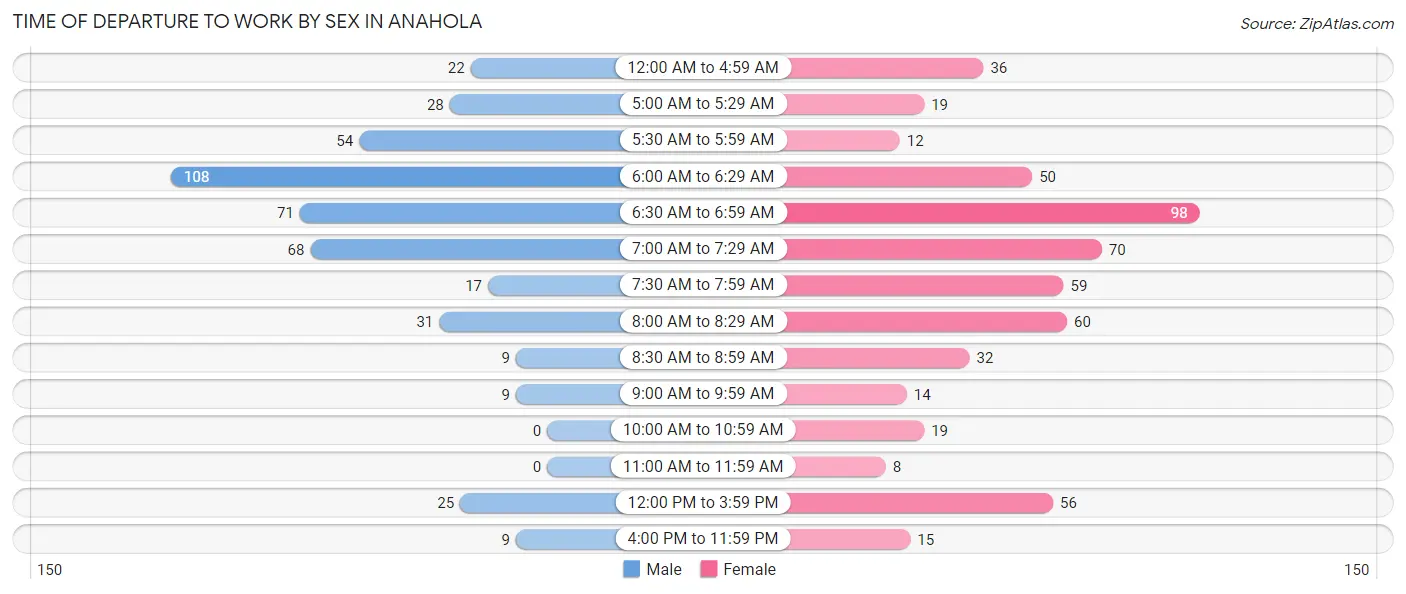
| Time of Departure | Male | Female |
| 12:00 AM to 4:59 AM | 22 (4.9%) | 36 (6.6%) |
| 5:00 AM to 5:29 AM | 28 (6.2%) | 19 (3.5%) |
| 5:30 AM to 5:59 AM | 54 (12.0%) | 12 (2.2%) |
| 6:00 AM to 6:29 AM | 108 (23.9%) | 50 (9.1%) |
| 6:30 AM to 6:59 AM | 71 (15.7%) | 98 (17.9%) |
| 7:00 AM to 7:29 AM | 68 (15.1%) | 70 (12.8%) |
| 7:30 AM to 7:59 AM | 17 (3.8%) | 59 (10.8%) |
| 8:00 AM to 8:29 AM | 31 (6.9%) | 60 (11.0%) |
| 8:30 AM to 8:59 AM | 9 (2.0%) | 32 (5.8%) |
| 9:00 AM to 9:59 AM | 9 (2.0%) | 14 (2.5%) |
| 10:00 AM to 10:59 AM | 0 (0.0%) | 19 (3.5%) |
| 11:00 AM to 11:59 AM | 0 (0.0%) | 8 (1.5%) |
| 12:00 PM to 3:59 PM | 25 (5.5%) | 56 (10.2%) |
| 4:00 PM to 11:59 PM | 9 (2.0%) | 15 (2.7%) |
| Total | 451 (100.0%) | 548 (100.0%) |
Housing Occupancy in Anahola
Occupancy by Ownership in Anahola
Of the total 772 dwellings in Anahola, owner-occupied units account for 660 (85.5%), while renter-occupied units make up 112 (14.5%).
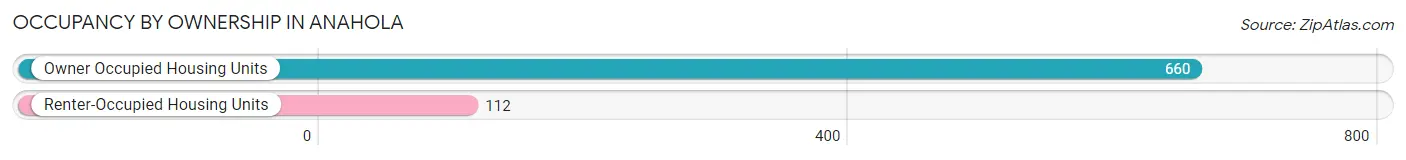
| Occupancy | # Housing Units | % Housing Units |
| Owner Occupied Housing Units | 660 | 85.5% |
| Renter-Occupied Housing Units | 112 | 14.5% |
| Total Occupied Housing Units | 772 | 100.0% |
Occupancy by Household Size in Anahola
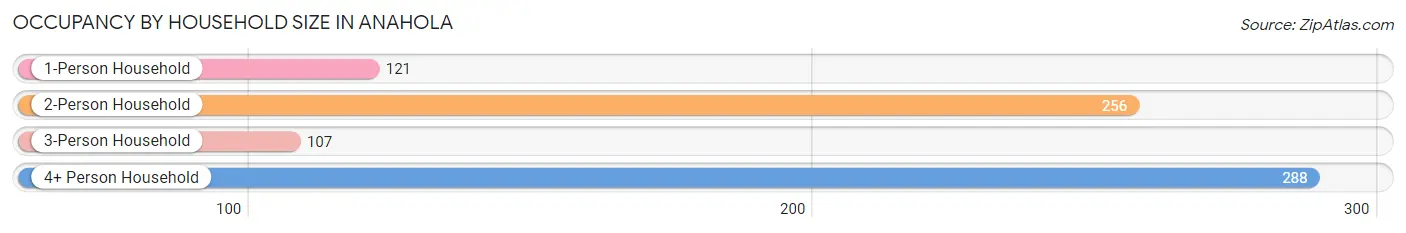
| Household Size | # Housing Units | % Housing Units |
| 1-Person Household | 121 | 15.7% |
| 2-Person Household | 256 | 33.2% |
| 3-Person Household | 107 | 13.9% |
| 4+ Person Household | 288 | 37.3% |
| Total Housing Units | 772 | 100.0% |
Occupancy by Ownership by Household Size in Anahola
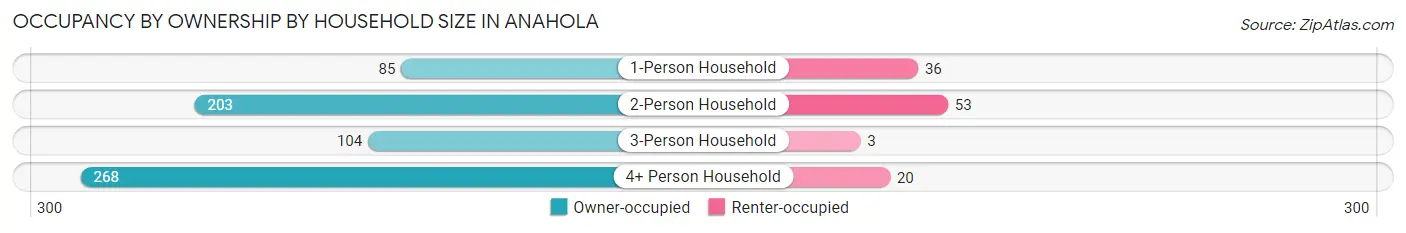
| Household Size | Owner-occupied | Renter-occupied |
| 1-Person Household | 85 (70.3%) | 36 (29.7%) |
| 2-Person Household | 203 (79.3%) | 53 (20.7%) |
| 3-Person Household | 104 (97.2%) | 3 (2.8%) |
| 4+ Person Household | 268 (93.1%) | 20 (6.9%) |
| Total Housing Units | 660 (85.5%) | 112 (14.5%) |
Occupancy by Educational Attainment in Anahola
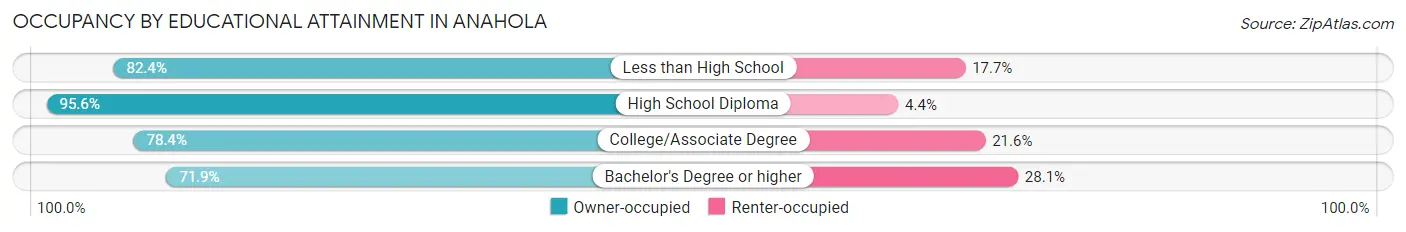
| Household Size | Owner-occupied | Renter-occupied |
| Less than High School | 70 (82.4%) | 15 (17.6%) |
| High School Diploma | 329 (95.6%) | 15 (4.4%) |
| College/Associate Degree | 174 (78.4%) | 48 (21.6%) |
| Bachelor's Degree or higher | 87 (71.9%) | 34 (28.1%) |
Occupancy by Age of Householder in Anahola
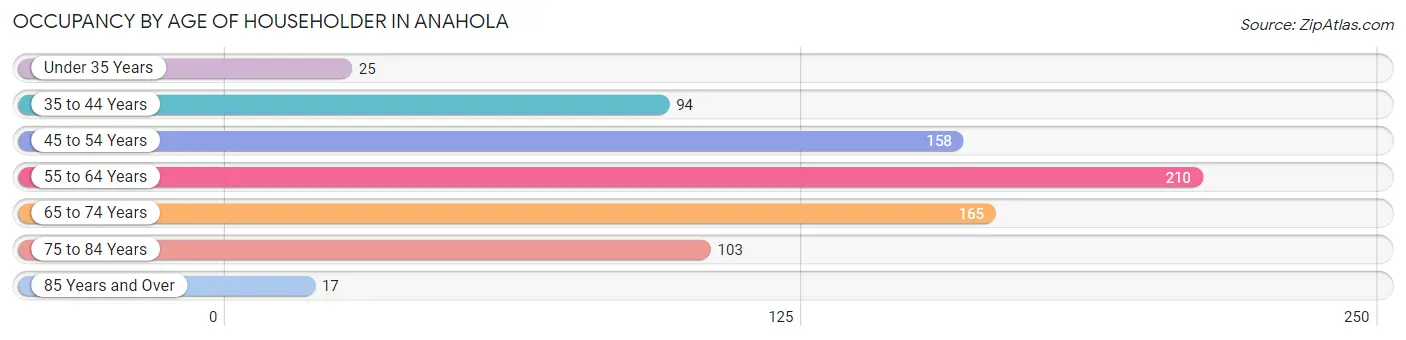
| Age Bracket | # Households | % Households |
| Under 35 Years | 25 | 3.2% |
| 35 to 44 Years | 94 | 12.2% |
| 45 to 54 Years | 158 | 20.5% |
| 55 to 64 Years | 210 | 27.2% |
| 65 to 74 Years | 165 | 21.4% |
| 75 to 84 Years | 103 | 13.3% |
| 85 Years and Over | 17 | 2.2% |
| Total | 772 | 100.0% |
Housing Finances in Anahola
Median Income by Occupancy in Anahola
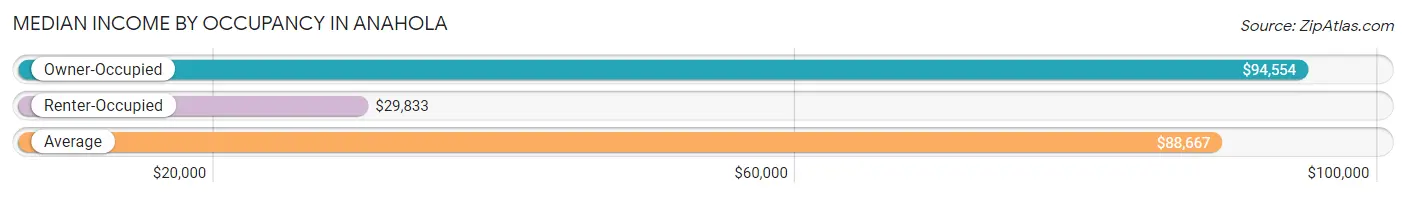
| Occupancy Type | # Households | Median Income |
| Owner-Occupied | 660 (85.5%) | $94,554 |
| Renter-Occupied | 112 (14.5%) | $29,833 |
| Average | 772 (100.0%) | $88,667 |
Occupancy by Householder Income Bracket in Anahola
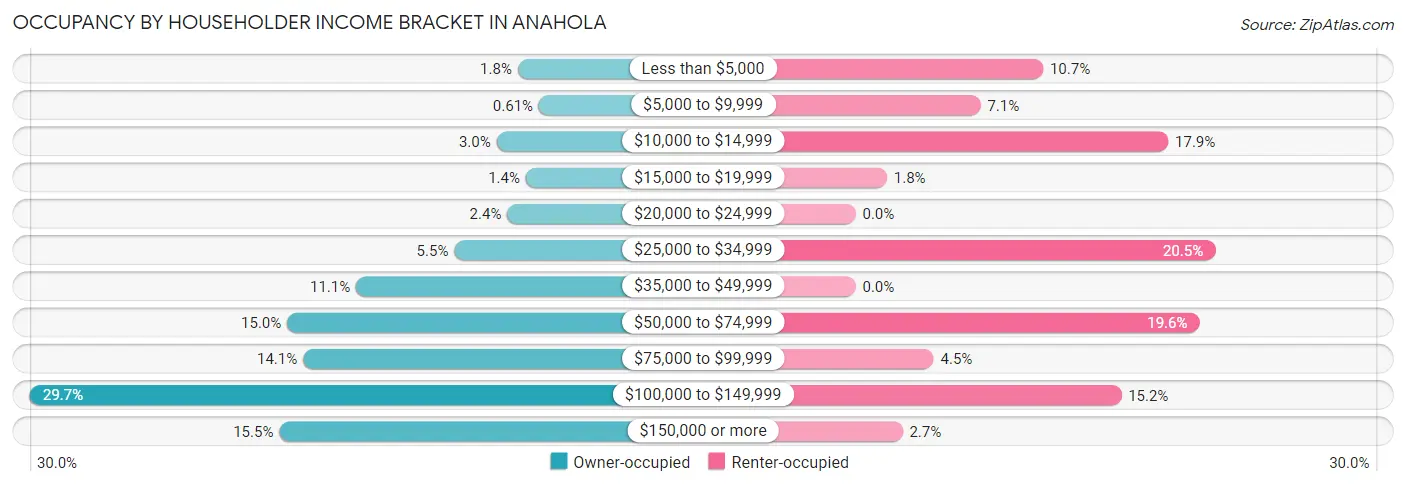
| Income Bracket | Owner-occupied | Renter-occupied |
| Less than $5,000 | 12 (1.8%) | 12 (10.7%) |
| $5,000 to $9,999 | 4 (0.6%) | 8 (7.1%) |
| $10,000 to $14,999 | 20 (3.0%) | 20 (17.9%) |
| $15,000 to $19,999 | 9 (1.4%) | 2 (1.8%) |
| $20,000 to $24,999 | 16 (2.4%) | 0 (0.0%) |
| $25,000 to $34,999 | 36 (5.4%) | 23 (20.5%) |
| $35,000 to $49,999 | 73 (11.1%) | 0 (0.0%) |
| $50,000 to $74,999 | 99 (15.0%) | 22 (19.6%) |
| $75,000 to $99,999 | 93 (14.1%) | 5 (4.5%) |
| $100,000 to $149,999 | 196 (29.7%) | 17 (15.2%) |
| $150,000 or more | 102 (15.4%) | 3 (2.7%) |
| Total | 660 (100.0%) | 112 (100.0%) |
Monthly Housing Cost Tiers in Anahola
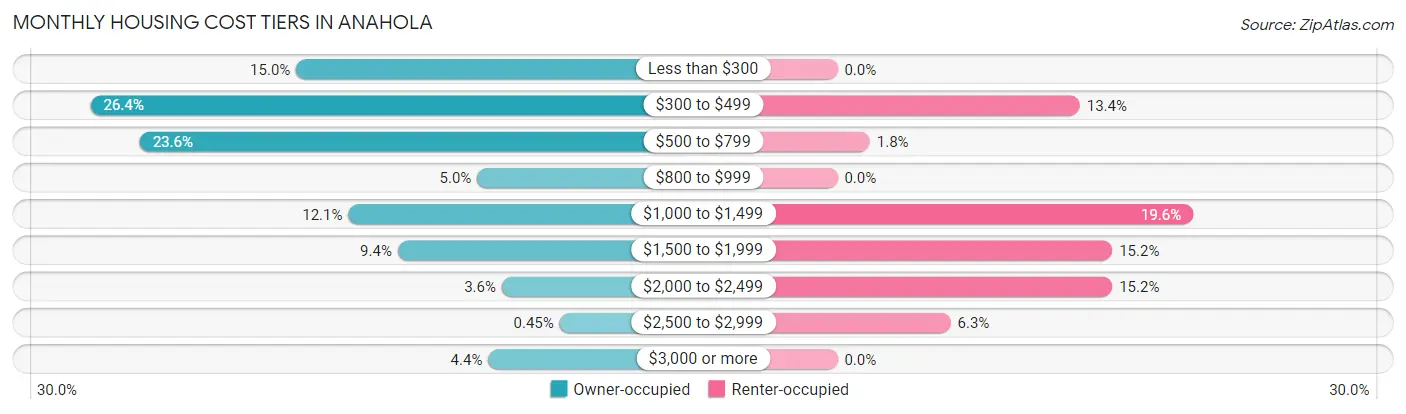
| Monthly Cost | Owner-occupied | Renter-occupied |
| Less than $300 | 99 (15.0%) | 0 (0.0%) |
| $300 to $499 | 174 (26.4%) | 15 (13.4%) |
| $500 to $799 | 156 (23.6%) | 2 (1.8%) |
| $800 to $999 | 33 (5.0%) | 0 (0.0%) |
| $1,000 to $1,499 | 80 (12.1%) | 22 (19.6%) |
| $1,500 to $1,999 | 62 (9.4%) | 17 (15.2%) |
| $2,000 to $2,499 | 24 (3.6%) | 17 (15.2%) |
| $2,500 to $2,999 | 3 (0.4%) | 7 (6.2%) |
| $3,000 or more | 29 (4.4%) | 0 (0.0%) |
| Total | 660 (100.0%) | 112 (100.0%) |
Physical Housing Characteristics in Anahola
Housing Structures in Anahola
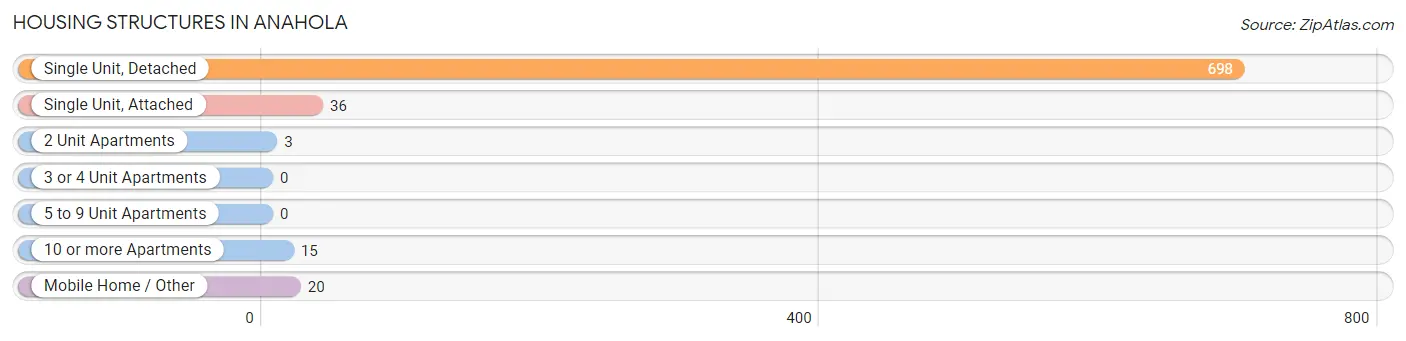
| Structure Type | # Housing Units | % Housing Units |
| Single Unit, Detached | 698 | 90.4% |
| Single Unit, Attached | 36 | 4.7% |
| 2 Unit Apartments | 3 | 0.4% |
| 3 or 4 Unit Apartments | 0 | 0.0% |
| 5 to 9 Unit Apartments | 0 | 0.0% |
| 10 or more Apartments | 15 | 1.9% |
| Mobile Home / Other | 20 | 2.6% |
| Total | 772 | 100.0% |
Housing Structures by Occupancy in Anahola
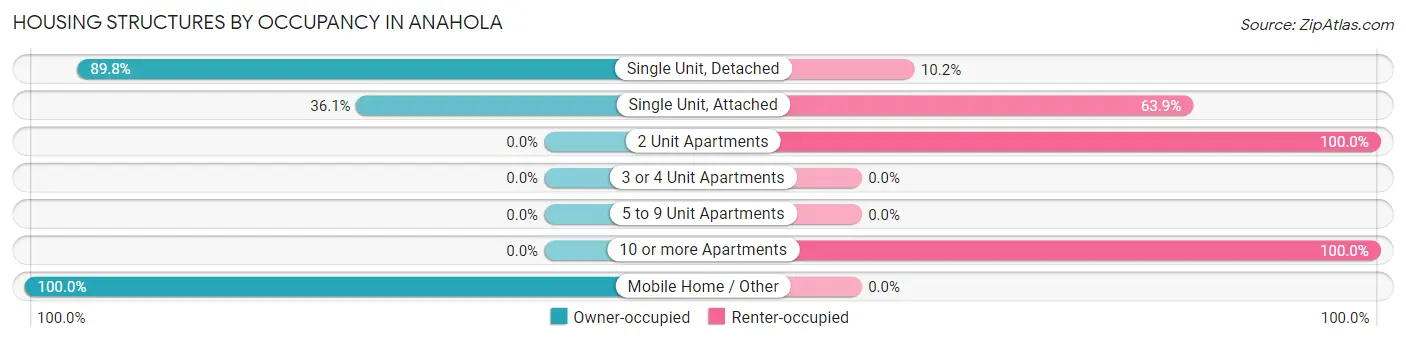
| Structure Type | Owner-occupied | Renter-occupied |
| Single Unit, Detached | 627 (89.8%) | 71 (10.2%) |
| Single Unit, Attached | 13 (36.1%) | 23 (63.9%) |
| 2 Unit Apartments | 0 (0.0%) | 3 (100.0%) |
| 3 or 4 Unit Apartments | 0 (0.0%) | 0 (0.0%) |
| 5 to 9 Unit Apartments | 0 (0.0%) | 0 (0.0%) |
| 10 or more Apartments | 0 (0.0%) | 15 (100.0%) |
| Mobile Home / Other | 20 (100.0%) | 0 (0.0%) |
| Total | 660 (85.5%) | 112 (14.5%) |
Housing Structures by Number of Rooms in Anahola
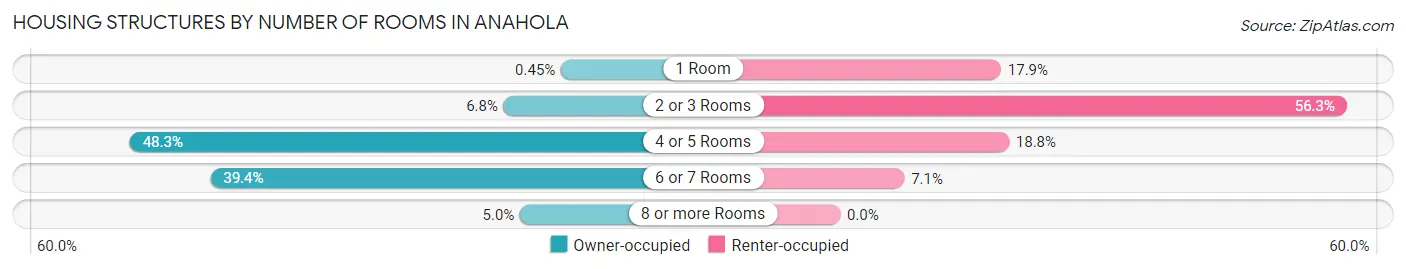
| Number of Rooms | Owner-occupied | Renter-occupied |
| 1 Room | 3 (0.4%) | 20 (17.9%) |
| 2 or 3 Rooms | 45 (6.8%) | 63 (56.2%) |
| 4 or 5 Rooms | 319 (48.3%) | 21 (18.8%) |
| 6 or 7 Rooms | 260 (39.4%) | 8 (7.1%) |
| 8 or more Rooms | 33 (5.0%) | 0 (0.0%) |
| Total | 660 (100.0%) | 112 (100.0%) |
Housing Structure by Heating Type in Anahola
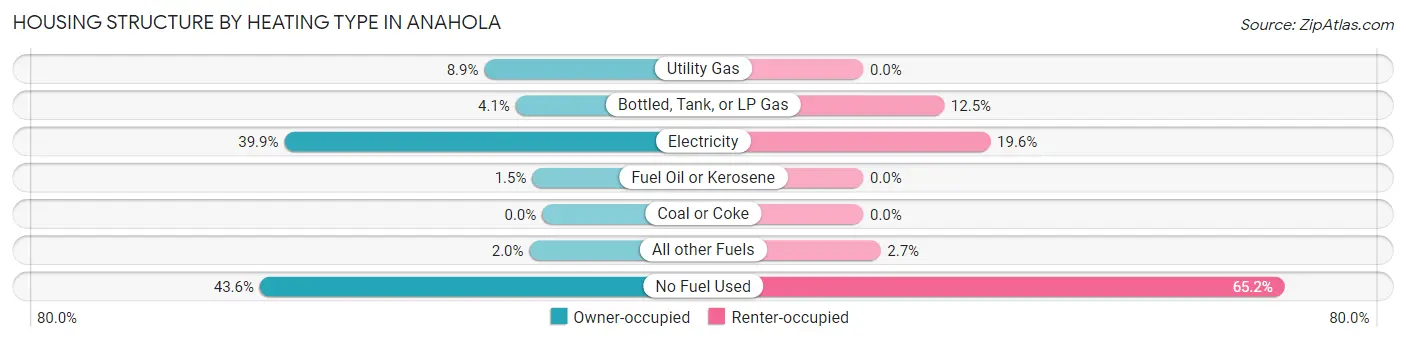
| Heating Type | Owner-occupied | Renter-occupied |
| Utility Gas | 59 (8.9%) | 0 (0.0%) |
| Bottled, Tank, or LP Gas | 27 (4.1%) | 14 (12.5%) |
| Electricity | 263 (39.9%) | 22 (19.6%) |
| Fuel Oil or Kerosene | 10 (1.5%) | 0 (0.0%) |
| Coal or Coke | 0 (0.0%) | 0 (0.0%) |
| All other Fuels | 13 (2.0%) | 3 (2.7%) |
| No Fuel Used | 288 (43.6%) | 73 (65.2%) |
| Total | 660 (100.0%) | 112 (100.0%) |
Household Vehicle Usage in Anahola
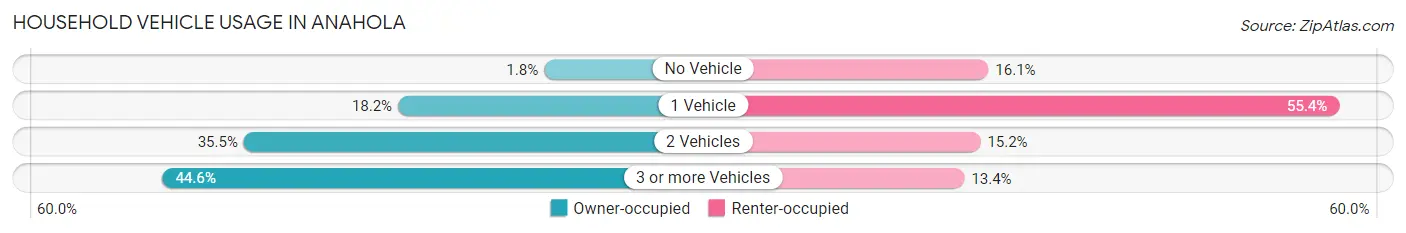
| Vehicles per Household | Owner-occupied | Renter-occupied |
| No Vehicle | 12 (1.8%) | 18 (16.1%) |
| 1 Vehicle | 120 (18.2%) | 62 (55.4%) |
| 2 Vehicles | 234 (35.4%) | 17 (15.2%) |
| 3 or more Vehicles | 294 (44.6%) | 15 (13.4%) |
| Total | 660 (100.0%) | 112 (100.0%) |
Real Estate & Mortgages in Anahola
Real Estate and Mortgage Overview in Anahola
| Characteristic | Without Mortgage | With Mortgage |
| Housing Units | 423 | 237 |
| Median Property Value | $503,400 | $493,600 |
| Median Household Income | $96,375 | $44 |
| Monthly Housing Costs | $428 | $29 |
| Real Estate Taxes | $544 | $102 |
Property Value by Mortgage Status in Anahola
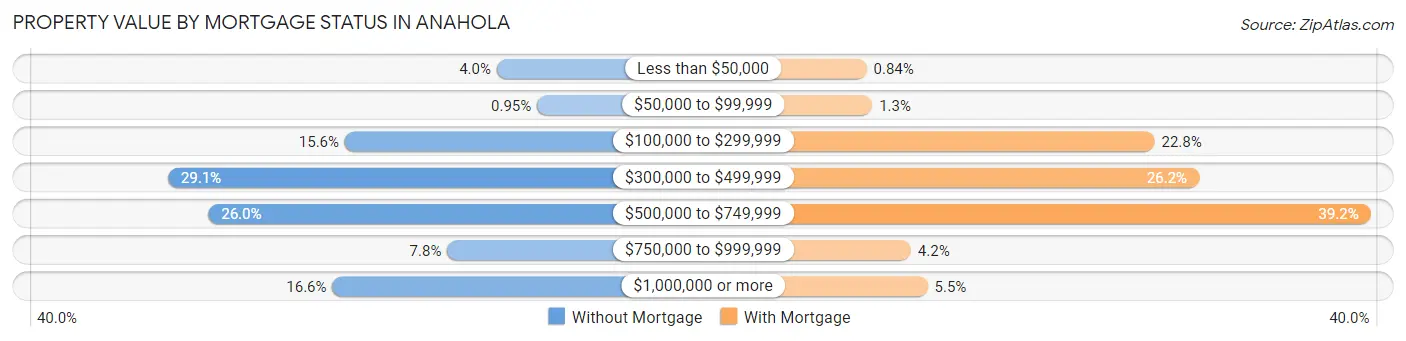
| Property Value | Without Mortgage | With Mortgage |
| Less than $50,000 | 17 (4.0%) | 2 (0.8%) |
| $50,000 to $99,999 | 4 (0.9%) | 3 (1.3%) |
| $100,000 to $299,999 | 66 (15.6%) | 54 (22.8%) |
| $300,000 to $499,999 | 123 (29.1%) | 62 (26.2%) |
| $500,000 to $749,999 | 110 (26.0%) | 93 (39.2%) |
| $750,000 to $999,999 | 33 (7.8%) | 10 (4.2%) |
| $1,000,000 or more | 70 (16.6%) | 13 (5.5%) |
| Total | 423 (100.0%) | 237 (100.0%) |
Household Income by Mortgage Status in Anahola
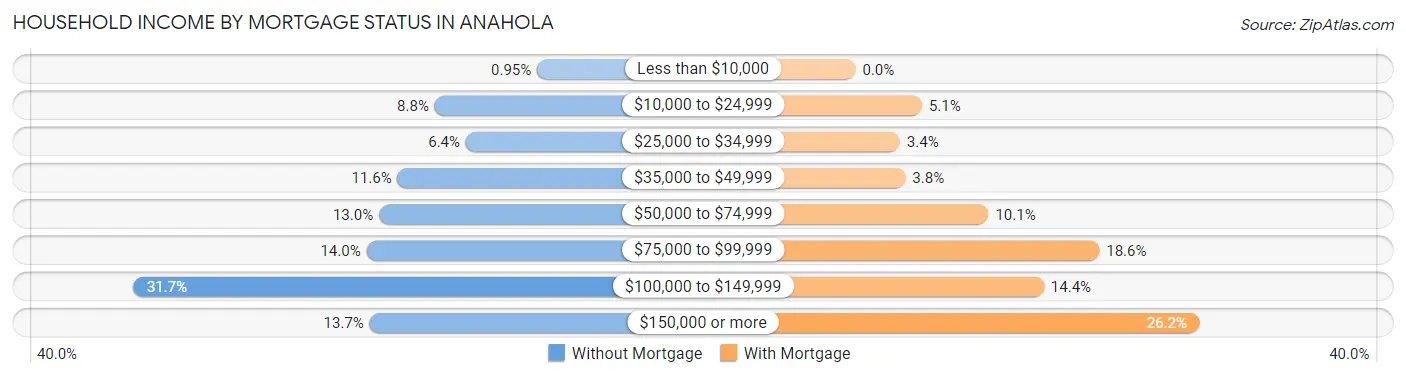
| Household Income | Without Mortgage | With Mortgage |
| Less than $10,000 | 4 (0.9%) | 0 (0.0%) |
| $10,000 to $24,999 | 37 (8.7%) | 12 (5.1%) |
| $25,000 to $34,999 | 27 (6.4%) | 8 (3.4%) |
| $35,000 to $49,999 | 49 (11.6%) | 9 (3.8%) |
| $50,000 to $74,999 | 55 (13.0%) | 24 (10.1%) |
| $75,000 to $99,999 | 59 (14.0%) | 44 (18.6%) |
| $100,000 to $149,999 | 134 (31.7%) | 34 (14.3%) |
| $150,000 or more | 58 (13.7%) | 62 (26.2%) |
| Total | 423 (100.0%) | 237 (100.0%) |
Property Value to Household Income Ratio in Anahola
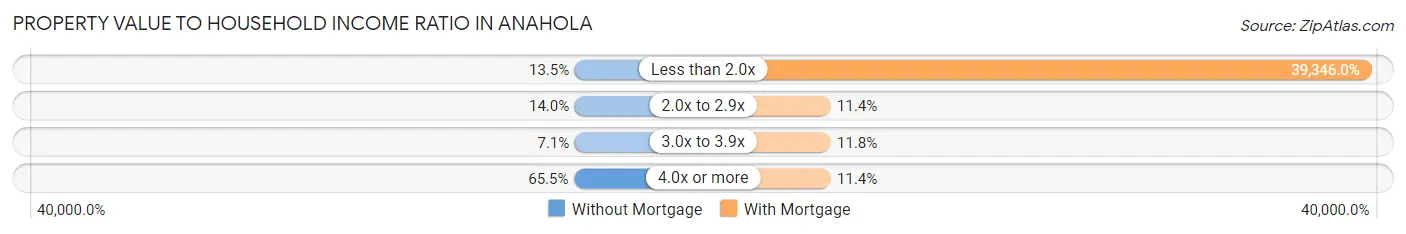
| Value-to-Income Ratio | Without Mortgage | With Mortgage |
| Less than 2.0x | 57 (13.5%) | 93,250 (39,346.0%) |
| 2.0x to 2.9x | 59 (14.0%) | 27 (11.4%) |
| 3.0x to 3.9x | 30 (7.1%) | 28 (11.8%) |
| 4.0x or more | 277 (65.5%) | 27 (11.4%) |
| Total | 423 (100.0%) | 237 (100.0%) |
Real Estate Taxes by Mortgage Status in Anahola
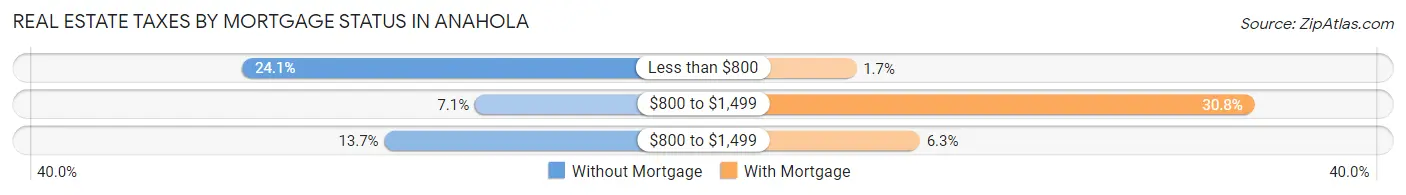
| Property Taxes | Without Mortgage | With Mortgage |
| Less than $800 | 102 (24.1%) | 4 (1.7%) |
| $800 to $1,499 | 30 (7.1%) | 73 (30.8%) |
| $800 to $1,499 | 58 (13.7%) | 15 (6.3%) |
| Total | 423 (100.0%) | 237 (100.0%) |
Health & Disability in Anahola
Health Insurance Coverage by Age in Anahola
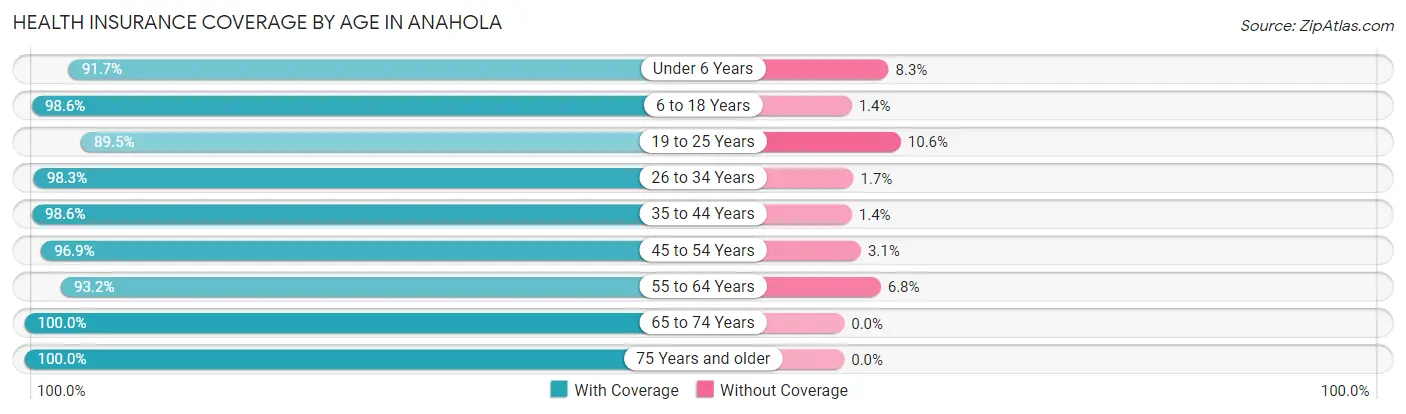
| Age Bracket | With Coverage | Without Coverage |
| Under 6 Years | 211 (91.7%) | 19 (8.3%) |
| 6 to 18 Years | 501 (98.6%) | 7 (1.4%) |
| 19 to 25 Years | 195 (89.4%) | 23 (10.5%) |
| 26 to 34 Years | 229 (98.3%) | 4 (1.7%) |
| 35 to 44 Years | 349 (98.6%) | 5 (1.4%) |
| 45 to 54 Years | 249 (96.9%) | 8 (3.1%) |
| 55 to 64 Years | 411 (93.2%) | 30 (6.8%) |
| 65 to 74 Years | 339 (100.0%) | 0 (0.0%) |
| 75 Years and older | 273 (100.0%) | 0 (0.0%) |
| Total | 2,757 (96.6%) | 96 (3.4%) |
Health Insurance Coverage by Citizenship Status in Anahola
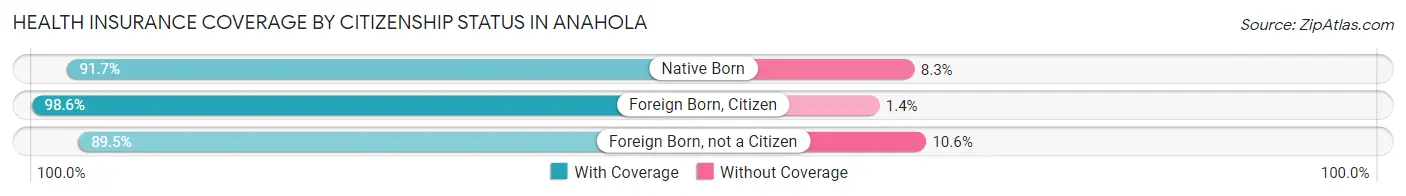
| Citizenship Status | With Coverage | Without Coverage |
| Native Born | 211 (91.7%) | 19 (8.3%) |
| Foreign Born, Citizen | 501 (98.6%) | 7 (1.4%) |
| Foreign Born, not a Citizen | 195 (89.4%) | 23 (10.5%) |
Health Insurance Coverage by Household Income in Anahola
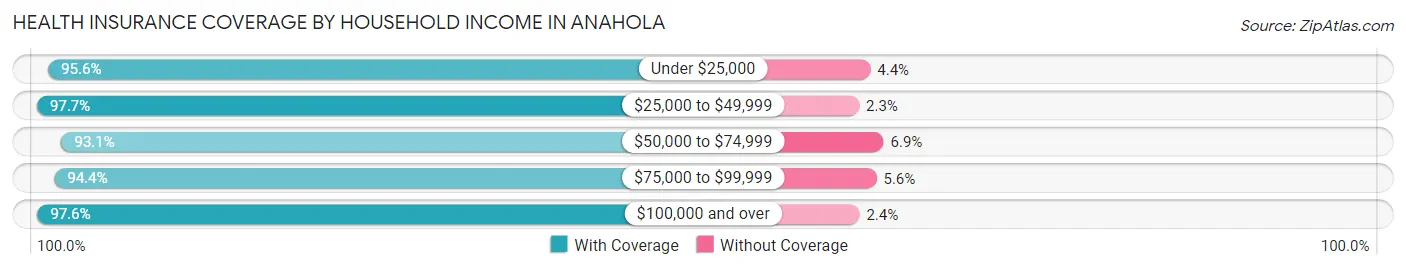
| Household Income | With Coverage | Without Coverage |
| Under $25,000 | 173 (95.6%) | 8 (4.4%) |
| $25,000 to $49,999 | 382 (97.7%) | 9 (2.3%) |
| $50,000 to $74,999 | 311 (93.1%) | 23 (6.9%) |
| $75,000 to $99,999 | 288 (94.4%) | 17 (5.6%) |
| $100,000 and over | 1,603 (97.6%) | 39 (2.4%) |
Public vs Private Health Insurance Coverage by Age in Anahola
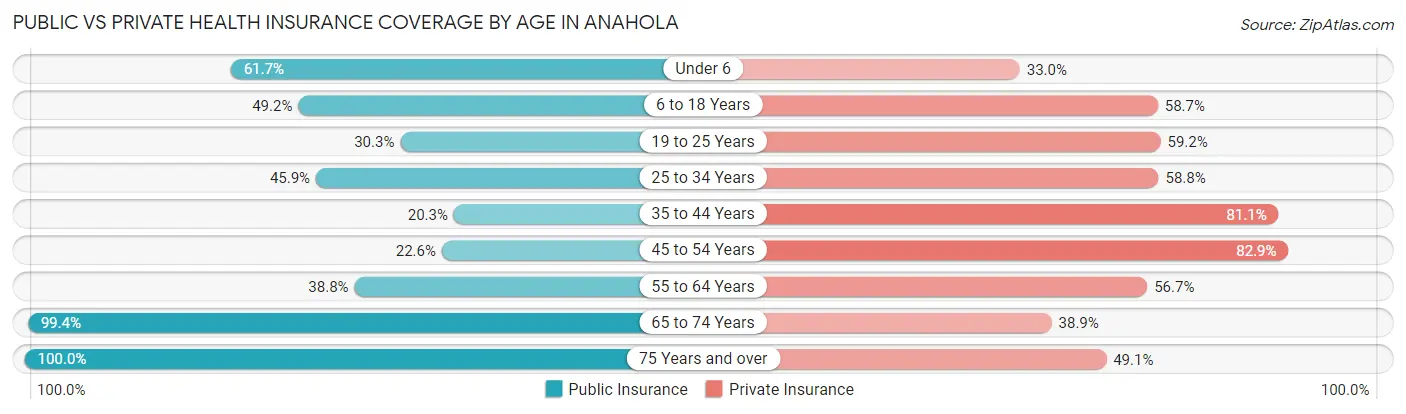
| Age Bracket | Public Insurance | Private Insurance |
| Under 6 | 142 (61.7%) | 76 (33.0%) |
| 6 to 18 Years | 250 (49.2%) | 298 (58.7%) |
| 19 to 25 Years | 66 (30.3%) | 129 (59.2%) |
| 25 to 34 Years | 107 (45.9%) | 137 (58.8%) |
| 35 to 44 Years | 72 (20.3%) | 287 (81.1%) |
| 45 to 54 Years | 58 (22.6%) | 213 (82.9%) |
| 55 to 64 Years | 171 (38.8%) | 250 (56.7%) |
| 65 to 74 Years | 337 (99.4%) | 132 (38.9%) |
| 75 Years and over | 273 (100.0%) | 134 (49.1%) |
| Total | 1,476 (51.7%) | 1,656 (58.0%) |
Disability Status by Sex by Age in Anahola
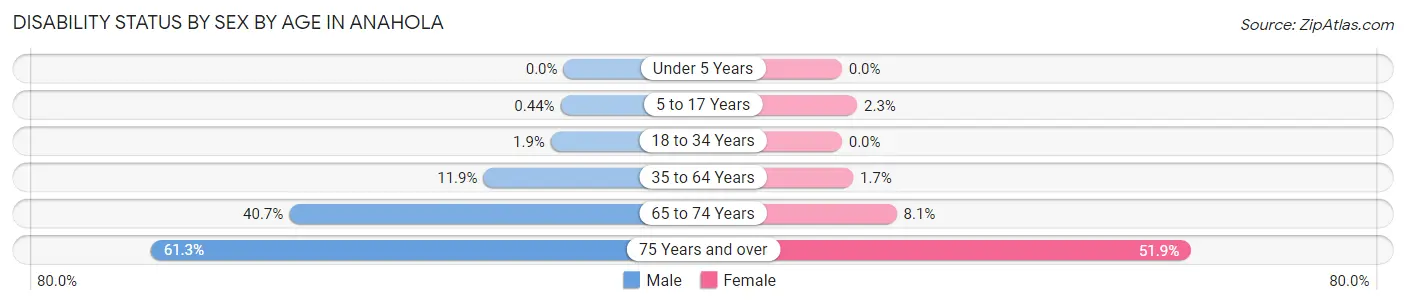
| Age Bracket | Male | Female |
| Under 5 Years | 0 (0.0%) | 0 (0.0%) |
| 5 to 17 Years | 1 (0.4%) | 6 (2.3%) |
| 18 to 34 Years | 4 (1.9%) | 0 (0.0%) |
| 35 to 64 Years | 61 (11.9%) | 9 (1.7%) |
| 65 to 74 Years | 68 (40.7%) | 14 (8.1%) |
| 75 Years and over | 68 (61.3%) | 84 (51.8%) |
Disability Class by Sex by Age in Anahola
Disability Class: Hearing Difficulty
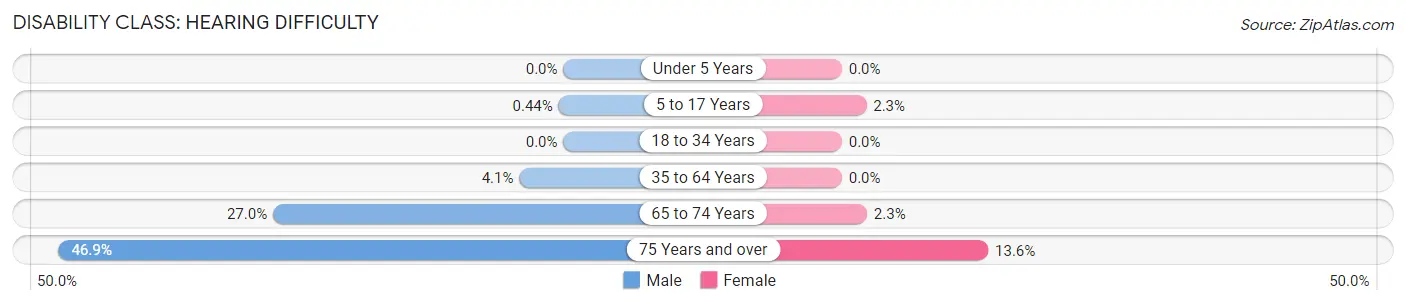
| Age Bracket | Male | Female |
| Under 5 Years | 0 (0.0%) | 0 (0.0%) |
| 5 to 17 Years | 1 (0.4%) | 6 (2.3%) |
| 18 to 34 Years | 0 (0.0%) | 0 (0.0%) |
| 35 to 64 Years | 21 (4.1%) | 0 (0.0%) |
| 65 to 74 Years | 45 (27.0%) | 4 (2.3%) |
| 75 Years and over | 52 (46.9%) | 22 (13.6%) |
Disability Class: Vision Difficulty
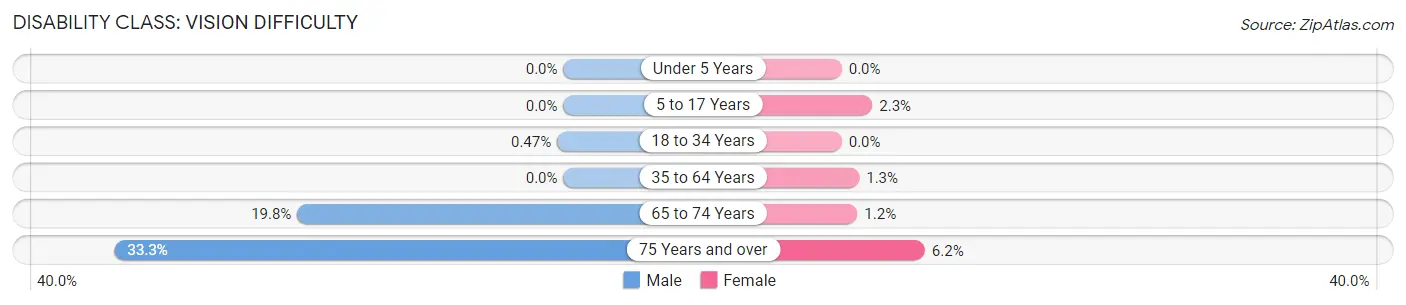
| Age Bracket | Male | Female |
| Under 5 Years | 0 (0.0%) | 0 (0.0%) |
| 5 to 17 Years | 0 (0.0%) | 6 (2.3%) |
| 18 to 34 Years | 1 (0.5%) | 0 (0.0%) |
| 35 to 64 Years | 0 (0.0%) | 7 (1.3%) |
| 65 to 74 Years | 33 (19.8%) | 2 (1.2%) |
| 75 Years and over | 37 (33.3%) | 10 (6.2%) |
Disability Class: Cognitive Difficulty
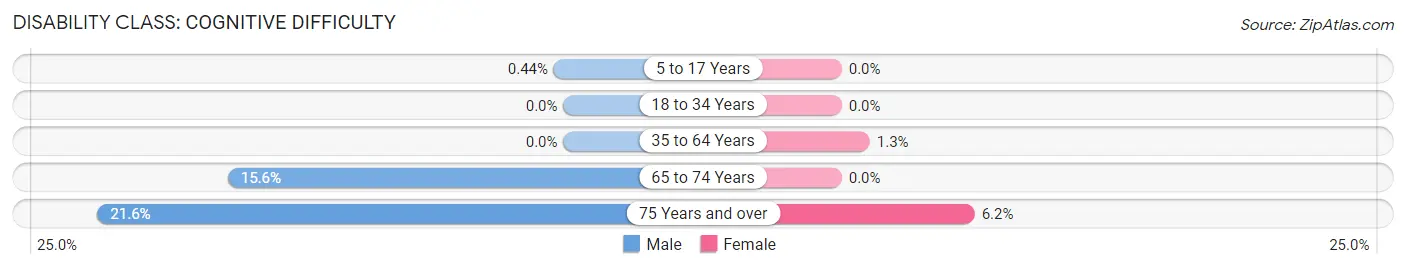
| Age Bracket | Male | Female |
| 5 to 17 Years | 1 (0.4%) | 0 (0.0%) |
| 18 to 34 Years | 0 (0.0%) | 0 (0.0%) |
| 35 to 64 Years | 0 (0.0%) | 7 (1.3%) |
| 65 to 74 Years | 26 (15.6%) | 0 (0.0%) |
| 75 Years and over | 24 (21.6%) | 10 (6.2%) |
Disability Class: Ambulatory Difficulty
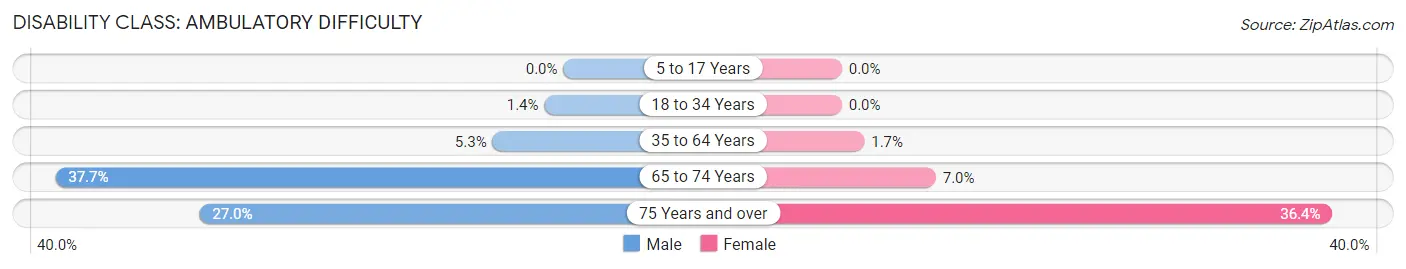
| Age Bracket | Male | Female |
| 5 to 17 Years | 0 (0.0%) | 0 (0.0%) |
| 18 to 34 Years | 3 (1.4%) | 0 (0.0%) |
| 35 to 64 Years | 27 (5.3%) | 9 (1.7%) |
| 65 to 74 Years | 63 (37.7%) | 12 (7.0%) |
| 75 Years and over | 30 (27.0%) | 59 (36.4%) |
Disability Class: Self-Care Difficulty
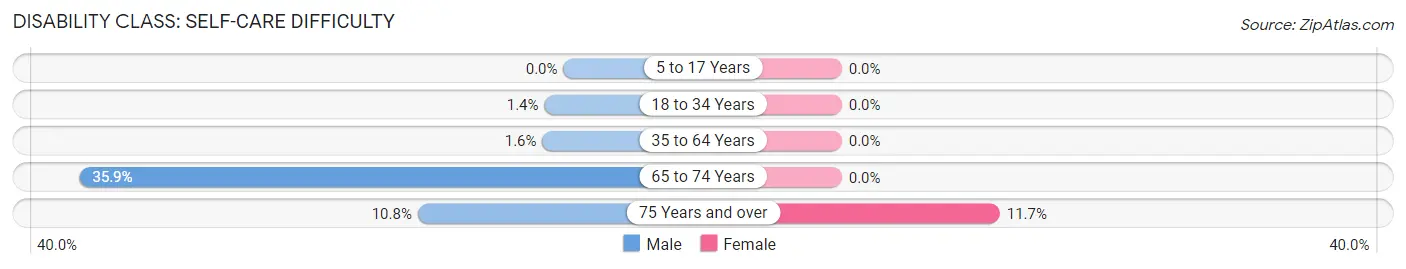
| Age Bracket | Male | Female |
| 5 to 17 Years | 0 (0.0%) | 0 (0.0%) |
| 18 to 34 Years | 3 (1.4%) | 0 (0.0%) |
| 35 to 64 Years | 8 (1.6%) | 0 (0.0%) |
| 65 to 74 Years | 60 (35.9%) | 0 (0.0%) |
| 75 Years and over | 12 (10.8%) | 19 (11.7%) |
Technology Access in Anahola
Computing Device Access in Anahola
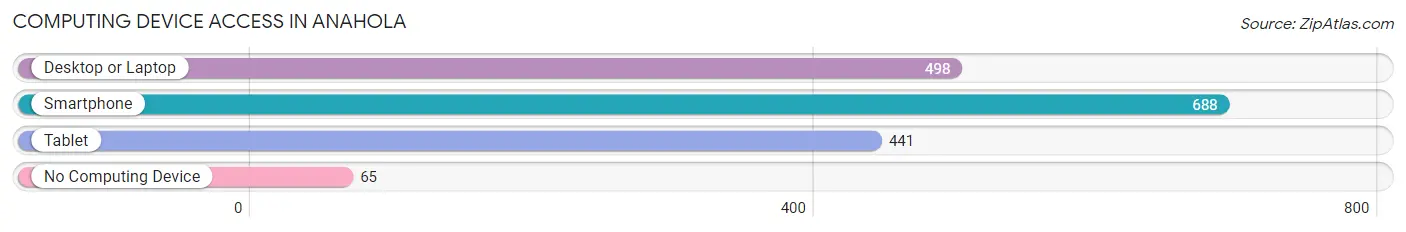
| Device Type | # Households | % Households |
| Desktop or Laptop | 498 | 64.5% |
| Smartphone | 688 | 89.1% |
| Tablet | 441 | 57.1% |
| No Computing Device | 65 | 8.4% |
| Total | 772 | 100.0% |
Internet Access in Anahola
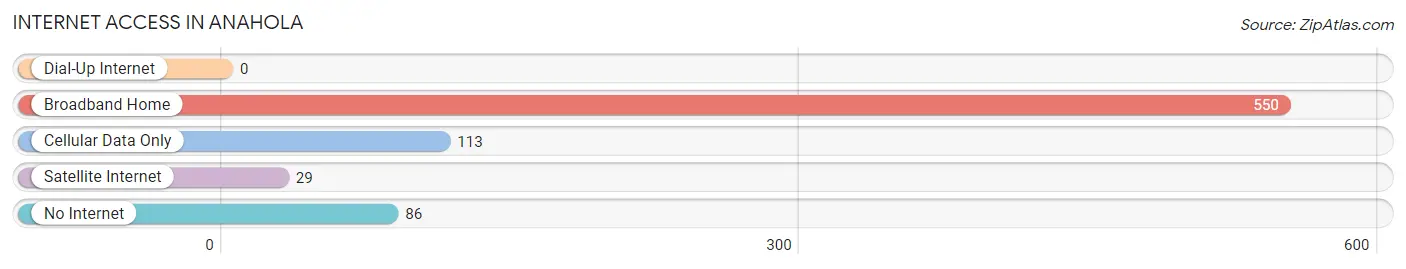
| Internet Type | # Households | % Households |
| Dial-Up Internet | 0 | 0.0% |
| Broadband Home | 550 | 71.2% |
| Cellular Data Only | 113 | 14.6% |
| Satellite Internet | 29 | 3.8% |
| No Internet | 86 | 11.1% |
| Total | 772 | 100.0% |
Anahola Summary
Anahola is a small unincorporated community located on the east side of the island of Kauai in the state of Hawaii. It is located in the district of Kalalea, which is part of the larger Kauai County. The population of Anahola was 1,845 as of the 2010 census.
History
Anahola was originally settled by Native Hawaiians in the late 1700s. The area was used for fishing and farming, and the residents lived in small villages along the coast. In the early 1800s, the area was used for sugarcane plantations, and the population of Anahola grew. In the late 1800s, the area was used for cattle ranching, and the population of Anahola continued to grow.
In the early 1900s, the area was used for pineapple plantations, and the population of Anahola continued to grow. In the mid-1900s, the area was used for tourism, and the population of Anahola continued to grow.
Geography
Anahola is located on the east side of the island of Kauai in the state of Hawaii. It is located in the district of Kalalea, which is part of the larger Kauai County. The area is bordered by the Pacific Ocean to the east, the Wailua River to the north, and the Kealia River to the south. The area is mostly flat, with some hills in the northern part of the area.
The climate in Anahola is tropical, with temperatures ranging from the mid-70s to the mid-80s throughout the year. The area receives an average of about 20 inches of rain per year.
Economy
The economy of Anahola is largely based on tourism and agriculture. The area is home to several resorts and hotels, as well as a number of small businesses. The area is also home to several farms, which produce a variety of fruits and vegetables.
Demographics
As of the 2010 census, the population of Anahola was 1,845. The population is mostly Native Hawaiian, with a small percentage of other ethnicities. The median age in Anahola is 44.5, and the median household income is $50,000.
Conclusion
Anahola is a small unincorporated community located on the east side of the island of Kauai in the state of Hawaii. It is located in the district of Kalalea, which is part of the larger Kauai County. The population of Anahola was 1,845 as of the 2010 census. The economy of Anahola is largely based on tourism and agriculture, and the population is mostly Native Hawaiian, with a small percentage of other ethnicities. The median age in Anahola is 44.5, and the median household income is $50,000.
Common Questions
What is Per Capita Income in Anahola?
Per Capita income in Anahola is $27,411.
What is the Median Family Income in Anahola?
Median Family Income in Anahola is $94,097.
What is the Median Household income in Anahola?
Median Household Income in Anahola is $88,667.
What is Income or Wage Gap in Anahola?
Income or Wage Gap in Anahola is 30.4%.
Women in Anahola earn 69.6 cents for every dollar earned by a man.
What is Inequality or Gini Index in Anahola?
Inequality or Gini Index in Anahola is 0.38.
What is the Total Population of Anahola?
Total Population of Anahola is 2,853.
What is the Total Male Population of Anahola?
Total Male Population of Anahola is 1,332.
What is the Total Female Population of Anahola?
Total Female Population of Anahola is 1,521.
What is the Ratio of Males per 100 Females in Anahola?
There are 87.57 Males per 100 Females in Anahola.
What is the Ratio of Females per 100 Males in Anahola?
There are 114.19 Females per 100 Males in Anahola.
What is the Median Population Age in Anahola?
Median Population Age in Anahola is 40.9 Years.
What is the Average Family Size in Anahola
Average Family Size in Anahola is 4.1 People.
What is the Average Household Size in Anahola
Average Household Size in Anahola is 3.7 People.
How Large is the Labor Force in Anahola?
There are 1,185 People in the Labor Forcein in Anahola.
What is the Percentage of People in the Labor Force in Anahola?
53.3% of People are in the Labor Force in Anahola.
What is the Unemployment Rate in Anahola?
Unemployment Rate in Anahola is 6.2%.